1. Introduction
Biomedical spectroscopy is increasingly investigated as a source of diagnostic and biologically informative data because it can capture molecular and biochemical variation that is not always evident through conventional visual inspection. Raman spectroscopy, surface-enhanced Raman spectroscopy (SERS), and infrared spectroscopy generate vibrational fingerprints related to the molecular composition of cells, tissues, biofluids, and other biological samples. These methods have therefore been explored in cancer detection, tissue characterization, microbial analysis, and non-invasive or minimally invasive diagnostic workflows [
1,
2].
The growing availability of spectral data has been accompanied by the broader adoption of machine learning and deep learning methods. Classical chemometric approaches, including principal component analysis, partial least-squares methods, support vector machines, and random forests, remain widely used for spectral classification and regression. More recently, one-dimensional convolutional neural networks, deep-learning architectures, and related artificial intelligence approaches have been applied to Raman and SERS data to identify complex, nonlinear, and distributed spectral patterns [
3,
4,
5]. Such strategies have shown potential across biomedical applications, including the rapid identification of pathogenic bacteria and antibiotic-resistance-related phenotypes from Raman spectra [
6].
However, high predictive performance alone does not establish that a model relies on biologically meaningful or clinically reproducible spectral evidence. Diagnostic models may exploit technical variation related to sample preparation, instrumental conditions, background signals, or preprocessing choices rather than disease-associated biochemical patterns. This issue is particularly important in biomedical spectroscopy, where the objective is often not limited to classification accuracy but extends to the identification of molecular signatures, candidate biomarkers, or biologically interpretable spectral regions.
Explainable artificial intelligence (XAI) has emerged as a potential bridge between black-box spectral prediction and interpretable analysis. Among the most widely used post hoc methods are SHapley Additive exPlanations (SHAP) and Local Interpretable Model-Agnostic Explanations (LIME). SHAP estimates the contribution of input features to an individual prediction through a Shapley-value-based framework, whereas LIME approximates local model behaviour using an interpretable surrogate model [
7,
8]. When applied to spectral data, these approaches can rank influential Raman shifts, wavelengths, spectral bands, or signal regions associated with classification or regression outputs.
The use of XAI in spectroscopy is expanding, although the literature remains comparatively limited and heterogeneous. A recent review of explainable artificial intelligence in spectroscopy highlighted that current work frequently focuses on identifying influential spectral bands, while important challenges remain in method selection, interpretation, and validation [
9]. In biomedical Raman spectroscopy, explainable machine-learning workflows have already been used to identify spectral features associated with cancer classification, illustrating the potential of XAI to make diagnostic models more transparent and to generate candidate biochemical hypotheses [
10].
Nevertheless, spectral explanations cannot be interpreted in the same way as independent tabular features. Neighbouring wavenumbers are often strongly correlated, relevant biochemical information may be distributed across broad or overlapping bands, and a single peak can reflect multiple molecular contributions. Moreover, spectral preprocessing steps—including baseline correction, normalization, smoothing, denoising, derivative transformation, feature selection, and dimensionality reduction—may influence both model performance and the resulting attribution patterns [
4,
11,
12]. Grouped spectral-region analysis has therefore been proposed as a more physically plausible alternative to interpreting isolated input variables, particularly when using SHAP- or LIME-based approaches [
11].
The broader XAI literature further indicates that apparently intuitive explanations are not necessarily faithful, stable, or robust. Attribution and saliency methods may change under model randomization, input transformations, preprocessing decisions, or technical perturbations that do not necessarily reflect meaningful differences in model reasoning [
13,
14]. In high-stakes biomedical settings, these limitations are particularly important because model explanations can be mistaken for mechanistic, causal, or clinically validated evidence [
15].
This focused narrative review examines SHAP, LIME, and related XAI approaches in biomedical spectroscopy, with emphasis on Raman, SERS, infrared, and hyperspectral data. Rather than cataloguing explanation methods, it focuses on the transition from spectral attribution to biochemical interpretation and considers the methodological principles, biomedical applications, and limitations associated with correlated spectral variables, peak overlap, preprocessing dependence, explanation instability, and model-specific attribution patterns.
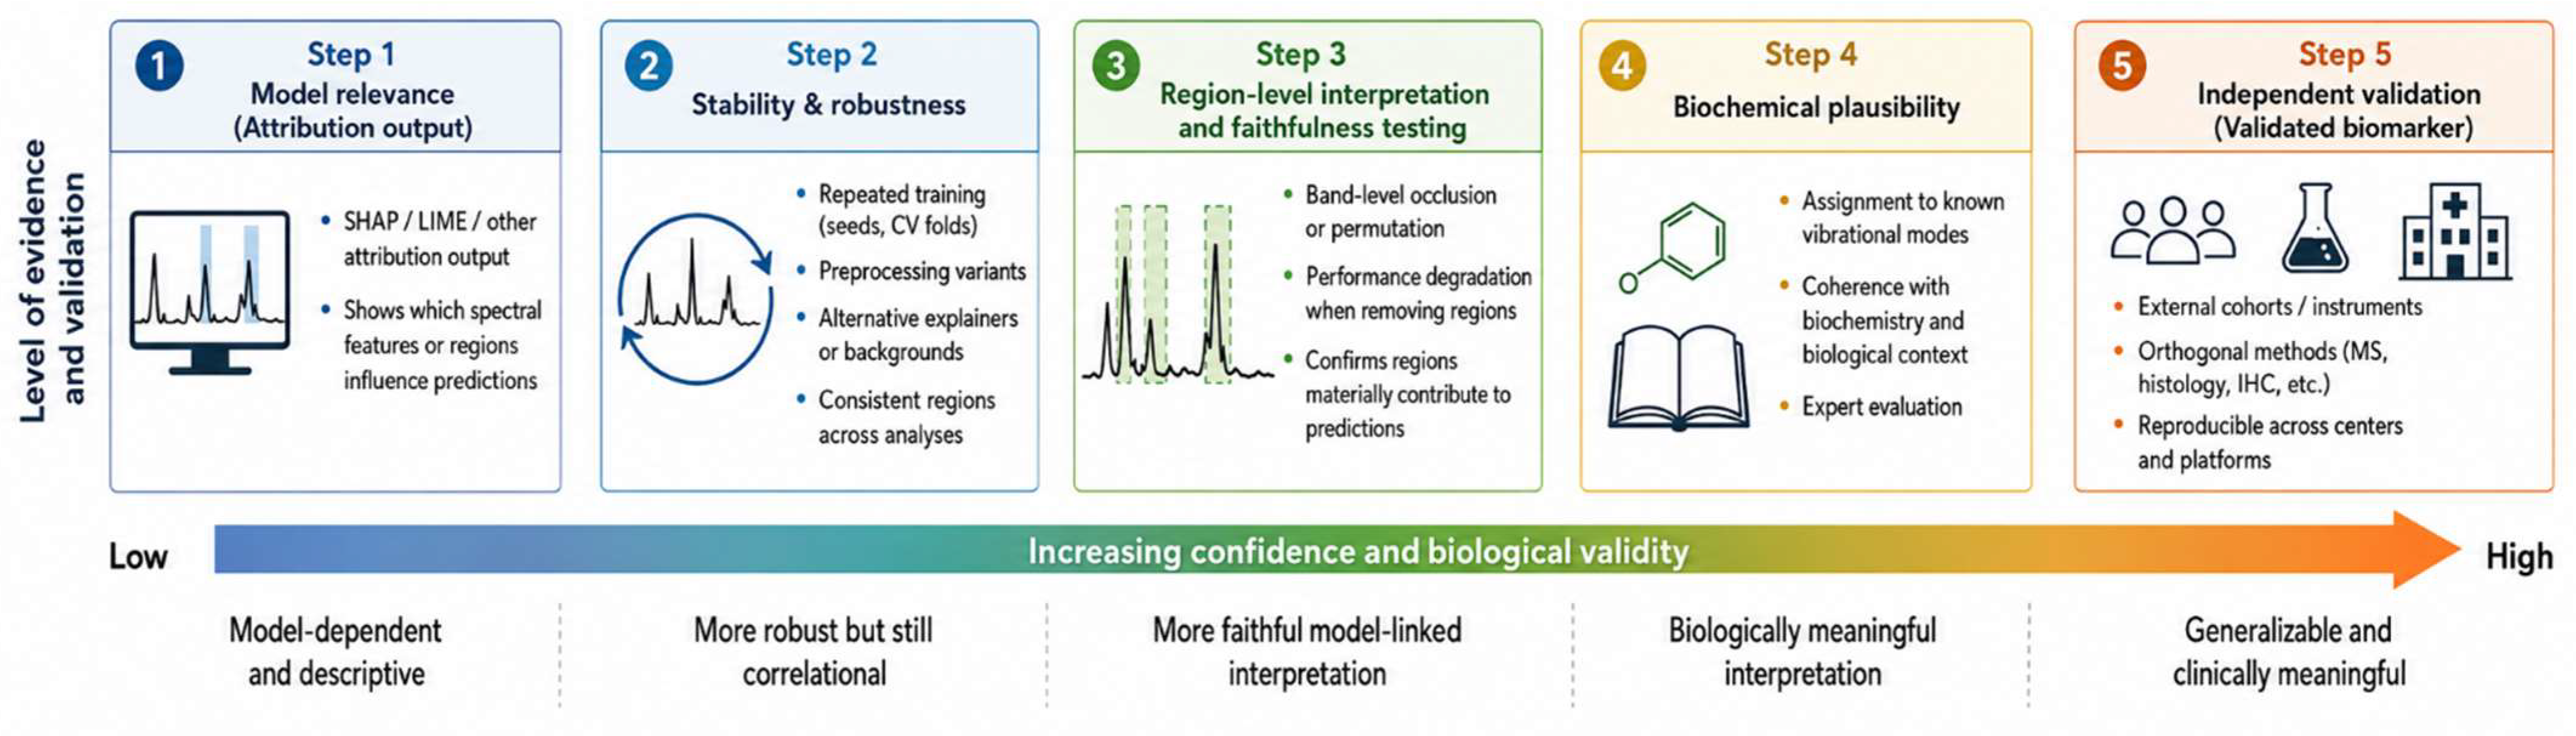
The main contribution of this review is a five-step validation framework for responsible interpretation of spectral XAI outputs: (i) valid model development and appropriate data splitting; (ii) stability assessment across model seeds, preprocessing pipelines, and explanation settings; (iii) region-level interpretation rather than isolated-variable claims; (iv) biochemical plausibility supported by spectroscopy knowledge and domain expertise; and (v) independent analytical, biological, or clinical validation. Under this framework, SHAP, LIME, and related methods are positioned as tools for model auditing and hypothesis generation rather than direct biochemical proof.
The contribution of the present review is distinct from, and complementary to, two closely related works. Contreras and Bocklitz [
9] systematically mapped XAI methods and applications across spectroscopy, whereas Contreras et al. [
11] introduced a spectral-zones approach for grouped SHAP/LIME analysis of correlated spectral variables. Building on these foundations, the present review addresses a different question: what evidence is required before a model-attributed spectral region can support a biochemical or clinical claim? It therefore integrates model validity, explanation stability, region-level interpretation and faithfulness testing, biochemical plausibility, and independent validation into a staged framework that explicitly links each evidential level to the strength of claim that can be supported.
2. Review Scope and Literature Selection
This article was designed as a focused structured narrative review rather than a systematic review or meta-analysis. Its objective was to synthesize methodological principles, representative biomedical applications, and validation challenges related to explainable artificial intelligence in spectroscopy, with particular emphasis on the transition from spectral attribution to biochemical interpretation.
The review focused on Raman spectroscopy, surface-enhanced Raman spectroscopy, infrared and Fourier-transform infrared spectroscopy, and biomedical hyperspectral imaging. The explainability methods of primary interest were SHapley Additive exPlanations (SHAP), Local Interpretable Model-Agnostic Explanations (LIME), gradient-based attribution, Integrated Gradients, class activation mapping, perturbation-based importance analysis, attention-based interpretation, and grouped spectral-region approaches. The biomedical scope included cancer diagnostics, tissue spectroscopy, microbial identification, infectious-disease applications, biofluids, extracellular vesicles, metabolic analysis, and translational diagnostic workflows. Pharmaceutical and controlled analytical spectroscopy studies were also considered when they provided relevant methodological evidence regarding feature attribution, spectral-region interpretation, or explanation stability.
Targeted literature searches were conducted iteratively during manuscript preparation and updated through 22 June 2026. Searches combined terms related to explainable artificial intelligence, feature attribution, SHAP, LIME, Raman spectroscopy, surface-enhanced Raman spectroscopy, infrared spectroscopy, hyperspectral imaging, biomedical diagnostics, cancer, microbial identification, biofluids, and biomarker discovery. Representative search concepts included combinations of: “explainable artificial intelligence” OR “XAI” OR “SHAP” OR “LIME” OR “feature attribution” OR “saliency” OR “Integrated Gradients” OR “Grad-CAM” OR “attention”, together with “Raman”, “SERS”, “infrared”, “FTIR”, “hyperspectral”, “biomedical”, “medical”, “cancer”, “bacteria”, “biofluid”, or “diagnosis”. Database-specific search strings are provided in Online Resource 1 (
Supplementary Materials).
Priority was given to peer-reviewed original studies, methodological papers, high-quality reviews, and reporting or validation guidelines that directly informed the interpretation of explainable AI outputs in spectral data. Foundational XAI publications were included when they introduced methods discussed in the review. Recent biomedical spectroscopy studies without formal XAI analysis were retained when they provided important clinical, translational, or methodological context for the need for interpretable spectral modelling.
Studies were not considered further when they were unrelated to spectroscopy, focused exclusively on non-biomedical applications without methodological relevance, or did not provide information relevant to model explanation, spectral interpretation, validation, or translational use. Reference lists of key reviews and primary studies were additionally examined to identify relevant literature not captured by the initial keyword searches.
Literature identification was purposive rather than exhaustive. The database-specific search strings in Online Resource 1 were used to identify representative studies and are reported for transparency, not as a systematic-review protocol. Accordingly, no formal risk-of-bias assessment, meta-analysis, or PRISMA flow diagram was performed. Because the iterative searches were not managed as a formal screening workflow, duplicate-removal and title/abstract screening counts were not prospectively recorded. The final evidence base comprised 54 references: 26 application studies (8 direct XAI or explicitly interpretability-oriented studies and 18 contextual spectral-AI studies) and 28 methodological, review, spectroscopy, statistical, or reporting sources.
3. Why Spectral Explanations Require Special Care
3.1. Correlated Wavenumbers, Band Structure, and Peak Overlap
Spectral data differ fundamentally from conventional tabular data because neighbouring wavenumbers are not independent variables. Raman, infrared, and related vibrational spectra represent continuous signals in which adjacent variables are linked through instrumental resolution, band width, molecular vibrations, and the underlying physical structure of the sample. In biological spectra, diagnostically relevant information is frequently distributed across broad or partially overlapping bands rather than concentrated in a single isolated Raman shift or wavelength. Proteins, lipids, nucleic acids, carbohydrates, and other molecular components may contribute simultaneously to the same spectral region, making one-to-one peak assignments difficult [
16].
This characteristic creates an important challenge for feature-attribution methods. In many machine-learning settings, SHAP, LIME, permutation importance, or related methods are applied by perturbing, masking, or independently varying input features. However, independently modifying one wavenumber while leaving its neighbouring values unchanged may generate a signal configuration that is not physically or biochemically plausible. This concern is especially relevant for SHAP implementations that rely on independence assumptions or background distributions that do not adequately represent feature dependence. When input variables are correlated, standard feature-wise Shapley approximations can produce misleading attributions because they may evaluate unrealistic combinations of variables [
17].
For spectroscopy, this means that an attribution score assigned to one Raman shift should not automatically be interpreted as evidence that this exact wavenumber represents a unique molecular contribution. A high attribution score may instead reflect information distributed across a broader correlated spectral region. Recent work has therefore proposed grouped spectral-zone approaches for SHAP- and LIME-based analysis, allowing adjacent or chemically related variables to be assessed jointly rather than as isolated features [
11]. Such approaches are more consistent with the physical structure of spectral signals and may reduce the risk of overinterpreting individual variables.
A practical implication is that XAI results should usually be reported and interpreted as spectral regions or bands, particularly when the relevant signal spans multiple neighbouring variables. Exact wavenumber-level claims should be reserved for cases in which spectral resolution, reproducibility, biochemical assignment, and experimental context provide sufficient justification. This distinction is especially important in biomedical applications, where apparently specific spectral features may arise from overlapping biological, technical, and preprocessing-related effects [
9,
16].
3.2. Preprocessing Is Part of the Explanation Pipeline
Preprocessing is an essential component of biomedical spectral analysis, but it is not a neutral technical step. Raman and infrared spectra may contain fluorescence backgrounds, detector noise, cosmic-ray artefacts, intensity variation, baseline drift, scattering effects, peak shifts, and other sources of technical or biological variability. Common preprocessing operations include baseline correction, normalization, smoothing, denoising, derivative transformation, spectral alignment, feature selection, and dimensionality reduction [
4,
12,
18].
These operations can improve model robustness and reduce irrelevant variation. At the same time, they modify the representation presented to the predictive model. Baseline correction may alter relative peak intensities, normalization may change the contribution of high-intensity spectral regions, smoothing may suppress narrow spectral features, and derivative transformations may emphasize peak boundaries rather than absolute intensity differences. Consequently, the learned decision function and the resulting attribution pattern can depend substantially on the selected preprocessing pipeline.
This has direct implications for XAI. SHAP, LIME, and related methods explain the behaviour of a model for the specific input representation on which that model was trained. They do not provide a preprocessing-independent description of the original physical spectrum. Therefore, two models with similar predictive performance but trained using different plausible preprocessing pipelines may highlight different spectral regions. Such differences do not necessarily indicate that one explanation is correct and the other is incorrect; rather, they may reveal that the apparent explanation is sensitive to analytical choices made before model training.
For this reason, spectral XAI studies should report preprocessing procedures in sufficient detail and avoid presenting attribution maps as universal biochemical findings when they have been generated under only one analytical pipeline. Whenever feasible, researchers should examine whether the most influential spectral regions remain consistent across reasonable alternatives in baseline correction, normalization, smoothing, and feature representation. Stability across preprocessing pipelines does not prove biochemical validity, but it provides stronger evidence that an explanation is not driven solely by one technical configuration.
3.3. Model Dependence, Background Choice, and Explanation Stability
A spectral explanation is also conditional on the trained model, the explainer configuration, and the reference distribution or perturbation strategy used to generate feature importance. SHAP values depend on the selected model and on how missing or masked features are represented relative to a background dataset. LIMEs depend on the local perturbation samples, the distance kernel, the surrogate-model specification, and the definition of the neighbourhood around the instance being explained [
7,
8]. These choices can influence which variables or spectral regions are identified as important.
Model dependence is particularly relevant in biomedical spectroscopy because multiple classifiers may achieve comparable performance while learning partially different decision boundaries. A support vector machine, random forest, one-dimensional convolutional neural network, or transformer-based model may use different combinations of spectral information to distinguish the same diagnostic classes. Likewise, independently trained neural networks may vary because of initialization, stochastic optimization, training order, regularization, or limited sample size. Therefore, a single explanation produced by one model instance should not automatically be interpreted as a stable representation of the diagnostic information contained in the data.
The broader XAI literature has shown that explanation quality should not be judged only by visual plausibility. Explanations may be sensitive to technical perturbations, model parameterization, or methodological choices, and should be assessed using concepts such as fidelity, sensitivity, robustness, and consistency [
13,
14,
19]. In spectroscopy, this suggests that explanation stability should be evaluated across repeated model training, alternative preprocessing pipelines, and, where possible, more than one explanation method.
Importantly, stability and faithfulness address different questions. A stable explanation is one that remains broadly consistent when reasonable technical variations are introduced. A faithful explanation is one that accurately reflects the contribution of the identified signal components to the prediction of the specific model. Neither property alone establishes biochemical causality or clinical relevance. However, an explanation that is unstable across seeds, preprocessing pipelines, or plausible model choices should be interpreted cautiously before being linked to molecular mechanisms or candidate biomarkers.
3.4. From Feature Importance to Biochemical Interpretation
Feature attribution answers a computational question: which input variables or spectral regions contributed to the prediction of a particular model under a defined data representation, background distribution, and explanation procedure? This is not equivalent to answering a biochemical question, such as which molecular component changed between diagnostic groups, nor does it establish that an identified band is causally related to disease.
The distinction is particularly important in biological Raman and infrared spectroscopy. A spectral region may reflect overlapping contributions from proteins, lipids, nucleic acids, water, extracellular-matrix components, or other biochemical constituents. Its apparent importance may also be influenced by concentration differences, sample preparation, tissue heterogeneity, measurement geometry, fluorescence background, or instrument-specific variation [
16]. Therefore, assigning a model-important band directly to a single molecule or biological mechanism without additional evidence can be misleading.
Biochemical interpretation should instead be treated as a staged process. First, XAI can identify candidate spectral regions associated with model behaviour. Second, these regions should be examined for stability across technical and modelling choices. Third, their potential biochemical meaning should be assessed using established vibrational assignments, domain expertise, reference spectra, and the biological context of the diagnostic task. Finally, stronger claims require independent confirmation through controlled experiments, complementary analytical techniques, external datasets, or clinical validation.
Under this perspective, spectral XAI is most valuable when it is used to prioritize hypotheses rather than to provide final biochemical proof. SHAP, LIME, and related methods can help researchers inspect whether models appear to use plausible spectral information, identify regions deserving further investigation, and detect potential technical shortcuts. However, the transition from model attribution to biochemical interpretation requires an explicit validation pathway. The following section therefore examines the major XAI method families used in biomedical spectroscopy and discusses their respective strengths and limitations.
4. SHAP, LIME, and Related XAI Methods for Spectral Data
Explainability methods used in biomedical spectroscopy differ in the type of model behaviour they describe, the level at which they operate, and the assumptions they make about the input signal. Some methods estimate feature contributions for individual predictions, whereas others provide global summaries across a dataset. Some are model-agnostic and can be applied to different classifiers, while others are designed specifically for neural networks. These distinctions are important because a method that is convenient or visually intuitive is not necessarily the most appropriate approach for a given spectral task.
4.1. SHAP for Local and Global Spectral Attribution
SHapley Additive exPlanations (SHAP) is one of the most widely used feature-attribution frameworks because it provides signed estimates of how individual input variables contribute to a model prediction relative to a selected reference or background distribution [
7]. In spectral applications, SHAP values can be calculated for Raman shifts, wavelengths, spectral regions, latent features, or handcrafted variables extracted from spectra. Positive and negative attribution values can indicate whether a given spectral component supports or opposes a particular class prediction.
A key advantage of SHAP is that local explanations can be aggregated across multiple spectra to produce global importance summaries. This can help identify spectral regions that are repeatedly associated with a diagnostic class rather than relying only on a single prediction. SHAP implementations can also be adapted to different model families, including tree-based models, kernel-based approximations for arbitrary predictors, and deep-learning-oriented variants. This flexibility has contributed to its increasing use in Raman, infrared, and related spectral studies.
However, SHAP results depend on the trained model, the selected background data, and the assumptions used to represent absent or perturbed features. These issues are particularly relevant for spectra because neighbouring variables are correlated and cannot always be varied independently without generating unrealistic signal configurations [
17]. Consequently, SHAP outputs should be interpreted as model-dependent attribution patterns rather than direct molecular assignments. Whenever possible, researchers should examine whether important regions remain consistent across different background sets, repeated training runs, and plausible preprocessing pipelines. Grouped spectral-zone approaches can further improve interpretability by evaluating neighbouring variables jointly rather than assigning meaning to isolated wavenumbers [
11].
4.2. LIME, Spectral Masking, and Local Surrogate Explanations
Local Interpretable Model-Agnostic Explanations (LIME) explains an individual prediction by fitting a simple interpretable surrogate model around the local neighbourhood of the input spectrum [
8]. In principle, LIME can be applied to any predictive model because it does not require direct access to internal model parameters. For spectral classification, perturbations may involve masking individual wavelengths, modifying spectral intervals, replacing values with a reference signal, or selectively removing predefined spectral regions.
The main appeal of LIME is its flexibility and local focus. It can help identify which spectral regions most strongly influenced a specific sample-level decision, which may be useful when examining heterogeneous tissue spectra, outlier cases, difficult diagnostic samples, or clinically relevant misclassifications. However, conventional LIME was not originally developed for continuous correlated spectral data. Independently perturbing single wavelengths can create artificial spectra that do not correspond to physically plausible biochemical signals.
For this reason, LIME-style analysis in spectroscopy should preferably use structured perturbations based on contiguous intervals, known bands, or data-driven spectral zones. Grouped spectral perturbation approaches reduce the risk of evaluating unrealistic input configurations and can provide explanations that are more consistent with broad vibrational bands and overlapping biochemical information [
11]. Nevertheless, LIME remains sensitive to the perturbation strategy, neighbourhood definition, surrogate-model specification, and random sampling procedure. Local explanations should therefore be evaluated for consistency before they are interpreted as evidence of a robust diagnostic spectral signature.
4.3. Gradient-Based Attribution for Deep Spectral Models
Gradient-based explanation methods are particularly relevant for one-dimensional convolutional neural networks and other deep-learning models trained directly on spectral signals. Basic saliency methods estimate how small changes in each input variable affect the target prediction. More advanced approaches, such as Integrated Gradients and DeepLIFT, compare the input spectrum with a reference baseline and propagate attribution scores through the network to estimate the contribution of each variable to the prediction [
20,
21].
Integrated Gradients calculates attribution by integrating gradients along a path between a baseline input and the observed spectrum. DeepLIFT instead compares neuronal activations with reference activations and propagates contribution scores through the network. Both approaches can generate fine-grained importance profiles across the spectral axis and are computationally attractive when large numbers of spectra or model predictions must be explained.
For one-dimensional convolutional models, class activation mapping (CAM) and Gradient-weighted Class Activation Mapping (Grad-CAM) can also be adapted to highlight signal regions that contribute to a target class prediction [
22,
23]. Although these approaches were originally introduced for image data, the underlying principle can be transferred to one-dimensional feature maps generated by spectral CNNs. Their main advantage is the production of class-specific importance profiles that can be visually compared with known spectral bands.
However, gradient-based explanations are affected by the selected baseline, network architecture, activation functions, saturation effects, and the resolution of learned feature maps. CAM- and Grad-CAM-based explanations may provide relatively coarse spectral localization, whereas gradient methods may produce noisy or fragmented profiles. Therefore, these methods are best interpreted together with perturbation-based testing, repeated model training, and domain-informed assessment of whether highlighted regions correspond to reproducible spectral patterns.
4.4. Permutation Importance and Perturbation-Based Evaluation
Permutation importance estimates the relevance of an input variable or feature group by measuring how model performance changes after that information has been randomly permuted or disrupted [
24]. Unlike local methods such as SHAP or LIME, permutation-based approaches are usually used to provide global importance estimates across a dataset. In spectroscopy, they can be applied to individual wavelengths, contiguous spectral intervals, predefined biochemical bands, or latent feature groups.
A major advantage of permutation importance is its direct link to predictive performance. If permuting a spectral region leads to a substantial reduction in classification accuracy or another relevant metric, that region is likely to contain information used by the model. This makes permutation analysis useful as a complementary validation tool for attribution methods. For example, spectral regions highlighted by SHAP or Integrated Gradients can be tested through structured occlusion or group-wise permutation to determine whether their removal meaningfully changes model output or predictive performance.
Nevertheless, permutation-based methods also require caution when applied to correlated spectra. Permuting one variable independently can disrupt the natural correlation structure of the signal and may overestimate or redistribute importance among highly correlated neighbouring features. Group-wise permutation, conditional perturbation, and band-level occlusion are therefore generally more appropriate than isolated-wavenumber permutation for biomedical spectral data. Such approaches are especially valuable when explanations are intended to support biochemical interpretation rather than only model inspection.
4.5. Attention-Based Interpretation
Attention mechanisms are increasingly used in spectral deep-learning architectures to assign different weights to spectral regions, latent features, or sequence elements during prediction. In principle, these weights can help identify signal components that the network emphasizes for a particular classification task. Attention may therefore be useful in long spectra, multimodal settings, or models that need to integrate information across distant spectral regions.
However, attention weights should not automatically be treated as faithful explanations of model reasoning. The broader XAI literature has shown that attention distributions can sometimes be modified without materially changing model predictions, and close attention weights do not necessarily correspond to features with the strongest causal contribution to a decision [
25]. In biomedical spectroscopy, attention maps should therefore be considered model-internal indicators that require independent comparison with feature attribution, perturbation analysis, and spectral-domain knowledge.
4.6. Choosing and Combining Methods for Spectral XAI
No single XAI method is sufficient for all biomedical spectroscopy applications. SHAP is valuable for local and aggregated feature attribution, but requires careful handling of correlated variables and background distributions. LIME provides flexible local explanations but depends strongly on the perturbation strategy. Gradient-based methods are efficient for deep spectral models but may be sensitive to baseline selection and network properties. Permutation or occlusion approaches offer a useful performance-based complement, although they must preserve realistic spectral structure. Attention maps may provide additional model-level insight but should not be regarded as independent evidence of feature importance.
A practical strategy is therefore to combine at least two complementary approaches. For example, a study may use SHAP or Integrated Gradients to identify candidate spectral regions, followed by group-wise perturbation testing to assess whether these regions materially influence model output. Agreement across methods does not prove biochemical validity, but it provides stronger evidence that an observed explanation is not solely an artifact of one explainer configuration.
Table 1 summarizes the main XAI method families relevant to biomedical spectral data.
5. Biomedical Applications of Spectral XAI
5.1. Cancer Diagnostics, Tissue Spectroscopy, and Translational Raman Applications
Cancer diagnostics is one of the most active application areas for Raman spectroscopy and surface-enhanced Raman spectroscopy (SERS). Spectral approaches have been investigated for tissue discrimination, tumour grading, liquid-biopsy analysis, real-time endoscopic assessment, and intraoperative decision support. In these settings, machine learning can identify complex multivariate spectral patterns that may not be apparent through conventional peak-by-peak analysis. However, the clinical relevance of such models depends not only on classification performance but also on whether the underlying spectral information is robust, biologically plausible, and reproducible across patient cohorts and acquisition settings.
Direct explainability studies remain relatively limited. Bellantuono et al. developed an interpretable Raman-based machine-learning workflow for thyroid cancer classification, combining peak-based feature engineering, model selection, and SHAP analysis to identify spectral intervals contributing to individual predictions [
10]. This study is particularly relevant because it illustrates both the value and the limitations of spectral XAI: the model can highlight diagnostically influential spectral regions, but interpretation still depends on the feature-engineering procedure, sample size, preprocessing choices, and the biochemical complexity of thyroid tissue.
Recent studies show the rapid expansion of AI-assisted Raman analysis in gastrointestinal and tissue oncology. Applications include early gastric cancer assessment, candidate spectral-marker identification, and real-time gastric adenocarcinoma classification [
26,
27,
28], fused Raman analysis of blood plasma and saliva for head and neck cancer diagnostics [
29], chondrosarcoma grading [
30], and Raman–FTIR fusion for thyroid-cancer metastasis prediction [
31]. Most, however, do not include systematic XAI analysis. They therefore illustrate the central problem addressed here: strong diagnostic performance does not establish which spectral regions are consistently used by the model or whether those regions provide stable biochemical evidence.
These studies demonstrate the diagnostic potential of deep spectral models, while also reinforcing the need for post hoc explanation, stability assessment, and independent validation before model-relevant bands are interpreted as disease-associated biochemical signatures.
Extracellular-vesicle and biofluid SERS studies further illustrate the same translational challenge across lung cancer, breast cancer, multi-cancer detection, treatment monitoring, and oral-cancer applications [
32,
33,
34,
35,
36,
37]. These studies demonstrate the diagnostic potential of AI-assisted spectral profiling in heterogeneous liquid-biopsy materials, but they also reinforce the need to distinguish classification of complex spectral signatures from evidence that a specific attribution represents a validated biomarker.
5.2. Microbial Identification and Infectious-Disease Applications
Rapid microbial identification is another prominent application of Raman and SERS combined with machine learning. Raman signatures can reflect variation in cellular composition, metabolism, cell-wall structure, and other biochemical properties of microorganisms. Deep-learning approaches have been used to identify bacterial pathogens at genus and species level from Raman spectra [
38] and to support rapid bacterial classification using SERS [
39]. More recent work has addressed the open-set problem, in which a model must identify samples that do not belong to the bacterial classes represented during training [
40].
These applications are especially relevant for spectral XAI because microbiological datasets can be affected by culture conditions, media composition, growth phase, substrate effects, and batch-specific acquisition variation. An explainable or interpretable model may help determine whether a classifier relies on broad, plausible biochemical regions or on technical properties that are unlikely to generalize across laboratories. Chen et al. recently proposed metabolite-level interpretable SERS for bacterial identification, linking spectral classification with experimentally supported molecular interpretation [
41]. This is a strong example of moving beyond feature importance alone toward a more defensible biochemical explanation.
5.3. Biofluids, Metabolic Signatures, and Biomarker-Oriented Spectroscopy
Biofluid spectroscopy is attractive because blood, saliva, urine, and extracellular-vesicle samples can be collected with relatively low invasiveness. However, such samples also present substantial biological and technical heterogeneity. Hydration, diet, medication, comorbidities, storage conditions, sample preparation, and instrument effects can influence the observed spectra. As a result, predictive models may capture combinations of disease-associated and non-disease-related variation.
Salivary ATR-FTIR spectroscopy combined with support vector machine classification has been investigated for type 2 diabetes screening [
42]. In oncology, fused Raman analysis of blood plasma and saliva has been used for head and neck cancer diagnostics, with comparison against metabolite-related evidence from mass spectrometry [
29]. These studies demonstrate the potential of spectral AI for biomarker-oriented analysis, but they also show why interpretation should be conservative. A high-performing classifier may identify a multivariate diagnostic signature without proving that each highlighted wavelength or Raman band represents an independent, disease-specific biochemical marker.
The same consideration applies to exosome-SERS studies. Exosomes contain complex mixtures of proteins, lipids, nucleic acids, and metabolites. Their spectra may therefore provide rich diagnostic information, but model attribution must be interpreted in the context of sample heterogeneity, isolation procedures, SERS substrate effects, and cohort design. XAI can support expert review and hypothesis generation, but independent validation remains essential before spectral regions are translated into clinical biomarker claims.
5.4. Hyperspectral Imaging, Attention Models, and Feature-Selection Applications
Hyperspectral imaging extends spectral analysis by preserving both spectral and spatial information. This creates opportunities for more localized interpretation but also introduces additional complexity, because explanations may depend on both wavelength-level information and image-region context. Explainable deep-learning approaches have been used for liver-tumour delineation in surgical hyperspectral images [
43], while benchmark work in intraoperative brain-tumour detection has highlighted the importance of rigorous patient-level evaluation for translational hyperspectral AI [
44].
In Raman spectroscopy, explainability is also increasingly used for feature selection and model simplification. Rossberg et al. investigated XAI-based feature-selection strategies across Raman datasets, demonstrating that attribution-derived features can be used to reduce input dimensionality while preserving diagnostic performance [
45]. Attention-based Raman architectures have also been applied to SERS classification of neurological disorders [
46]. These approaches are promising, but relevance scores, attention maps, and selected wavenumbers must still be assessed for stability and faithfulness. A compact model or visually intuitive relevance profile is not automatically equivalent to a biochemically validated explanation. Within colorectal cancer research, Raman-based deep-learning workflows have similarly been explored under limited-data and translational conditions. An extended artificial-intelligence analysis examined Raman spectra for colorectal abnormality classification [
47]. In addition, portable Raman-probe measurements combined with deep learning have been investigated in vivo in a colorectal cancer model [
48]. These studies demonstrate the diagnostic potential of deep spectral models, while also reinforcing the need for post hoc explanation, stability assessment, and independent validation before model-relevant bands are interpreted as disease-associated biochemical signatures.
Explainable Raman-based bacterial identification has also been explored using multiple machine-learning models and SHAP-based attribution [
49]. Such work can reveal whether different classifiers emphasize similar spectral regions and can help prioritize candidate microbial signatures. Nevertheless, model-important bands should not automatically be interpreted as species-specific biomarkers. Stronger claims require confirmation across independent cultures, acquisition batches, experimental conditions, and, where possible, complementary microbiological or chemical measurements.
Controlled analytical datasets can be useful testbeds for studying these issues. In a benchmark of Raman classification of pharmaceutical compounds, SHAP-based explanations were used to compare model-relevant spectral features across multiple machine-learning algorithms [
50]. Such datasets offer clearer chemical reference information than many clinical cohorts and can therefore help evaluate whether attribution patterns align with known spectral differences. Nevertheless, even controlled analytical applications require careful treatment of correlated spectral variables, preprocessing dependence, and model-specific decision boundaries.
5.5. Cross-Application Lessons
Across oncology, microbial identification, biofluid analysis, hyperspectral imaging, and analytical spectroscopy, a consistent pattern emerges. Spectral XAI can help identify candidate regions that influence a model prediction, compare model behaviour across classes or datasets, detect technically implausible shortcuts, and guide domain experts toward spectral features that deserve further investigation. However, most studies do not yet evaluate whether explanations remain stable across model seeds, preprocessing pipelines, background distributions, alternative explainers, or independent datasets.
The studies summarized in
Table 2 should therefore be interpreted in two categories. The first includes direct XAI applications, in which SHAP, LIME, feature attribution, interpretable modelling, saliency, or attention are explicitly used to investigate model behaviour. The second includes high-quality spectral-AI applications without formal XAI analysis. These studies remain highly relevant because they define the clinical and analytical settings in which explanation stability, biochemical plausibility, and validation are most urgently needed.
Of the 26 application studies summarized in
Table 2, eight directly used XAI or an explicitly interpretability-oriented approach, whereas 18 were included as contextual spectral-AI studies without formal XAI analysis. Four of the 26 studies include one or both authors of this review; the remaining 22 are from independent groups. These author-including studies were retained because they met the same relevance criteria as the other included studies and illustrate specific methodological or application contexts. However, they are not used as sole evidence for any central conclusion of the review; the framework is based primarily on cross-cutting methodological limitations, independent studies, and broader principles of model validation, explanation stability, and biomarker interpretation.
6. From Spectral Attribution to Biochemical Interpretation: A Five-Step Framework
The central challenge in spectral explainability is to distinguish computational relevance from biochemical and clinical meaning. A SHAP value, LIME coefficient, saliency profile, or attention weight can indicate that a spectral variable or region contributed to a model prediction. However, this does not establish that the corresponding band represents a specific molecular change, a causal disease mechanism, or a clinically validated biomarker. A responsible interpretation pathway must therefore separate at least four levels of evidence: model relevance, analytical robustness, biochemical plausibility, and independent validation.
To support this distinction, we propose a five-step validation framework for the interpretation of explainable AI outputs in biomedical spectroscopy. The framework is intended for Raman, SERS, infrared, and hyperspectral studies and can be applied to classification, regression, risk prediction, and biomarker-oriented modelling tasks. Its purpose is not to impose a single mandatory workflow, but to provide a structured route from initial feature attribution toward increasingly defensible biological or clinical claims.
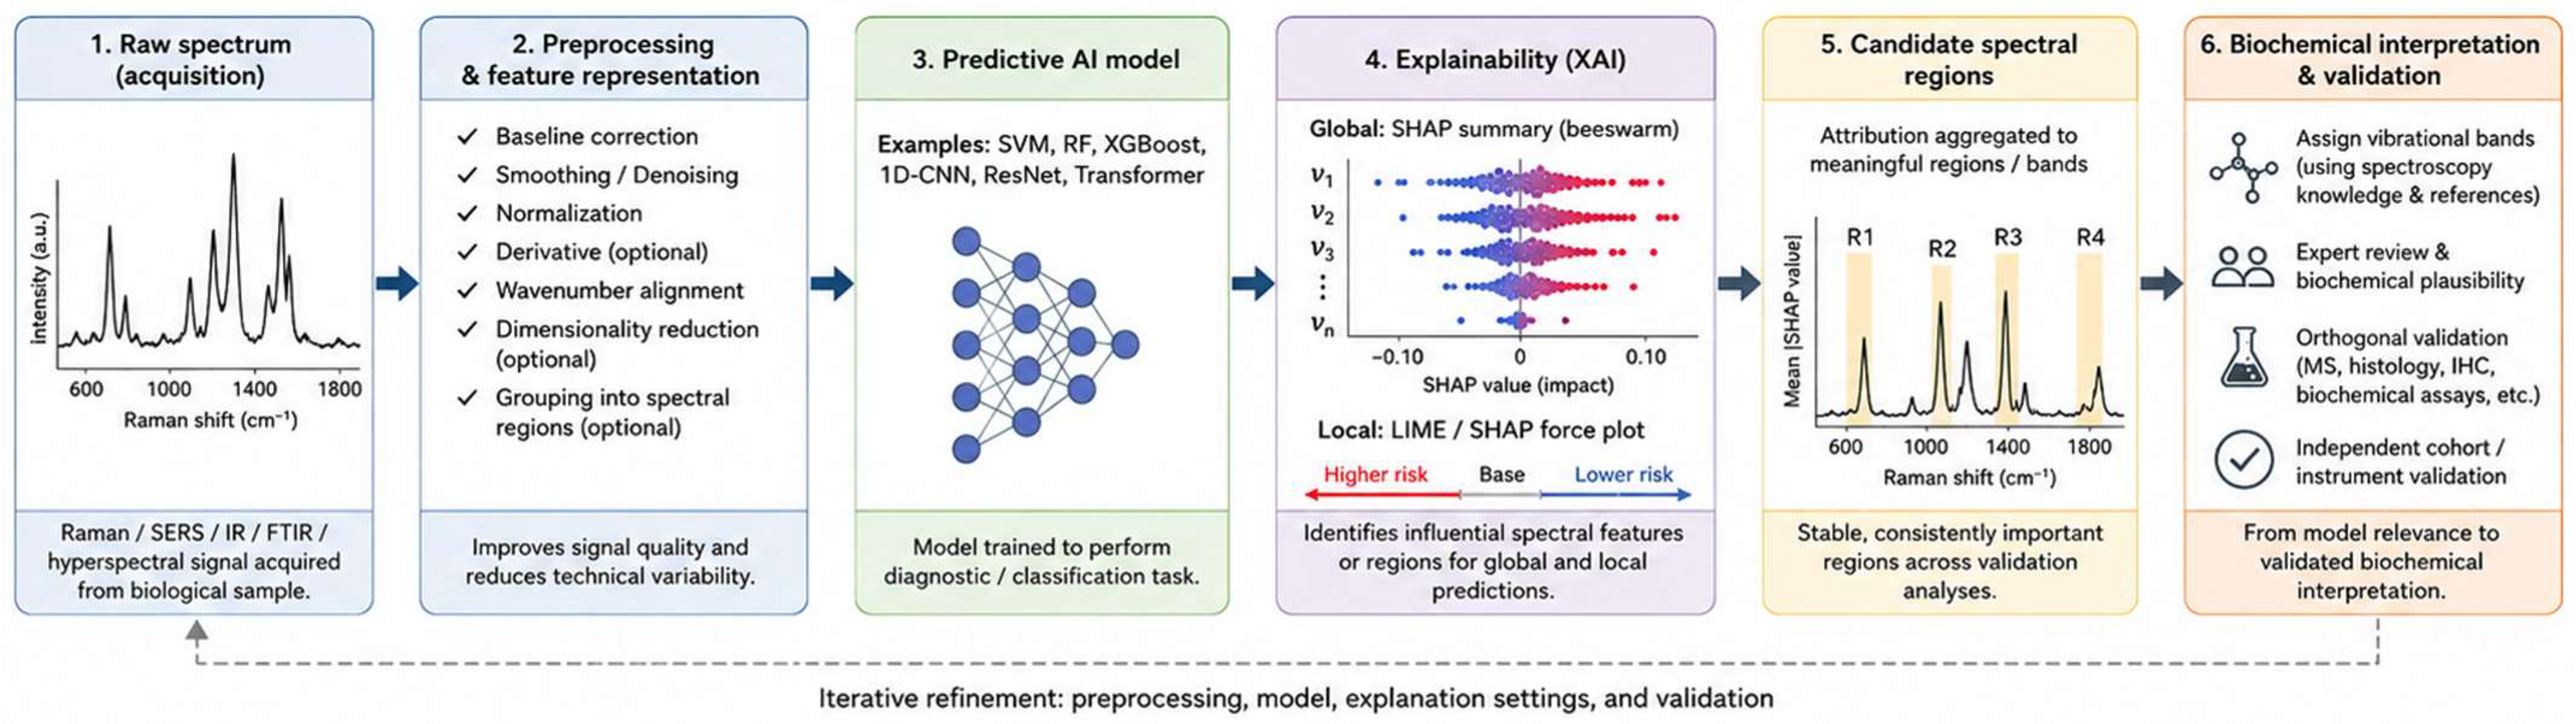
Figure 1 provides an end-to-end overview of the proposed translational pipeline, whereas the later evidence-ladder figure separates the five validation stages according to the strength of claim they can support.
6.1. Step 1: Establish a Valid Predictive Model
Explainability cannot compensate for weaknesses in dataset design, data splitting, model development, or performance evaluation. Before interpreting model-important spectral regions, researchers should establish that the model itself has been developed and evaluated appropriately. This includes clear definition of the prediction target, the intended use population, the unit of analysis, and the source of repeated measurements.
In biomedical spectroscopy, data leakage is a particular concern. Multiple spectra acquired from the same patient, tissue specimen, biological sample, culture batch, or experimental session should not be distributed across training and test subsets when the objective is to estimate generalization to unseen patients or samples. Otherwise, apparent predictive performance may reflect sample-specific or batch-specific patterns rather than disease-related information. External validation is especially important when models are intended to support biomarker discovery, clinical translation, or cross-instrument deployment [
4,
15,
51,
52].
Model performance should also be assessed using metrics that match the diagnostic task. Accuracy alone is often insufficient, particularly in imbalanced datasets. Depending on the application, balanced accuracy, sensitivity, specificity, macro-averaged F1-score, area under the receiver operating characteristic curve, calibration, and subgroup-level performance may provide more informative evidence. A spectral explanation can only be meaningful when it is generated from a model with transparent, appropriately validated, and clinically relevant predictive behaviour.
6.2. Step 2: Assess Explanation Stability
A model-important spectral region should not be interpreted as robust evidence if it disappears after minor changes in preprocessing, model initialization, background selection, or explanation settings. Explanation stability therefore represents the second step of the framework. Researchers should assess whether the main attributed regions remain broadly consistent across repeated training runs, plausible preprocessing pipelines, alternative background distributions, and, where feasible, more than one explanation method.
Stability can be quantified in several complementary ways. These may include overlap of the top-ranked spectral intervals, rank correlation between attribution profiles, similarity of band-level importance scores, agreement between local and aggregated explanations, and performance changes after structured occlusion of candidate regions. The appropriate metric depends on the spectral representation and clinical task; however, the key principle is that stability should be examined at the level of meaningful spectral regions rather than only individual wavenumbers.
As pragmatic reporting targets, exploratory spectral-XAI studies should ideally summarize attribution stability across repeated model fits, multiple plausible preprocessing pipelines, and alternative explanation settings. Useful quantitative summaries include Spearman or Kendall rank correlation of regional importance profiles, Jaccard or Dice overlap of top-ranked spectral intervals, recurrence frequency of candidate bands across repeated analyses, and the change in model performance after structured occlusion or permutation of the candidate region. For exploratory studies, a candidate region may be described as provisionally stable when it recurs in most repeated analyses, for example in at least 70% of repeated fits or preprocessing variants, and shows moderate-to-high agreement across regional attribution profiles, for example rank correlation above approximately 0.6 or top-region overlap above approximately 0.5. These values should not be treated as universal thresholds, but as transparent starting points that should be adapted to sample size, spectral resolution, clinical task, and intended strength of claim.
Importantly, stability should not be interpreted as proof of biochemical validity. A model can consistently rely on a technically confounded signal. Nevertheless, instability is informative: if a purportedly important spectral band changes substantially across reasonable modelling choices, strong biochemical claims should be avoided. Explanation stability should therefore be treated as a minimum robustness requirement rather than an optional supplementary analysis [
13,
14,
19].
6.3. Step 3: Interpret Spectral Regions Rather than Isolated Variables
The third step is to translate point-wise attribution into region-level spectral interpretation. Biomedical spectra contain strongly correlated neighbouring variables, broad vibrational bands, peak overlap, and contributions from multiple biochemical components. Therefore, isolated wavenumber-level importance should rarely be treated as evidence for a single molecular entity.
Instead, researchers should group neighbouring variables into contiguous spectral intervals, chemically informed bands, or data-driven spectral zones. Such grouping can be defined using known Raman or infrared assignments, peak boundaries, spectral resolution, clustering methods, or prior knowledge of the biological system. Structured group-wise perturbation, spectral-zone SHAP, band-level occlusion, and interval-based LIME can then be used to assess whether the model depends on the broader spectral region rather than on an isolated coordinate [
11,
17].
Region-level interpretation also improves comparability across instruments and preprocessing pipelines. Small shifts in peak position, spectral resolution, or alignment can alter the exact location of the highest attribution value while preserving the relevance of the underlying biochemical band. Reporting a reproducible spectral interval is therefore usually more defensible than reporting a single Raman shift as a definitive discriminative marker.
6.4. Step 4: Evaluate Biochemical Plausibility
Once candidate spectral regions have been identified and shown to be reasonably stable, their potential biochemical meaning should be assessed. This step requires spectroscopy knowledge, domain expertise, and careful consideration of the sample type. In tissue spectra, a model-important region may reflect a combination of tumour cells, stromal structures, inflammatory cells, extracellular matrix, necrosis, lipids, proteins, and other microenvironmental components. In biofluids or extracellular-vesicle spectra, the same region may be influenced by concentration changes, sample handling, hydration, medication, or matrix effects.
Biochemical plausibility should therefore be evaluated using established vibrational assignments, relevant reference spectra, sample-specific biological knowledge, and independent expert review. A candidate region may be described as protein-associated, lipid-associated, nucleic-acid-associated, or consistent with a broader biochemical process when this interpretation is supported by the spectral literature. More specific molecular claims should be reserved for cases in which the evidence is stronger and competing assignments have been considered. Because broad and overlapping Raman or infrared bands may admit several plausible assignments, authors should report alternative candidates and indicate the uncertainty of the preferred interpretation rather than selecting a single molecule solely from peak proximity.
This step should explicitly distinguish between a plausible interpretation and a confirmed biochemical identity. XAI can prioritize hypotheses, but it cannot by itself resolve peak overlap, establish molecular specificity, or determine causal biological mechanisms. The most appropriate wording is often that a spectral region is “consistent with” a biochemical contribution rather than that it “demonstrates” a specific molecular change.
6.5. Step 5: Obtain Independent Analytical, Biological, or Clinical Validation
The final step is independent validation. A model-relevant and biochemically plausible spectral region becomes stronger evidence only when it is supported by data that were not used to develop the original model or explanation. The appropriate validation strategy depends on the intended claim.
For analytical applications, validation may include controlled mixtures, purified reference compounds, spike-in experiments, or spectra acquired using an independent instrument. For tissue studies, candidate regions may be compared with histopathology, immunohistochemistry, mass spectrometry, biochemical assays, or spatially matched molecular data. For microbial studies, validation may involve repeated cultures, controlled growth conditions, independent strains, or complementary microbiological measurements. For clinical diagnostic applications, independent patient cohorts, external centres, prospective testing, and clinically meaningful endpoints are required before XAI-derived findings can support translational claims [
51,
53].
The language used in reporting should reflect the level of validation achieved. A spectral region identified only by XAI should be described as a model-relevant feature. A stable region supported by vibrational assignments may be described as a candidate biochemical correlate. Only regions that are independently confirmed through appropriate analytical, biological, or clinical evidence should be presented as validated biomarkers. This distinction is essential for avoiding overinterpretation and for maintaining a transparent link between computational inference and biomedical evidence.
6.6. Practical Use of the Framework
The proposed framework can be implemented as a sequential evidence ladder. Researchers should first verify that the predictive model is valid, then test whether explanations are stable, interpret the results at the level of spectral regions, assess biochemical plausibility, and finally seek independent confirmation. Failure at any stage should limit the strength of the final claim.
The framework is compatible with established reporting principles for medical AI, including transparent description of datasets, data splitting, preprocessing, model selection, and validation procedures [
53,
54]. Although current reporting guidelines are not specific to biomedical spectroscopy, their emphasis on reproducibility, transparent evaluation, and intended clinical use is directly relevant to XAI-assisted spectral studies.
Figure 2 summarizes the five-step evidence ladder, illustrating how the strength of interpretation should increase from model-relevant attribution to independently validated biomarker-oriented evidence. Unlike
Figure 1, which presents the broader end-to-end translational pipeline,
Figure 2 focuses specifically on the five validation stages and the claim strength supported at each stage.
Table 3 provides a practical summary of the evidence required at each stage and the corresponding level of claim that can be supported.
6.7. Worked Example: Applying the Framework to a Published Raman-XAI Study
To illustrate its practical use, the framework was retrospectively applied to the Raman-XAI study of Bellantuono et al. [
10], which classified 59 thyroid-tissue spectra and interpreted a Random Forest model using SHAP. This assessment uses only the evidence reported in the publication and does not constitute a reanalysis of the original data.
The framework should therefore be interpreted as a conceptual and practical validation aid rather than as an empirically validated scoring system. Its usefulness is supported by methodological reasoning and by the retrospective illustrative application above, but it has not yet been prospectively tested across new spectral datasets, laboratories, instruments, or clinical workflows. Future work should evaluate whether applying the framework prospectively improves explanation reproducibility, reduces overinterpretation, and supports more reliable biomarker-oriented interpretation.
Table 4 summarizes the reported evidence and the corresponding framework-based assessment.
The study therefore satisfies Steps 1–4 to different degrees but does not fully meet Step 5. The most defensible interpretation is that it identifies candidate model-relevant spectral correlates of thyroid malignancy; it does not yet establish independently validated or clinically actionable biomarkers.
7. Common Pitfalls, Reporting Priorities, and Future Directions
7.1. Data Leakage, Dataset Shift, and Technical Confounding
The reliability of spectral XAI depends first on the quality and validity of the underlying predictive model. In biomedical spectroscopy, apparently high classification performance can arise from data leakage, repeated measurements, batch effects, or acquisition-related confounding rather than from robust disease-associated biochemical information. This risk is particularly high when multiple spectra from the same patient, tissue specimen, culture, experimental batch, or instrument session are distributed across training and test subsets. Under these conditions, a model may learn sample-specific or batch-specific spectral signatures and still achieve optimistic internal test performance [
4,
52].
The same concern applies to explanations. If a model relies on hidden technical structure, SHAP values, LIME coefficients, saliency maps, or attention profiles may faithfully identify this technically predictive information. An explanation can therefore appear internally consistent while remaining biologically irrelevant. For example, a model may highlight a spectral region influenced by fluorescence background, substrate effects, sample drying, normalization choices, or acquisition settings rather than by the intended diagnostic target.
Domain shift is another major challenge. Spectra acquired using different instruments, laser wavelengths, detectors, substrates, acquisition protocols, sample-preparation procedures, or preprocessing pipelines may differ substantially even when they originate from similar biological material. A model and its corresponding explanation may therefore fail to generalize across centres or experimental platforms. This is especially relevant for translational applications involving Raman probes, SERS substrates, biofluids, extracellular vesicles, or multicentre clinical cohorts.
Spectral-XAI studies should therefore report the unit of data splitting clearly and distinguish between spectrum-level, sample-level, patient-level, and batch-level validation. Whenever the intended use involves unseen patients, specimens, or institutions, the test set should reflect this level of independence. External validation remains the strongest available approach for assessing whether both predictive performance and explanation patterns generalize beyond the development dataset.
7.2. Inadequate Validation of Explanations
A frequent limitation of current spectral-XAI studies is that explanations are generated and visually interpreted without explicit evaluation of their robustness or faithfulness. The presentation of a SHAP summary plot, a highlighted Raman band, or an attention profile is often treated as sufficient evidence that the model has identified a meaningful biochemical feature. However, explanations may change substantially when the model is retrained, preprocessing is modified, alternative background data are used, or the explanation method is replaced [
13,
14,
19].
This issue is particularly important for SHAP and LIME. SHAP values depend on the model, the background distribution, and the treatment of dependent features. LIME depends on local sampling, the perturbation mechanism, the neighbourhood definition, and the surrogate model. In continuous spectral signals, perturbing isolated wavenumbers may generate unrealistic combinations of features that do not preserve the natural structure of the spectrum. Therefore, point-wise importance should not be interpreted without considering spectral correlation and band structure [
11,
17].
A stronger evaluation should include at least one complementary validation procedure. Candidate spectral regions identified by SHAP, LIME, gradients, or attention can be tested through band-level occlusion, structured permutation, sensitivity analysis, or repeated model training. Agreement between explanation methods should not be treated as definitive proof, because different explainers may share assumptions or respond similarly to the same confounding structure. Nevertheless, consistent findings across complementary methods provide stronger evidence than reliance on a single attribution map.
Researchers should also distinguish clearly between local and global explanations. A feature that strongly contributes to one difficult sample-level prediction may not be consistently relevant across the population. Conversely, a globally important spectral region may not explain every individual prediction. Both forms of explanation can be useful, but they support different scientific claims and should not be conflated.
7.3. Reporting Priorities for Spectral-XAI Studies
Transparent reporting is essential for reproducibility and for meaningful interpretation of spectral explanations. Existing medical-AI reporting guidance emphasizes the importance of describing datasets, preprocessing, validation, intended use, model development, and performance evaluation [
53,
54]. These principles are directly applicable to biomedical spectroscopy but should be extended to include spectroscopy-specific and explanation-specific information.
At minimum, a spectral-XAI study should report the biological source of the samples, the number of patients or independent specimens, the number of spectra per unit, acquisition settings, spectral range, spectral resolution, preprocessing steps, data-splitting strategy, model architecture, hyperparameter selection procedure, and the exact XAI method used. For SHAP, this includes the selected implementation, background dataset, aggregation procedure, and whether attributions were computed at individual-variable or grouped-region level. For LIME, reporting should include the perturbation strategy, number of perturbation samples, neighbourhood definition, surrogate model, and random seed or repeated-analysis protocol.
The interpretation process should also be described explicitly. Authors should state whether assigned spectral bands were evaluated against reference assignments, whether competing biochemical explanations were considered, whether domain experts reviewed the findings, and whether candidate regions were validated using external data or complementary assays. This level of transparency is necessary to distinguish a visual explanation from a reproducible biomarker-oriented result.
Table 5 summarizes the minimum reporting information that should be provided in spectral-XAI studies.
7.4. Future Directions
Future progress in biomedical spectral XAI will depend on moving from visual explanation toward quantitative validation. One important direction is the development of explanation methods that preserve the physical and statistical structure of spectra. Rather than masking isolated wavenumbers, future approaches should increasingly use conditional perturbation, grouped spectral zones, band-level occlusion, and correlation-aware attribution methods. These approaches are more compatible with broad vibrational bands, peak overlap, and the continuous nature of Raman and infrared signals.
A second priority is the establishment of benchmark datasets and shared evaluation protocols. Current studies often use small, single-centre datasets with different preprocessing pipelines, model architectures, and evaluation procedures. This makes it difficult to compare explanation methods or determine whether a reported spectral attribution is robust across tasks. Public datasets with patient-level metadata, repeated measurements, acquisition information, external validation sets, and known analytical controls would enable more rigorous comparison of both predictive models and explainability approaches.
Multimodal validation is another promising direction. Spectral XAI findings could be compared with histopathology, immunohistochemistry, mass spectrometry, genomic profiling, clinical metadata, or spatial molecular measurements. Such comparisons may help determine whether model-important spectral regions correspond to reproducible biological processes rather than technical artefacts. In tissue applications, spatially matched Raman and histological data may be particularly useful for connecting candidate spectral regions with tumour morphology, stromal composition, inflammatory infiltration, or necrotic areas.
Finally, spectral XAI should increasingly incorporate uncertainty. Most current explanations provide a single importance profile without indicating how variable that profile is across model seeds, patients, preprocessing choices, or acquisition settings. Confidence intervals, attribution distributions, consensus regions, and uncertainty-aware visualizations could help prevent overinterpretation of weak or unstable findings. In clinical settings, this would support a more realistic use of XAI as a tool for model auditing, expert review, and hypothesis generation rather than as a definitive source of molecular or diagnostic truth. At minimum, studies should summarize attribution variability across repeated fits using rank correlations, band-overlap measures, or distributions of regional importance, and should distinguish uncertainty in the prediction from uncertainty in the explanation.
Overall, the future value of SHAP, LIME, and related approaches in biomedical spectroscopy will depend less on producing increasingly detailed attribution plots and more on establishing whether those explanations are stable, faithful, biologically plausible, and independently validated. The proposed framework and reporting priorities are intended to support this transition from descriptive feature importance toward reproducible and clinically meaningful spectral interpretation.
8. Conclusions
SHAP, LIME, and related explainable artificial intelligence methods offer important opportunities for making biomedical spectral models more transparent. In Raman, SERS, infrared, and hyperspectral applications, these approaches can identify spectral regions associated with model predictions, support comparison of model behaviour, reveal potential technical shortcuts, and generate hypotheses for biochemical or clinical investigation.
However, feature attribution is not equivalent to biochemical identification, causal inference, or biomarker validation. A highlighted Raman shift, wavelength, or spectral band reflects the behaviour of a specific model under a specific preprocessing pipeline, dataset composition, and explanation configuration. Its interpretation may be affected by correlated neighbouring variables, peak overlap, background selection, preprocessing choices, model dependence, and technical confounding. Therefore, visually plausible attribution maps should not be presented as direct evidence of molecular mechanisms or clinically actionable biomarkers without further validation.
This review proposes a five-step validation framework through which spectral XAI should be interpreted as a structured pathway from model relevance to increasingly defensible biochemical and biomarker-oriented claims. First, the underlying predictive model must be developed and evaluated using appropriate sample-level splitting and clinically relevant performance metrics. Second, attributed spectral regions should be tested for stability across repeated training, preprocessing choices, explanation settings, and, where possible, alternative model families. Third, interpretation should focus on meaningful spectral regions rather than isolated variables. Fourth, candidate biochemical assignments should be evaluated using spectroscopy knowledge, reference data, and domain expertise. Finally, stronger biomarker-oriented claims require independent analytical, biological, or clinical validation.
Under this framework, SHAP, LIME, gradient-based attribution, attention mechanisms, and perturbation-based methods should be regarded primarily as tools for model auditing and hypothesis generation. Their greatest value lies not in replacing biochemical analysis or clinical validation, but in helping researchers identify which parts of complex spectral signals deserve more rigorous investigation. Future progress will depend on correlation-aware explanation methods, transparent reporting, stability and faithfulness testing, external validation, and integration with complementary biological evidence.
By moving from isolated feature importance toward reproducible spectral-region interpretation and independent validation, explainable AI can help transform biomedical spectroscopy from a black-box predictive approach into a more transparent and clinically meaningful framework for diagnostic research and biomarker discovery.