Article

Addressing Class Imbalance in ECG Arrhythmia Classification Using Latent Diffusion and Quantum-Enhanced Generative Modeling

by
Georgios Kritopoulos
1,
Georgios Neofotistos
1,2,*,
Georgios D. Barmparis
1,3 and
Giorgos P. Tsironis
1,2,3
1
Department of Physics, University of Crete, 71003 Heraklion, Greece
2
John A. Paulson School of Engineering and Applied Sciences, Harvard University, Cambridge, MA 02138, USA
3
Institute of Electronic Structure and Laser (IESL), Foundation for Research and Technology Hellas (FORTH), 71110 Heraklion, Greece
*
Author to whom correspondence should be addressed.
AI Med. 2026, 1(3), 23; https://doi.org/10.3390/aimed1030023
Submission received: 19 April 2026 / Revised: 30 July 2026 / Accepted: 15 August 2026 / Published: 24 August 2026

Abstract

Class imbalance in clinical electrocardiogram (ECG) datasets limits the diagnostic sensitivity of automated arrhythmia classifiers, particularly for rare but clinically significant beat types. We propose a three-stage hybrid generative pipeline that combines a spectral-guided conditional variational autoencoder (cVAE), a class-conditional latent denoising diffusion probabilistic model (DDPM), and a Quantum Latent Refinement (QLR) module built on parameterized quantum circuits, implemented and evaluated using a classical quantum-circuit simulator, to augment minority arrhythmia classes, and present results based on the MIT-BIH Arrhythmia Database. The QLR module applies a bounded residual correction guided by Maximum Mean Discrepancy minimization to align synthetic latent distributions with real class-specific latent banks. A lightweight 1D MobileNetV2 classifier evaluated over ten independent random seeds and four augmentation ratios serves as the downstream benchmark. Our findings establish latent diffusion augmentation as an effective strategy for imbalanced ECG classification. To our knowledge, the proposed QLR module is the first use of a parameterized quantum circuit as a distributional refiner within a generative augmentation pipeline. While its performance is comparable to that of the classical latent diffusion framework under the present experimental conditions, the proposed approach demonstrates the feasibility of integrating quantum latent operators into generative medical AI pipelines and provides a foundation for future investigations on quantum-enhanced representation learning and data augmentation.

1. Introduction

Cardiovascular diseases remain among the leading causes of mortality, and the electrocardiogram (ECG) is the principal non-invasive tool for their diagnosis [1]. By capturing the electrical activity of the heart as a time-series signal, the ECG encodes critical information about cardiac rhythm, conduction velocity, and myocardial repolarization [2], making it essential for identifying arrhythmias in both hospital and ambulatory settings [3]. Deep learning approaches—particularly convolutional neural networks (CNNs) [4,5] and recurrent architectures [6,7]—have demonstrated competitive performance on automated arrhythmia detection benchmarks [3]. The proliferation of wearable cardiac monitors capable of continuous ECG acquisition, generating high volumes of unlabeled data, has further elevated the need for computationally efficient classifiers that are sensitive enough to detect rare pathological events in real time [8].
Despite these advances, a fundamental problem remains: class imbalance. In physiological ECG datasets such as the MIT-BIH Arrhythmia Database [9], Normal sinus rhythm beats account for the overwhelming majority of all recorded beats, while clinically significant minority classes—Supraventricular ectopic beats, Ventricular ectopic beats, and Fusion beats—represent only a small fraction of the total (see Section 2.1 for a detailed description of beat classes). When standard classifiers undergo training on such distributions, they optimize global accuracy at the expense of per-class sensitivity. This phenomenon, known as the accuracy paradox [10], has been documented across medical machine learning applications: a model may exceed 94% test accuracy while correctly detecting only a small proportion of rare but life-threatening arrhythmia events. From a clinical standpoint this tradeoff is unacceptable. Macro F1, which computes the unweighted mean of per-class F1 scores, is therefore adopted as the primary evaluation metric, as it penalizes class-selective failure regardless of class frequency [11,12]. The clinical stakes are asymmetric. A missed ventricular ectopic beat may leave a patient at unrecognized risk for progression to ventricular tachycardia or fibrillation [13], whereas excessive false alarms from a low-precision classifier generate alert fatigue that progressively erodes clinician trust in automated monitoring systems [14].
Classical oversampling methods such as the Synthetic Minority Oversampling Technique (SMOTE) [15] partially address imbalance by generating interpolated minority samples, but linear interpolation in a high-dimensional signal space produces morphologically unrealistic beats that distort the training distribution and tend to degrade performance at high augmentation volumes [16]. Generative Adversarial Networks (GANs) offer a more principled approach but suffer from training instabilities—including mode collapse and blurry reconstructions—that limit their reliability in medical signal synthesis [17]. Denoising diffusion probabilistic models (DDPMs) [18] avoid many of these issues and have shown strong results in sequential data generation, but their computational demands at the raw signal level can be substantial for large-scale ECG databases [19,20].
Quantum Machine Learning (QML) has emerged as a distinct computational paradigm that operates in an exponentially large Hilbert space, potentially implementing feature maps with structured inductive biases that differ from those of classical networks [21]. Whether near-term quantum circuits offer practical computational advantages over classical alternatives remains an open and actively debated question—known challenges include barren plateau phenomena (the vanishing of parameter gradients in wide or deep quantum circuits [22]), concentration-of-measure effects, and the classical simulability of many shallow parameterized quantum-circuit (PQC) architectures—but hybrid quantum-classical designs provide a pragmatic route for exploring these properties under current hardware constraints [23,24]. In cardiac diagnostics, quantum-enhanced models have shown early exploratory results for arrhythmia classification [25,26,27,28] and for the generative augmentation of ECG signals [29], motivating further investigation of the architectural approach even as its computational advantages remain to be established [30,31].
This work proposes and evaluates a three-stage hybrid generative pipeline for imbalanced ECG arrhythmia classification. A spectral-guided cVAE first learns a compact latent representation of ECG beats. A class-conditional latent DDPM then synthesizes new minority class samples in that latent space, and a Quantum Latent Refinement (QLR) module applies a distributional correction to align synthetic latents with the real class-specific manifold. A lightweight 1D MobileNetV2 [32] classifier is trained on the augmented dataset and benchmarked against an unaugmented baseline, SMOTE, cVAE-only, and plain latent DDPM augmentation across ten random seeds and four augmentation ratios. A central goal of this work is to determine whether the quantum refinement stage offers a measurable advantage over its classical diffusion counterpart in this setting. A carefully validated answer to that question is, in our view, a contribution in its own right, since a properly powered test of this question has value independent of its outcome.

2. Materials and Methods

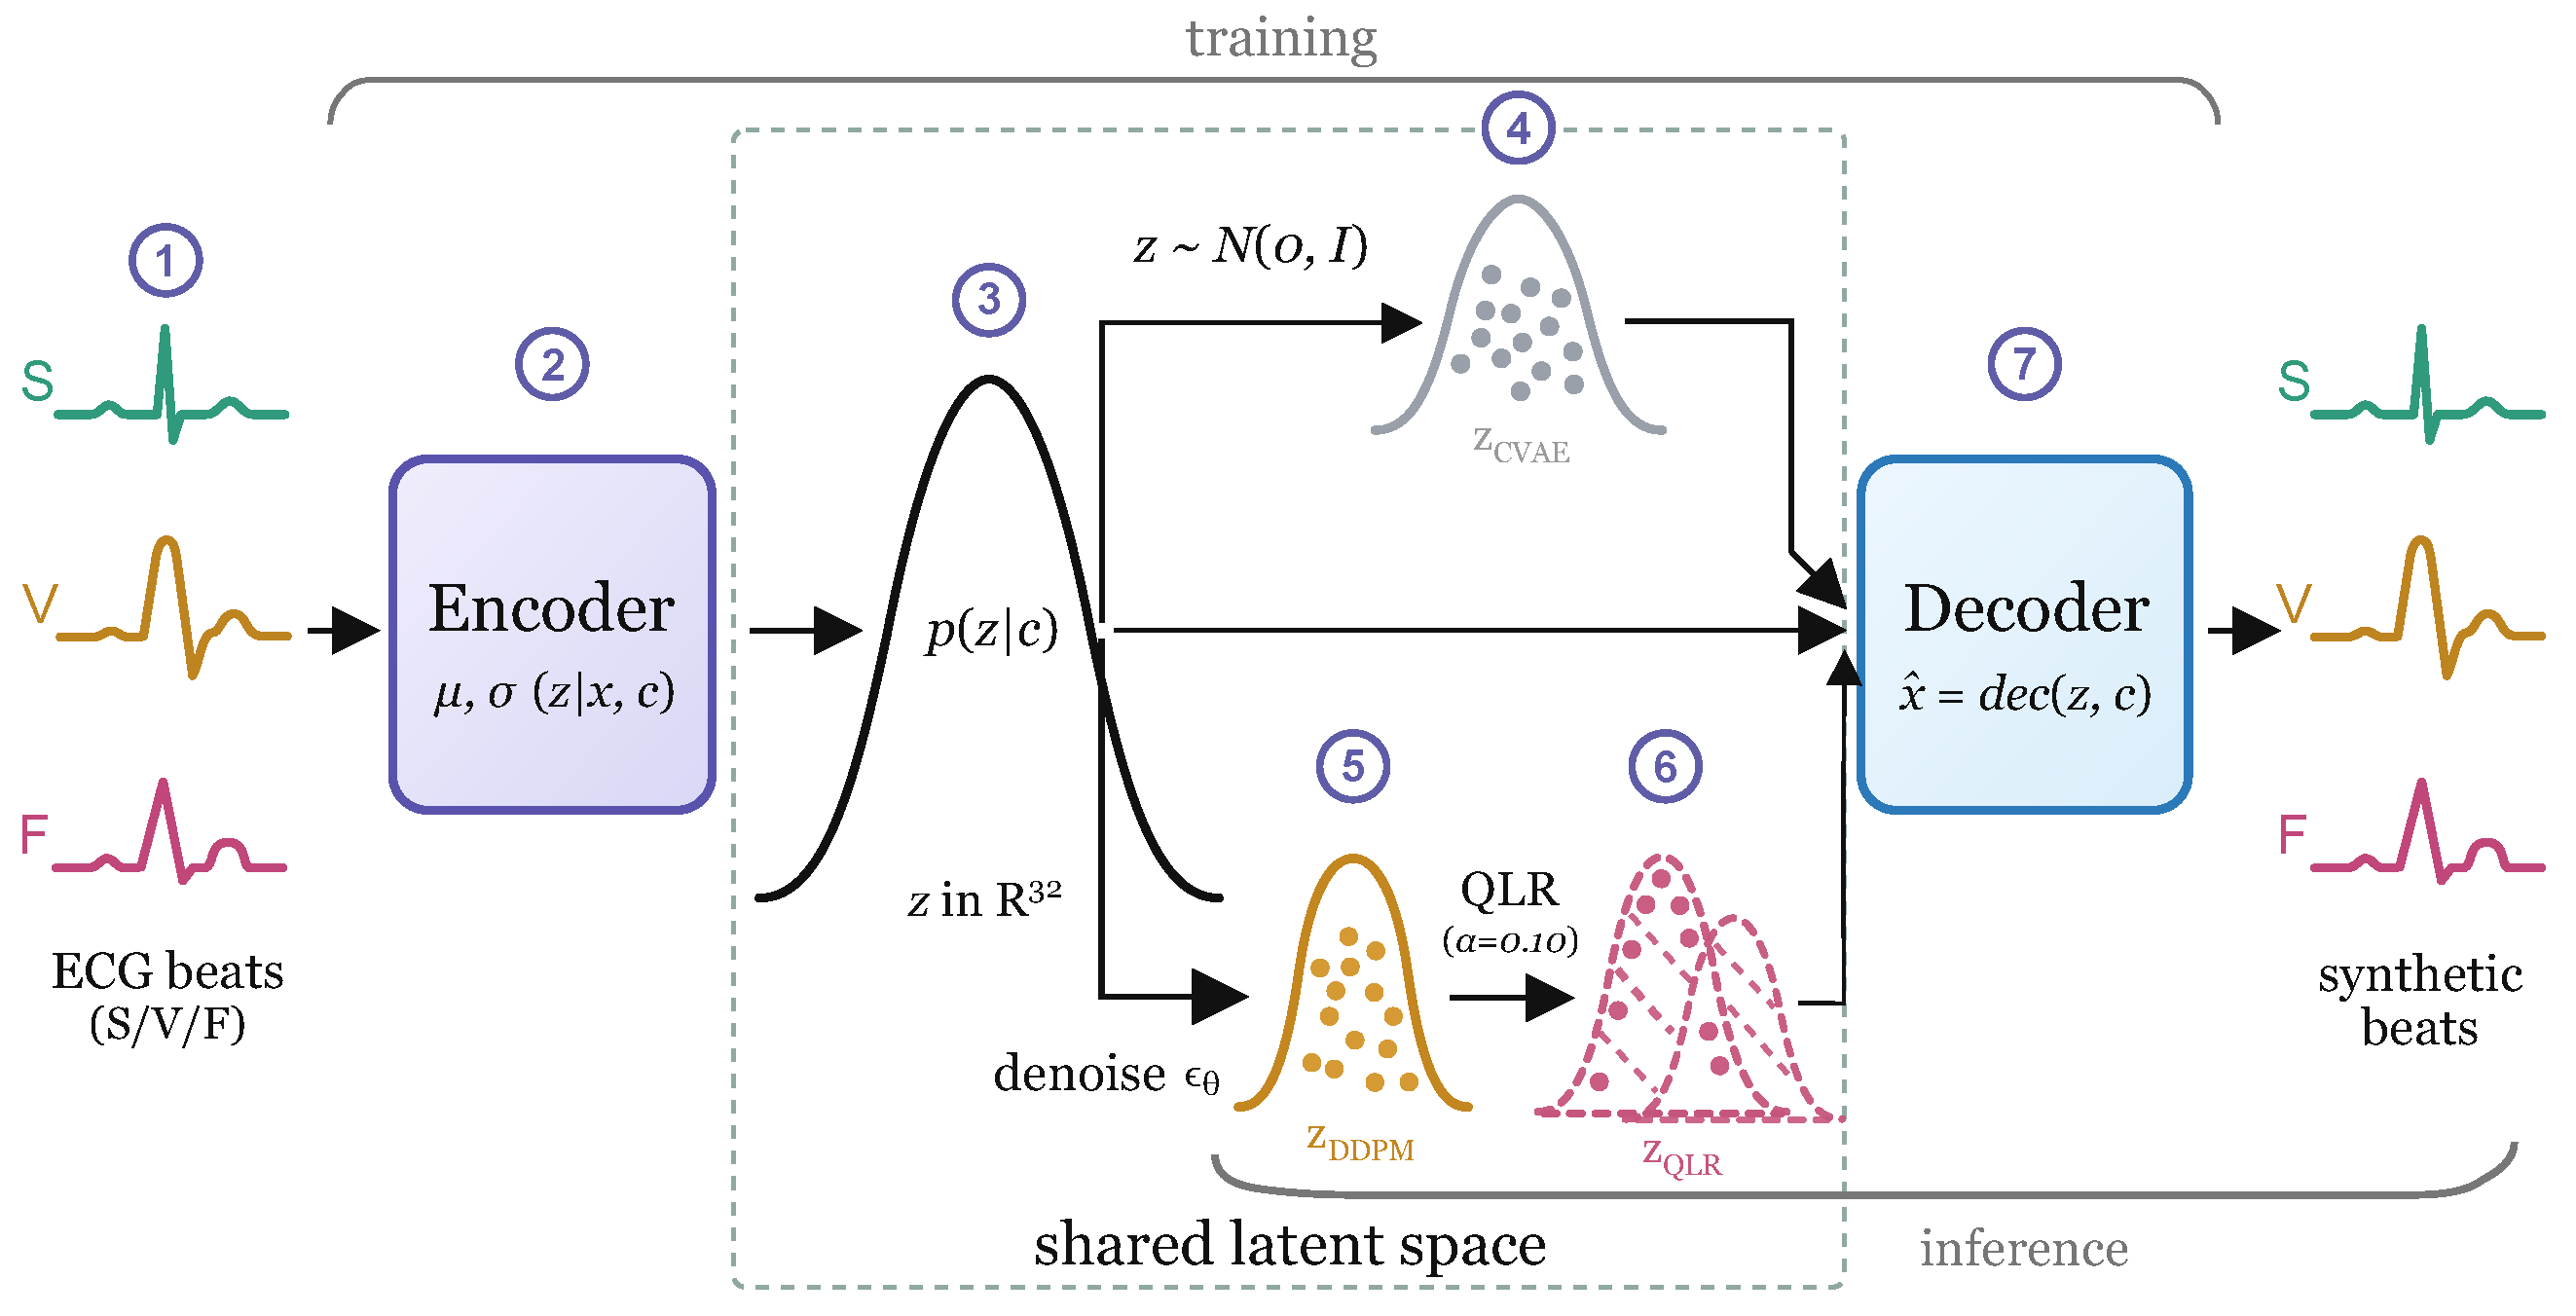
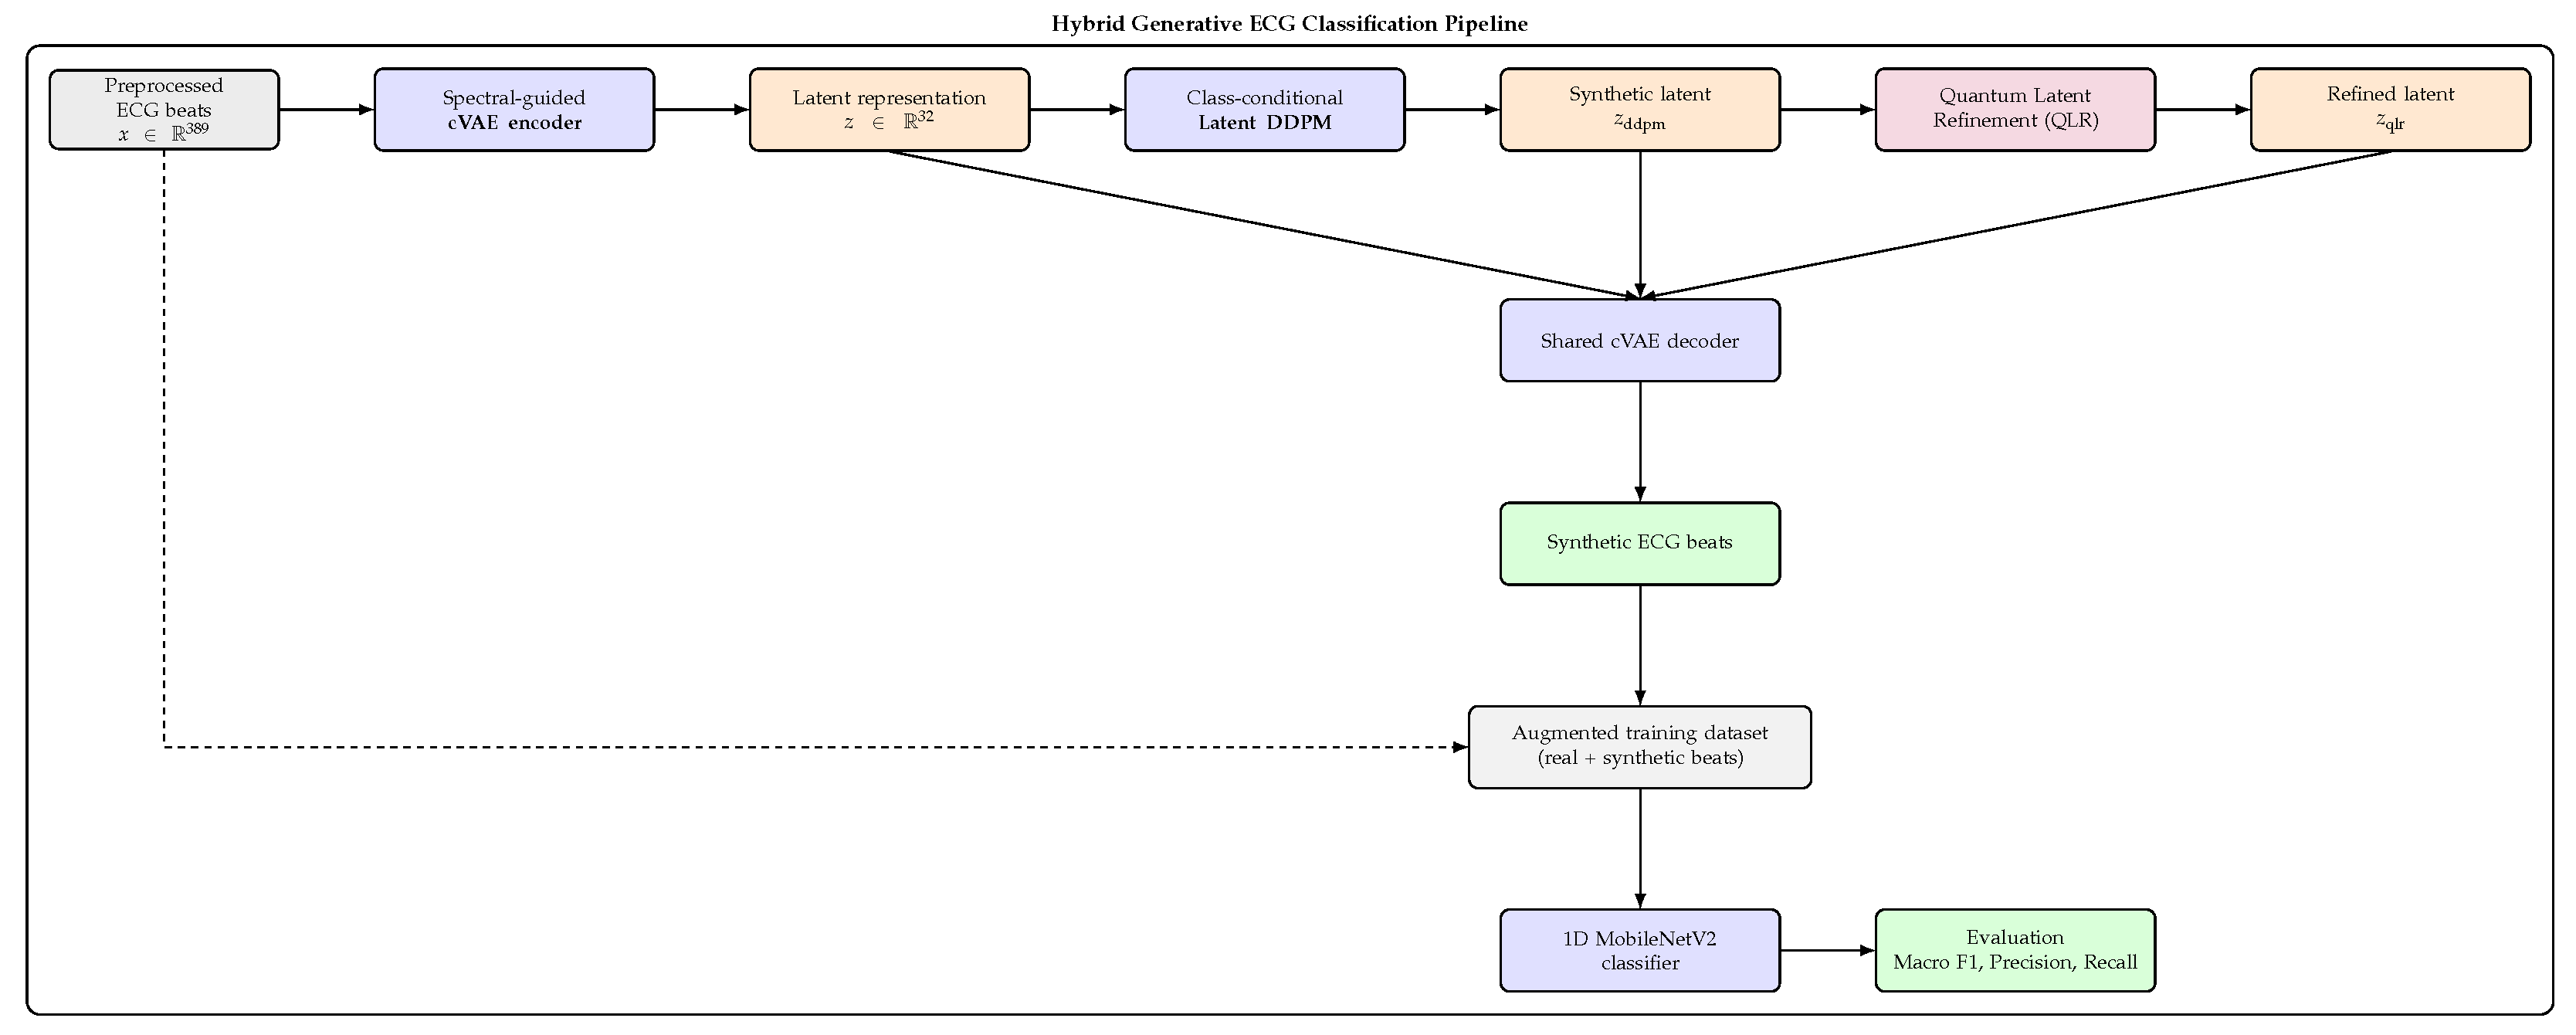
The proposed pipeline consists of three sequential generative stages, each building on the output of the previous one. First, a spectral-guided conditional variational autoencoder (cVAE) learns a compact 32-dimensional latent representation of ECG beats. Second, a class-conditional denoising diffusion probabilistic model (DDPM) is trained on these latent vectors to generate new synthetic minority class samples. Third, a Quantum Latent Refinement (QLR) module—built on a parameterized quantum circuit—applies a bounded distributional correction to align the DDPM-generated latents with the real class-specific latent manifold. A lightweight 1D MobileNetV2 classifier is then trained on the real beats augmented by synthetic ones and evaluated using Macro F1. Each component is described in detail in Section 2.3, Section 2.4, Section 2.5 and Section 2.6 with the latent space/generative flow and the complete pipeline architecture illustrated alongside the corresponding stage below.

2.1. Dataset and Clinical Context

The experimental data were obtained from the MIT-BIH Arrhythmia Database, a widely adopted benchmark for cardiac arrhythmia research comprising 48 half-hour two-channel ambulatory ECG recordings sampled at 360 Hz [9]. Recordings were collected at Beth Israel Hospital from patients referred for extended ambulatory monitoring and represent a broad clinical spectrum of cardiac rhythms. Records 102, 104, 107, and 217—which contain exclusively pacemaker-stimulated beats—were excluded, as paced QRS morphologies reflect artificial depolarization sequences and are not representative of spontaneous arrhythmia.
Beat annotations were mapped to the four standard clinical categories defined by the Association for the Advancement of Medical Instrumentation (AAMI) [33], each corresponding to a distinct electrophysiological mechanism:
  • Class N (Normal): Sinus rhythm beats and bundle-branch block beats whose QRS morphology is characteristic for that patient. Depolarization originates at the sinoatrial node, propagates normally through the atrioventricular (AV) node and His-Purkinje system, and produces a narrow QRS complex with a regular PR interval.
  • Class S (Supraventricular ectopic): Premature beats originating above the bundle of His, encompassing premature atrial contractions (PACs) and junctional beats. S -class beats typically produce a narrow or slightly aberrant QRS complex preceded by an early, absent, or retrograde P wave. Clinically, frequent supraventricular ectopy may serve as an early marker for paroxysmal atrial fibrillation risk [34] and warrants monitoring in symptomatic patients.
  • Class V (Ventricular ectopic): Premature beats arising from an ectopic focus within the ventricular myocardium, bypassing the normal conduction system entirely. These produce a wide ( > 120   m s ), bizarrely shaped QRS complex with a compensatory pause and a discordant T wave. Frequent or complex ventricular ectopy—particularly multiform beats, bigeminy, or runs of non-sustained ventricular tachycardia—carries independent prognostic significance [13] and may require clinical intervention, including antiarrhythmic therapy or catheter ablation.
  • Class F (Fusion): Beats resulting from near-simultaneous ventricular activation by both a normal sinus impulse and a ventricular ectopic impulse. The QRS morphology is intermediate between a normal and a ventricular beat, reflecting the hybrid electrical origin. Fusion beats indicate the presence of an active ventricular ectopic focus and are a key distinguishing feature in the differential diagnosis of wide-complex tachycardias.
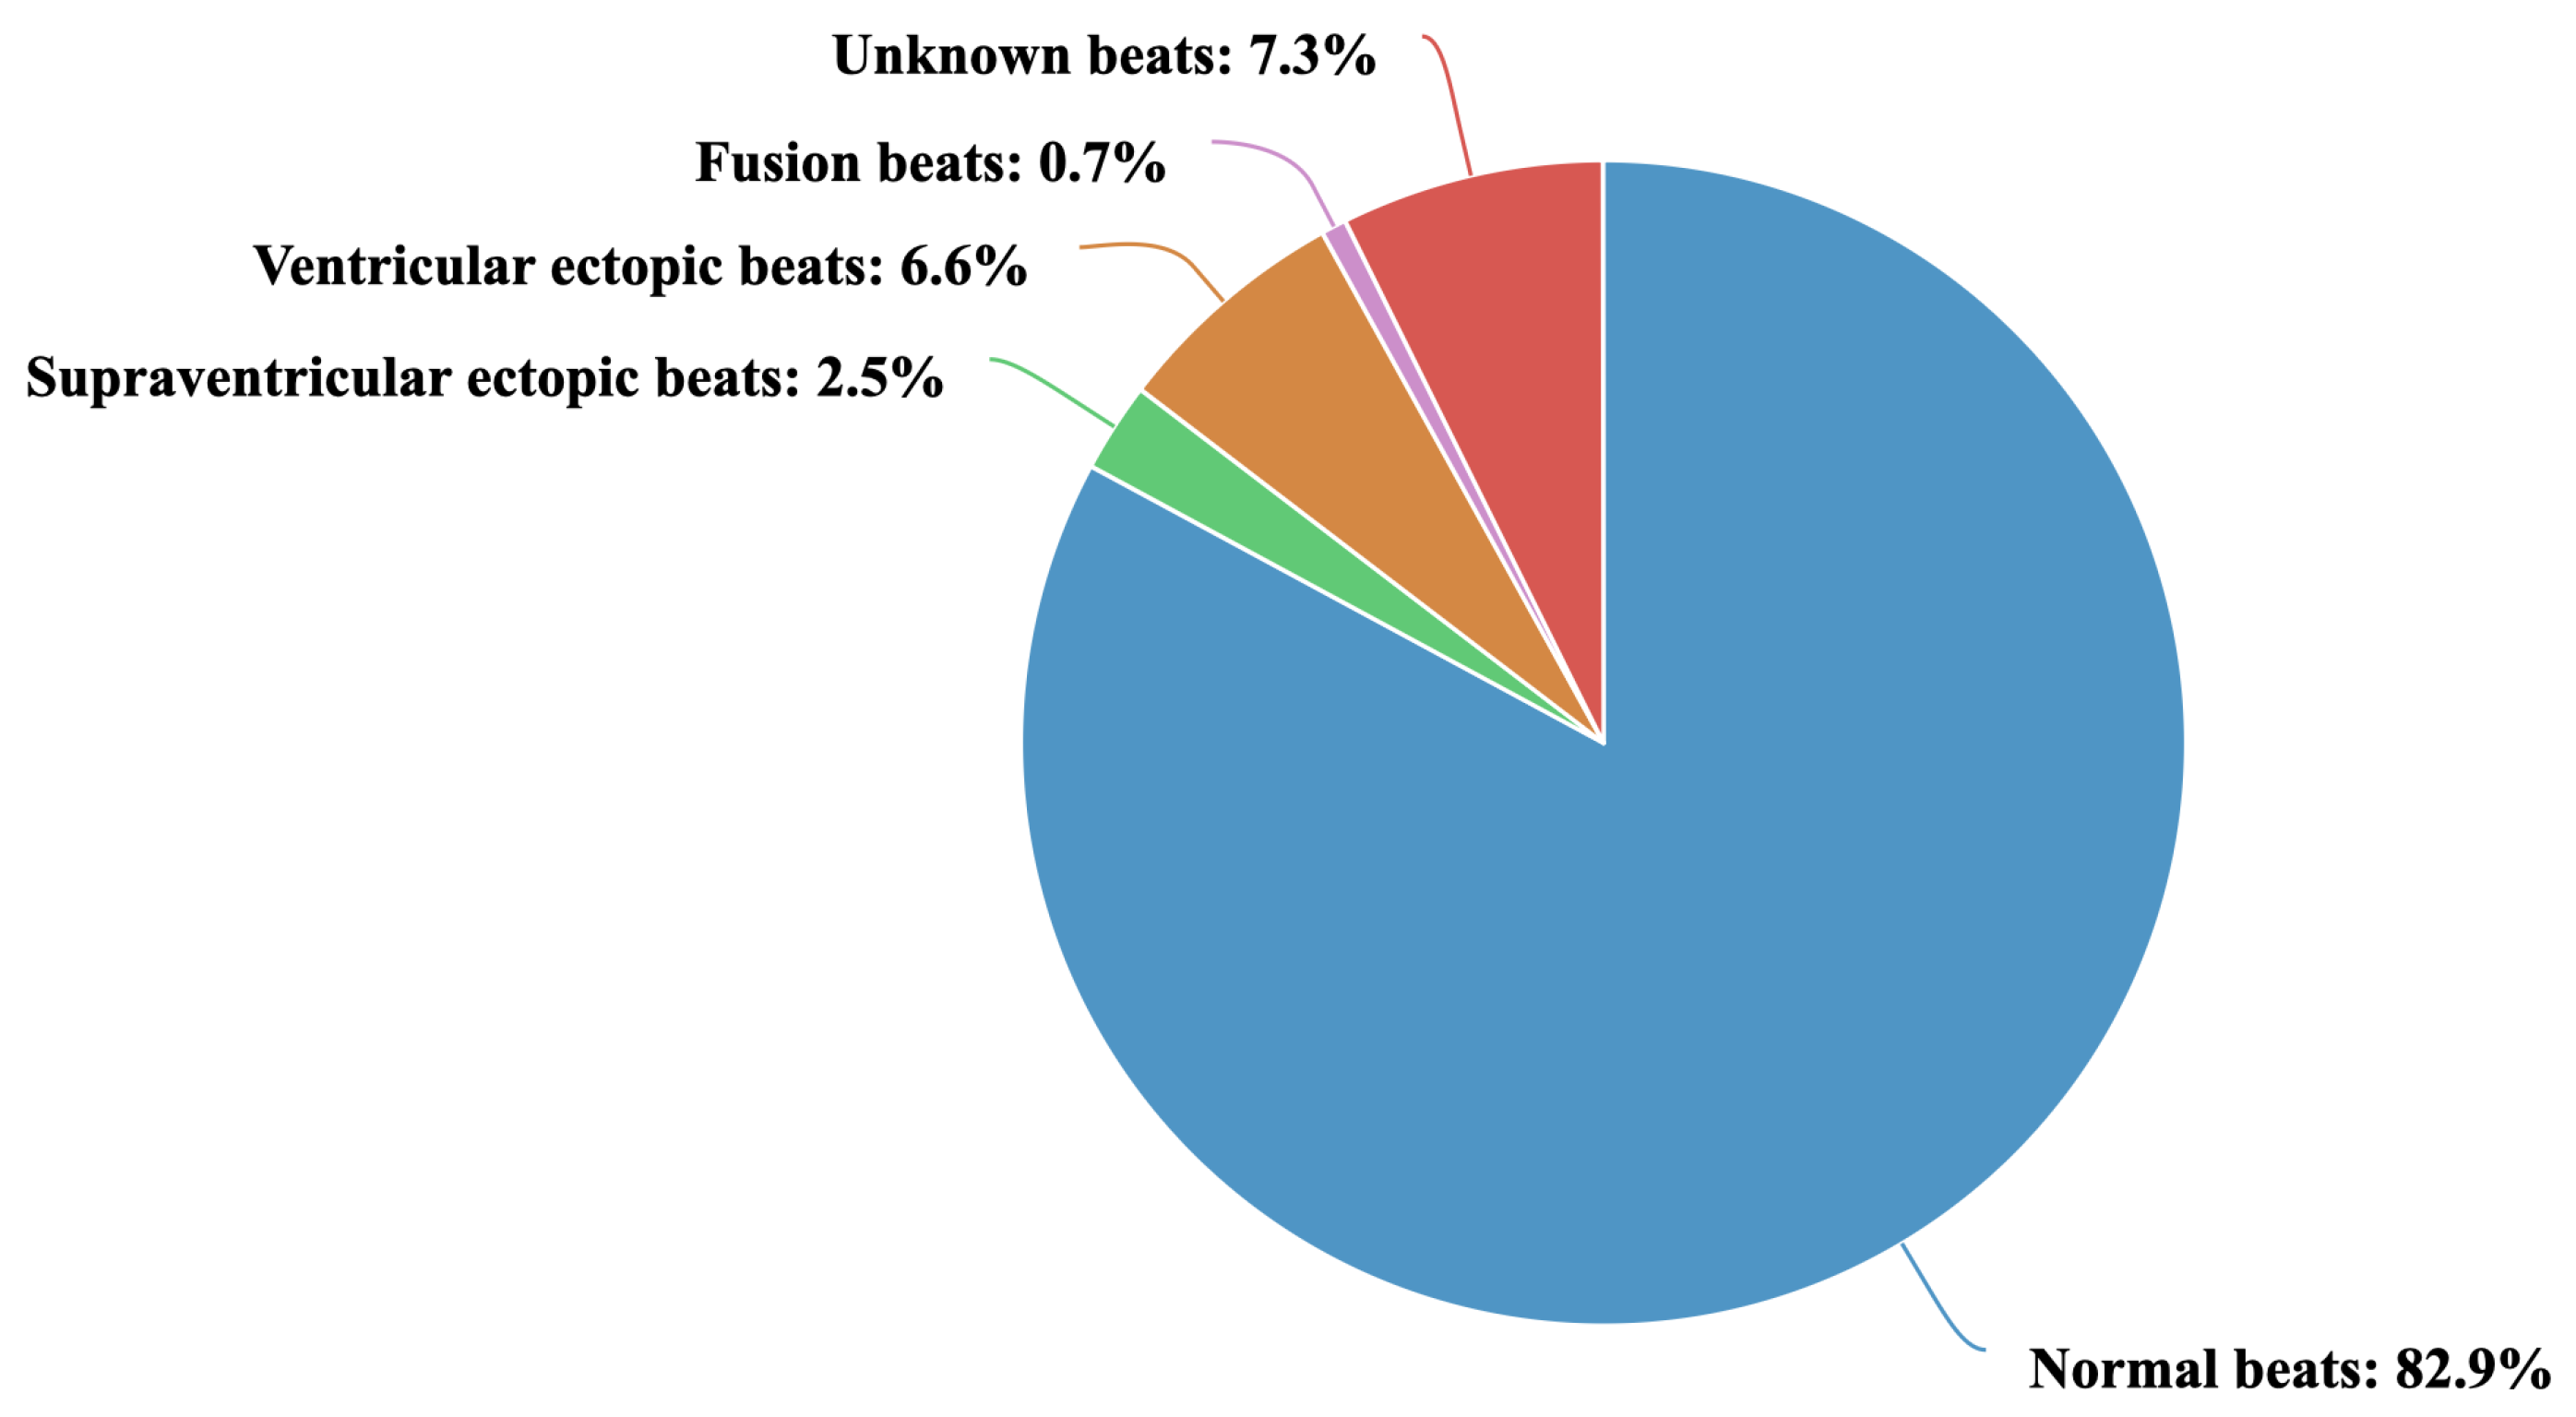
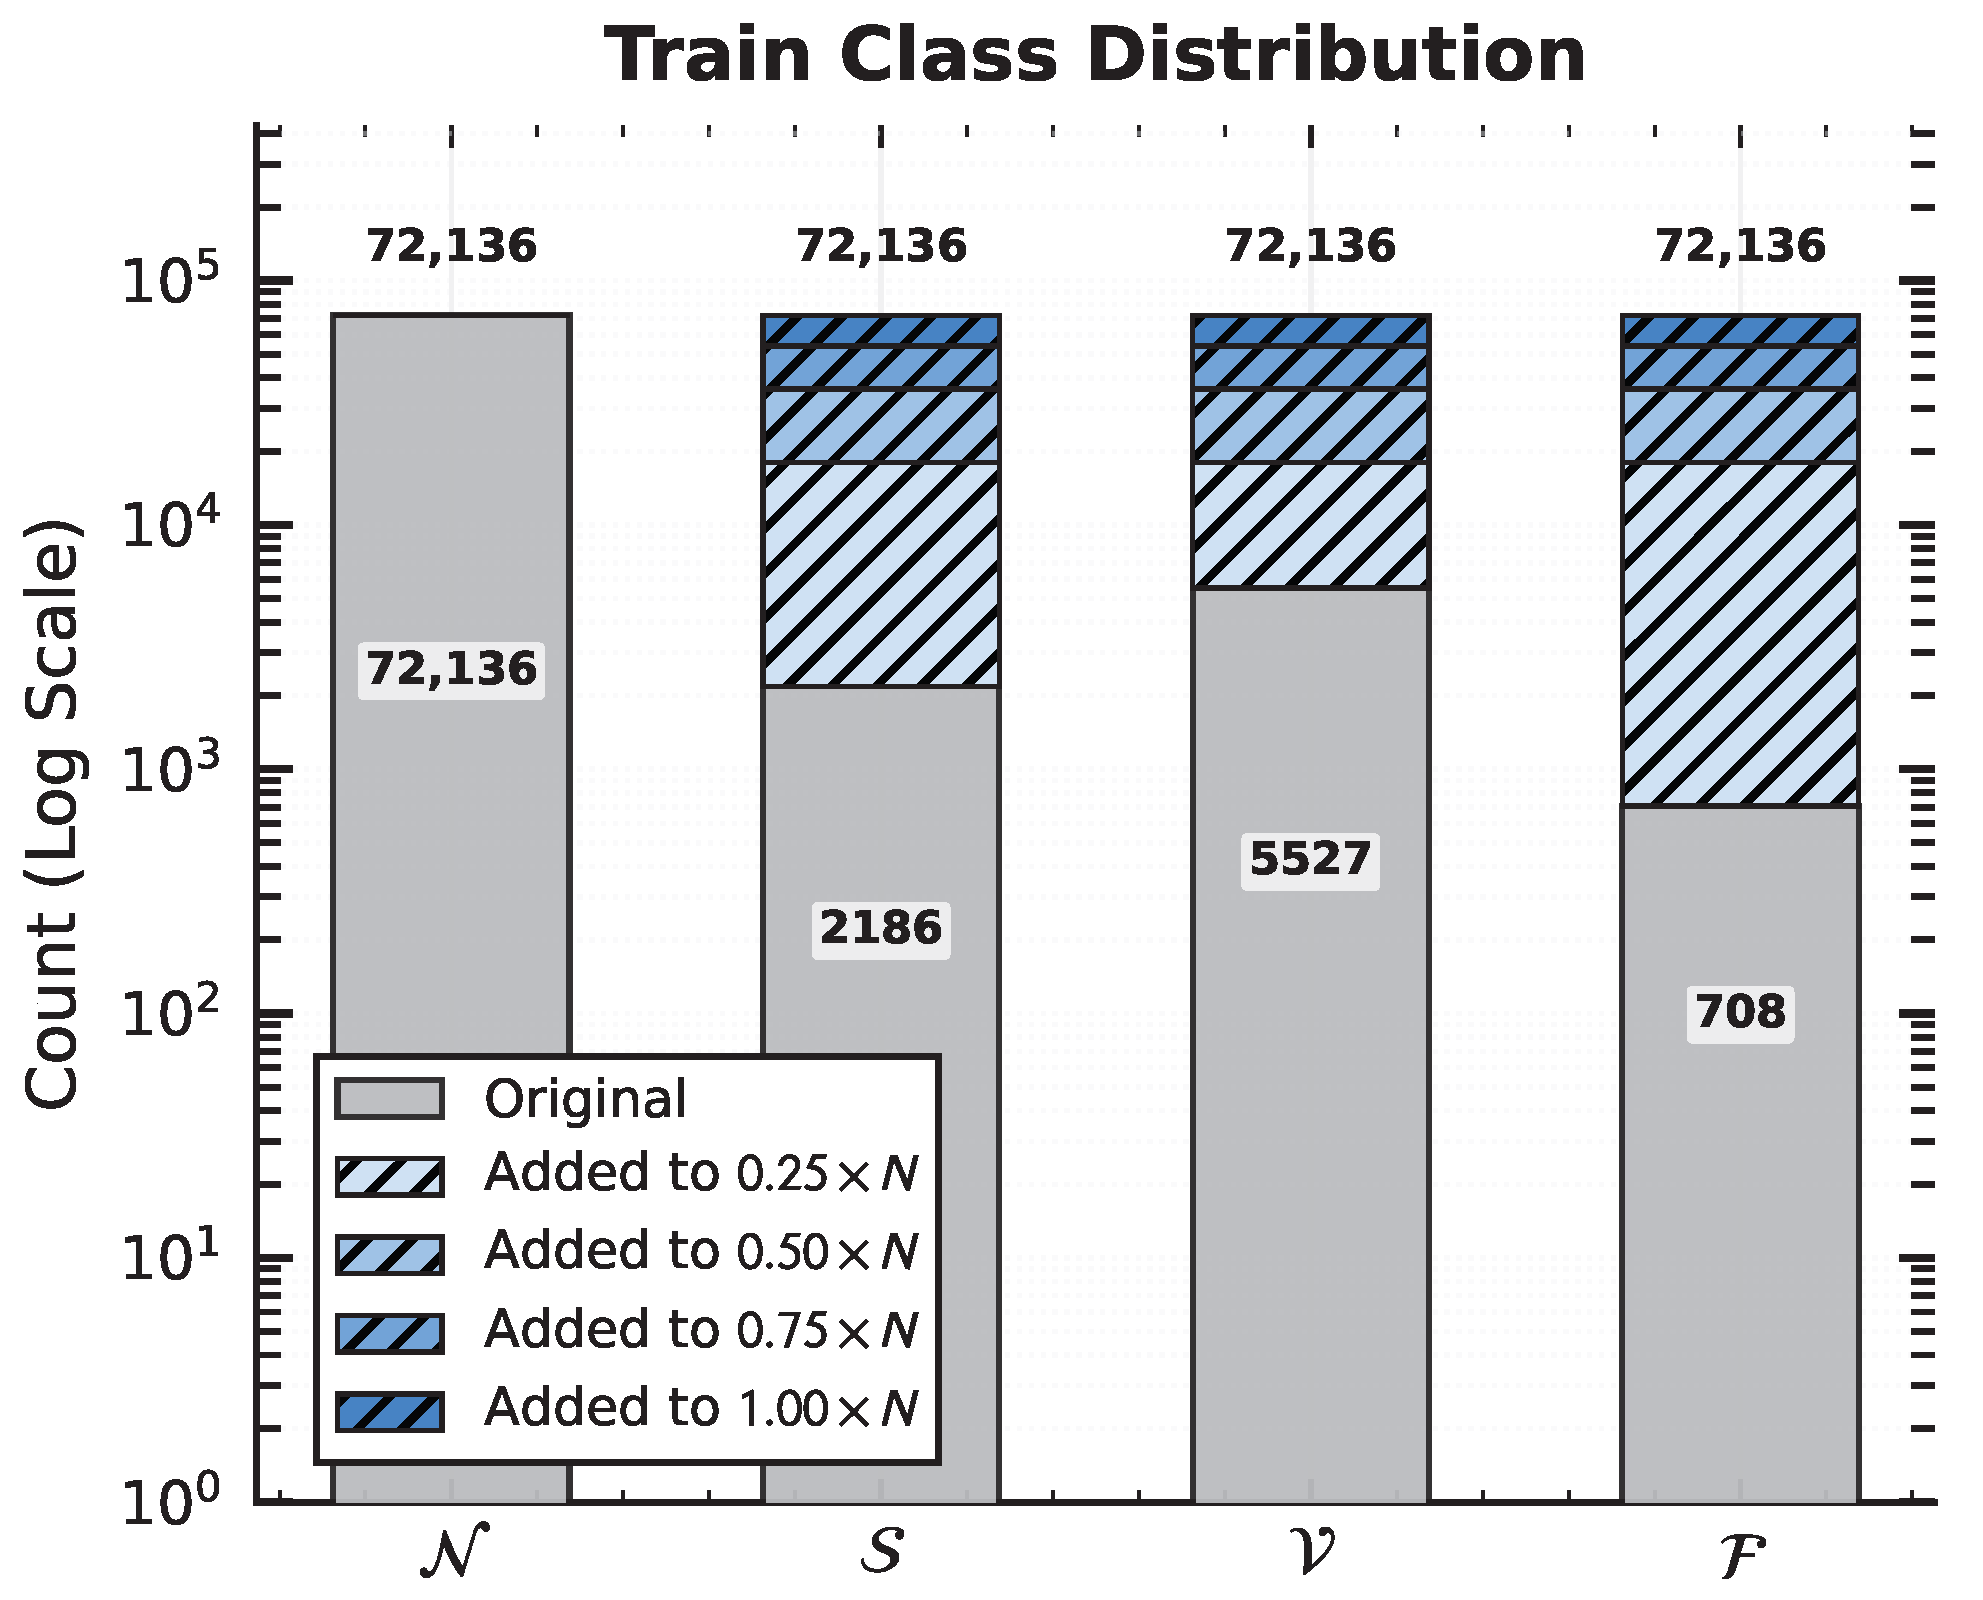
Non-beat annotations and the unknown class were discarded. The resulting dataset exhibits pronounced class imbalance: Class N constitutes 89.4% of all annotated beats, while the minority classes S (2.7%), V (7.2%), and F (0.76%) together account for only 10.6% of the total (Figure 1). This distribution reflects the clinical reality of ambulatory monitoring, in which pathological events are inherently rare relative to a background of normal sinus rhythm, and constitutes the primary motivation for the generative augmentation pipeline developed in this work.
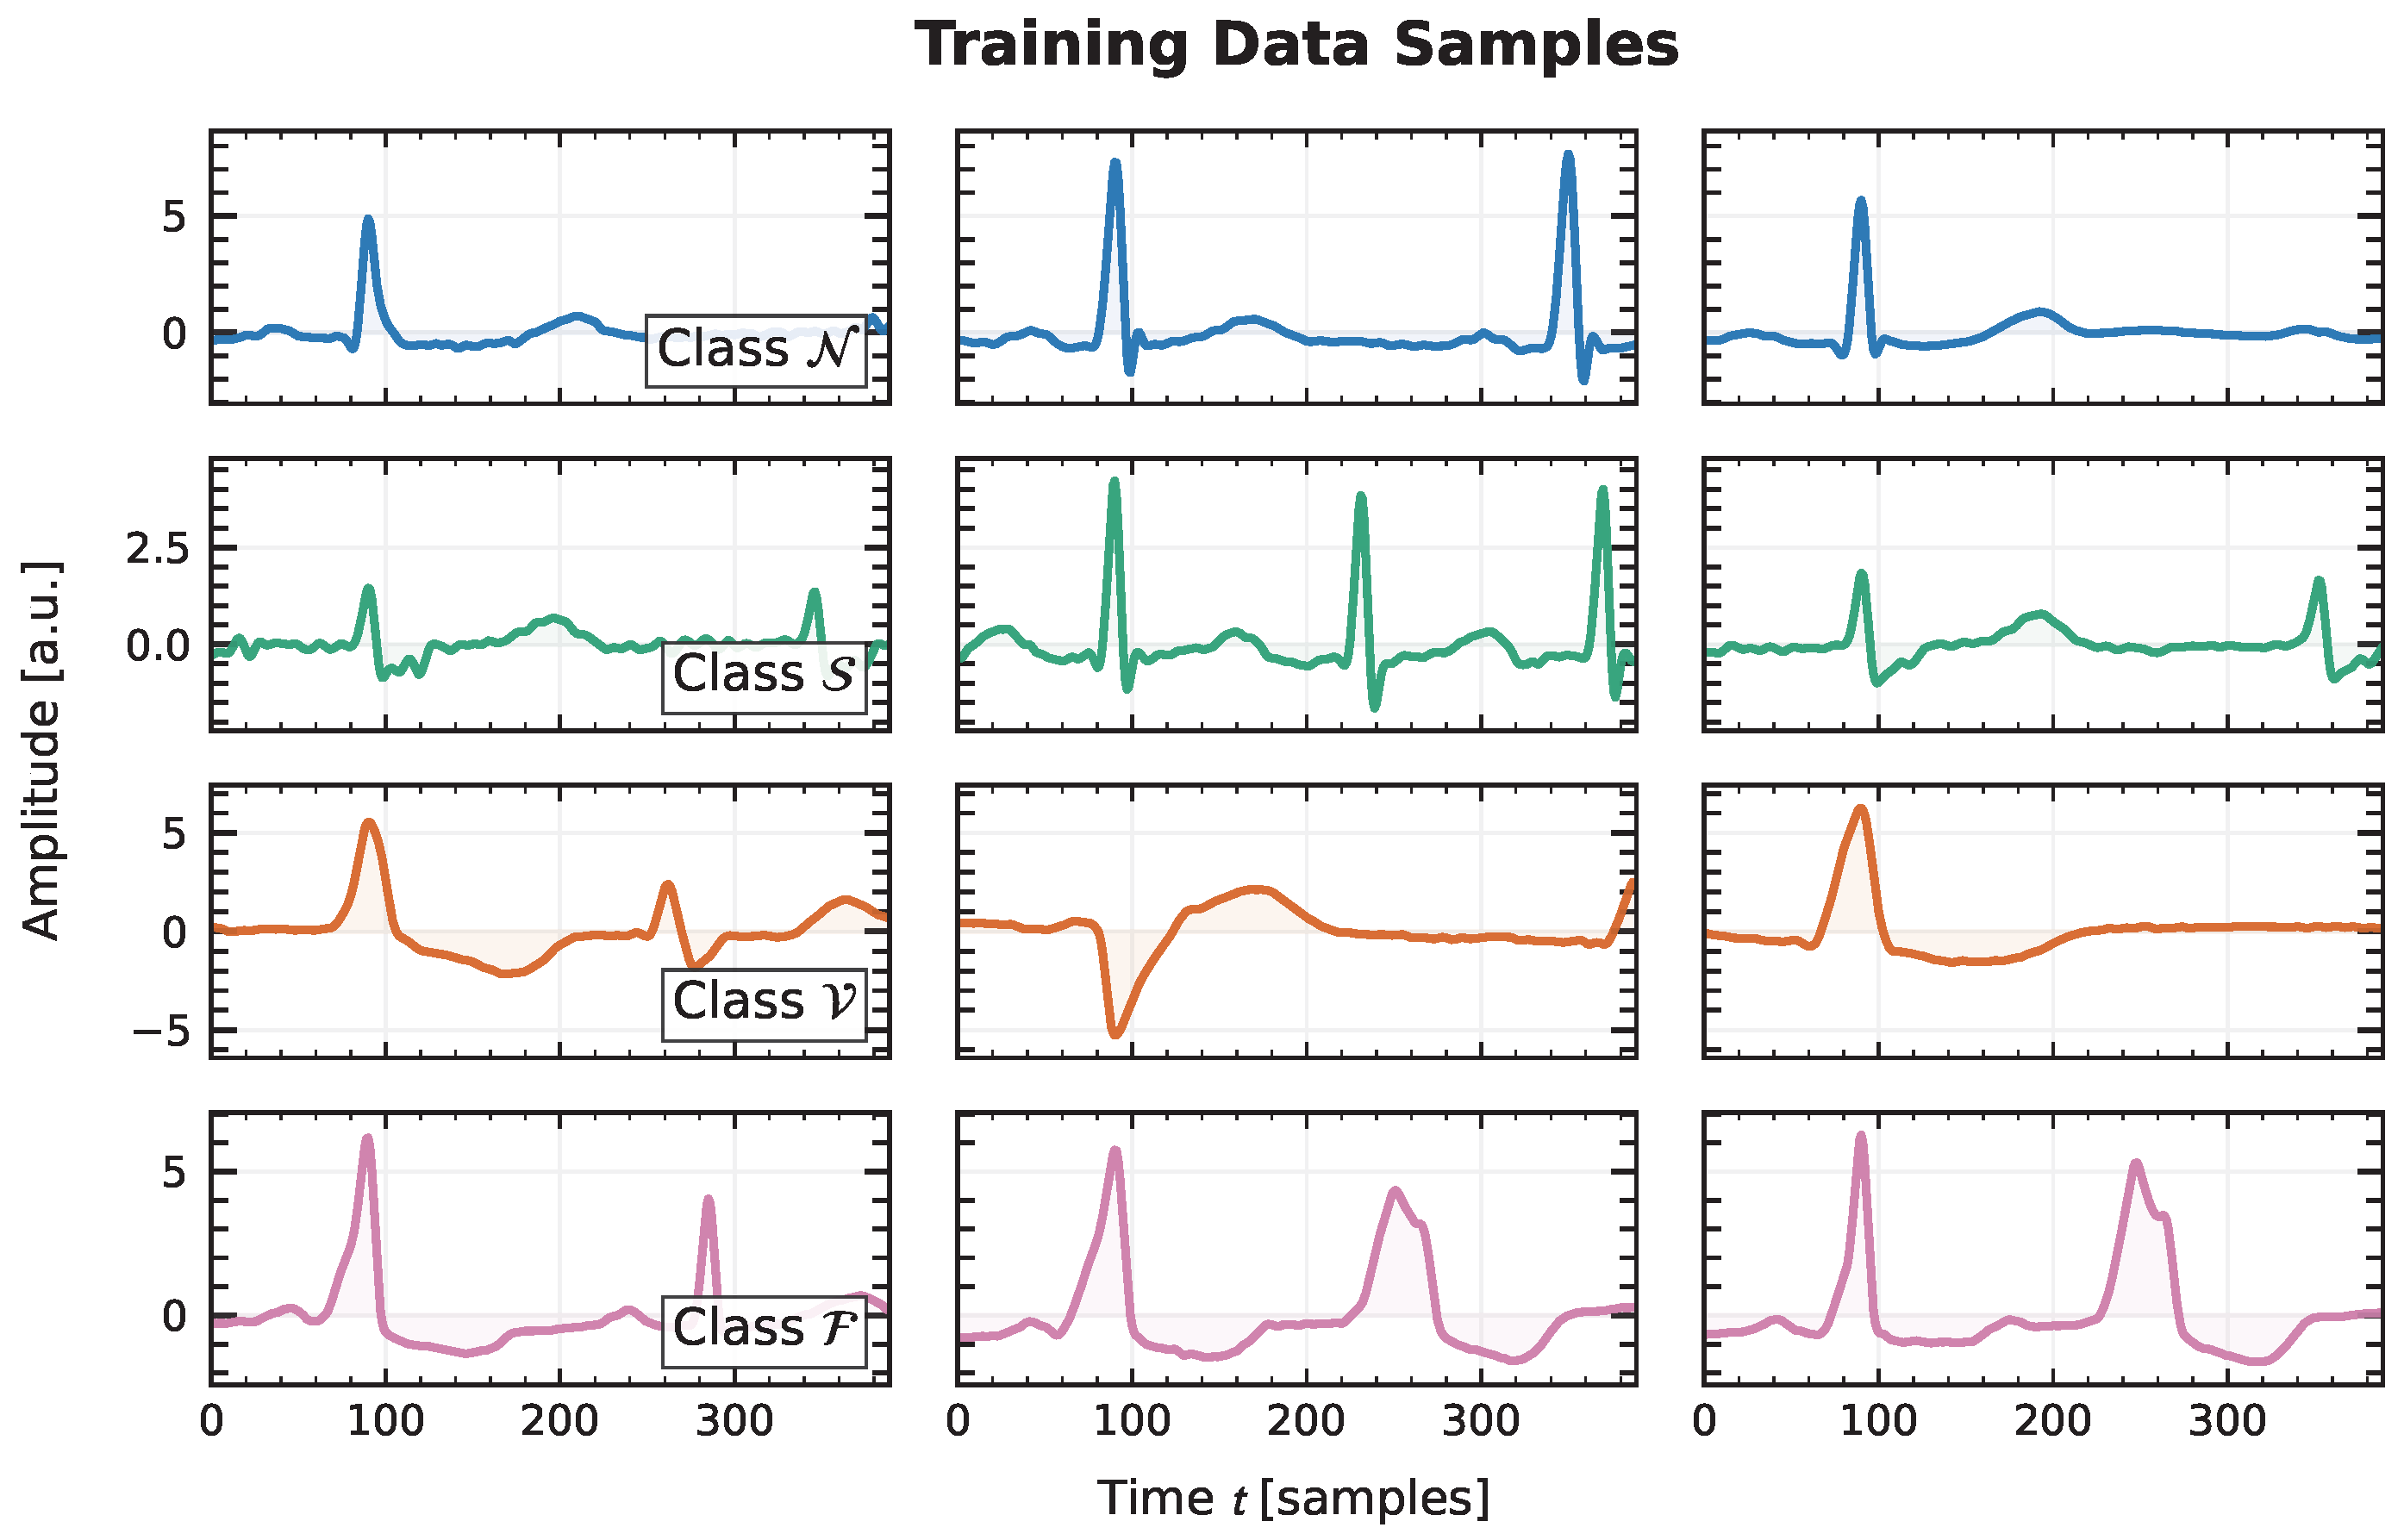
The experimental design emulates a personalized wearable monitoring scenario in which a cardiac monitor is calibrated to a specific patient’s baseline rhythm before being deployed to detect arrhythmic events. An intra-patient temporal split is employed. For each record, the first 80% of beats are allocated to training and validation (80% training; 10% validation) and the final 10% to testing. This ensures that the classifier is evaluated on later segments of the same patient’s recording, which may exhibit morphological drift relative to the calibration window and thus constitutes a realistic test of personalized monitoring performance. Crucially, the split is applied independently within each record before any cross-record aggregation, so no beat from any patient’s test window is ever seen during training or validation of the generative models or the classifier. This design eliminates the intra-patient data leakage that arises when beats from the same recording are randomly shuffled and partitioned globally. After aggregation across all 44 retained records, the resulting real-beat counts per class and partition are given in Table 1, and representative training beats for each AAMI class are shown in Figure 2. Figure 3 illustrates how the four augmentation ratios ρ { 0.25 , 0.50 , 0.75 , 1.00 } translate into concrete training set sizes; at ρ = 1.00 , for example, the pipeline synthesizes nearly 70,000 additional supraventricular samples from only 2186 real S -class beats, underscoring the severity of the minority class deficit.
2.2. Signal Preprocessing

A second-order Butterworth bandpass filter with cutoff frequencies of 0.5   Hz and 45 Hz was applied to each ECG channel before any further processing. The lower cutoff eliminates baseline wander—the low-frequency drift artifact produced by patient respiration and electrode movement that is especially prevalent in ambulatory recordings—while the upper cutoff suppresses high-frequency skeletal muscle (EMG) noise. These bounds are consistent with standard clinical ECG processing guidelines and preserve all diagnostically relevant waveform components, the P wave (0.5–4 Hz), the QRS complex (3–40 Hz), and the T wave (0.5–10 Hz), including the high-frequency notches within the QRS that may signal bundle-branch conduction abnormalities.
Individual beats were extracted using annotation-guided windowing, centered on each annotated R-peak with a fixed window of 389 samples (≈ 0.25   s pre-peak; 0.83   s post-peak) [35]. The window boundaries were chosen to guarantee complete capture of the P-QRS-T complex across all four AAMI beat classes. The extended post-R-peak interval of 0.83   s accommodates prolonged QT intervals—as seen in patients receiving QT-prolonging antiarrhythmic agents or in congenital long QT syndrome—ensuring that T-wave offset is preserved in every extracted beat.
Global Z-score normalization was applied using the mean and standard deviation computed from the training set ( μ train , σ train ) rather than on a per-beat basis. Local per-beat normalization would destroy relative amplitude information that is clinically diagnostic. Ventricular ectopic beats are frequently identified by high-voltage, wide QRS complexes, and ischemic changes present as subtle but critical ST-segment depressions or elevations. By normalizing with training set statistics, inter-class amplitude relationships are preserved, maintaining the voltage features that differentiate arrhythmia types and are essential for any deep learning model trained on this representation.

2.3. Hybrid Conditional Variational Autoencoder (cVAE)

A variational autoencoder (VAE) [36] learns a compressed representation of its inputs: the encoder maps each input to a point in a low-dimensional latent space, and the decoder reconstructs the original signal from that point. Building upon prior VAE architectures for ECG representation learning [37], the conditional variant (cVAE) developed here additionally conditions both the encoder and decoder on a class label, organizing the latent space by arrhythmia type. Performing all subsequent generation in this latent space—rather than directly on the raw 389-sample signal—allows for the downstream diffusion model to operate in a far lower-dimensional and more structured domain, making both training and sampling substantially more efficient than raw signal generation. The first stage of the pipeline therefore compresses each 389-sample ECG beat into a compact 32-dimensional latent vector z using a spectral-guided cVAE.
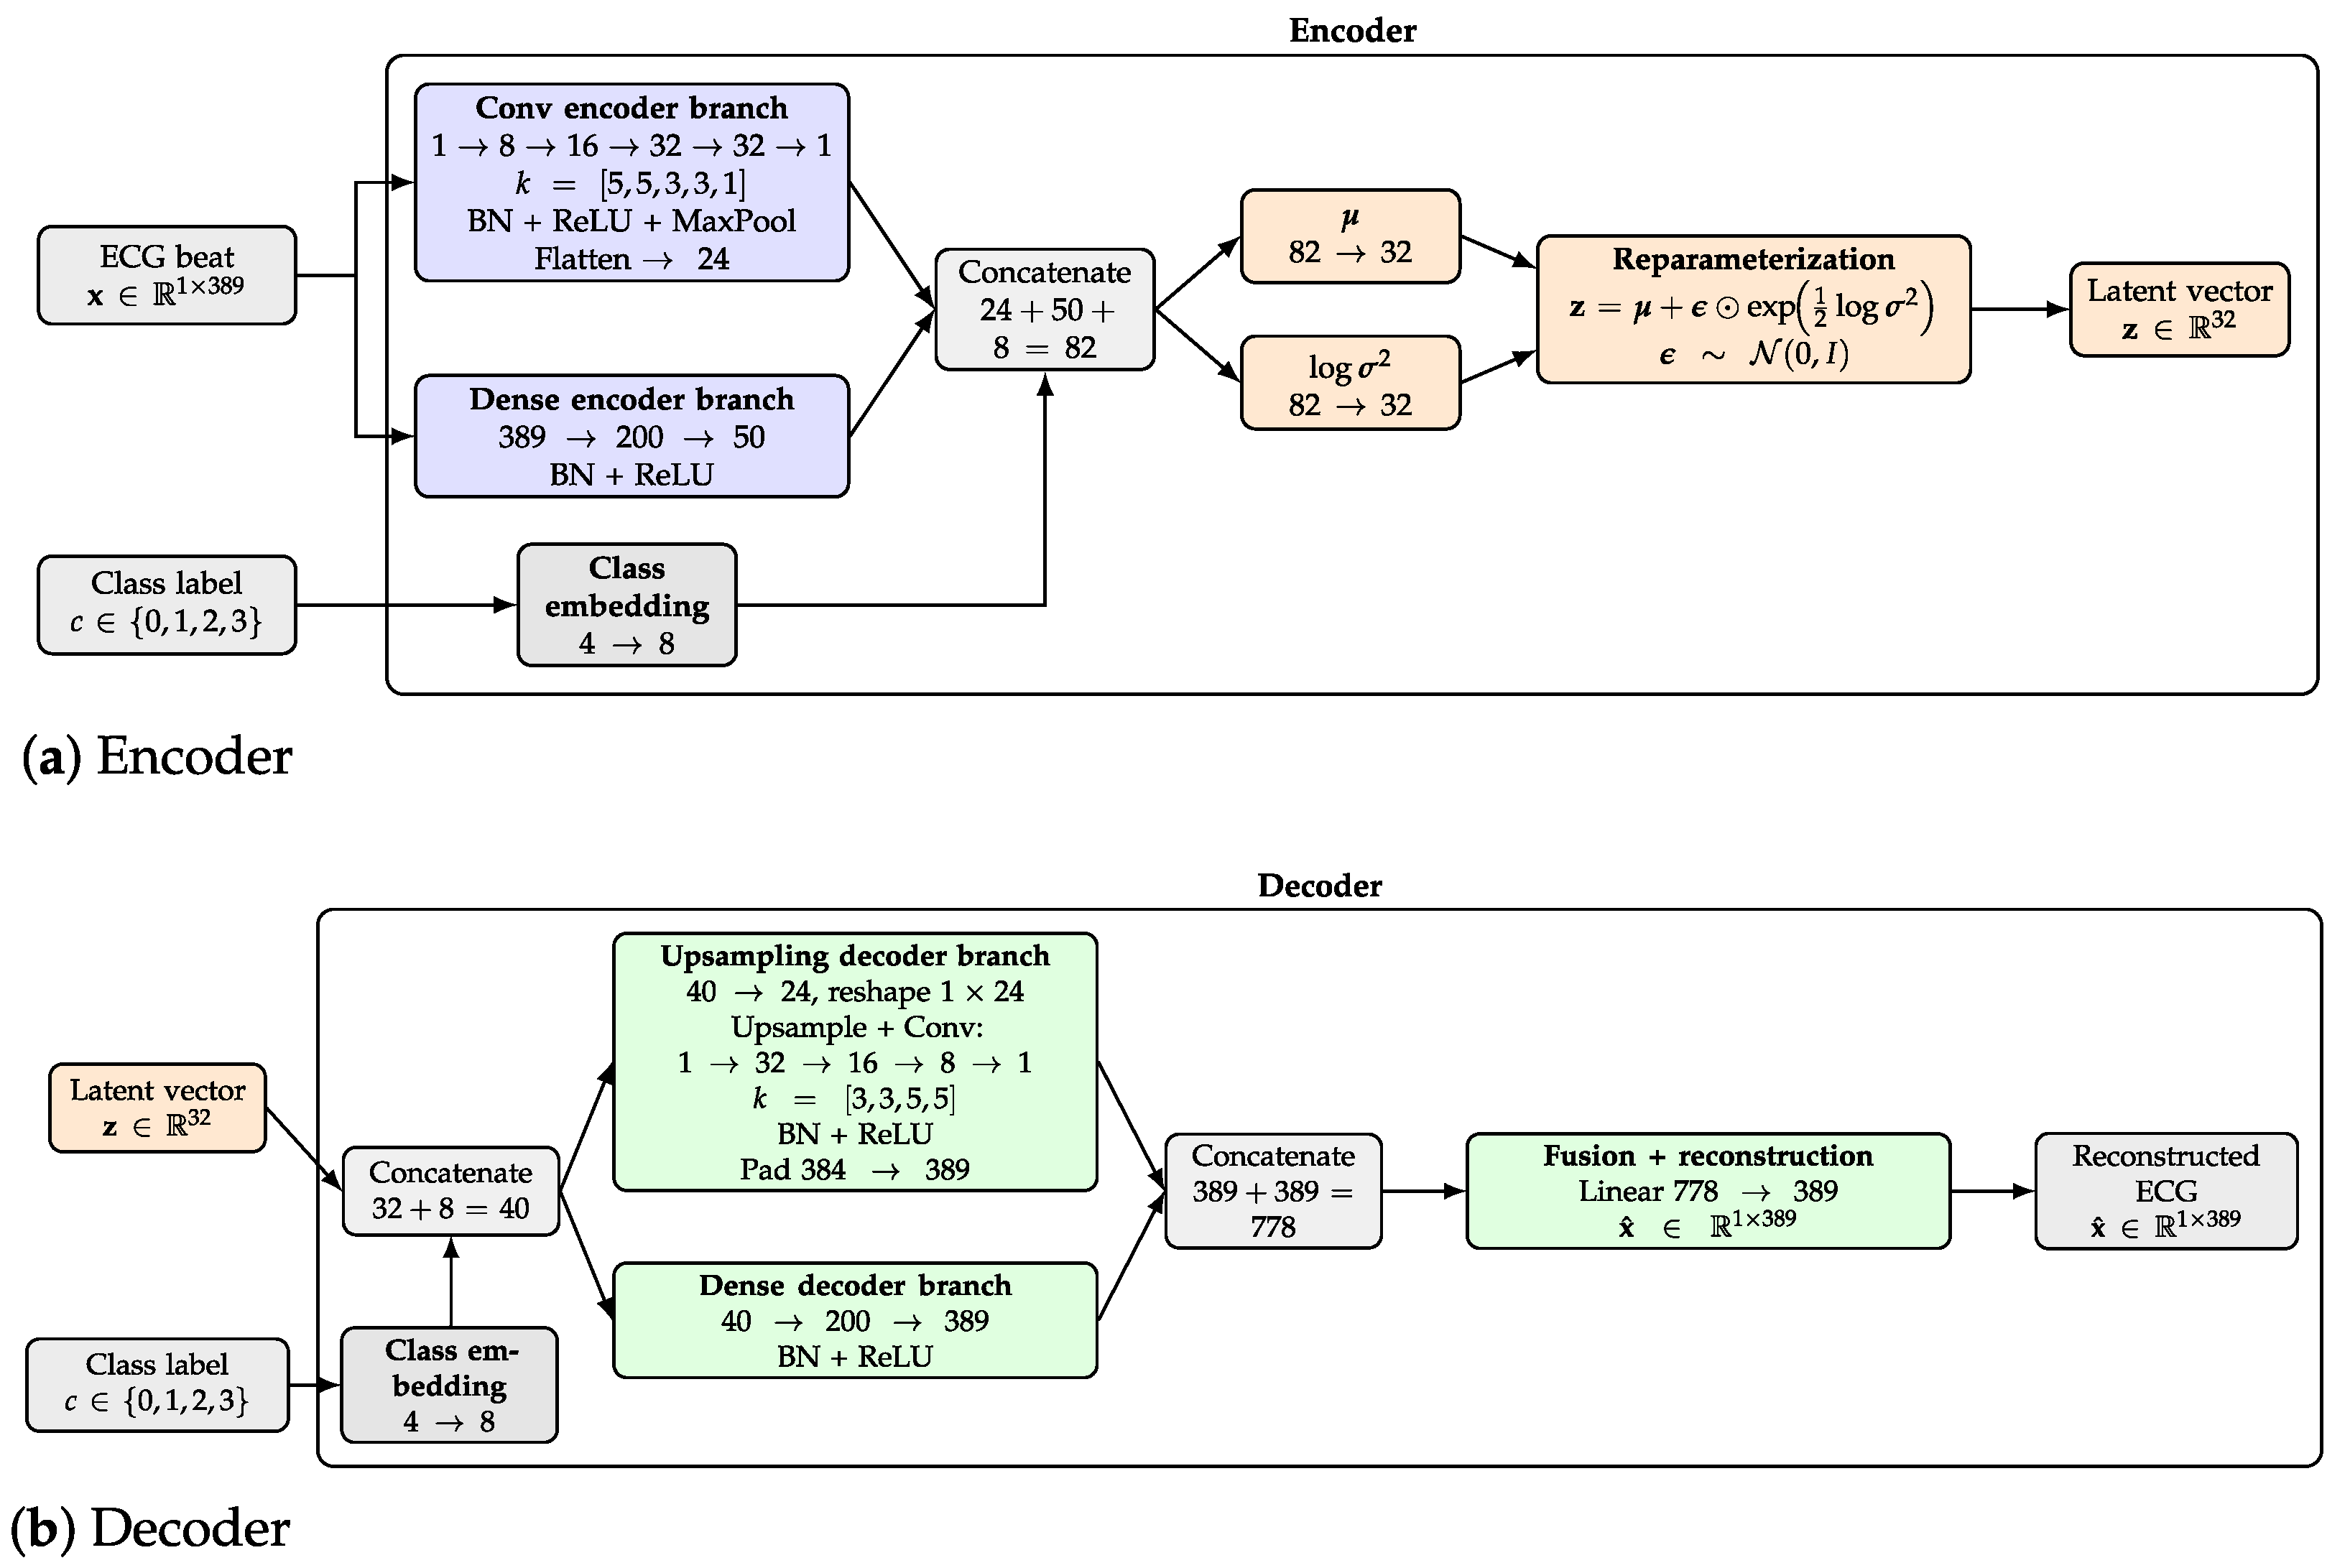
The encoder combines a convolutional branch (local morphological structure) with a dense branch (global waveform context), concatenated with a learned class embedding to predict the latent mean μ and log-variance log σ 2 . The decoder mirrors this with a complementary upsampling-convolutional and dense reconstruction path. Full layer-by-layer dimensions are given in Appendix A, Figure A1.
The cVAE is trained with an ELBO extended with a spectral consistency term:
L cVAE = x x ^ 2 + F ( x ) F ( x ^ ) 1 + β D KL q ( z | x , c ) N ( 0 , I )
where F ( · ) denotes the discrete Fourier transform magnitude. The spectral loss term explicitly penalizes frequency-domain discrepancies between real and reconstructed beats—particularly important for ECG signals, where diagnostic information spans heterogeneous frequency bands. The high-frequency notches of the QRS complex must be reproduced faithfully alongside the low-frequency arc of the T wave. Without this term, reconstruction tends to over-smooth high-frequency morphological detail in favor of minimizing the global MSE.
The KL weight β is linearly annealed from 0 to 0.05 over the first 40 training epochs and then held constant, preventing posterior collapse [38] (the failure mode in which the encoder ignores the input and maps all observations to the prior). The model is trained for 130 epochs using the Adam optimizer [39] (learning rate 10 3 ; gradient clipping with maximum norm 1.0). At inference, the encoder mean μ ( x , c ) is used in place of sampled posterior latents, yielding a deterministic and reproducible latent representation for the downstream diffusion model. Figure 4 summarizes this latent space and its role in the overall generative pipeline.

2.4. Class-Conditional Latent Diffusion Model (DDPM)

A diffusion model learns to reverse a gradual noising process: during training, Gaussian noise is progressively added to a clean latent vector z 0 over T timesteps until it approximates an isotropic Gaussian z T N ( 0 , I ) . The model learns to predict the added noise at each step so that at inference it can begin from a random Gaussian sample and iteratively denoise it back into a realistic latent vector [18,19]. Conditioning on a class label steers this process toward the latent distribution of the target arrhythmia class, enabling targeted minority class synthesis.
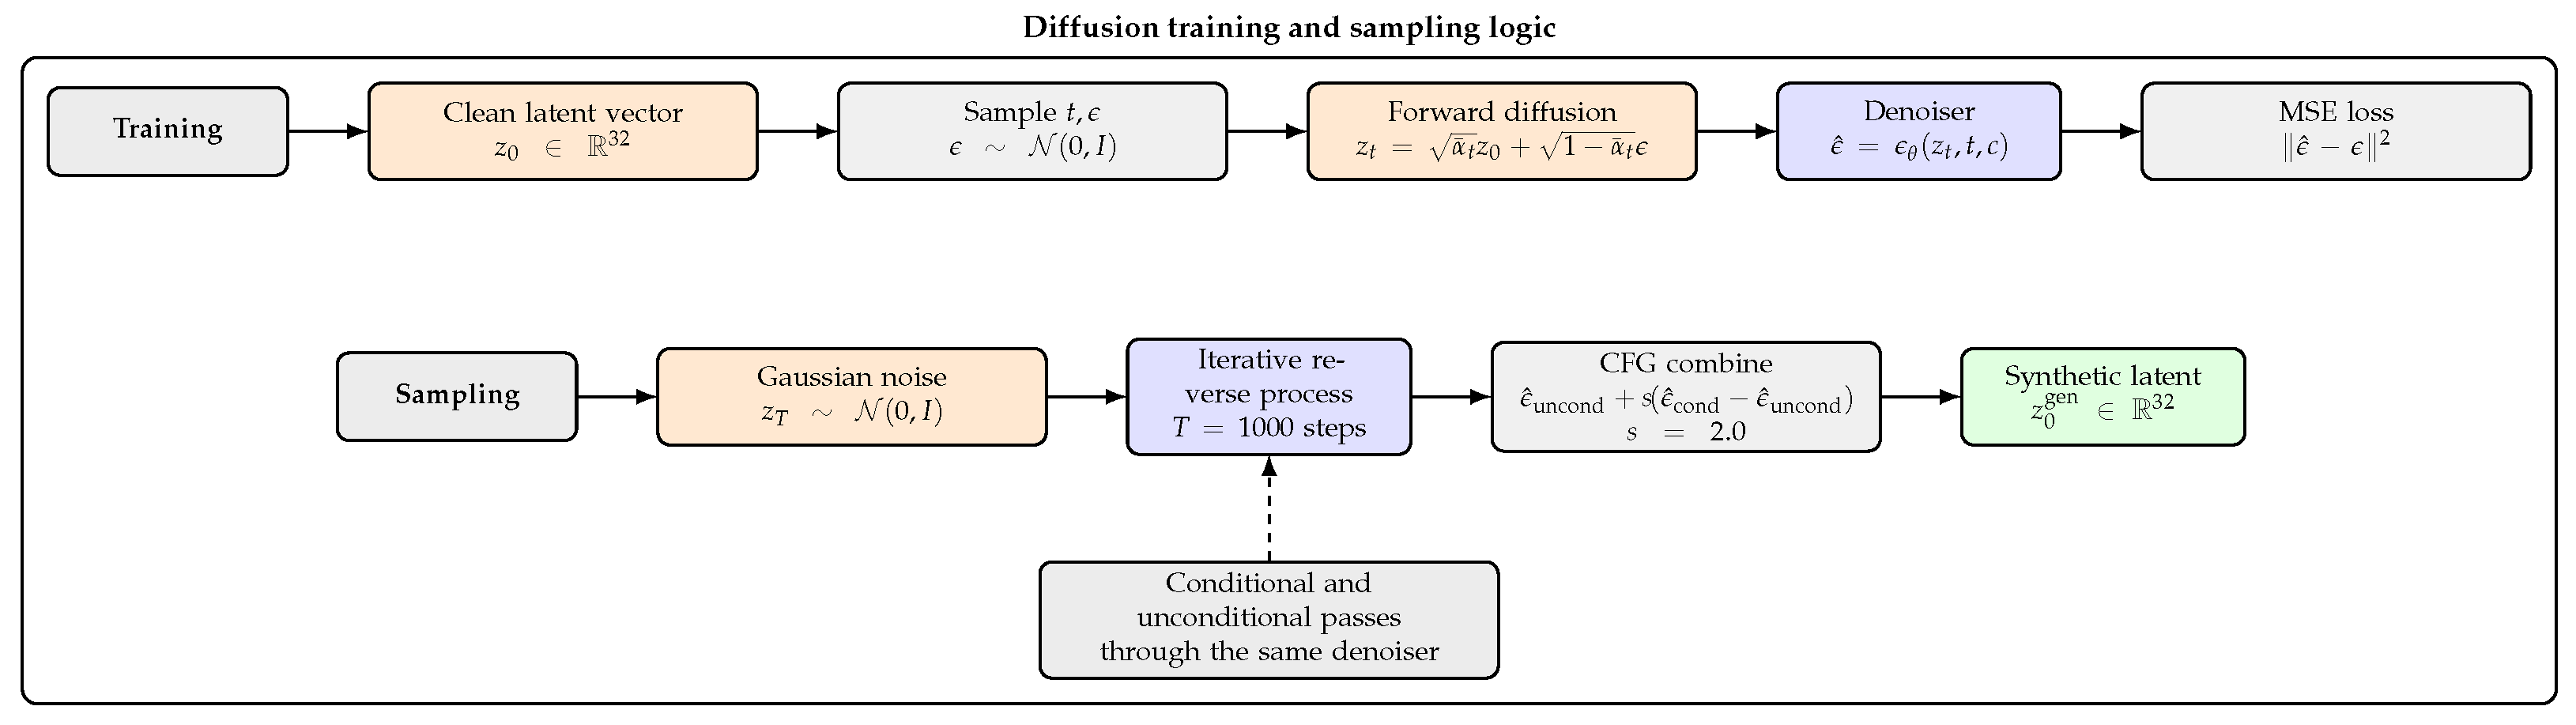
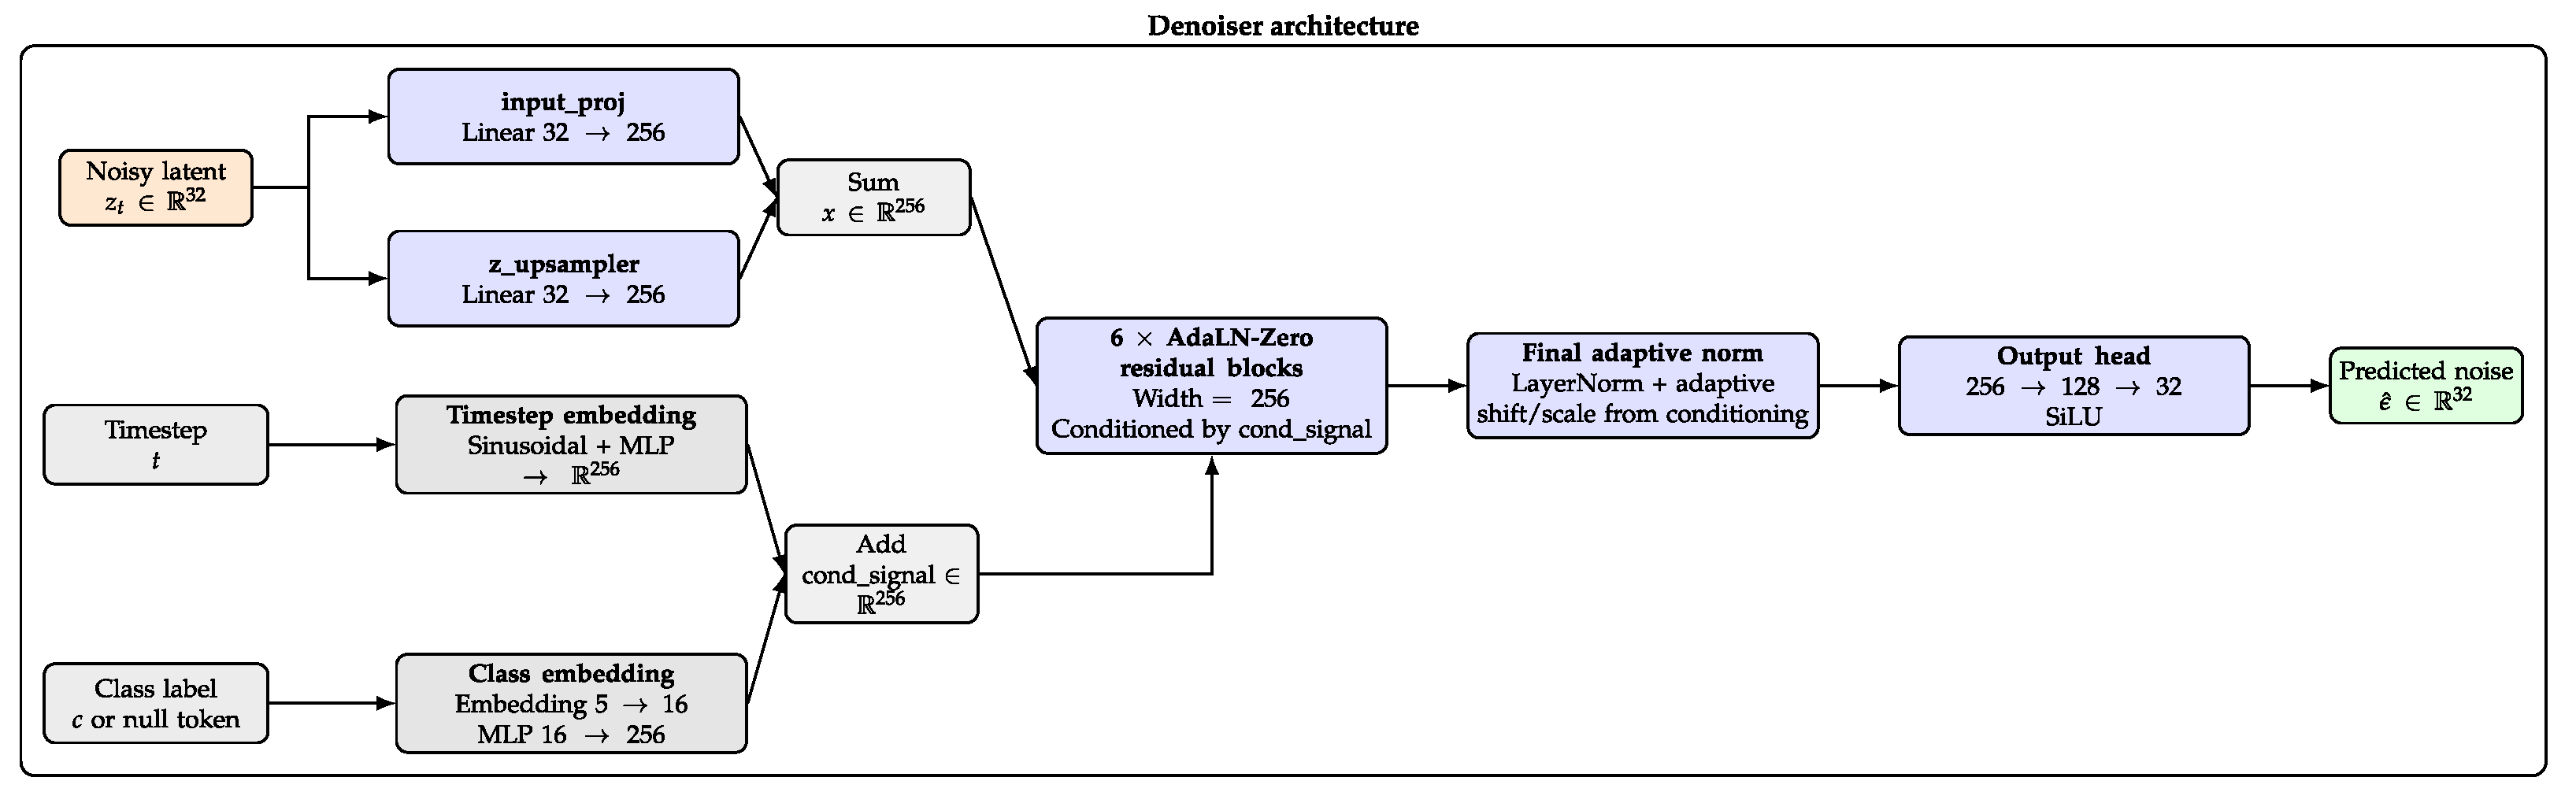
The second stage trains a class-conditional latent DDPM on the cVAE latent representations to model and sample from the class-specific latent distributions of minority arrhythmia beats. The denoiser is a residual MLP with AdaLayerNorm-Zero (AdaLN-Zero) conditioning [40]: a learned class embedding and sinusoidal timestep embedding jointly modulate six residual blocks operating in a 256-dimensional hidden representation. Training and sampling logic is shown in Figure 5. The denoiser’s internal block architecture is detailed in Appendix A, Figure A2.
Training latents are standardized dimension-wise using training set statistics ( μ z , σ z ) before being passed to the model. The forward diffusion process corrupts the standardized latents over T = 1000 steps under a linear variance schedule, β t [ 10 4 , 10 2 ] , uniformly spaced. The model is optimized under the standard noise-prediction objective:
L DDPM = E t , z 0 , ϵ ϵ ϵ θ ( z t , t , c ) 2
where ϵ N ( 0 , I ) is the noise target and ϵ θ is the learned denoiser.
Classifier-free guidance (CFG) [41] is applied by randomly replacing the class conditioning with a null token with probability 0.1 during training and using a guidance scale of 2.0 at inference. A class-balanced WeightedRandomSampler ensures equal minority class exposure during training. The model is optimized with Adam [39] (learning rate 10 4 ; gradient clipping with maximum norm 1.0) and an exponential moving average (EMA; decay 0.9999) of the model parameters. All reported samples are drawn from the EMA-smoothed model.

2.5. Quantum Latent Refinement (QLR)

The QLR module operates as a postprocessing refinement step: after the DDPM generates a synthetic latent that approximates the target-class distribution, the QLR applies a bounded correction to shift it toward higher-density regions of the real latent manifold—guided by the displacement from real examples—without altering it so drastically that the underlying beat morphology is lost. This refinement is implemented using a parameterized quantum circuit (PQC), whose entanglement structure introduces inter-dimensional correlations that are structurally distinct from those of a classical network of equivalent parameter count.
Even with classifier-free guidance, DDPM-generated minority class latents may still occupy lower-density regions of the real latent manifold. This is particularly pronounced for morphologically complex classes such as ventricular ectopy, whose latent distribution is broad and multimodal. To reduce this mismatch, a QLR module is trained separately for each minority class ( S , V , and F ) using an 8-qubit PQC [21].
Prior to circuit embedding, each 32-dimensional latent is mapped to the quantum domain [ 1 , 1 ] 32 via an affine transformation ϕ ( · ) defined by the 1st and 99th percentiles of the real class-specific latent bank. This per-class calibration ensures that the data-embedding rotations operate within the valid angular range of the quantum gates. The circuit architecture consists of three components:
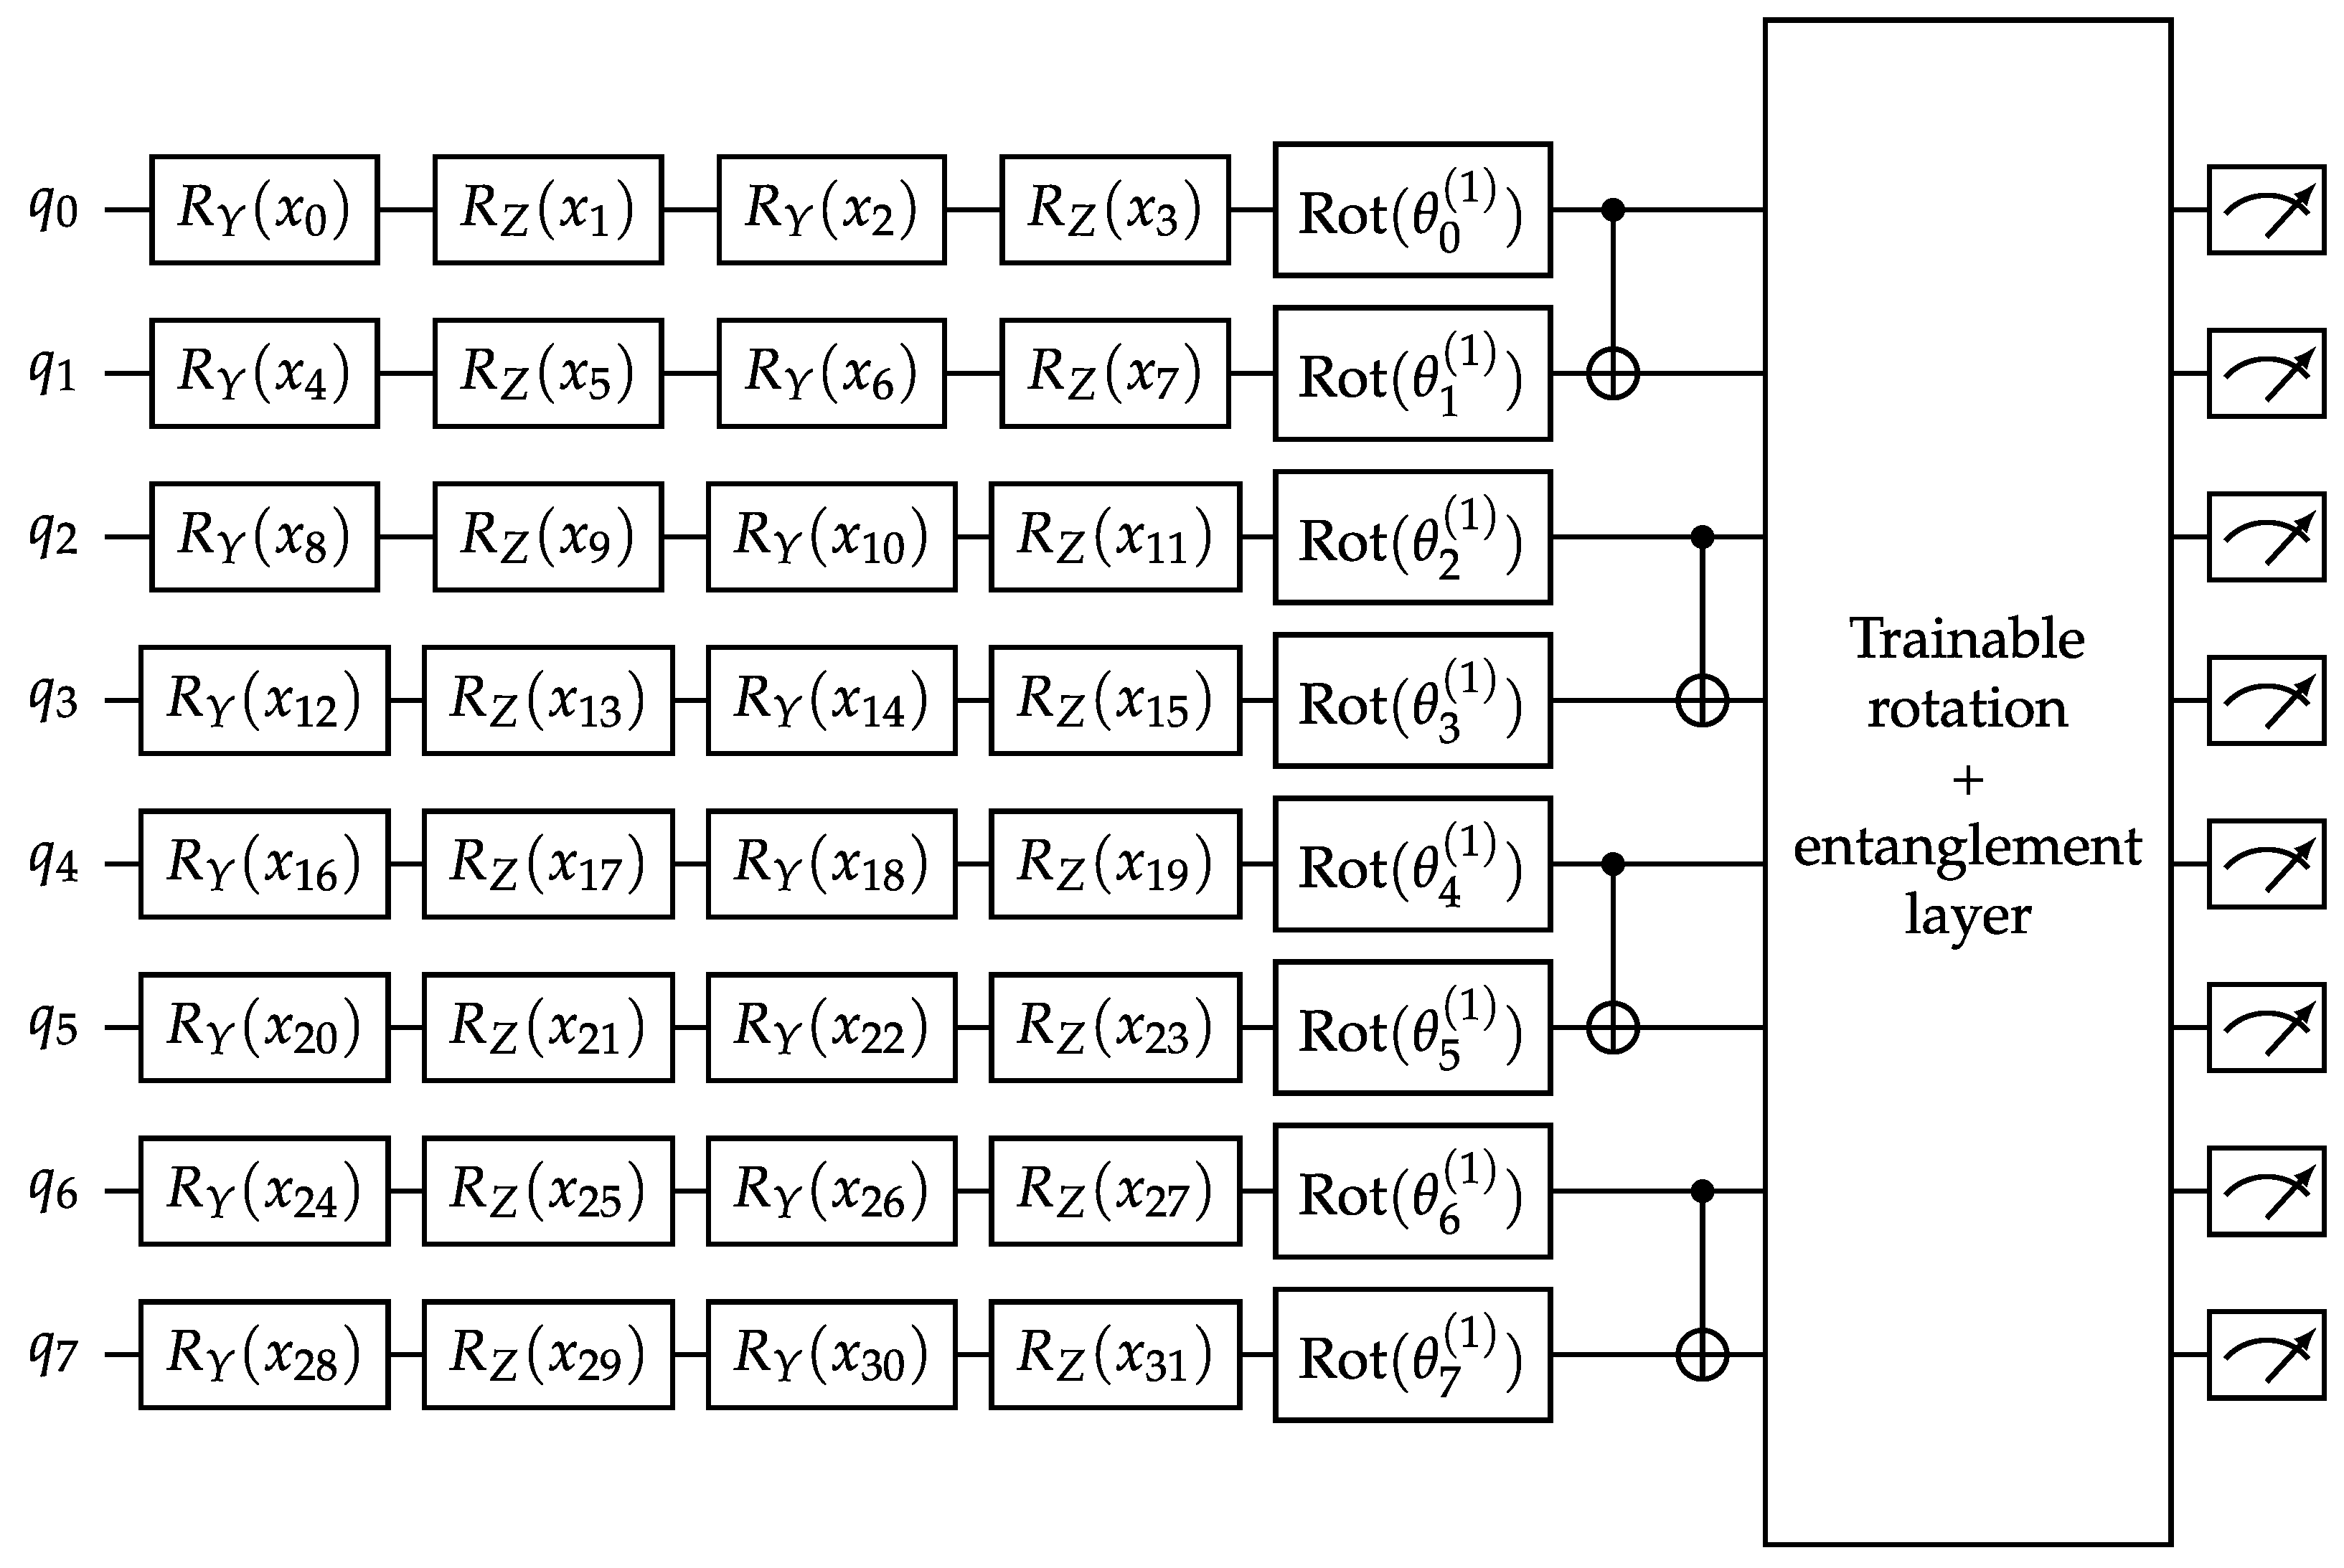
  • Single data-embedding stage. The 32 normalized latent dimensions are embedded once at the circuit input using two R Y and two R Z rotations per qubit. Data re-uploading at intermediate layers [42] is not employed, keeping the circuit shallow to mitigate barren plateau phenomena [22].
  • Trainable rotation-entanglement stack. Six layers follow, each applying a general Rot gate ( R z - R y - R z ) to every qubit, followed by a brick-pattern CNOT entanglement scheme: even layers connect qubit pairs ( 0 , 1 ) , ( 2 , 3 ) , ( 4 , 5 ) , ( 6 , 7 ) ; odd layers connect ( 1 , 2 ) , ( 3 , 4 ) , ( 5 , 6 ) with a wrap-around ( 7 , 0 ) connection. Every third layer adds stride-2 skip entanglement.
  • Multi-observable readout. The circuit returns 32 expectation values: Pauli-Z, Pauli-X, Pauli-Y, and nearest-neighbor Z Z per qubit location.
The resulting circuit—a single embedding stage, six trainable rotation-entanglement layers, and multi-observable readout—is illustrated in Appendix A, Figure A3.
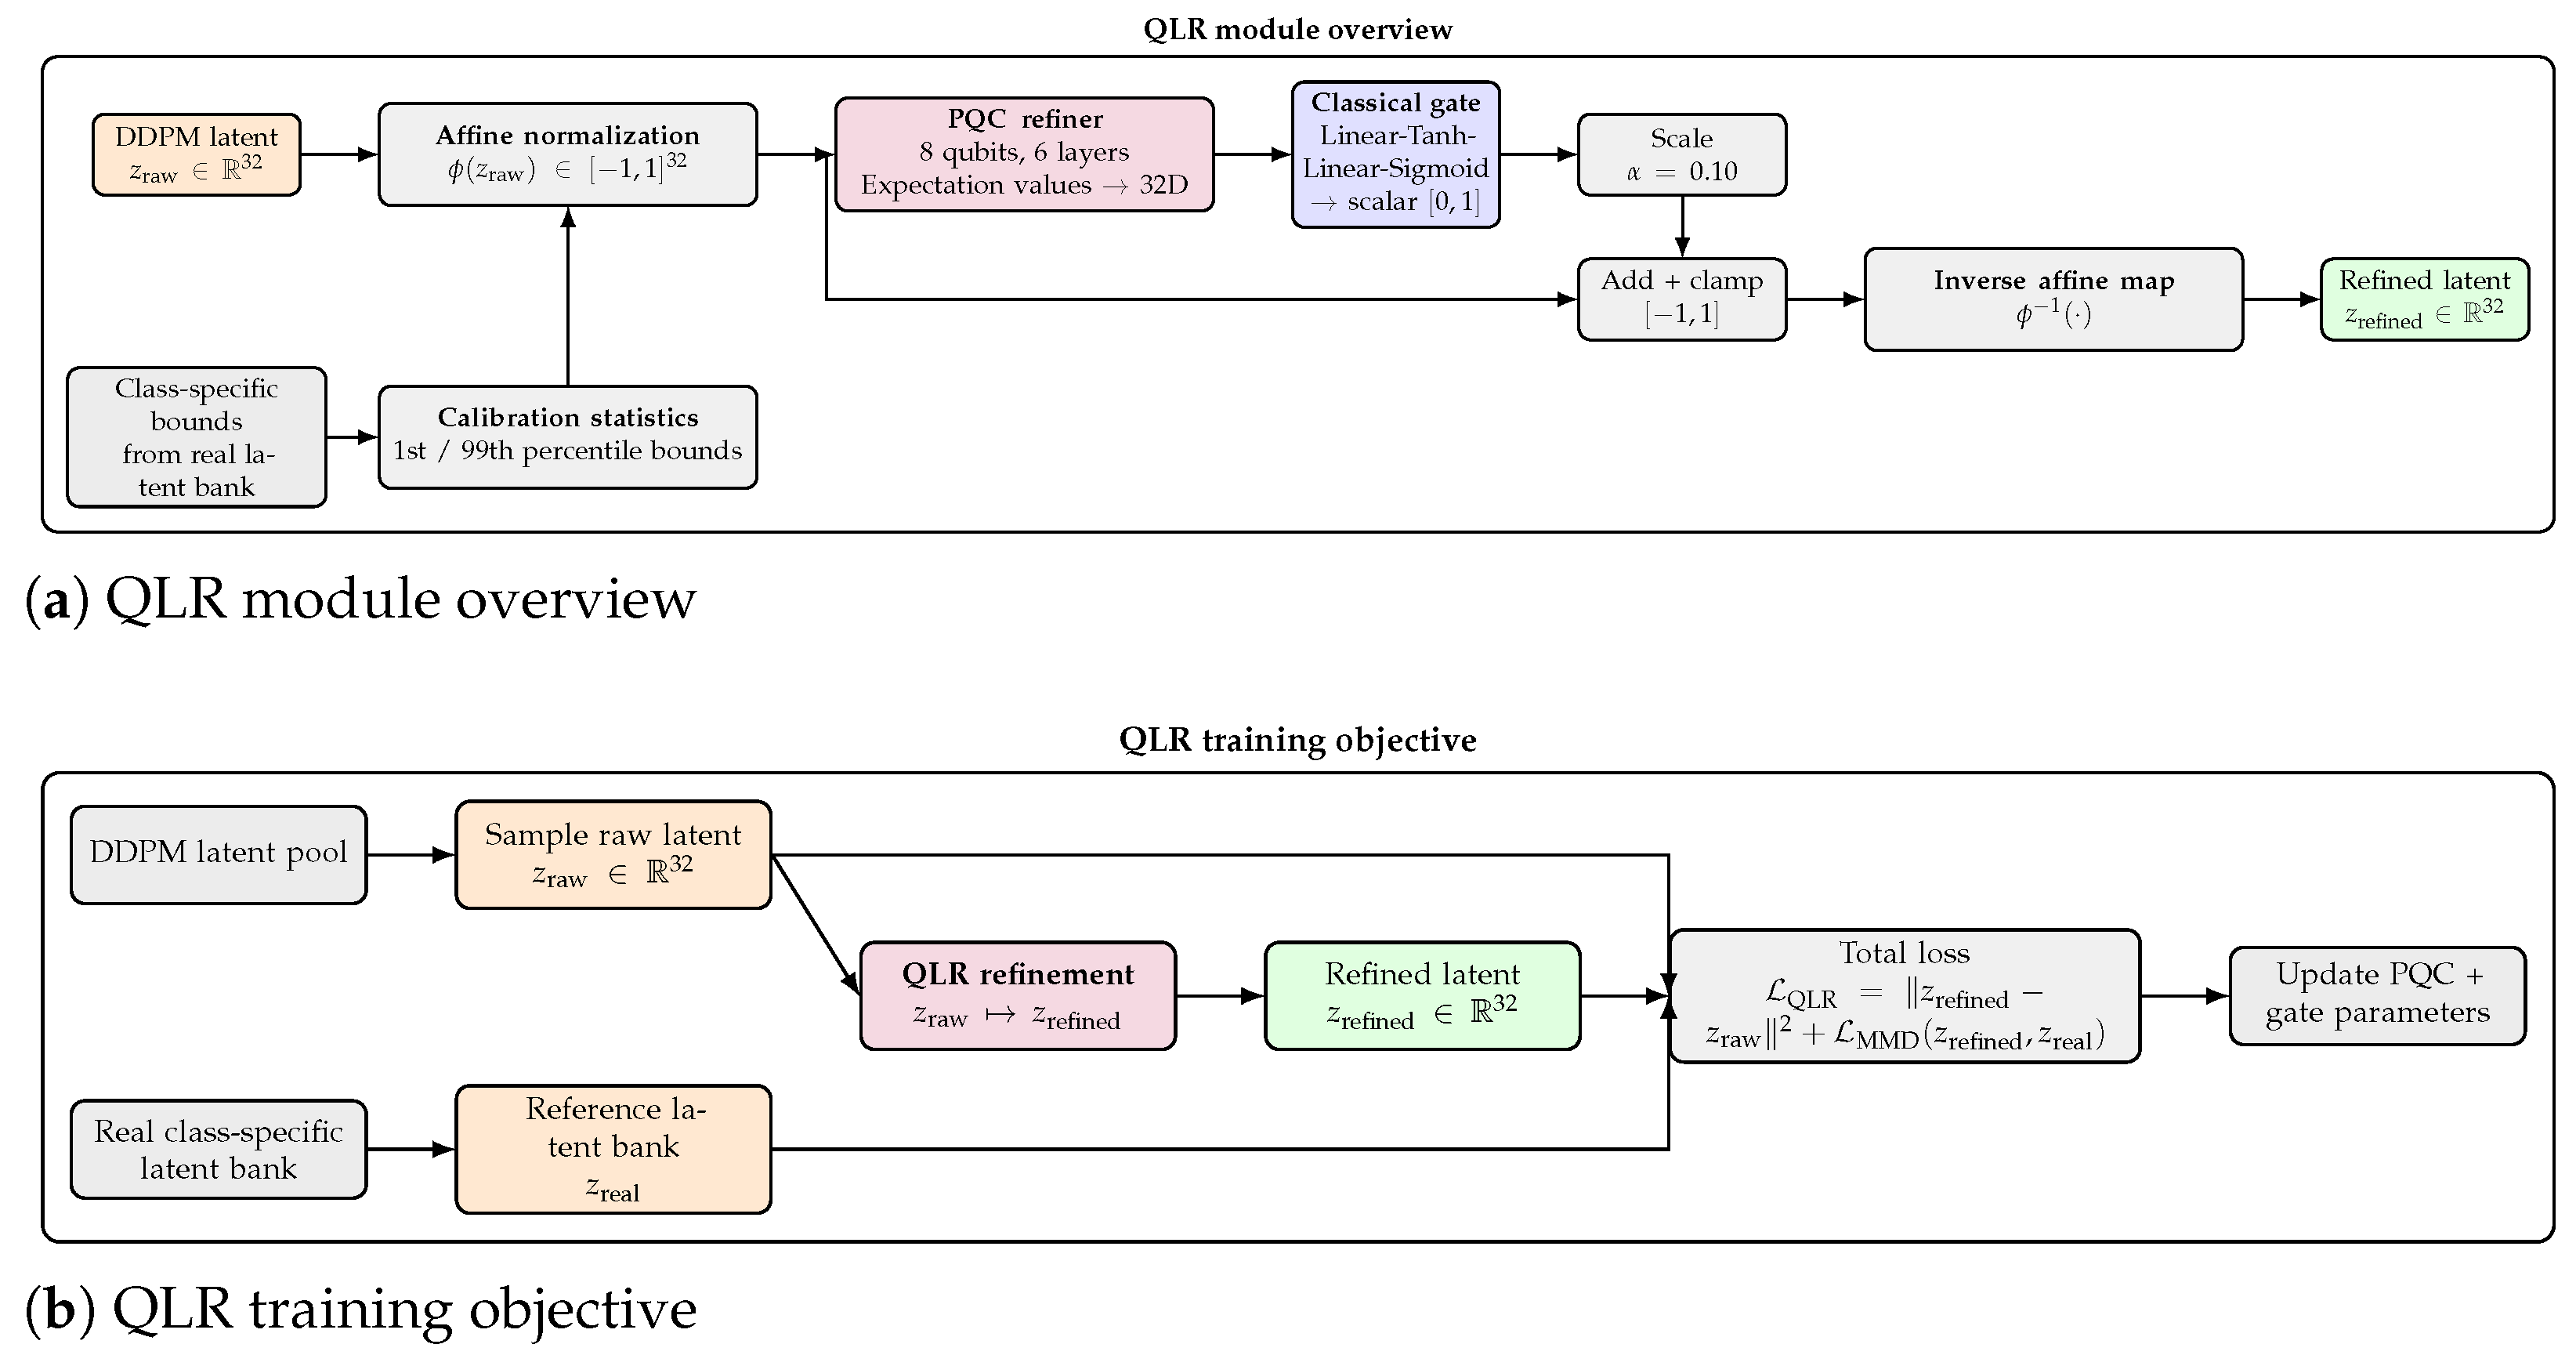
The circuit output is standardized per sample to a unit-scale correction direction, f ^ PQC . Rather than applying this direction at a fixed magnitude for every sample, a lightweight classical gate g ψ ( · ) —a two-layer network (Linear–Tanh–Linear–Sigmoid; 545 parameters)—maps the correction direction to a per-sample scalar in [ 0 , 1 ] , following the dressed-quantum-circuit paradigm of wrapping a parameterized quantum circuit with trainable classical pre- and postprocessing layers [43]. This lets QLR learn to apply little or no correction to samples that do not require it rather than always pushing at full strength. The gate is trained jointly with the circuit parameters θ under the same objective (Equation (4)). The gate’s final layer is initialized near-identity (output 1 for every sample), so training starts equivalent to the original fixed-magnitude behavior and only learns to shrink the correction where the objective rewards it, following the near-identity initialization strategy used for gated residual connections in classical deep networks [44]. The bounded residual correction is then
z refined = ϕ 1 clamp ϕ ( z raw ) + α g ψ f ^ PQC ( ϕ ( z raw ) ; θ ) f ^ PQC ϕ ( z raw ) ; θ , 1 , 1
with correction scale α = 0.10 . The small scale factor constrains the QLR to regularize the synthetic distribution rather than overwrite the morphological content encoded by the DDPM—preserving the beat structure while improving distributional alignment. In total, QLR uses 689 parameters per minority class: 144 in the quantum circuit, which determines the correction direction, and 545 in the classical gate, which determines its magnitude. We report this split explicitly because the correction is not produced by the quantum circuit alone. The full module and its training objective are illustrated in Figure 6.
QLR training uses a two-term unsupervised objective:
L QLR = w stay z refined z raw 2 + w mmd L MMD ( z refined , z real )
with w stay = 1.0 and w mmd = 1.0 . The stay loss penalizes large displacements from the DDPM origin, preserving the morphological characteristics encoded in each latent vector. The MMD term guides the refined distribution toward the real class-specific latent bank. It is computed as the squared Maximum Mean Discrepancy [45], using a mixture of L = 3 RBF kernels at different bandwidth scales rather than a single bandwidth:
L MMD ( P , Q ) = E z , z P k ( z , z ) 2 E z P , z ^ Q k ( z , z ^ ) + E z ^ , z ^ Q k ( z ^ , z ^ )
where the kernel itself is a bandwidth mixture,
k ( z , z ) = 1 L = 1 L exp γ z z 2 , γ = s γ base , s { 0.5 , 1.0 , 2.0 } ,
with γ base set by the median heuristic [45], γ base = 1 / median ( z z 2 ) , over the combined batch of refined, real, and cross-pair latent distances. A single median-heuristic bandwidth can yield a weak or saturated gradient once the refined and real distributions are already close in distribution, giving the optimizer little signal to act on. The three-scale mixture is a standard procedure in the generative-moment-matching literature [46] that provides a better-conditioned gradient across a range of distances without introducing new hyperparameters beyond the scale set { 0.5 , 1.0 , 2.0 } . We verified this change empirically before adopting it: retraining QLR with the single-bandwidth kernel and with the three-scale mixture, holding every other hyperparameter and the random seed fixed, produced statistically indistinguishable training trajectories for the per-sample gate (Section 2.5) at every logged epoch, indicating that kernel bandwidth was not the limiting factor in this module’s behavior. We nonetheless retain the mixture as the more robust and better-justified choice going forward. A value of L MMD = 0 indicates that the two distributions are identical; larger values reflect systematic displacement of the synthetic cloud from the real manifold. In practice, the following finite-sample estimator is used:
MMD ^ 2 ( P , Q ) = 1 n 2 i , j k ( z i , z j ) 2 n m i , j k ( z i , z ^ j ) + 1 m 2 i , j k ( z ^ i , z ^ j )
where n and m are the number of real and synthetic latent samples, respectively. Per-class training uses Adam [39] at learning rate 2 × 10 3 with cosine annealing [47] ( η min = 5 × 10 4 ), a pool of 2048 DDPM-generated samples refreshed every 5 epochs to prevent overfitting to a fixed synthetic set, early stopping with patience 20, and gradient clipping (norm 1.0).
The PQC is implemented in PennyLane [48] using the default.qubit CPU-based simulator.

2.6. Downstream Classifier and Evaluation Protocol

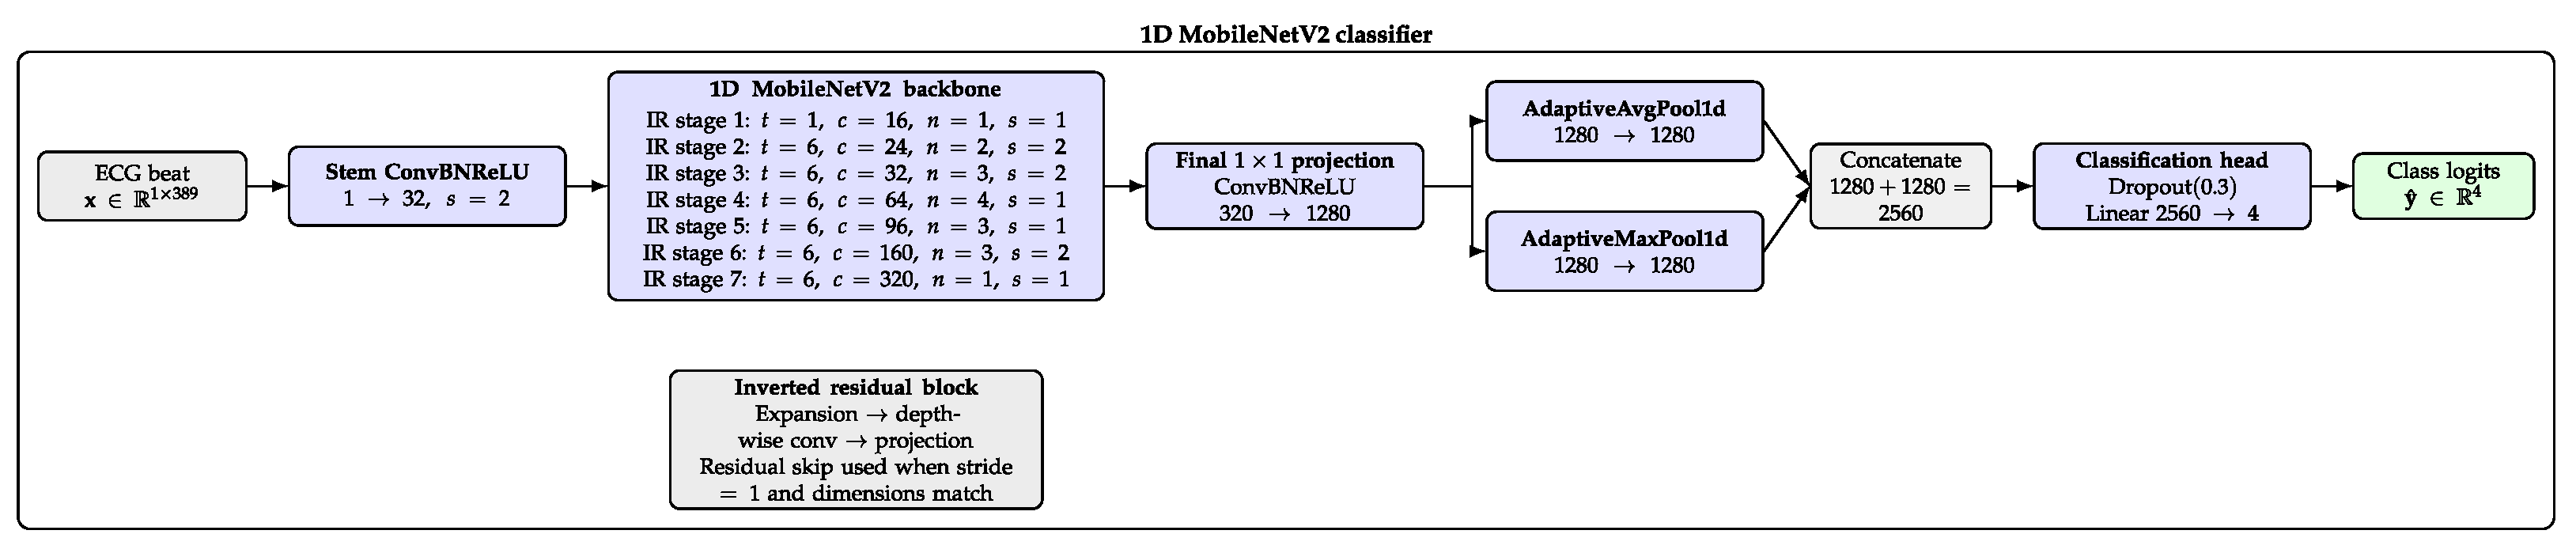
The downstream classifier is a 1D adaptation of MobileNetV2 [32], chosen for its inverted residual architecture and depth-wise separable convolutions, which together yield a compact parameter footprint suitable for resource-constrained wearable platforms where model storage and inference latency are critical. The network begins with a 1D convolutional stem followed by a sequence of inverted residual blocks. The classification head receives concatenated adaptive average-pooled and max-pooled features, enabling the model to integrate global rhythmic context with local morphological detail. Full architectural detail is given in Appendix A, Figure A4.
Residual class imbalance in the augmented training set is addressed through inverse-frequency weighted cross-entropy (Equation (8)):
w c = j n j C n c
where n c is the number of training samples in class c after augmentation and C is the number of classes. The weights are recomputed for each augmentation ratio ρ so that the loss function reflects the augmented class distribution at every experimental condition. Weighted cross-entropy was preferred over focal loss to provide a transparent and interpretable imbalance correction. The interaction between explicit class up-weighting and synthetic augmentation is evaluated empirically rather than disentangled. The classifier is trained with Adam [39] at learning rate 10 3 with gradient clipping (max norm 1.0), retaining the checkpoint with the best validation Macro F1, for a maximum of 100 epochs. Learning rate is reduced by half whenever validation Macro F1 plateaus for 7 epochs, and training stops early after 20 epochs without improvement, restoring the best checkpoint recorded.
The full pipeline is evaluated across ten independent random seeds and four augmentation ratios ρ { 0.25 , 0.50 , 0.75 , 1.00 } , where ρ = 1.00 upsamples each minority class to match the majority Class N count (72,136 beats). The five augmentation conditions are (1) unaugmented baseline; (2) SMOTE; (3) cVAE-based sampling; (4) latent DDPM; and (5) DDPM + QLR. For cVAE generation, latent vectors are sampled from N ( 0 , I ) with class conditioning applied at the decoder only rather than through a learned class-conditional prior. This means the cVAE latent space is not explicitly structured by class, which limits the fidelity of unconditional latent samples relative to DDPM-generated ones.
The primary evaluation metric is Macro F1 (Section 1). Per-class precision, recall, and confusion matrices are reported to characterize the clinical utility of each method, with particular attention to the ventricular class, where the sensitivity to specificity tradeoff carries direct prognostic implications.
A matched ablation compares QLR against two classical multilayer-perceptron (MLP) refiners of different capacities (MLP-S: 292 parameters; MLP-M: 1072 parameters), trained under identical conditions—same optimizer, learning-rate schedule, pool refresh policy, patience, and gradient clipping—on Class V . QLR itself uses 689 parameters in total: 144 in the parameterized quantum circuit, which determines the correction direction, and 545 in a lightweight classical gate that learns a per-sample correction magnitude (Section 2.5). This ablation is conducted as a single-seed illustrative comparison, intended to discuss—not formally establish—whether comparable gains are achievable with classical alternatives at similar parameter budgets. Statistical significance for the main comparison across augmentation methods is assessed via paired t-test (scipy.stats.ttest_rel) on seed-wise Macro F1 values across all ten random seeds, with 95% confidence intervals (scipy.stats.t.interval) and Cohen’s d effect sizes reported alongside p-values to characterize practical significance. The full pairwise comparison matrix across all methods and ratios is reported in Appendix B, Table A2. The entire pipeline is implemented in PyTorch [49], with GPU acceleration for the classical stages and CPU-based quantum simulation for the QLR module. All experiments were run on a single workstation with an NVIDIA GeForce RTX 4090 GPU (24 GB VRAM), an AMD Ryzen 9 7900X3D CPU (12 cores/24 threads), and 128 GB RAM, running Linux. Averaged per seed, generative-stage training required approximately 4.5 min (cVAE), 9.4 min (latent DDPM), and 7.0 min (QLR, all three minority classes combined), for a total generative-pipeline time of 3.5 h across all ten seeds. Downstream classifier training (17 classifier instances per seed: baseline plus four methods at four augmentation ratios, up to 100 epochs each with early stopping) was not separately instrumented but, based on observed per-epoch training time ( 10  s/epoch) and typical early-stopping epoch counts, is estimated at approximately 30 additional hours across the full study. The complete ten-seed evaluation therefore required approximately 34 h of wall-clock time end to end on the hardware described above. A full per-seed timing breakdown is reported in Appendix B, Table A1. The complete pipeline architecture is illustrated in Figure 7.

3. Results

3.1. Synthetic Data Quality

3.1.1. Training Convergence

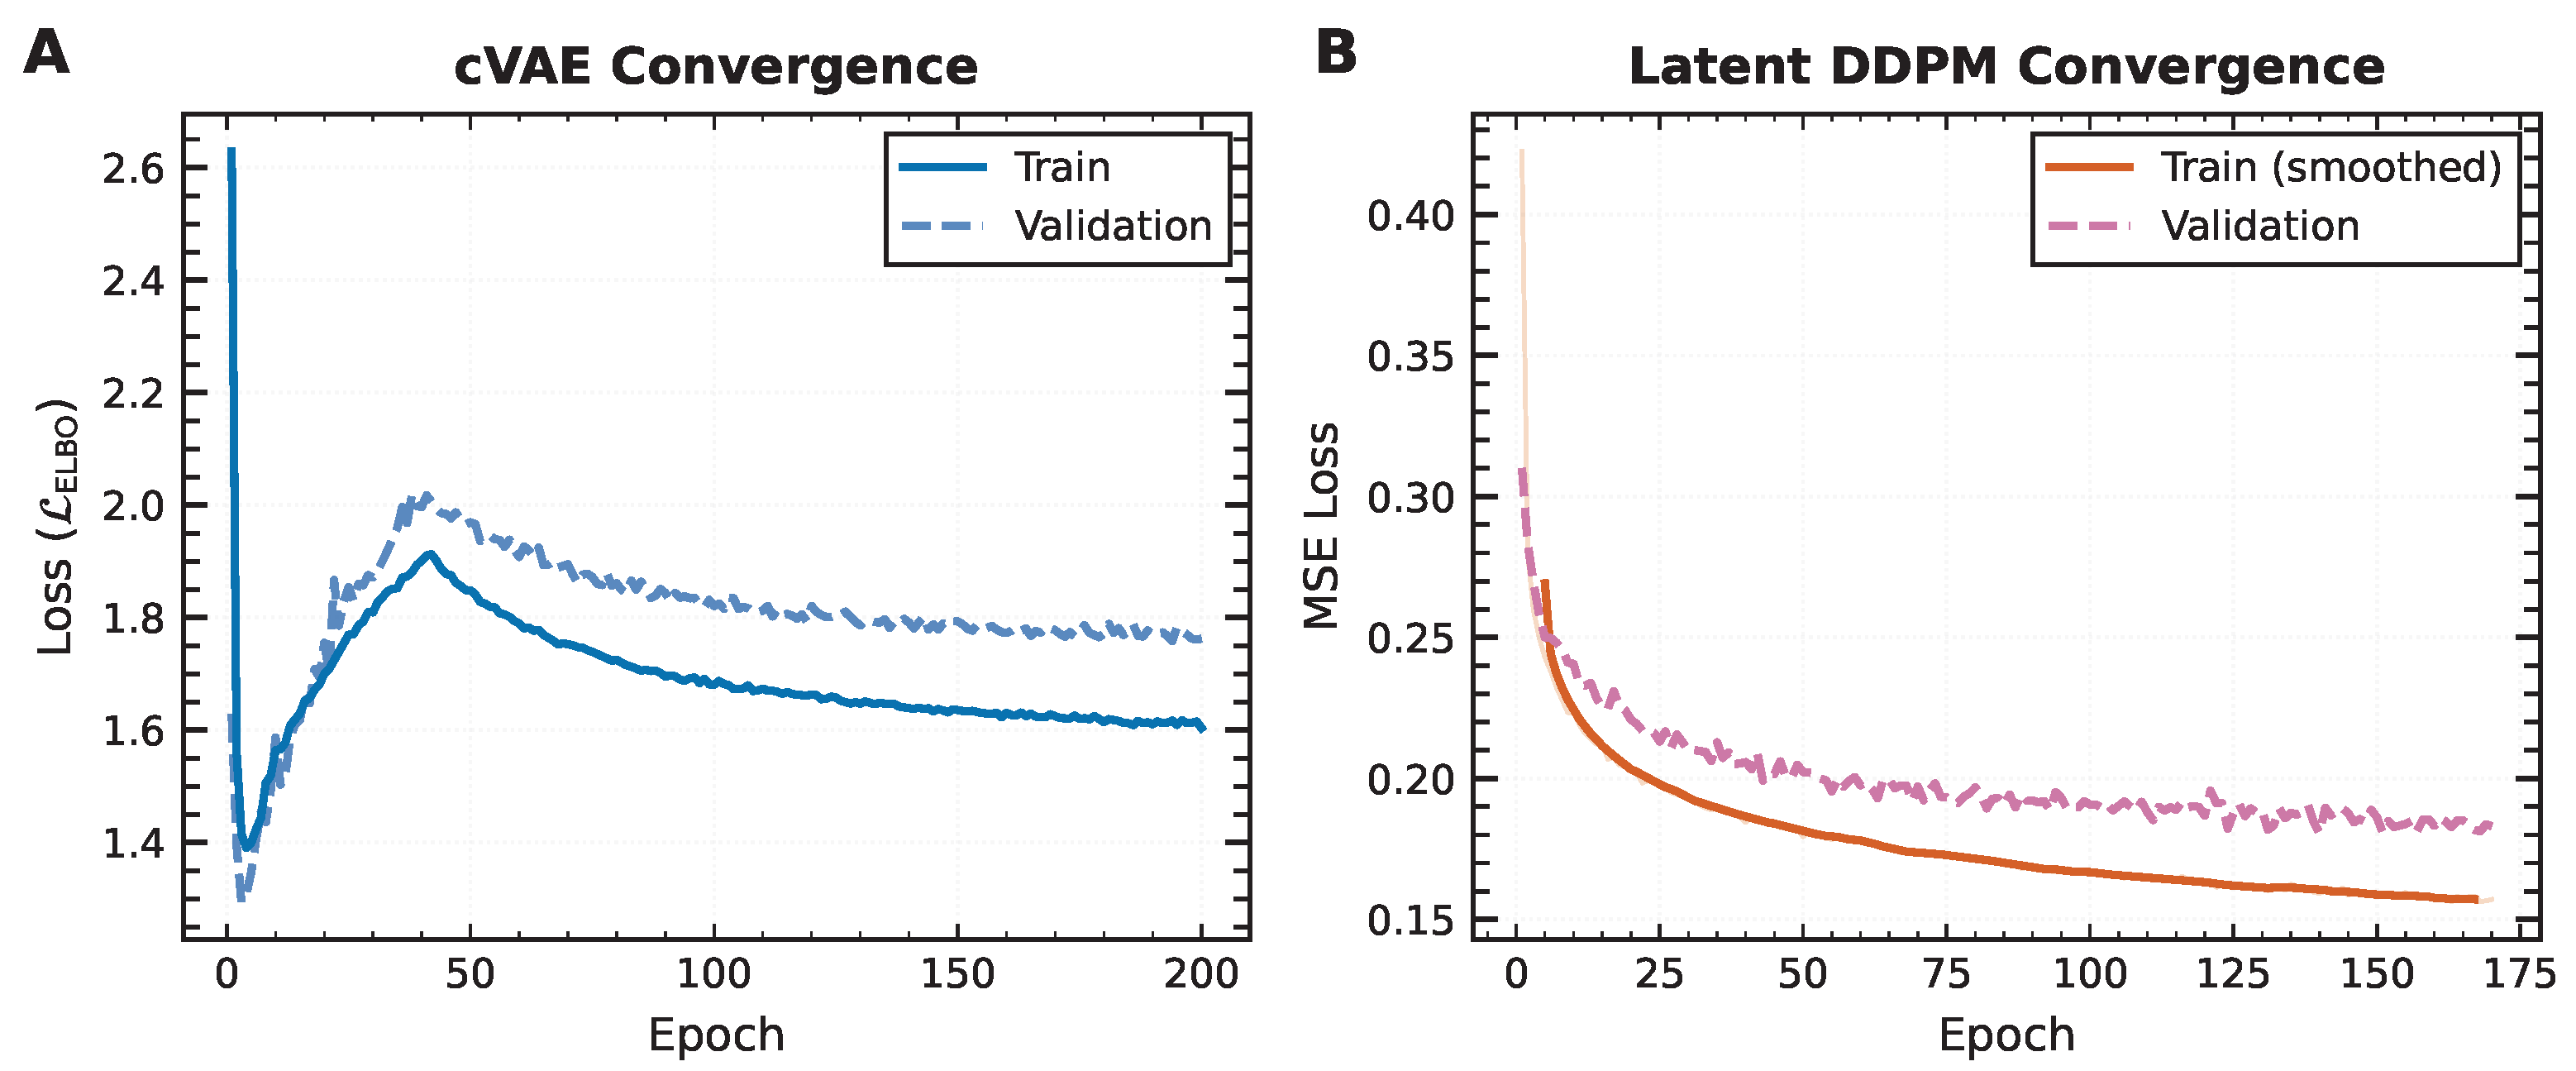
Both generative models exhibited stable convergence (Figure 8). The cVAE training loss showed an expected initial rise during the KL annealing window (epochs 0–40)—as the posterior is progressively pushed toward the prior—followed by monotonic descent to a final training loss of approximately 1.60 (validation: 1.76). The modest and consistent train–validation gap confirms that the cVAE generalizes well without significant overfitting. The latent DDPM was trained for up to 200 epochs with early stopping, restoring the best checkpoint at epoch 140. The noise-prediction loss fell from 0.22 at epoch 10 to a final value of approximately 0.16 (validation: 0.18). The EMA-smoothed model provided a stable and smooth optimization trajectory throughout.

3.1.2. Morphological Fidelity of Synthetic Beats

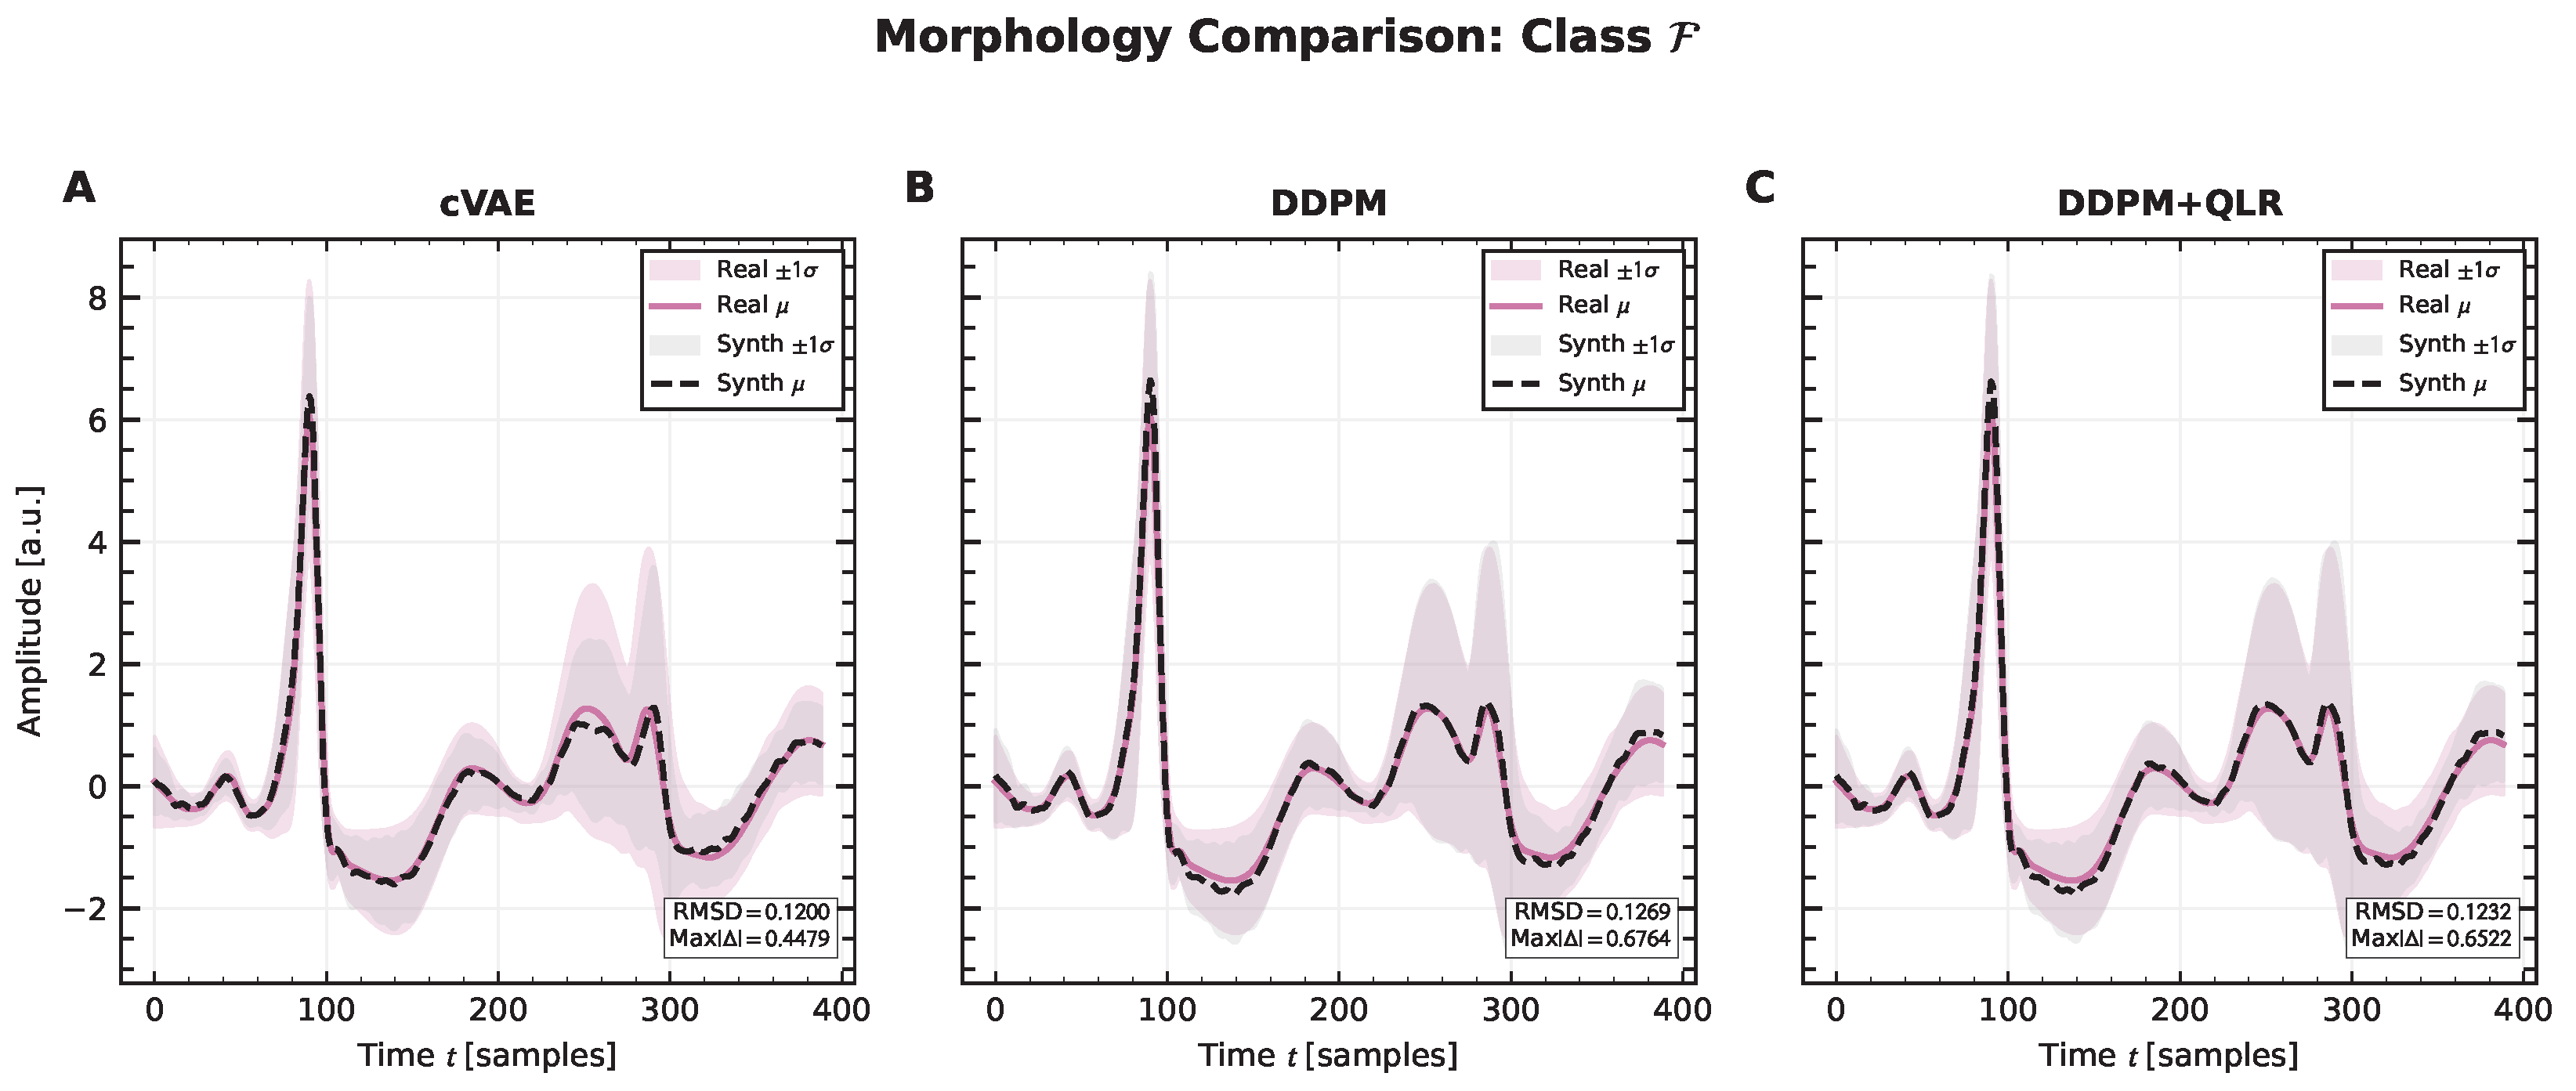
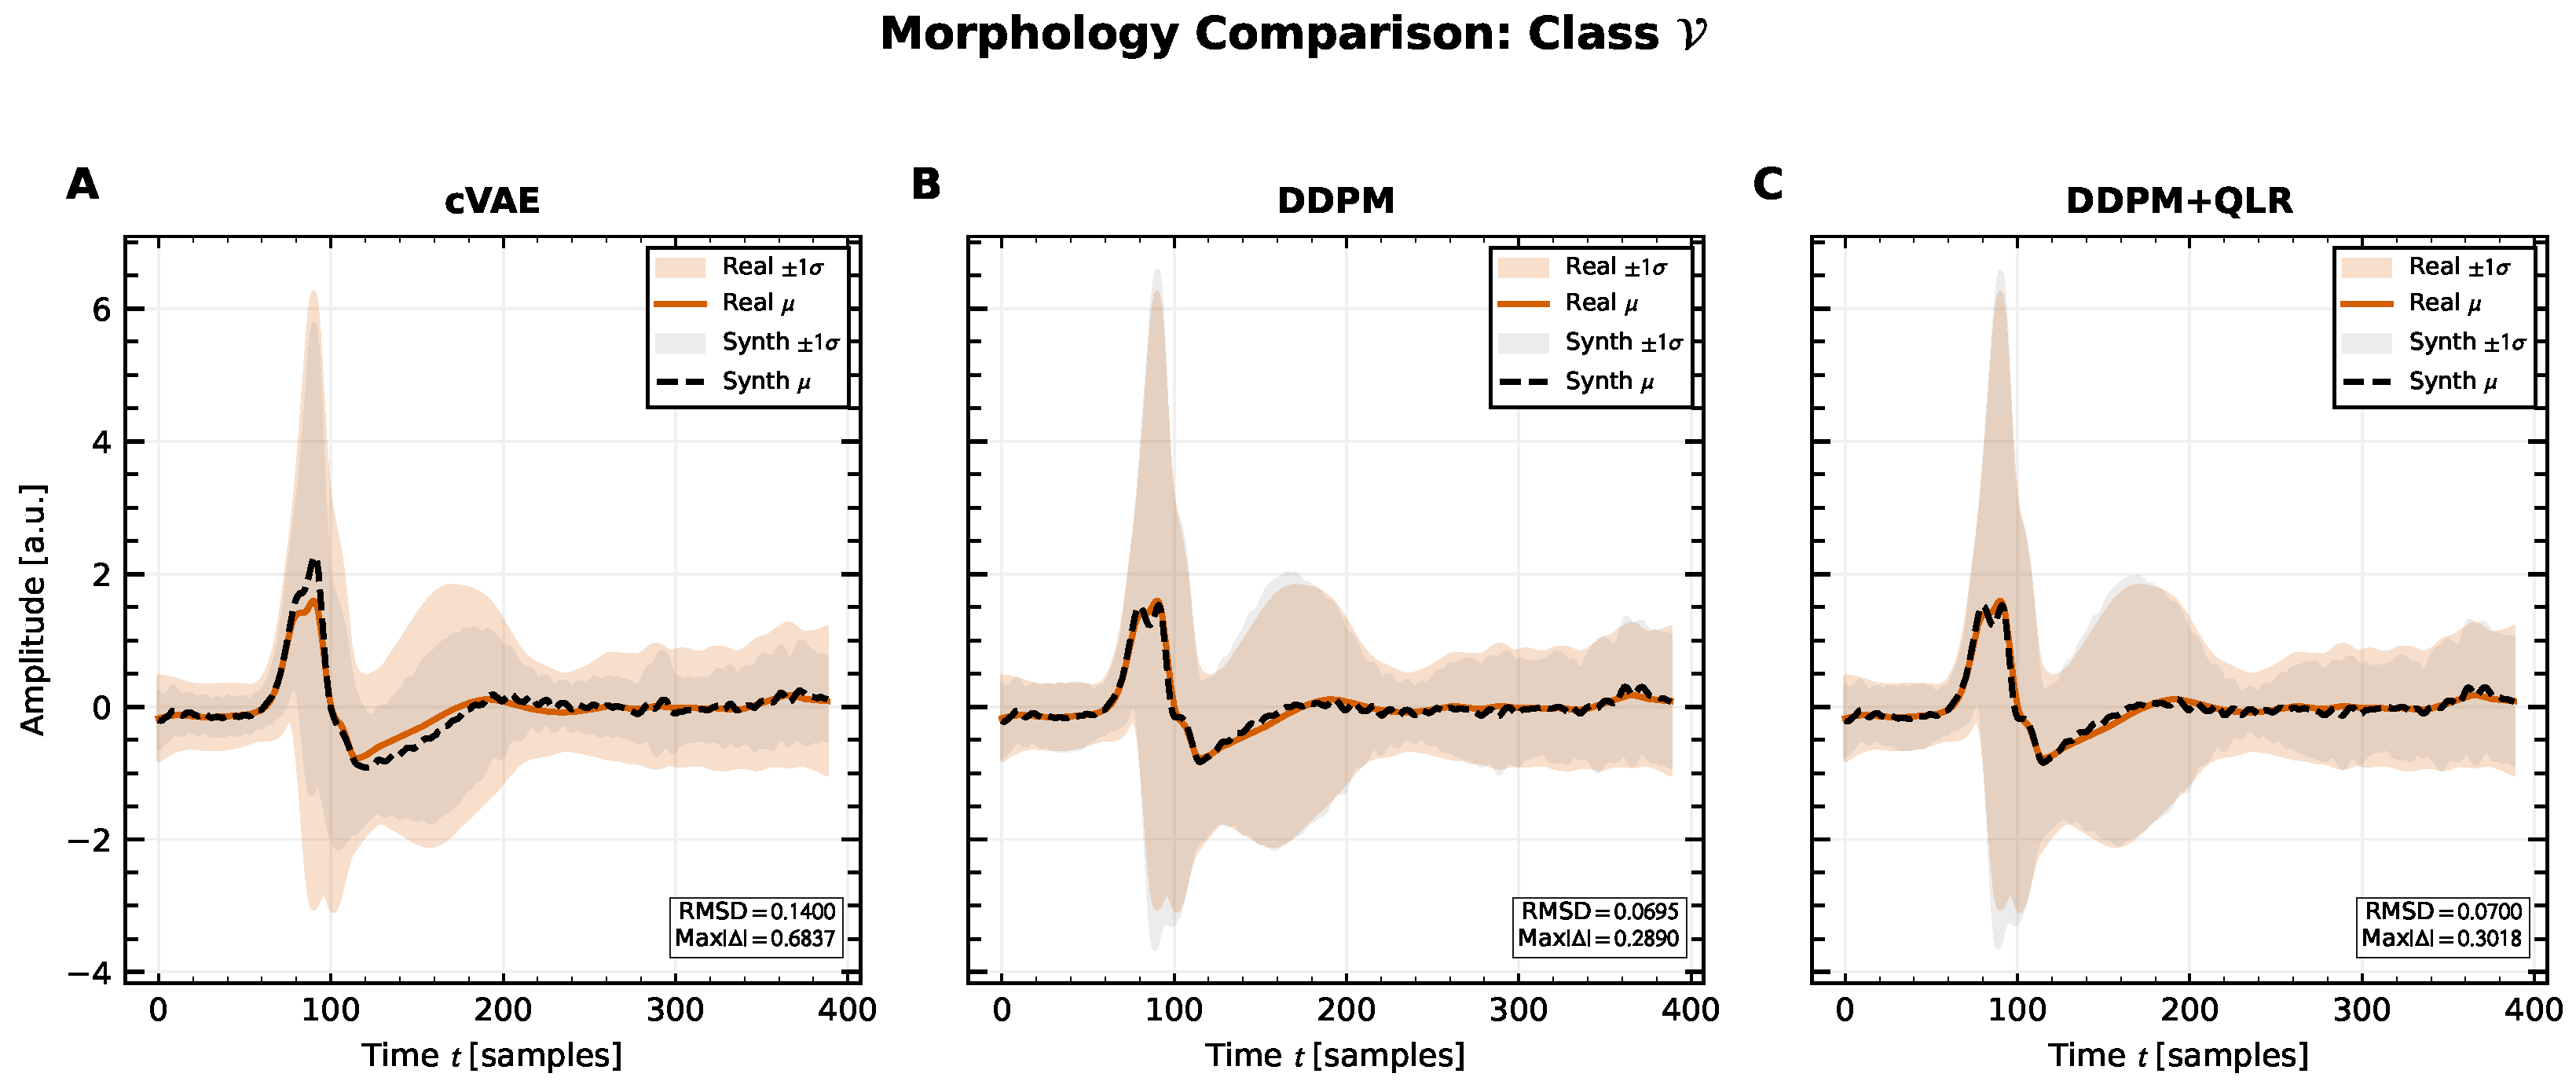
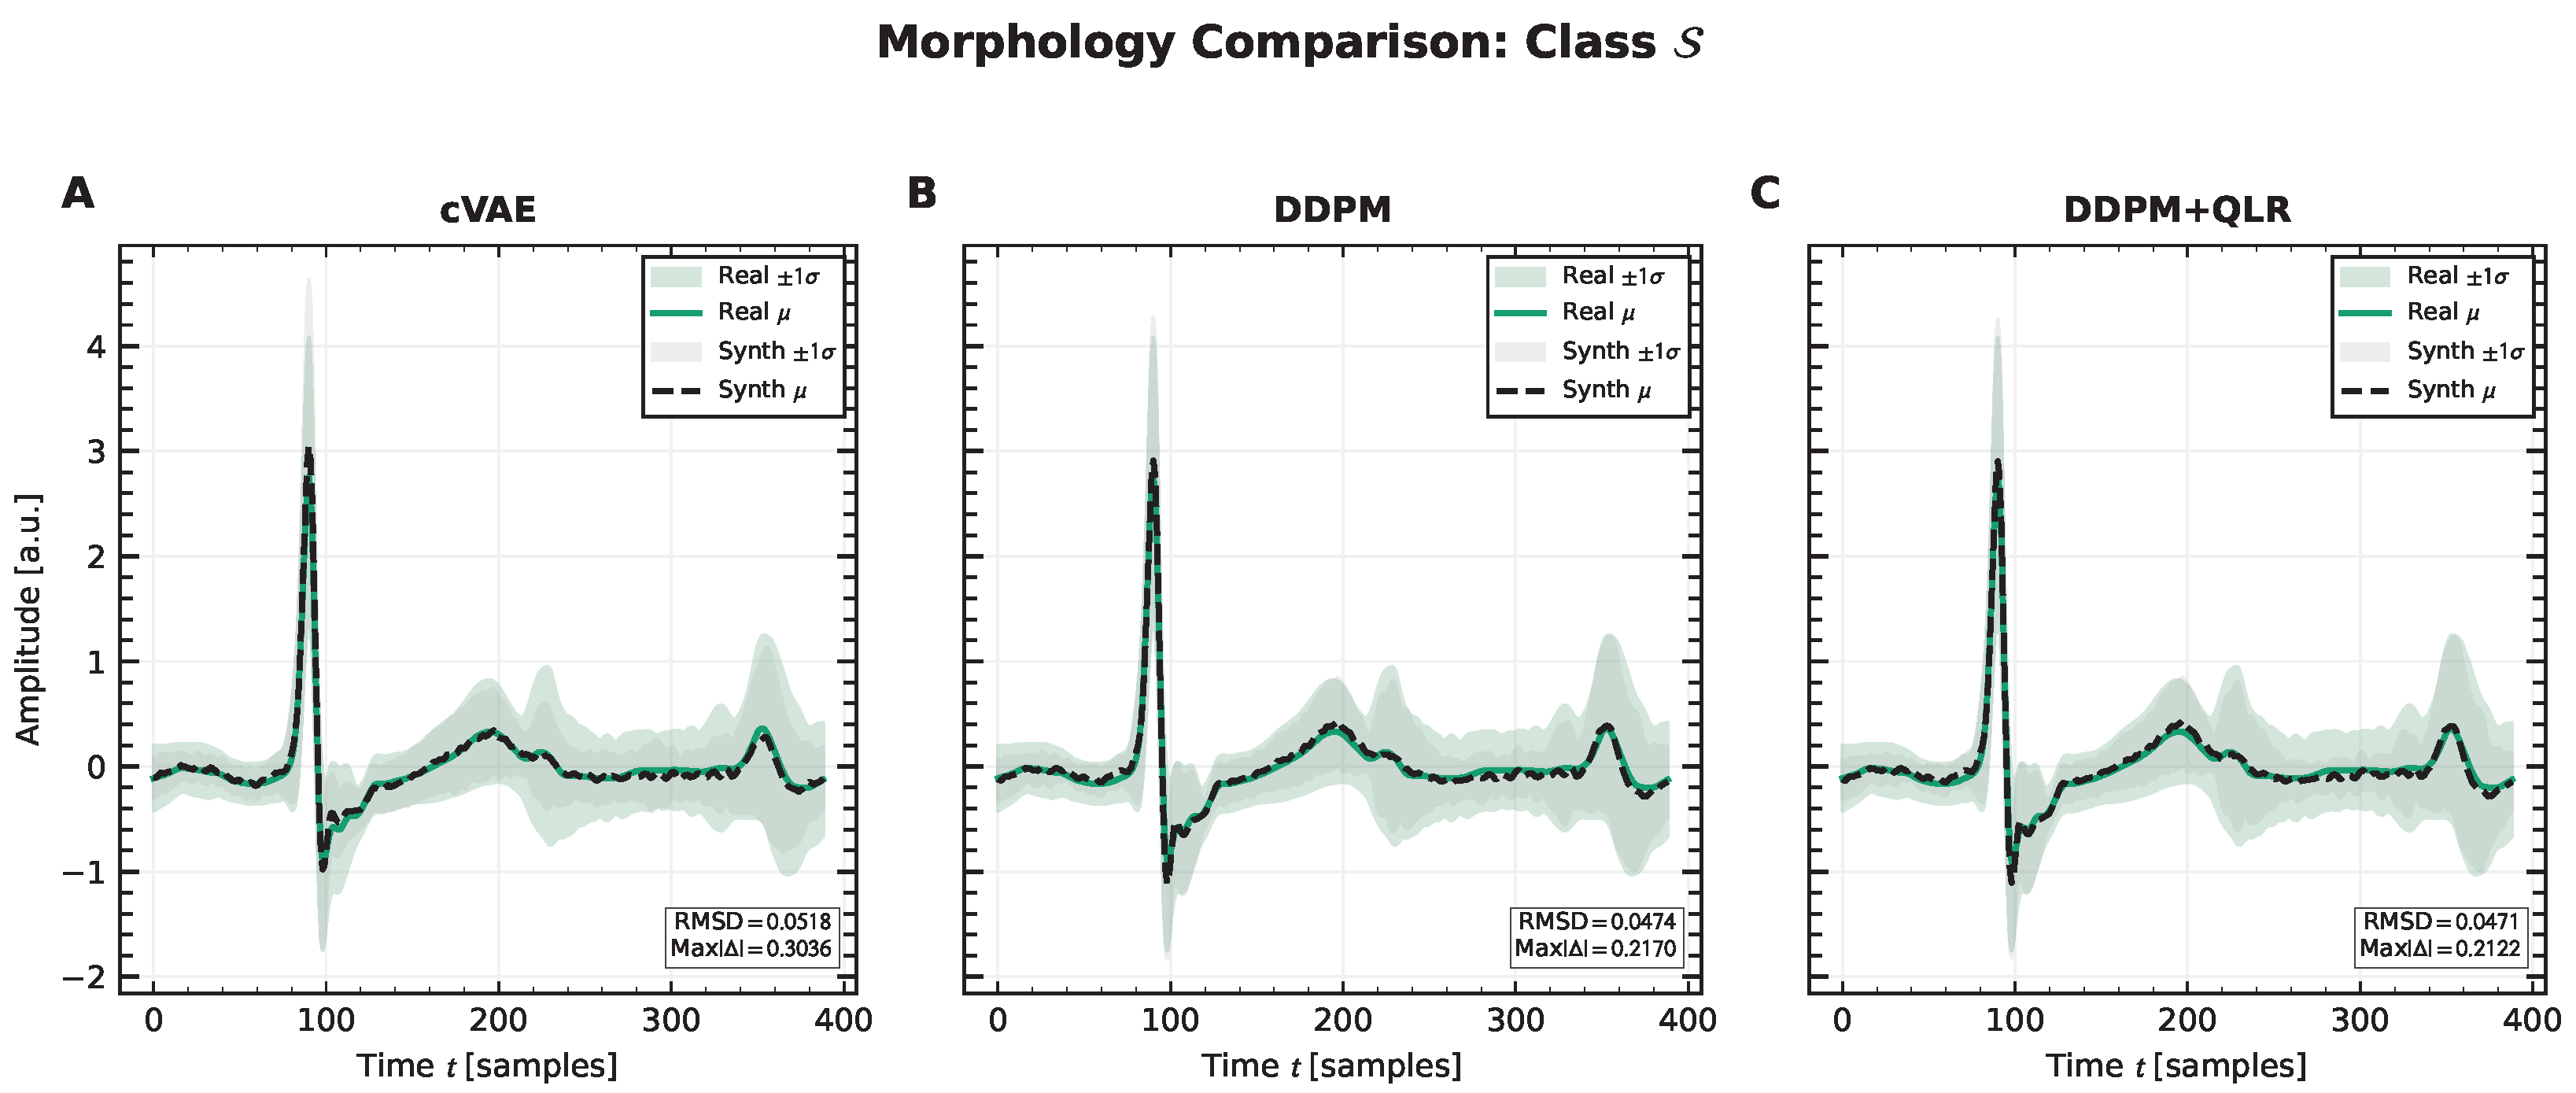
Figure 9, Figure 10 and Figure 11 compare the class-wise mean waveforms and one-standard-deviation envelopes of real versus synthetic beats for all three generative methods. Across all minority classes, synthetic mean waveforms closely track the real class means, confirming that the pipeline faithfully reproduces the dominant morphological signature of each arrhythmia type. The S -class synthetic beats reproduce the narrow QRS with subtle P-wave variation, the V -class beats capture the wide bizarrely-shaped QRS with biphasic deflection, and the F -class beats preserve the hybrid morphology between Normal and Ventricular impulses. All three methods track the real class-mean waveform closely for every class (cosine similarity 0.98 throughout; Table 2), with no method showing a systematic outlier on this metric.
Table 2 summarizes the waveform-level fidelity metrics across all methods and minority classes. Differences between methods are small for all three classes, confirming that the primary synthesis quality is established at the cVAE and DDPM stages. The QLR module’s waveform-level contribution is clearest for Class S , where it improves on plain DDPM on every metric. For Class V , the class of greatest clinical significance, QLR closely tracks plain DDPM’s morphology without a further waveform-level improvement, though Section 3.2.1—adjacent results below show a downstream precision benefit for this class that is not visible at the waveform level.

3.1.3. Synthetic Sample Diversity and Novelty

To assess whether the pipeline generates genuinely varied synthetic beats rather than near-duplicates of the training data, Table 3 reports two decoded-signal-space metrics, computed per seed and averaged over all ten seeds. Diversity is the mean pairwise Euclidean distance among synthetic samples of the same class—higher values indicate a more varied synthetic pool, guarding against mode collapse. Novelty is the mean cosine distance from each synthetic sample to its nearest real training beat—values near zero would indicate the model is memorizing and reproducing individual training examples rather than generating new ones.
For all three methods and classes, synthetic samples maintain substantial pairwise diversity (9.9–36.5, class-dependent) and non-zero nearest-neighbor distance to the real training set (0.012–0.10), indicating that the pipeline produces varied synthetic beats that resemble but do not duplicate individual training examples. Diversity is highest for Class V across all methods, consistent with its broader morphological variability already noted in Table 2. Novelty distance is consistently lower for DDPM and DDPM + QLR than for cVAE across all three classes—synthetic samples from the diffusion-based methods sit closer to their nearest real neighbor—while diversity does not follow a single consistent direction across methods. It is lower for DDPM/DDPM + QLR than cVAE for Class S but higher for Classes V and F . DDPM and DDPM + QLR track each other closely on both metrics, consistent with QLR’s bounded correction not fundamentally altering the diversity or novelty profile established by the diffusion stage.

3.1.4. Latent Space Alignment

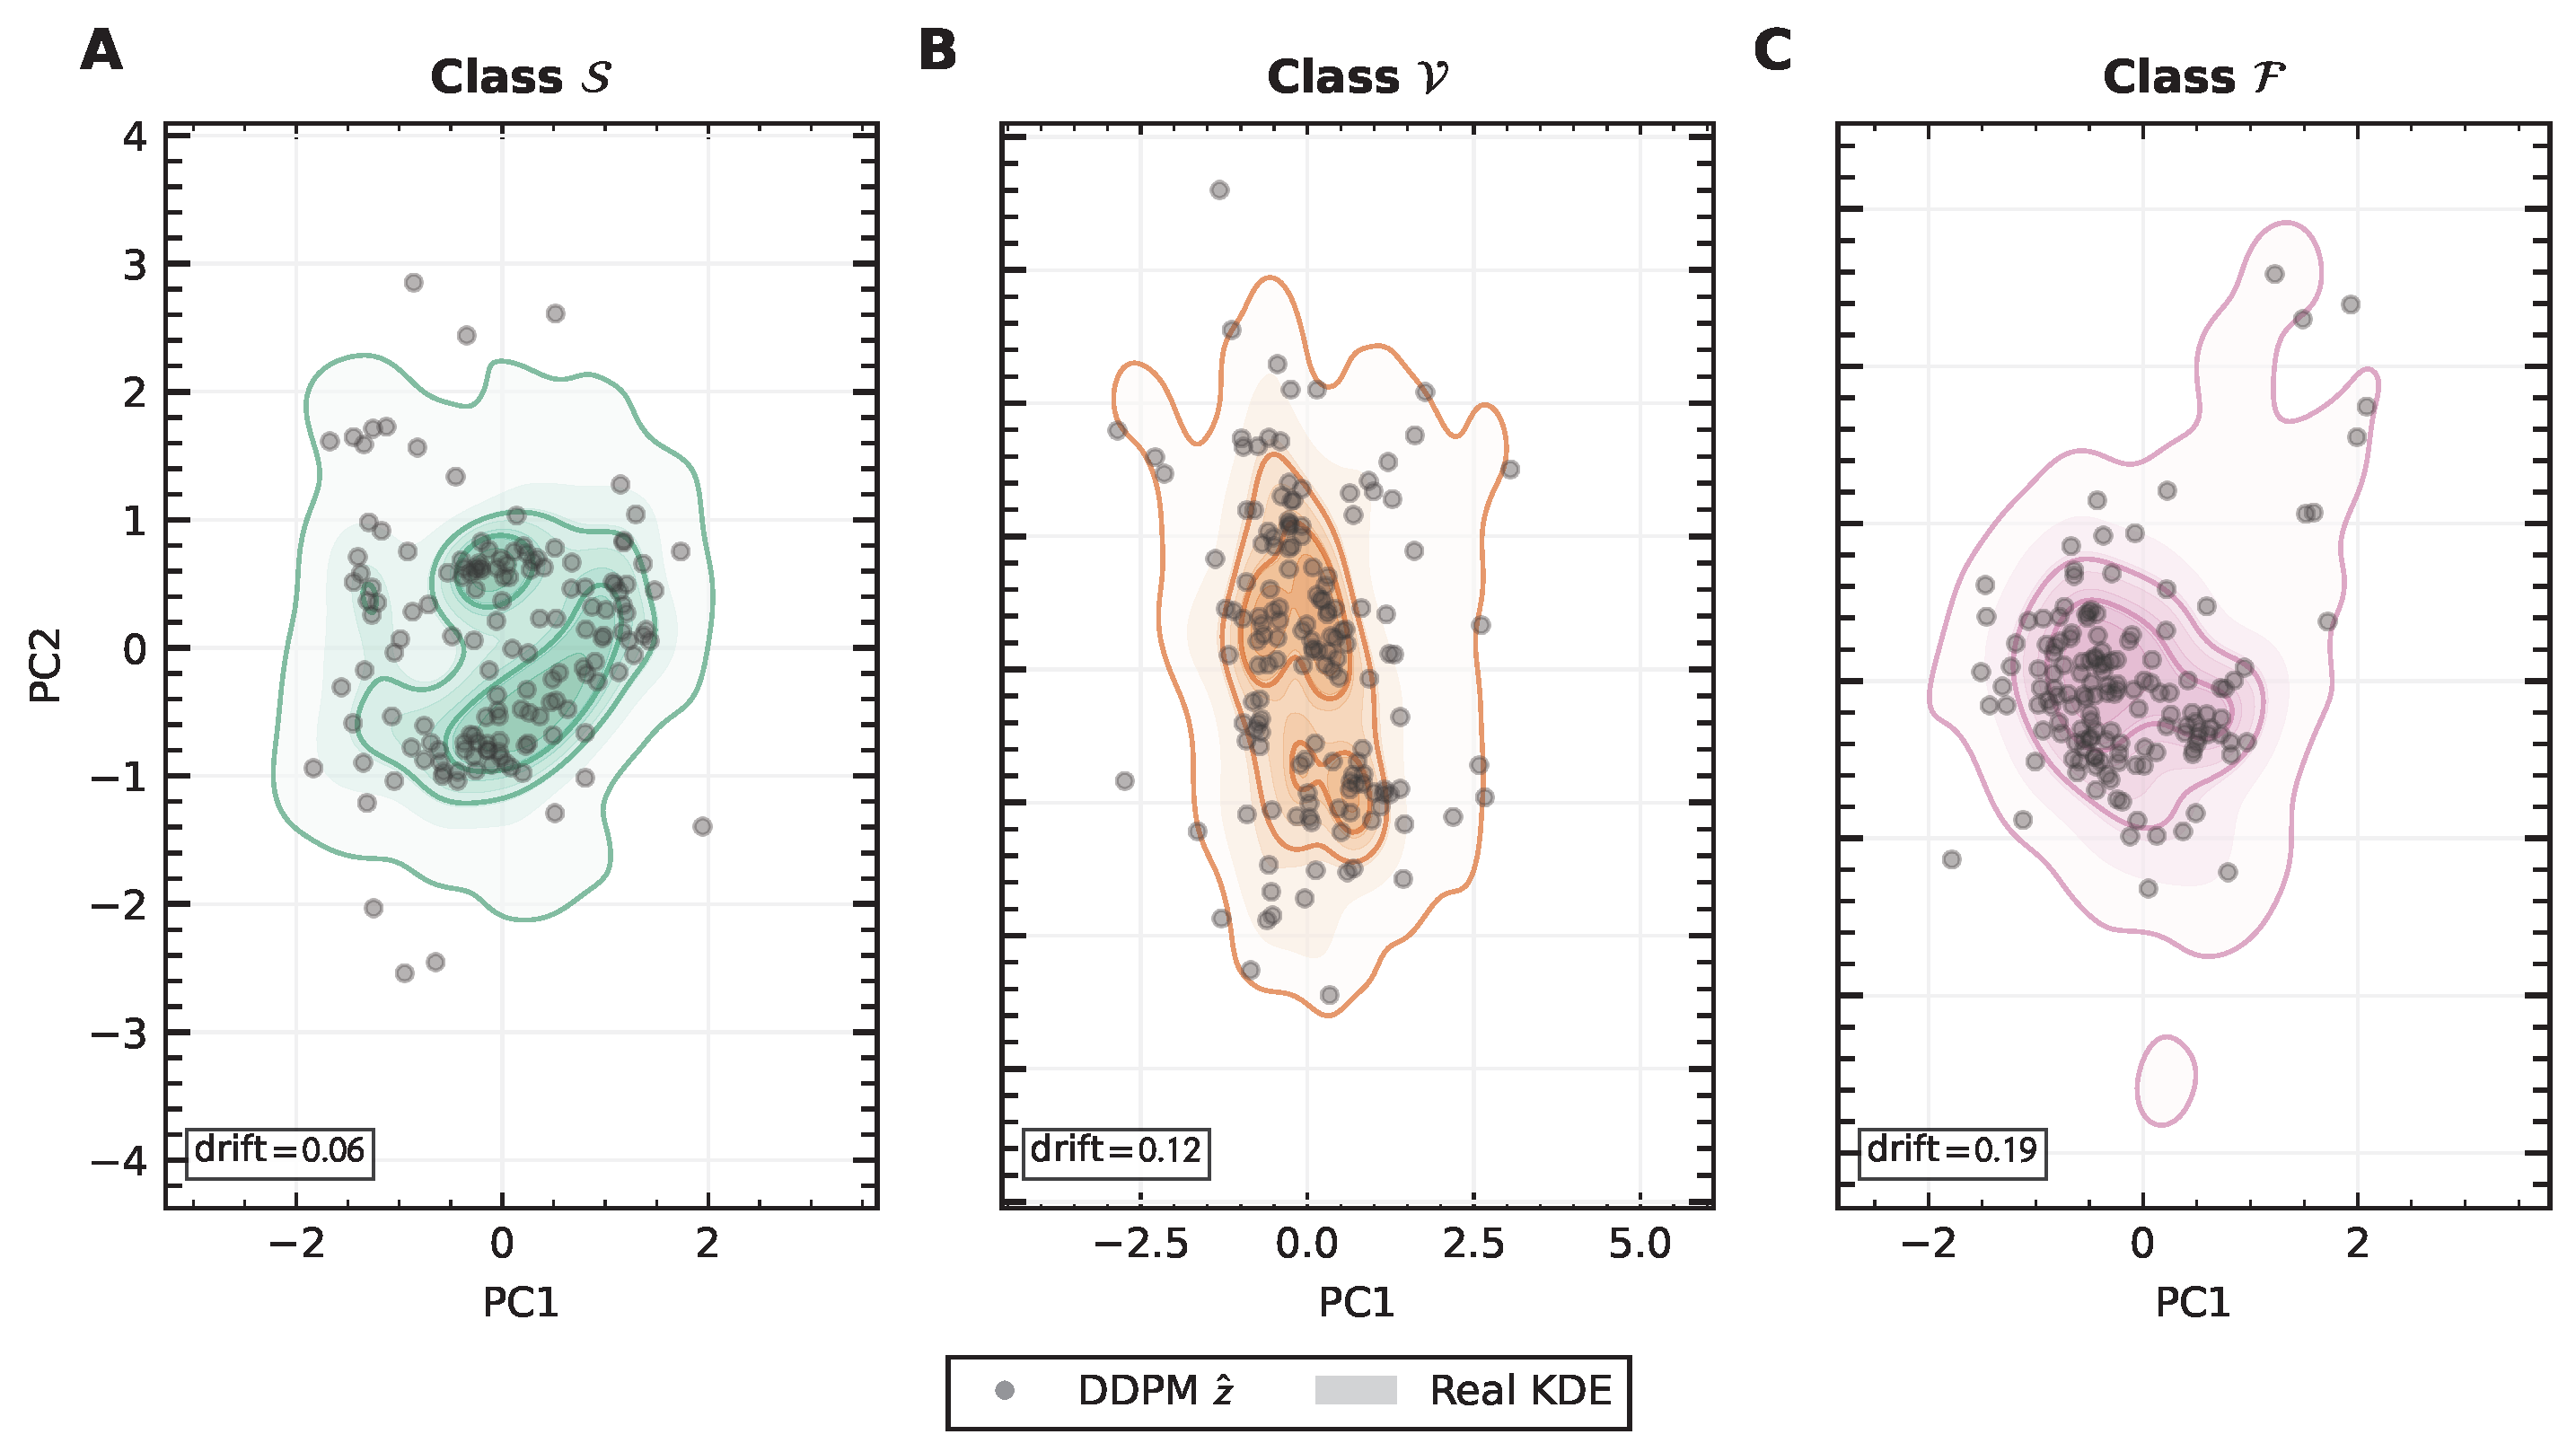
Figure 12 shows PCA-projected latent distributions for the three minority classes, overlaying DDPM-generated samples against the kernel density estimate (KDE) of the real latent bank. The first two principal components explain 14.7% and 12.9% of the total latent variance, respectively.
To quantify how well the synthetic latent cloud covers the real class manifold, distribution drift is measured as the squared Maximum Mean Discrepancy between the real latent distribution P and the DDPM-generated distribution Q. Unlike the adaptive-bandwidth kernel used during QLR training (Section 2.5), this evaluation metric uses a mixture of L = 5 RBF kernels with fixed bandwidths γ { 0.5 , 1.0 , 2.0 , 5.0 , 10.0 } to improve robustness against scale differences across classes. The per-kernel MMD2 values are averaged:
d ( P , Q ) = 1 L = 1 L 1 n 2 i , j k ( z i , z j ) 2 n m i , j k ( z i , z ^ j ) + 1 m 2 i , j k ( z ^ i , z ^ j )
where k ( z , z ) = exp γ z z 2 and n, m are the number of real and synthetic latent samples, respectively. A value of d ( P , Q ) = 0 indicates identical distributions. Larger values reflect systematic displacement of the synthetic cloud from the real manifold.
DDPM-generated samples broadly cover the support of each real distribution. Distribution drift values of 0.06 ( S ), 0.12 ( V ), and 0.19 ( F ) confirm reasonable fidelity across all three classes. Class F exhibits the largest drift, consistent with its small training pool (708 beats, the smallest of the three minority classes) yielding a noisier and less stable distributional estimate. Cosine similarity for Class F remains high ( 0.995 , Table 2) despite the higher drift value, though its RMSD is correspondingly less stable for this class.
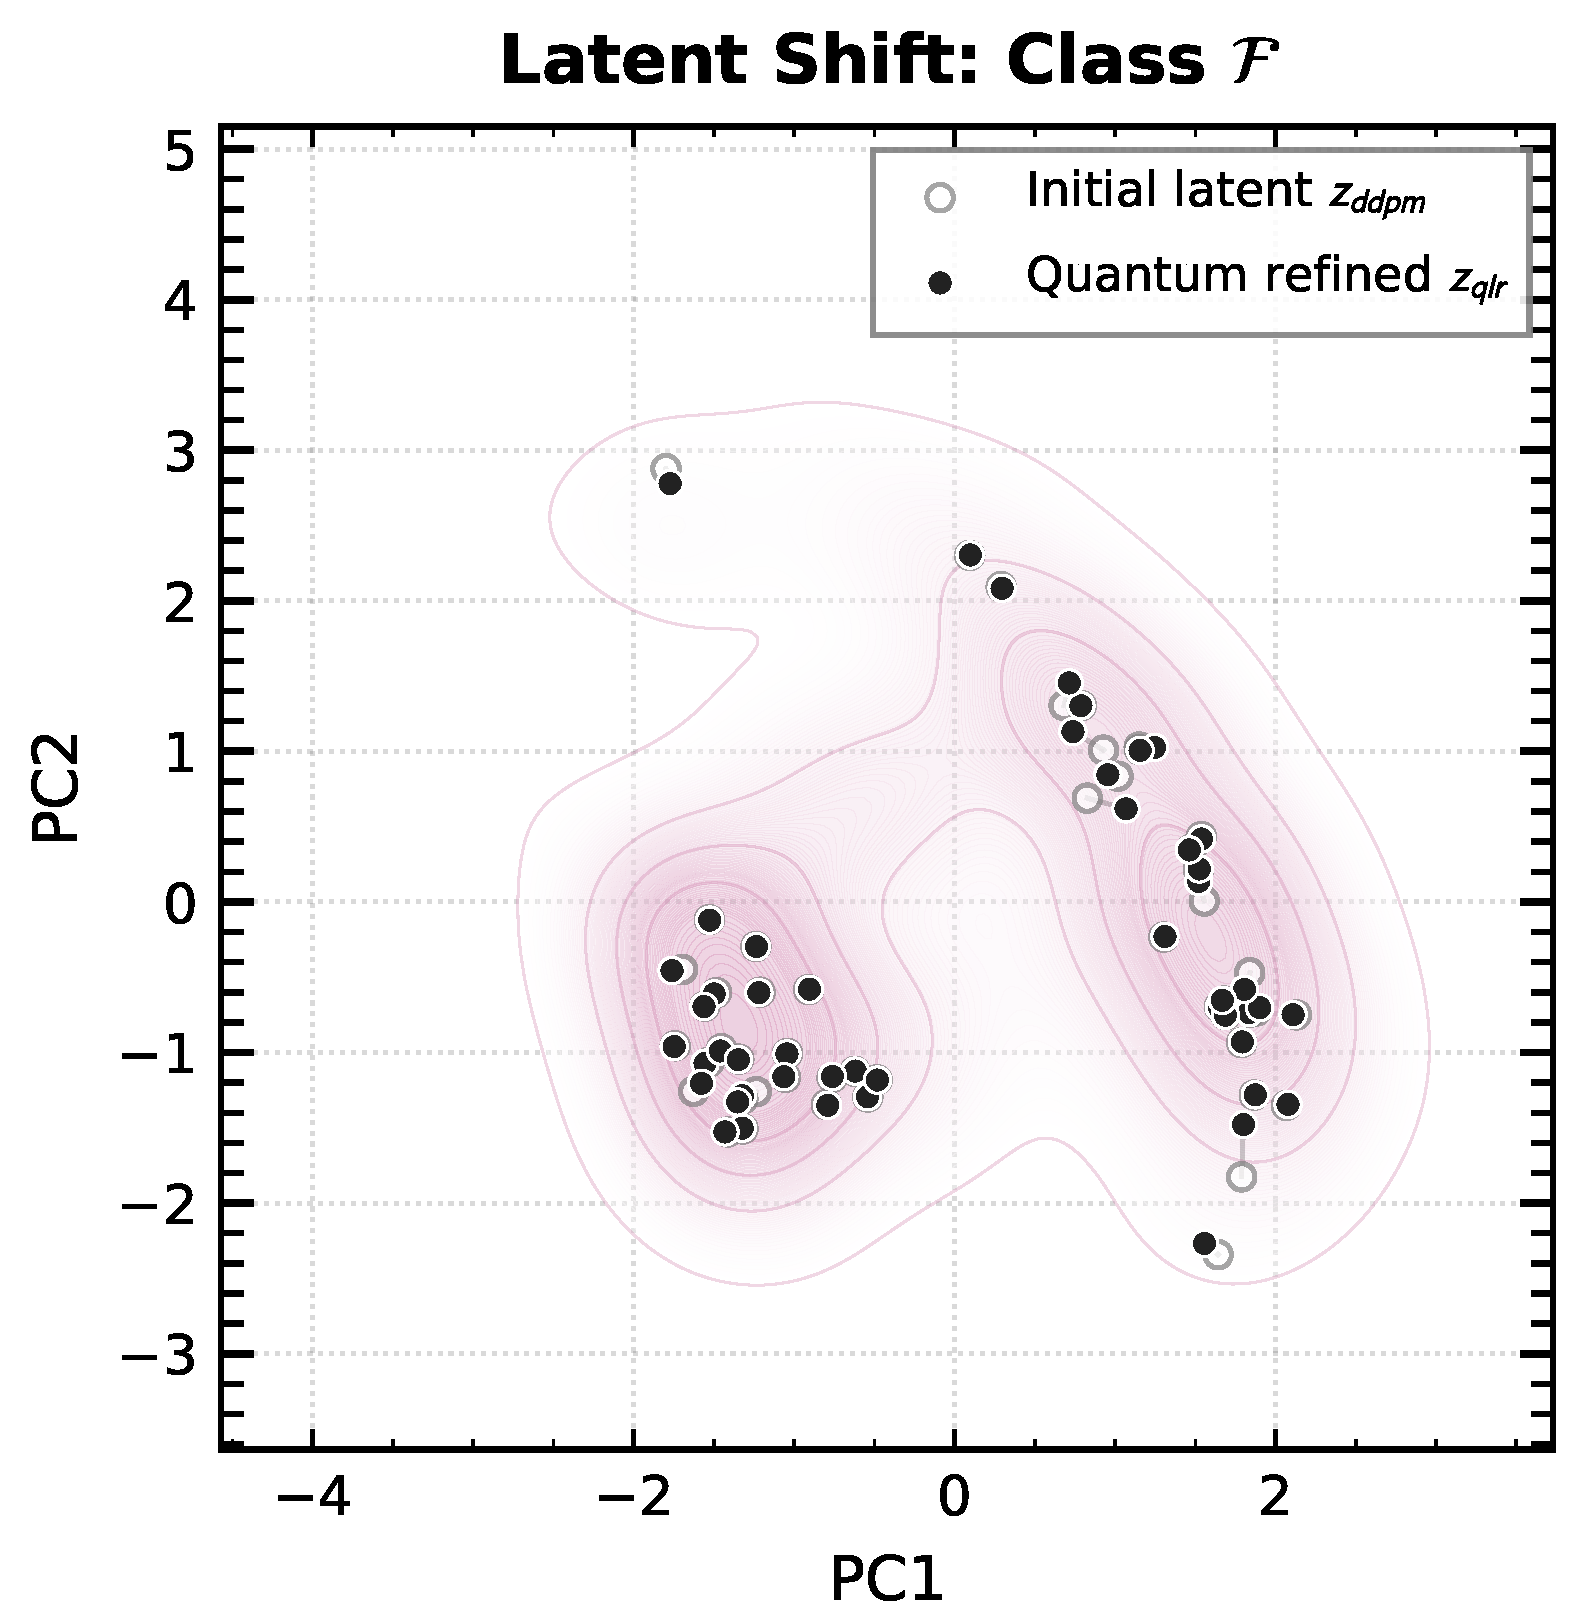
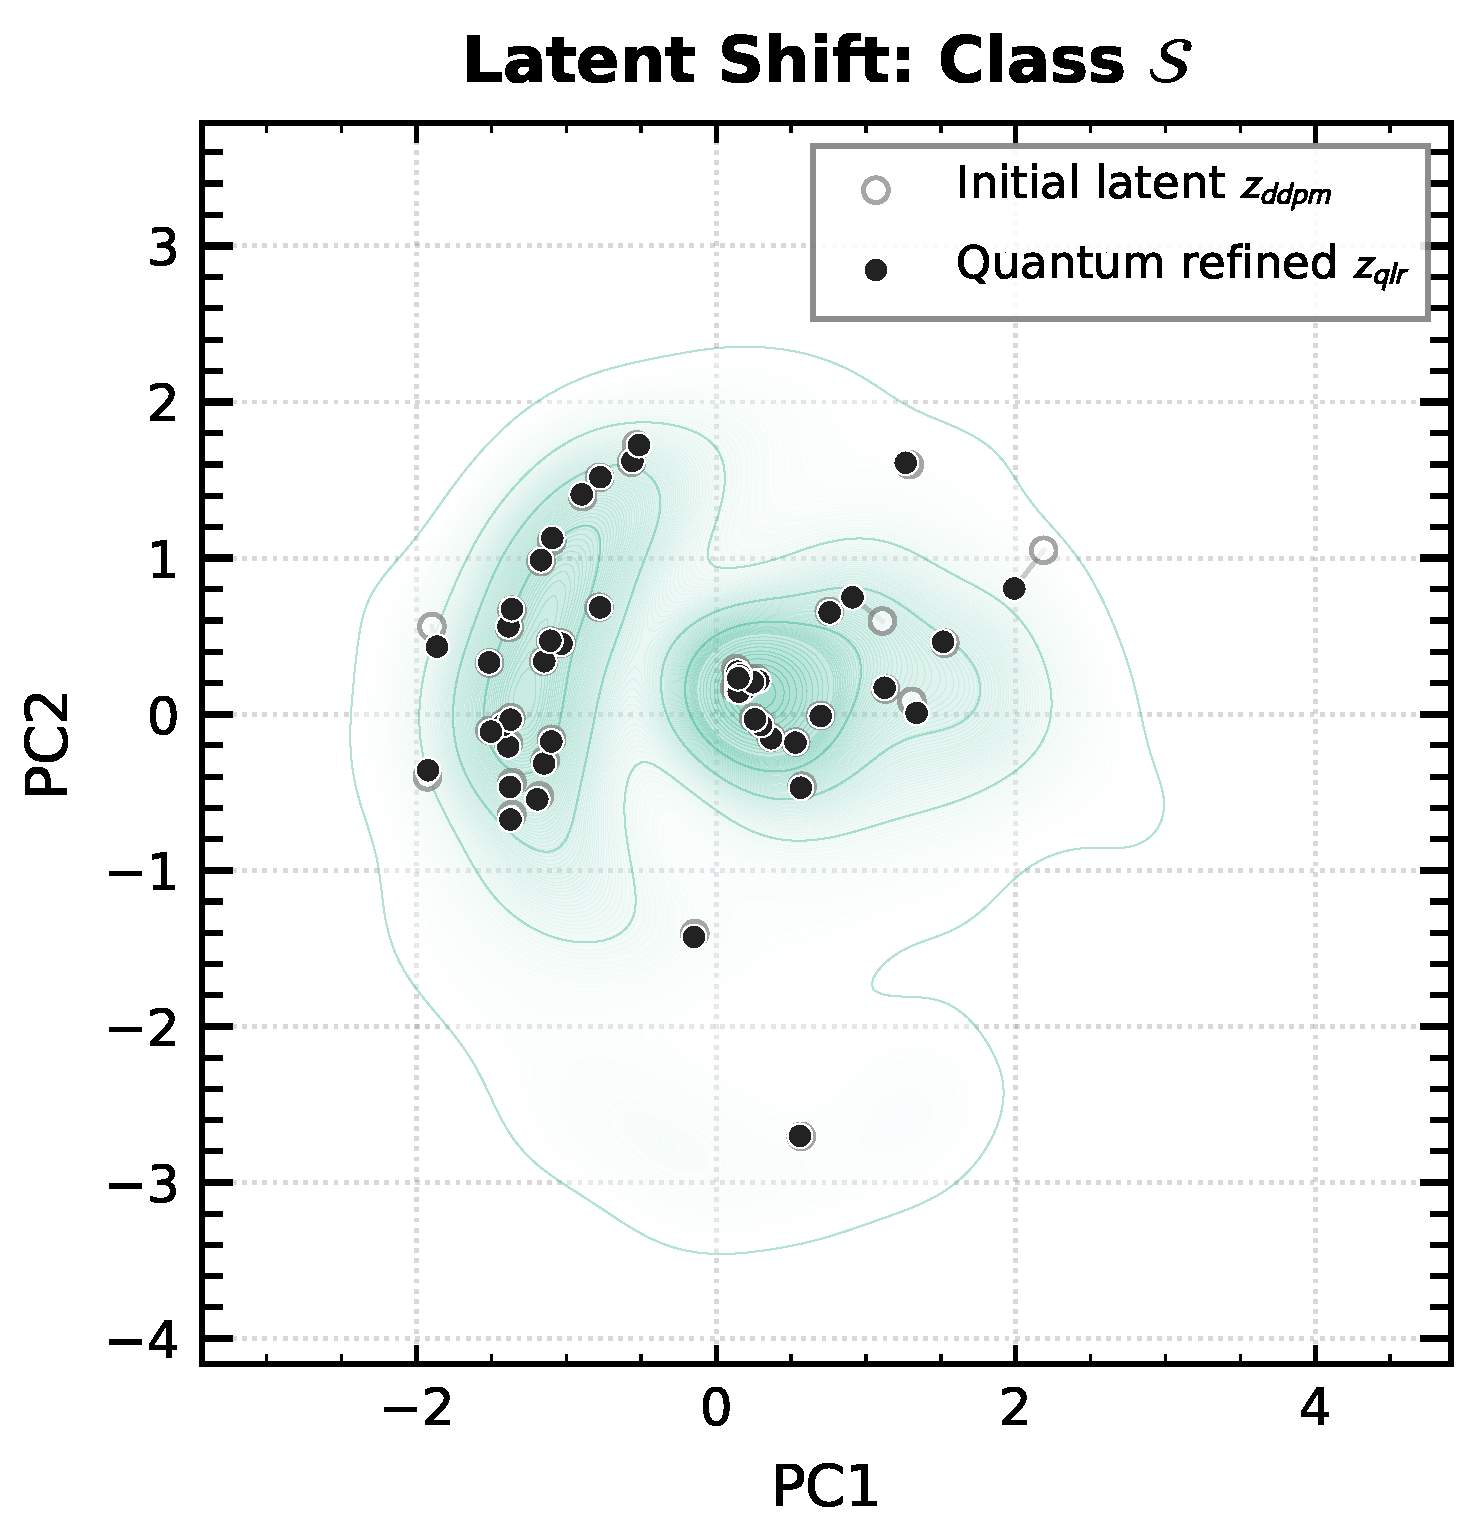
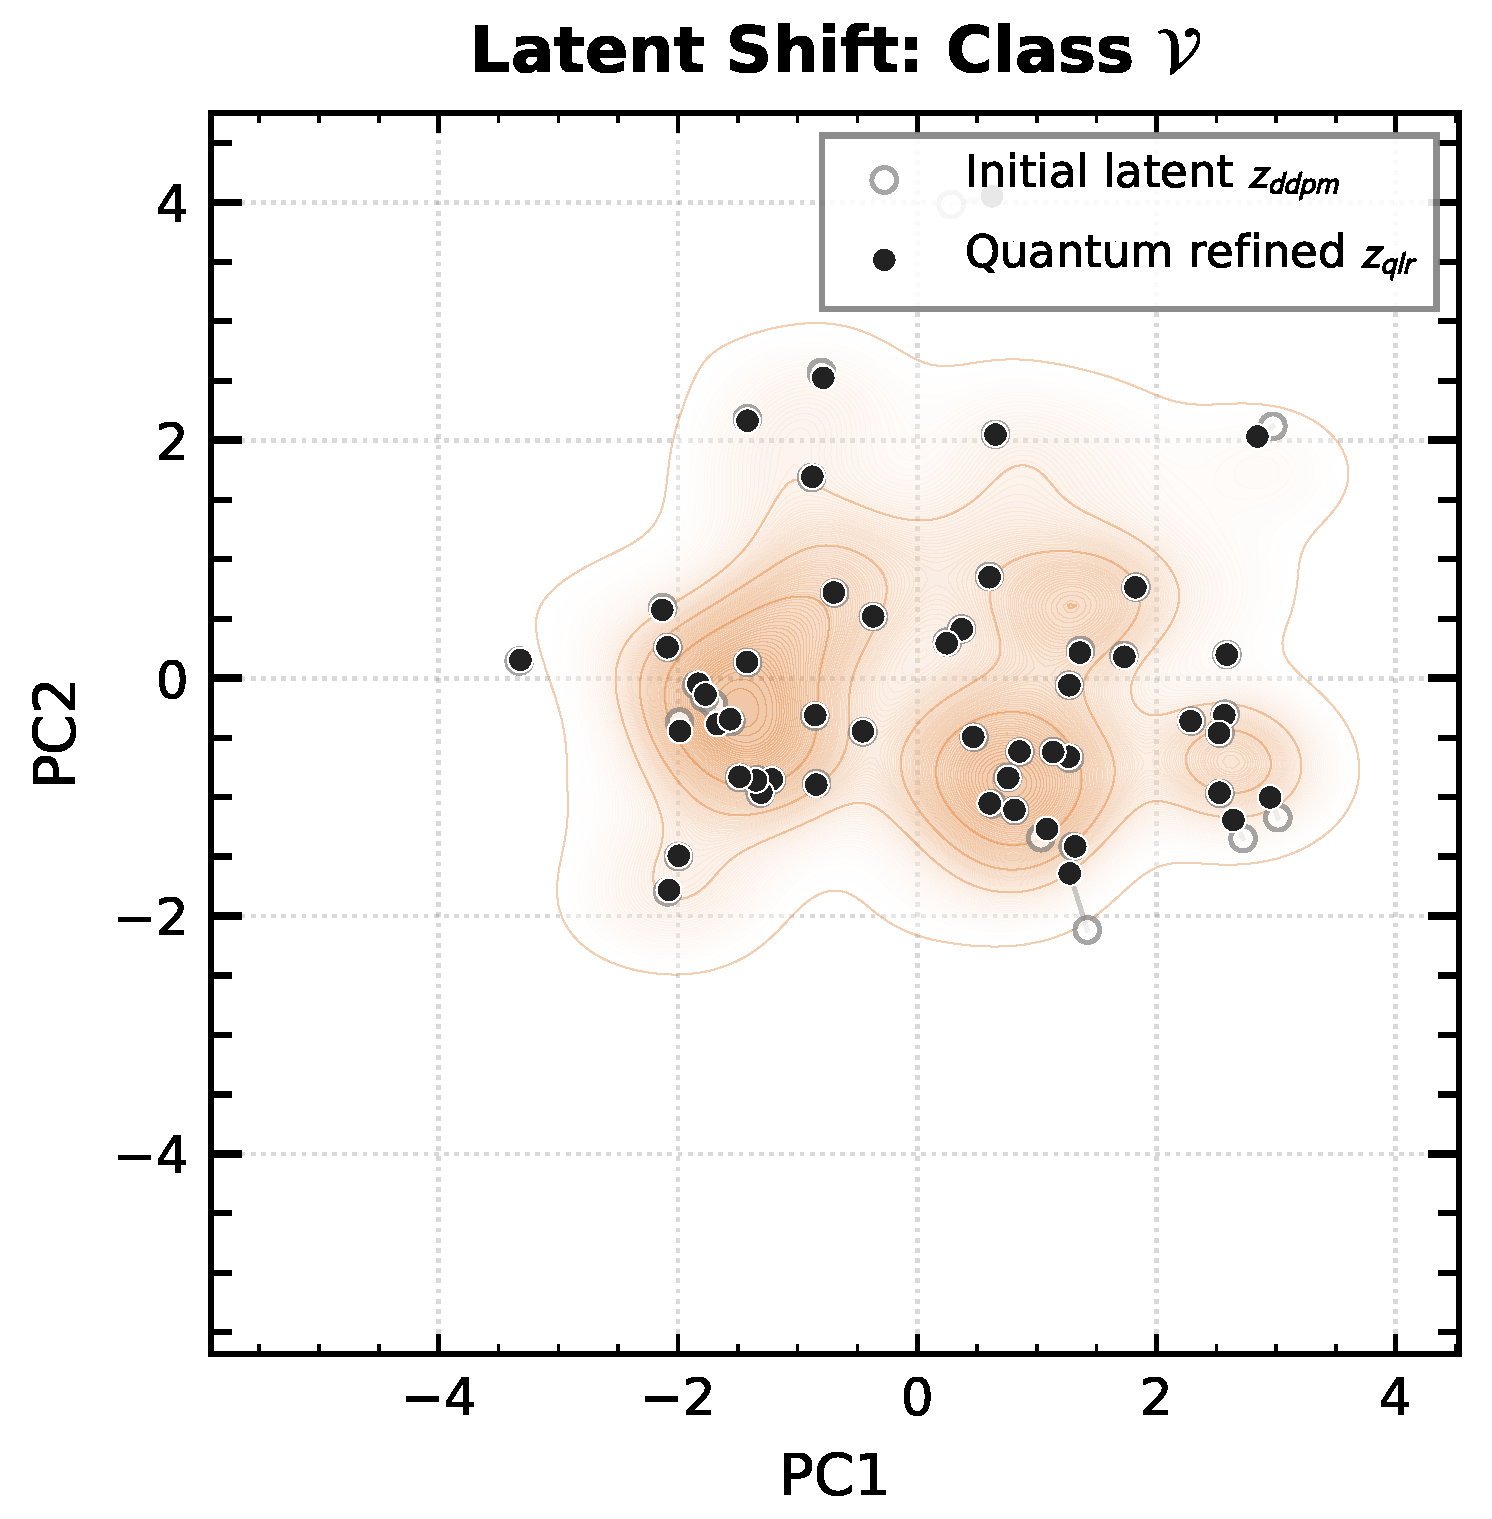
Figure 13, Figure 14 and Figure 15 illustrate the QLR-induced latent shifts for each minority class. Refined points (filled circles) consistently move toward higher-density regions of the real KDE relative to their DDPM origins (hollow circles), without collapsing to a single mode. This behavior confirms that the stay loss and MMD objectives act in concert as intended: the stay loss preserves distributional diversity and prevents degenerate solutions, while the MMD term pulls the synthetic cloud toward the real class manifold. Having established that the generative pipeline produces latent representations of high distributional fidelity, we now evaluate whether this latent space quality translates into downstream classification gains.

3.2. Classification Performance

3.2.1. Baseline and the Accuracy Paradox

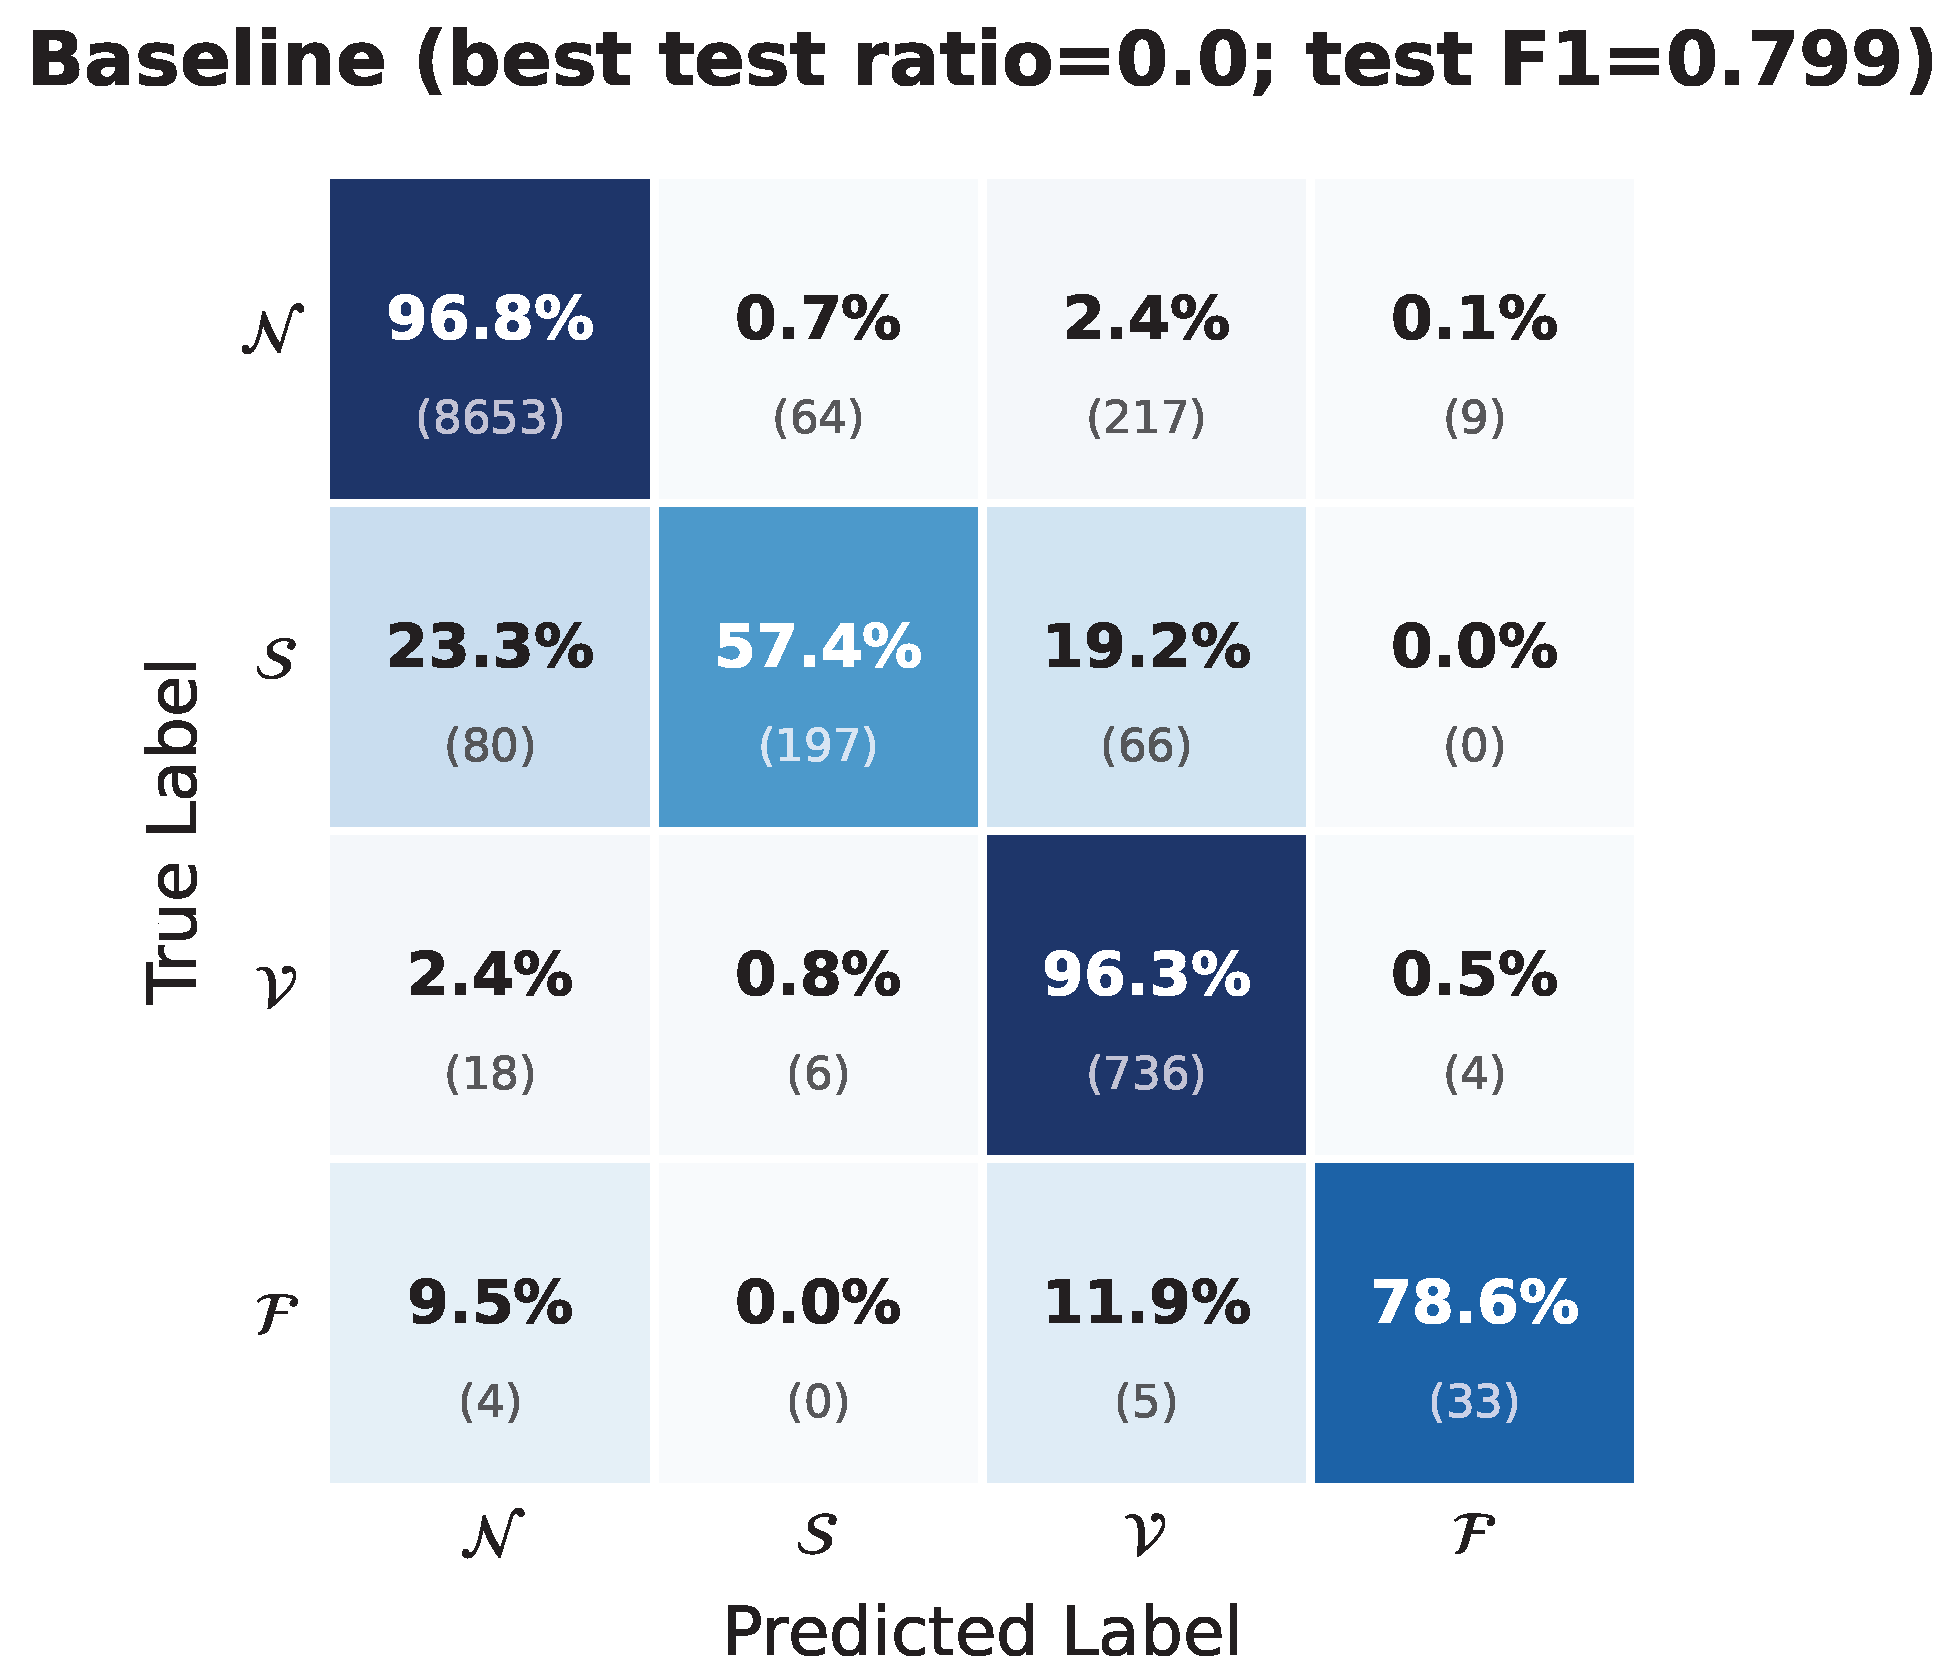
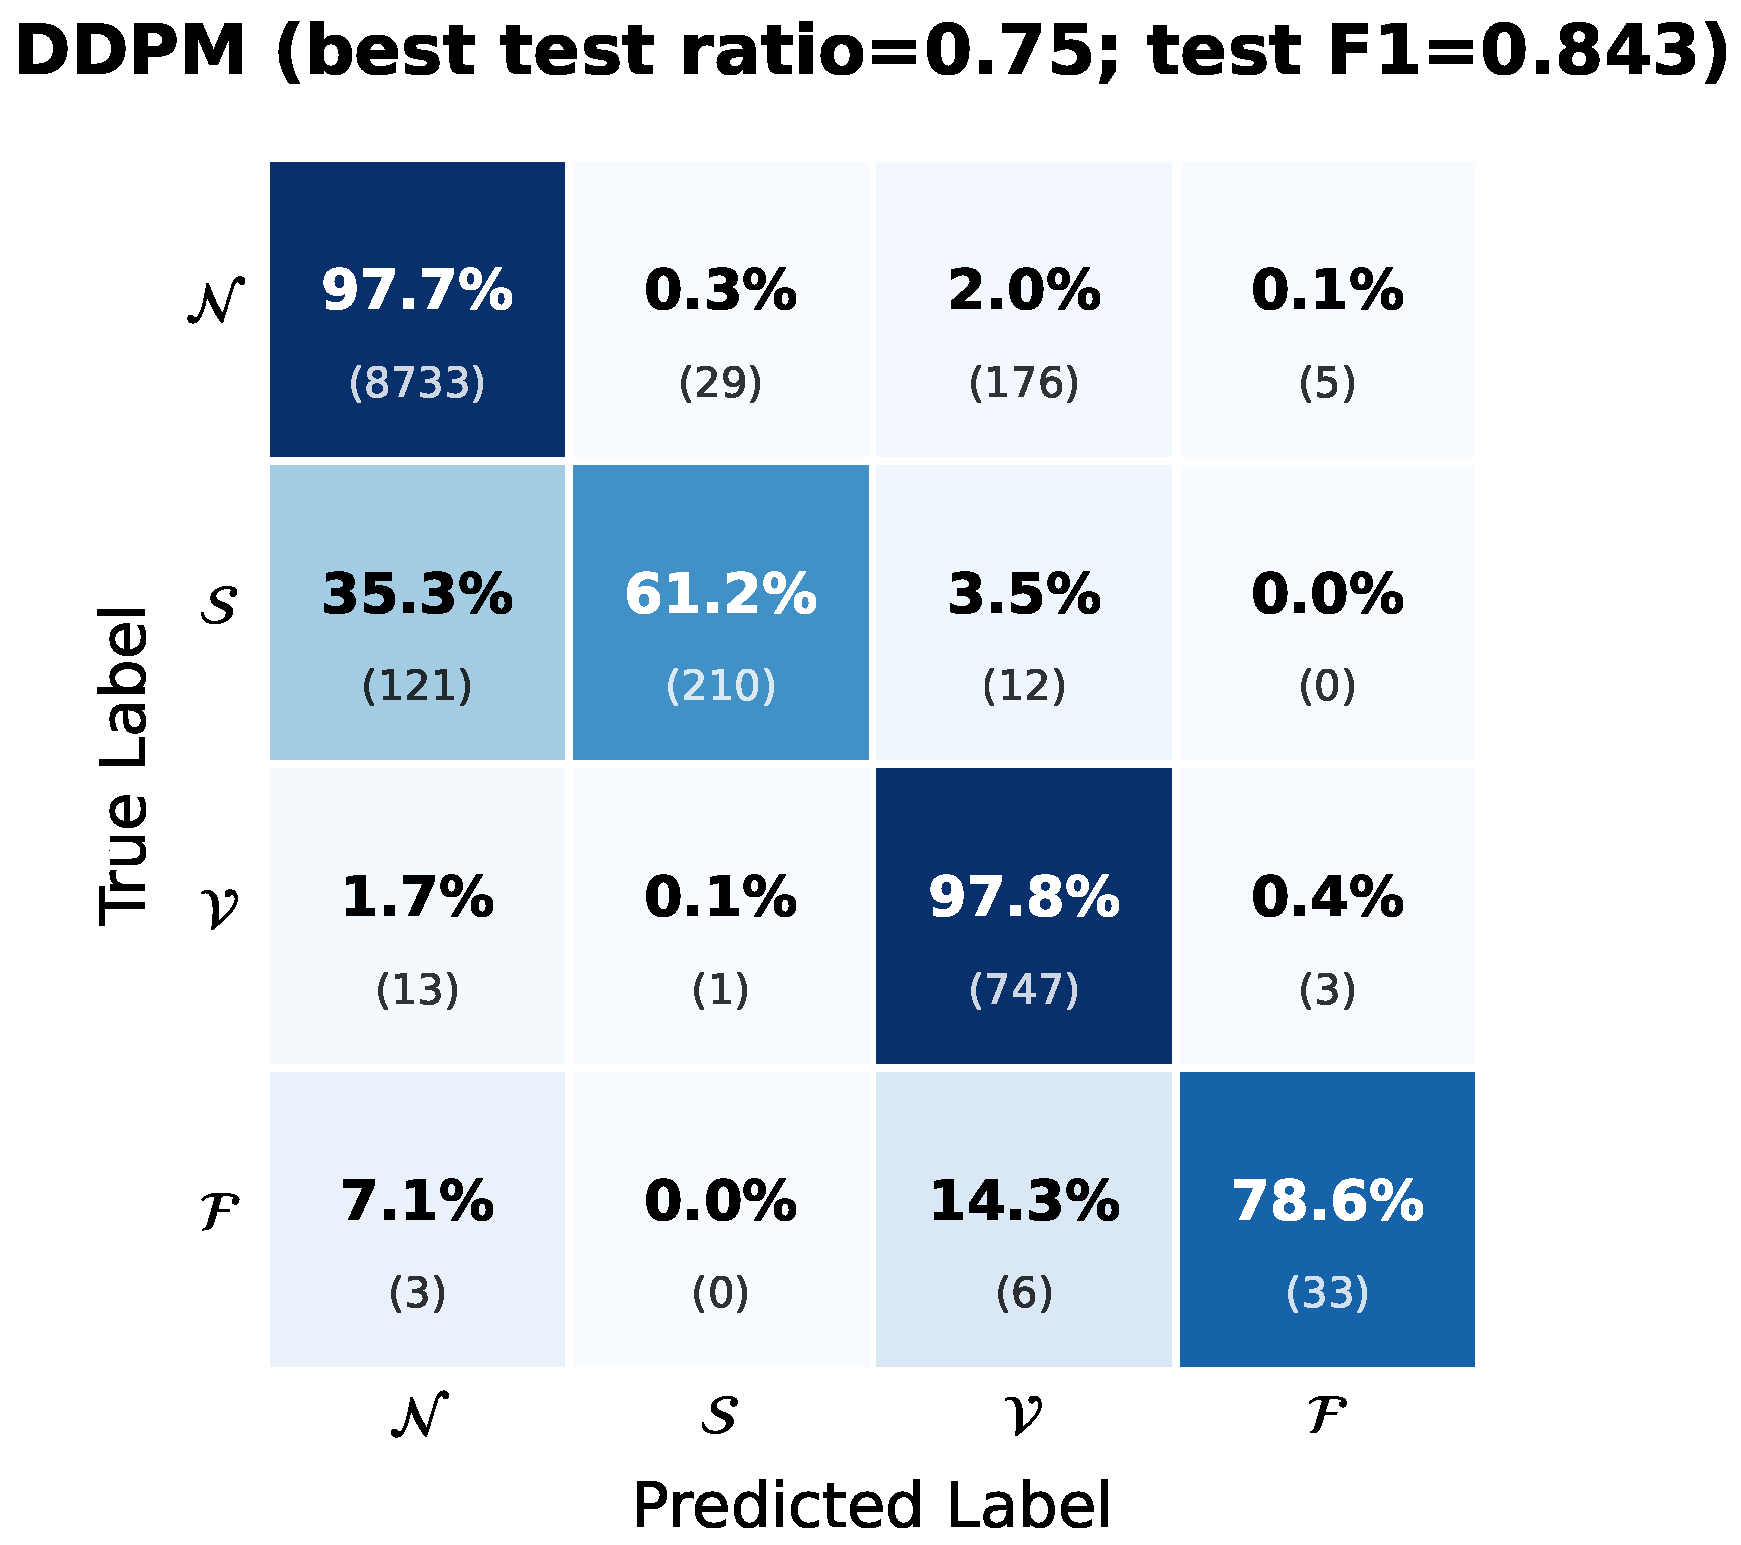
The unaugmented classifier achieves a test accuracy of 0.961 ± 0.005 alongside a Macro F1 of only 0.804 ± 0.014 —a gap of nearly 16 percentage points. This is a direct manifestation of the accuracy paradox: the high accuracy is inflated by the 88.6 % Normal-beat majority in the test set. This is consistent with the overall dataset distribution, since the intra-patient temporal split preserves each patient’s rhythm composition across the train and test windows—while per-class sensitivity for minority arrhythmias is substantially lower. In the seed-42 baseline run shown in Figure 16, Class N achieves 96.8% recall, but Class S records only 57.4% recall, with 19.2% of Supraventricular beats misclassified as Ventricular. V -class recall reaches 96.3% but at the cost of only 71.9% precision, meaning that a large fraction of Normal beats are incorrectly flagged as Ventricular. This is an error rate that would generate clinically unacceptable false alarm volumes in a monitoring system (Figure 16).
The following subsections show how generative augmentation systematically addresses the false alarm rate observed in this baseline and quantify the contribution of each pipeline stage. Per-class sensitivity, in contrast, improves only marginally under augmentation, as discussed below.

3.2.2. Overview of Augmentation Results

Table 4 reports the mean Macro F1 and standard deviation over ten independent random seeds for each method and ratio. Each augmentation method’s own best ratio is significantly higher than the unaugmented baseline (0.804, 95% CI [ 0.794 , 0.814 ] ; paired t-test): cVAE (0.832, 95% CI [ 0.825 , 0.840 ] ; p < 0.001 ), DDPM (0.826, 95% CI [ 0.814 , 0.839 ] ; p = 0.018 ), and DDPM + QLR (0.828, 95% CI [ 0.821 , 0.836 ] ; p = 0.0014 ) all reach significance with large effect sizes (Cohen’s d = 1.78 , 0.92 , and 1.43 respectively), whereas SMOTE’s improvement over baseline (0.807, 95% CI [ 0.797 , 0.817 ] ) does not ( p = 0.64 ; d = 0.15 ). SMOTE provides consistent gains at low augmentation ratios but peaks at ρ = 0.75 and degrades at ρ = 1.00 . All three deep generative methods (cVAE, DDPM, and DDPM + QLR) outperform SMOTE at ρ = 0.75 and ρ = 1.00 . cVAE attains the single highest mean Macro F1 in this table, 0.832 ± 0.010 (95% CI [ 0.825 , 0.840 ] ) at ρ = 0.75 . DDPM + QLR attains the highest value at two of the four ratios: ρ = 0.50 ( 0.827 ± 0.013 , 95% CI [ 0.817 , 0.836 ] ) and ρ = 1.00 ( 0.828 ± 0.010 , 95% CI [ 0.821 , 0.836 ] ). None of these differences is statistically significant: DDPM + QLR is not distinguishable from plain DDPM at any ratio (closest at ρ = 0.50 : DDPM 0.813, 95% CI [ 0.802 , 0.824 ] vs. DDPM + QLR 0.827, 95% CI [ 0.817 , 0.836 ] ; p = 0.061 and d = 0.68 —note the overlapping intervals are consistent with the non-significant test) nor from cVAE at any ratio (all p > 0.2 ); see Section 2.6 for the full statistical protocol.
Table 5 provides a complete per-class breakdown of precision and recall for each method at its best augmentation ratio (SMOTE, cVAE, and DDPM: ρ = 0.75 ; DDPM + QLR: ρ = 1.00 ). Each cell reports the mean and standard deviation over ten random seeds. The table reveals several patterns that are not visible in the aggregate Macro F1. Macro-averaged precision rises consistently from 0.800 ± 0.024 at baseline to 0.853 ± 0.015 under DDPM + QLR, while macro-averaged recall changes more modestly, from 0.824 ± 0.006 to 0.823 ± 0.009 . This reflects the fact that augmentation primarily corrects precision deficits rather than uniformly boosting recall across all classes. The dominant driver of precision improvement is the V class, which rises from 0.795 ± 0.053 at baseline to 0.821 ± 0.047 under DDPM + QLR. This is a reduction in false Ventricular alarms that directly translates into clinical viability. S -class recall remains between 57% and 59% across all methods, confirming that augmentation addresses the false alarm problem more effectively than the missed-detection problem for Supraventricular beats. F -class results carry the highest variance across all methods, consistent with the very small test set of 42 Fusion beats.
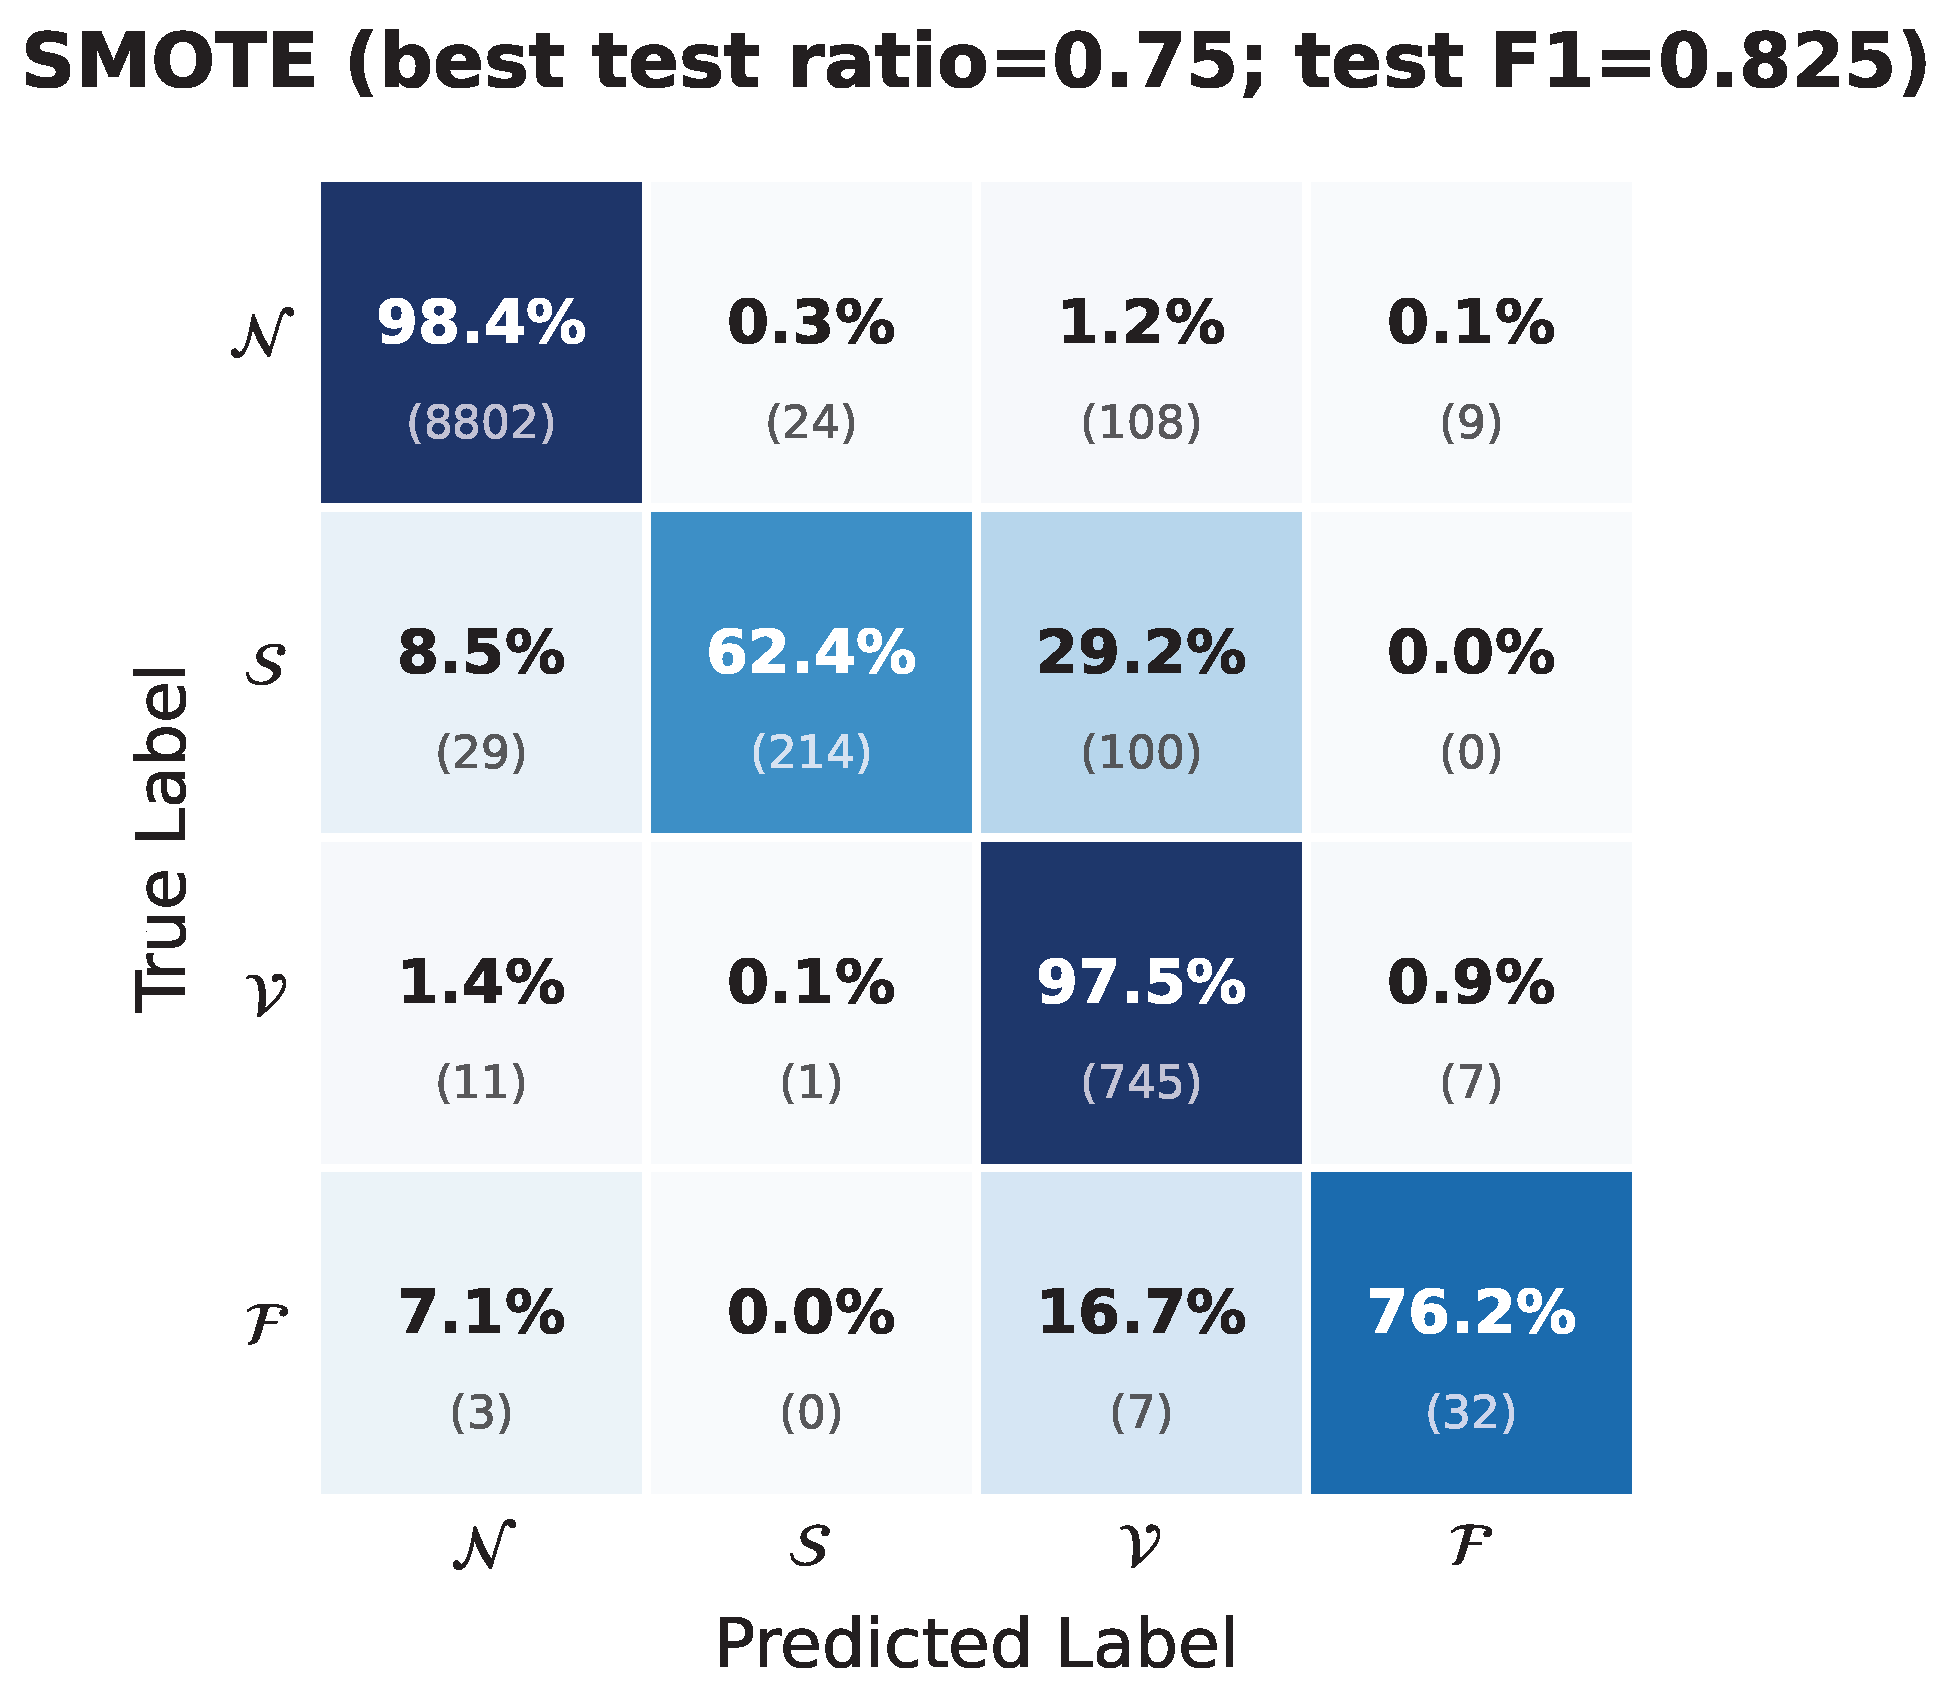
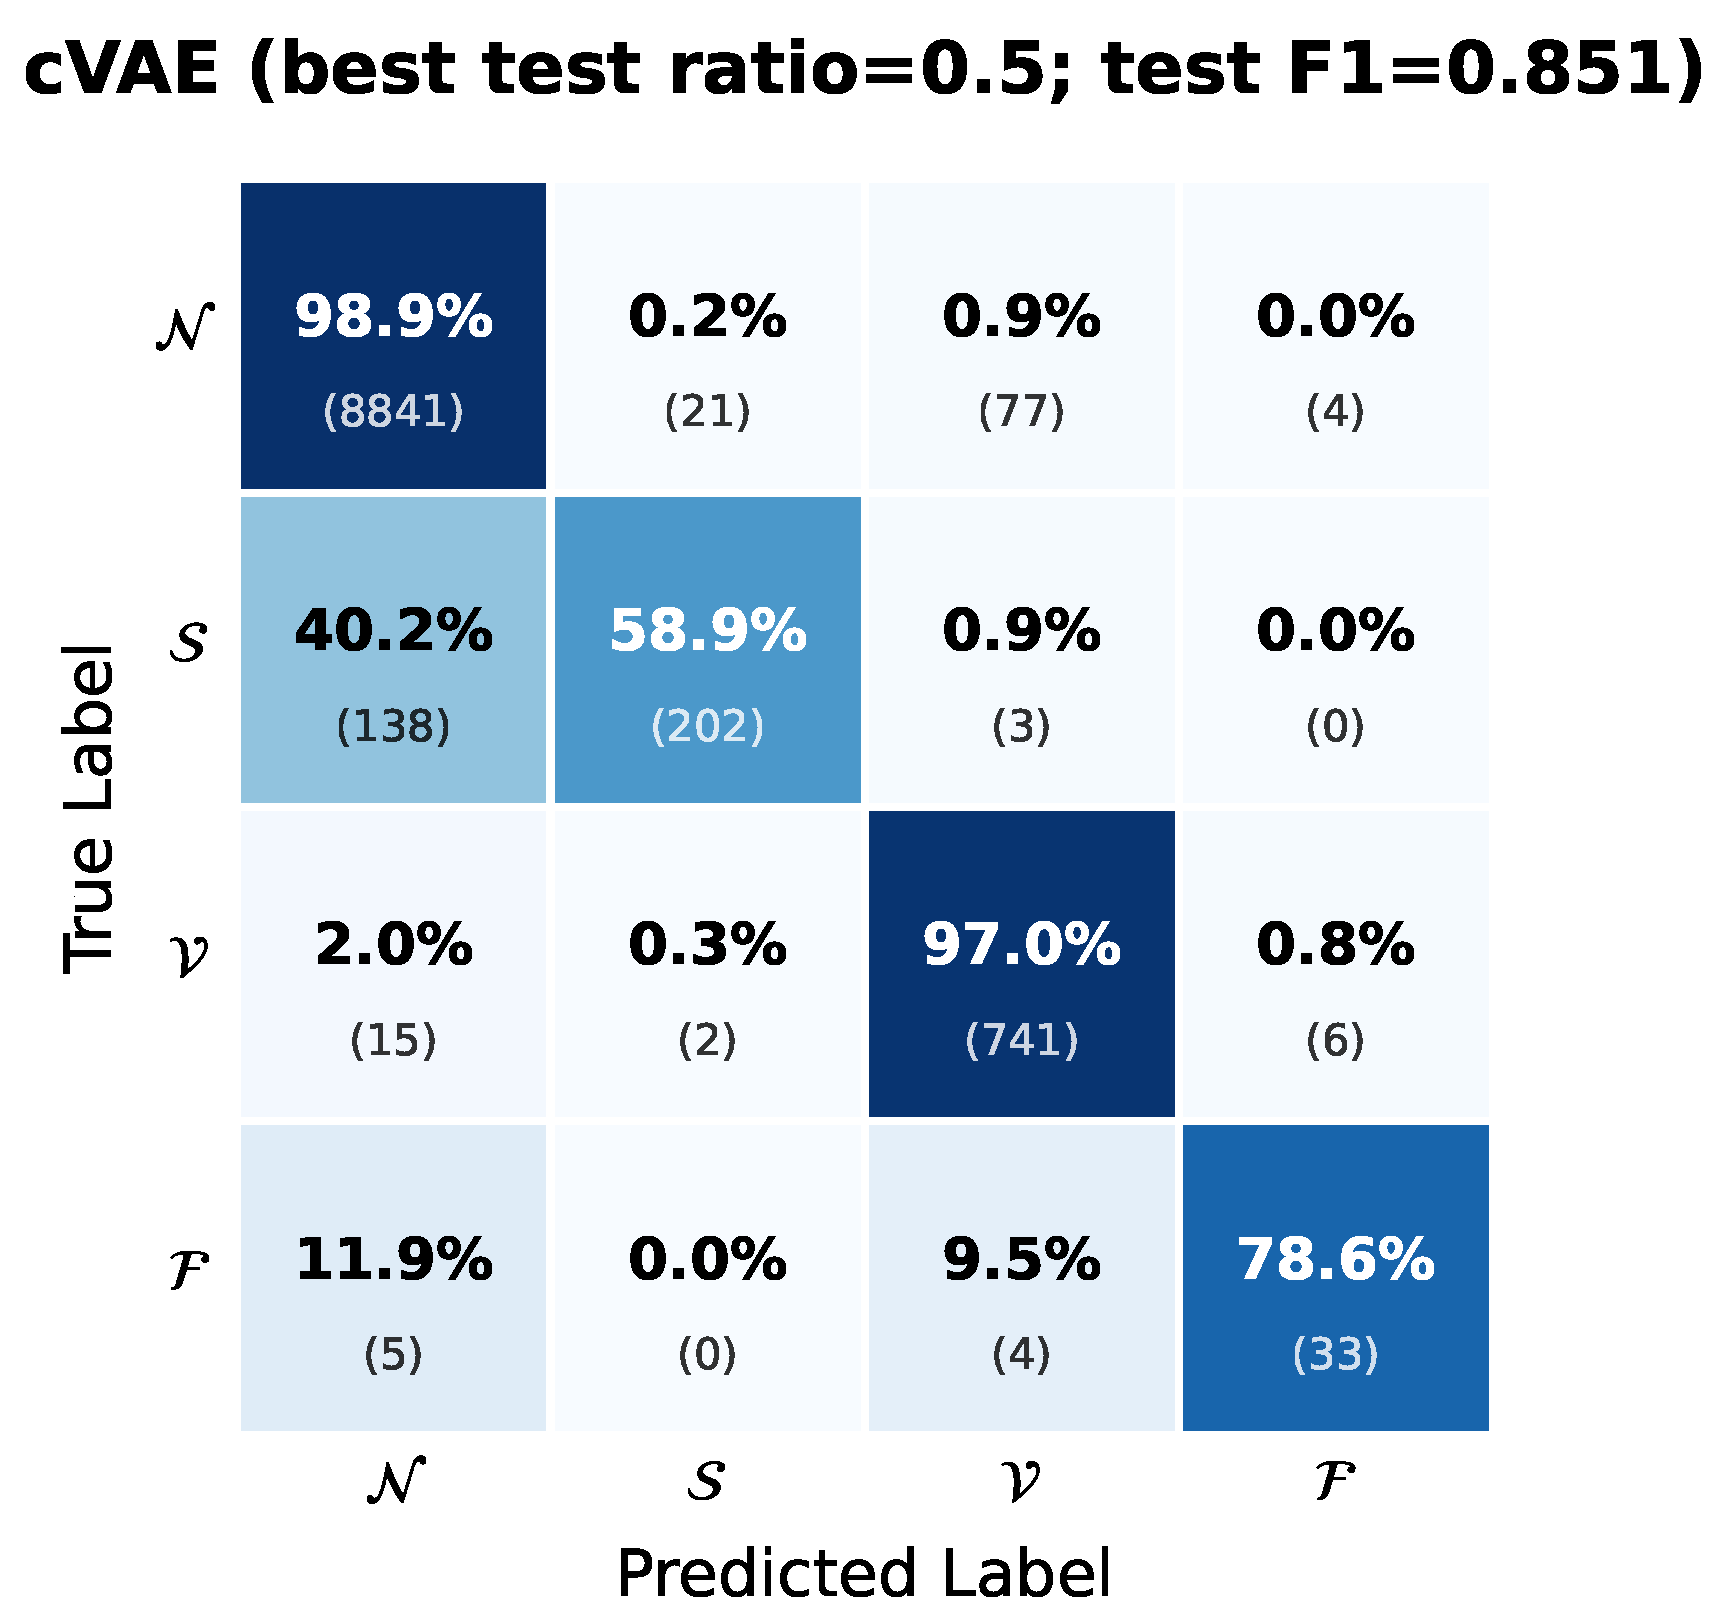
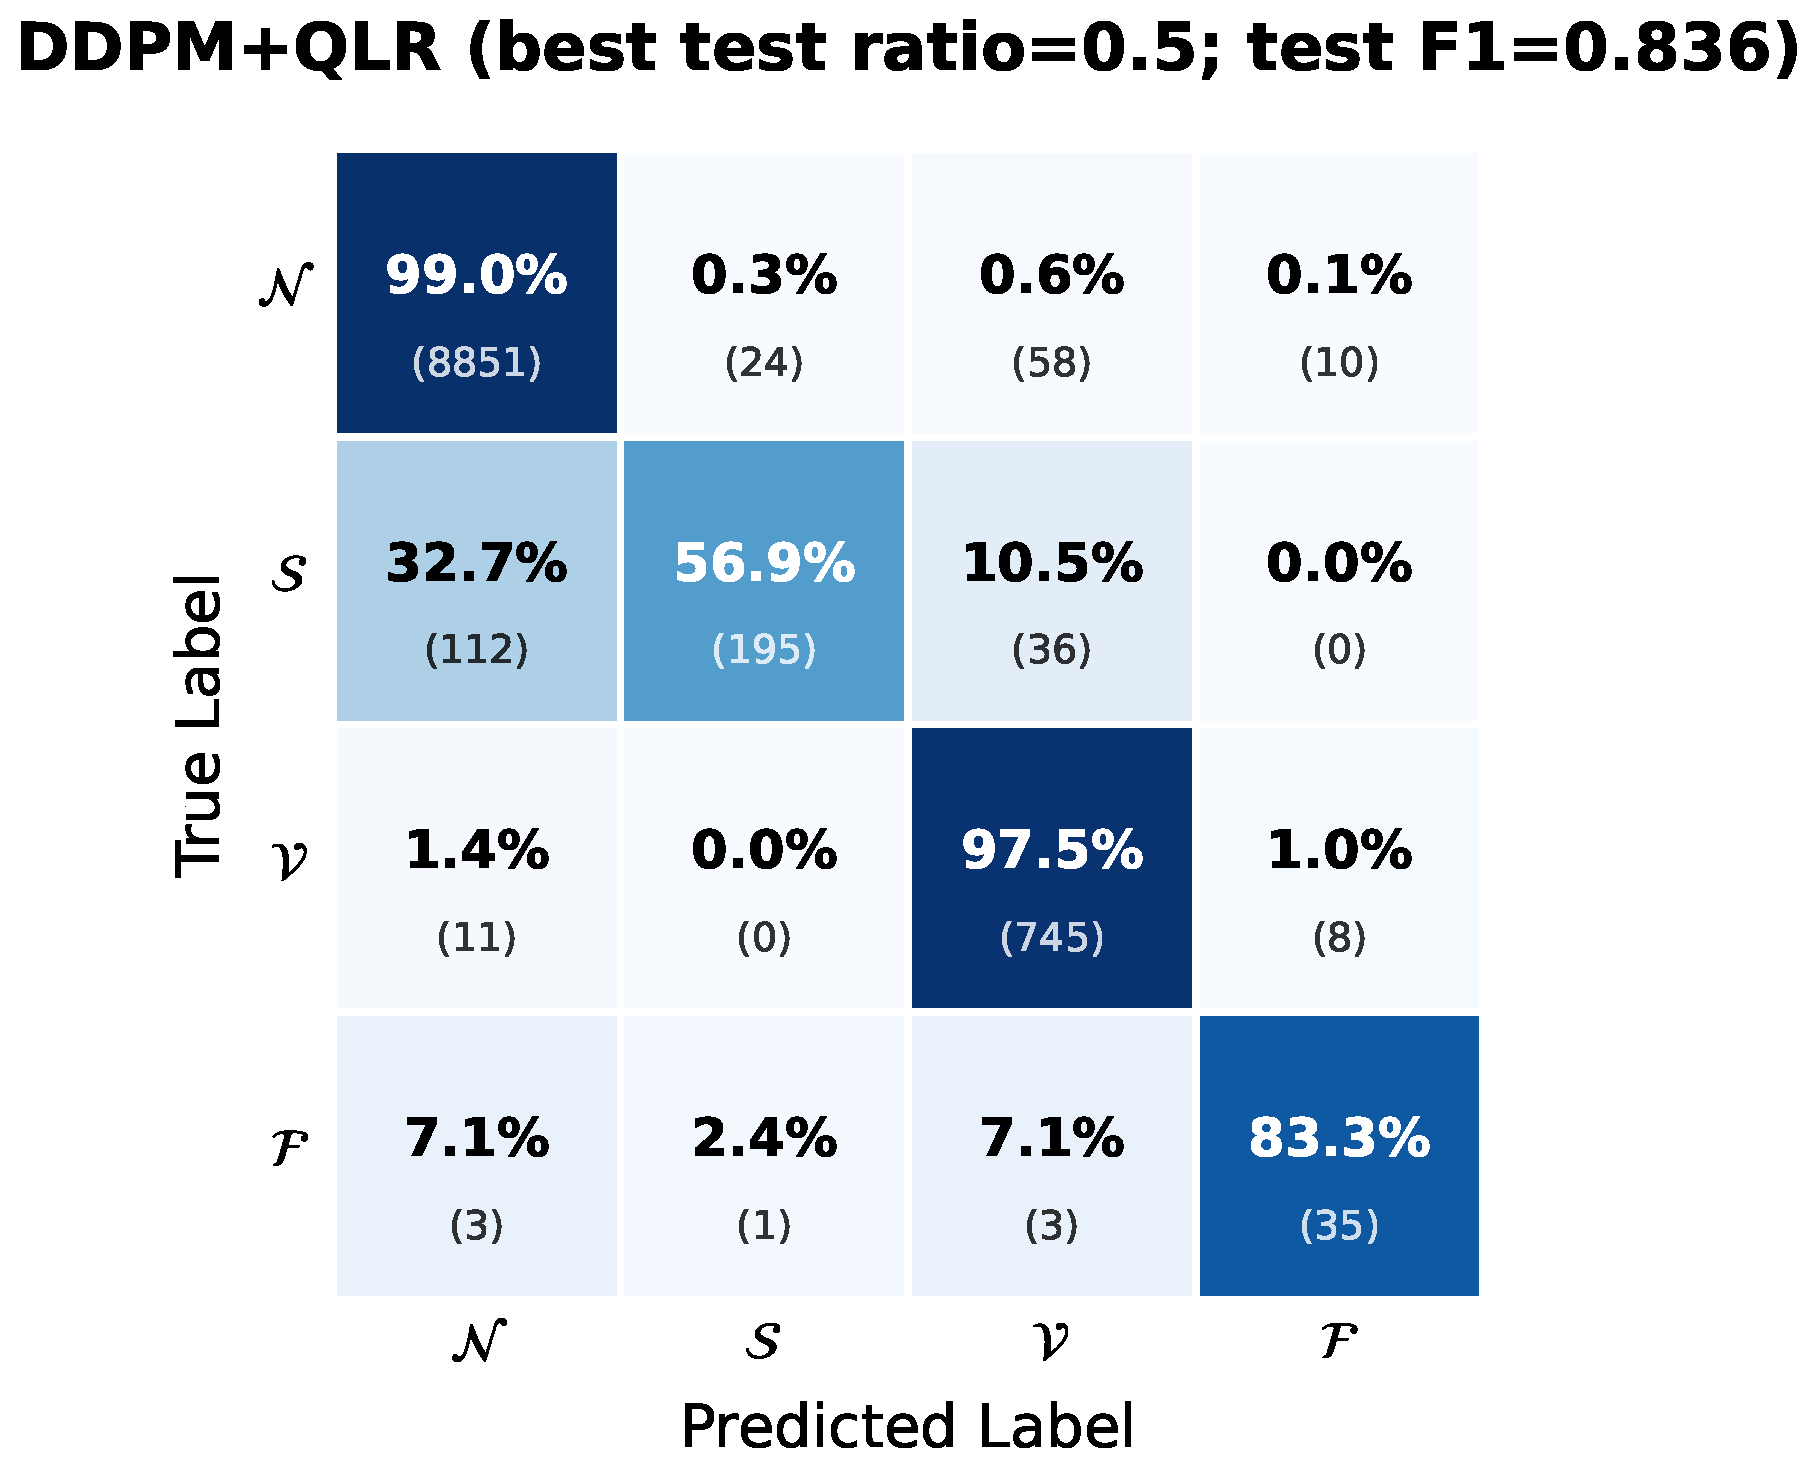
Figure 17, Figure 18, Figure 19 and Figure 20 show the confusion matrices for the seed-42 classifiers of each augmentation method at their best augmentation ratio. These are presented as representative examples. All quantitative conclusions are drawn from the ten-seed means reported in Table 4 and Table 5. These matrices should not be read as evidence of uniform improvement across classes: S -class recall remains near 60% under every method shown here, and the F -class test set of only 42 beats means its confusion-matrix percentages are highly sensitive to individual misclassifications and should not be overinterpreted as stable estimates of Fusion-class performance. The gains visible in these figures are concentrated in the N - and V -class cells discussed below, not distributed evenly across all four classes. All methods substantially reduce the N -class false positive rate, improving N -class recall from 96.8% (seed-42 baseline) to approximately 98–99%. The primary mechanism behind the Macro F1 improvement is not a uniform increase in all class-wise recalls. Rather, it is a dramatic increase in V -class precision, driven by the reduction in Normal beats being misclassified as Ventricular.

3.2.3. Ensemble Inference

The confusion matrices above illustrate single-seed behavior; combining all ten seed-specific classifiers into a single ensemble provides the best-performing configuration in this study, discussed next. A ten-model soft-voting ensemble combining the DDPM + QLR classifiers trained at ρ = 1.00 across all ten seeds achieves a test Macro F1 of 0.853—the highest overall result in this study, though only narrowly above cVAE’s ten-seed mean peak of 0.832 ± 0.010 at ρ = 0.75 (Table 4). The ensemble operates globally. Each of the ten models produces a four-class probability vector for every test beat, and the vectors are averaged before taking the argmax. No patient-specific model selection or per-record weighting is applied. Class-wise results are: N -class F1 = 0.983, S -class F1 = 0.729, V -class F1 = 0.906, F -class F1 = 0.795, and weighted-average F1 = 0.968. The ensemble V -class result (recall 97.9%; precision 84.3%) represents an improved operating point compared to the ten-seed mean baseline V -class precision of 79.5% (Table 5), a smaller margin than previously reported once measured against the full ten-seed baseline rather than a single illustrative seed, but still reducing the false Ventricular alarm rate further. The S -class and F -class ensemble F1 values also improve relative to single-seed means, as soft-voting effectively pools complementary decision boundaries from different random initializations.

3.3. Minority Class Analysis and Ablation

3.3.1. Per-Class Minority Analysis

S -class recall remains between 57% and 60% across all methods and seeds and does not improve meaningfully with augmentation. The ensemble S -class F1 of 0.729 (versus baseline ∼0.66) is driven primarily by precision: the ten-seed mean DDPM + QLR S -class precision reaches 87.8% compared to approximately 76.8% at baseline, indicating that augmentation sharply reduces false Supraventricular predictions without substantially increasing true positive recovery.
The F class, with only 708 training beats and 42 test beats, has highly variable single-seed performance estimates. The ensemble F -class F1 of 0.795 is the most stable F -class result obtained and is clinically encouraging, although robust conclusions for this class would require a dataset with substantially more Fusion beat instances.
The V class shows the clearest augmentation benefit of the three minority classes and is where the proposed pipeline’s contribution is most clinically consequential. As reported in Section 3.2.3, augmentation drives a substantial precision gain for this class while recall remains high throughout. Unlike S , where augmentation improves precision without a corresponding recall gain, the V -class improvement reflects a genuine reduction in false Ventricular alarms without sacrificing sensitivity to true Ventricular events, directly addressing the accuracy-paradox failure mode identified in the unaugmented baseline (Section 3.2.1).

3.3.2. QLR vs. Classical Refiners: Ablation

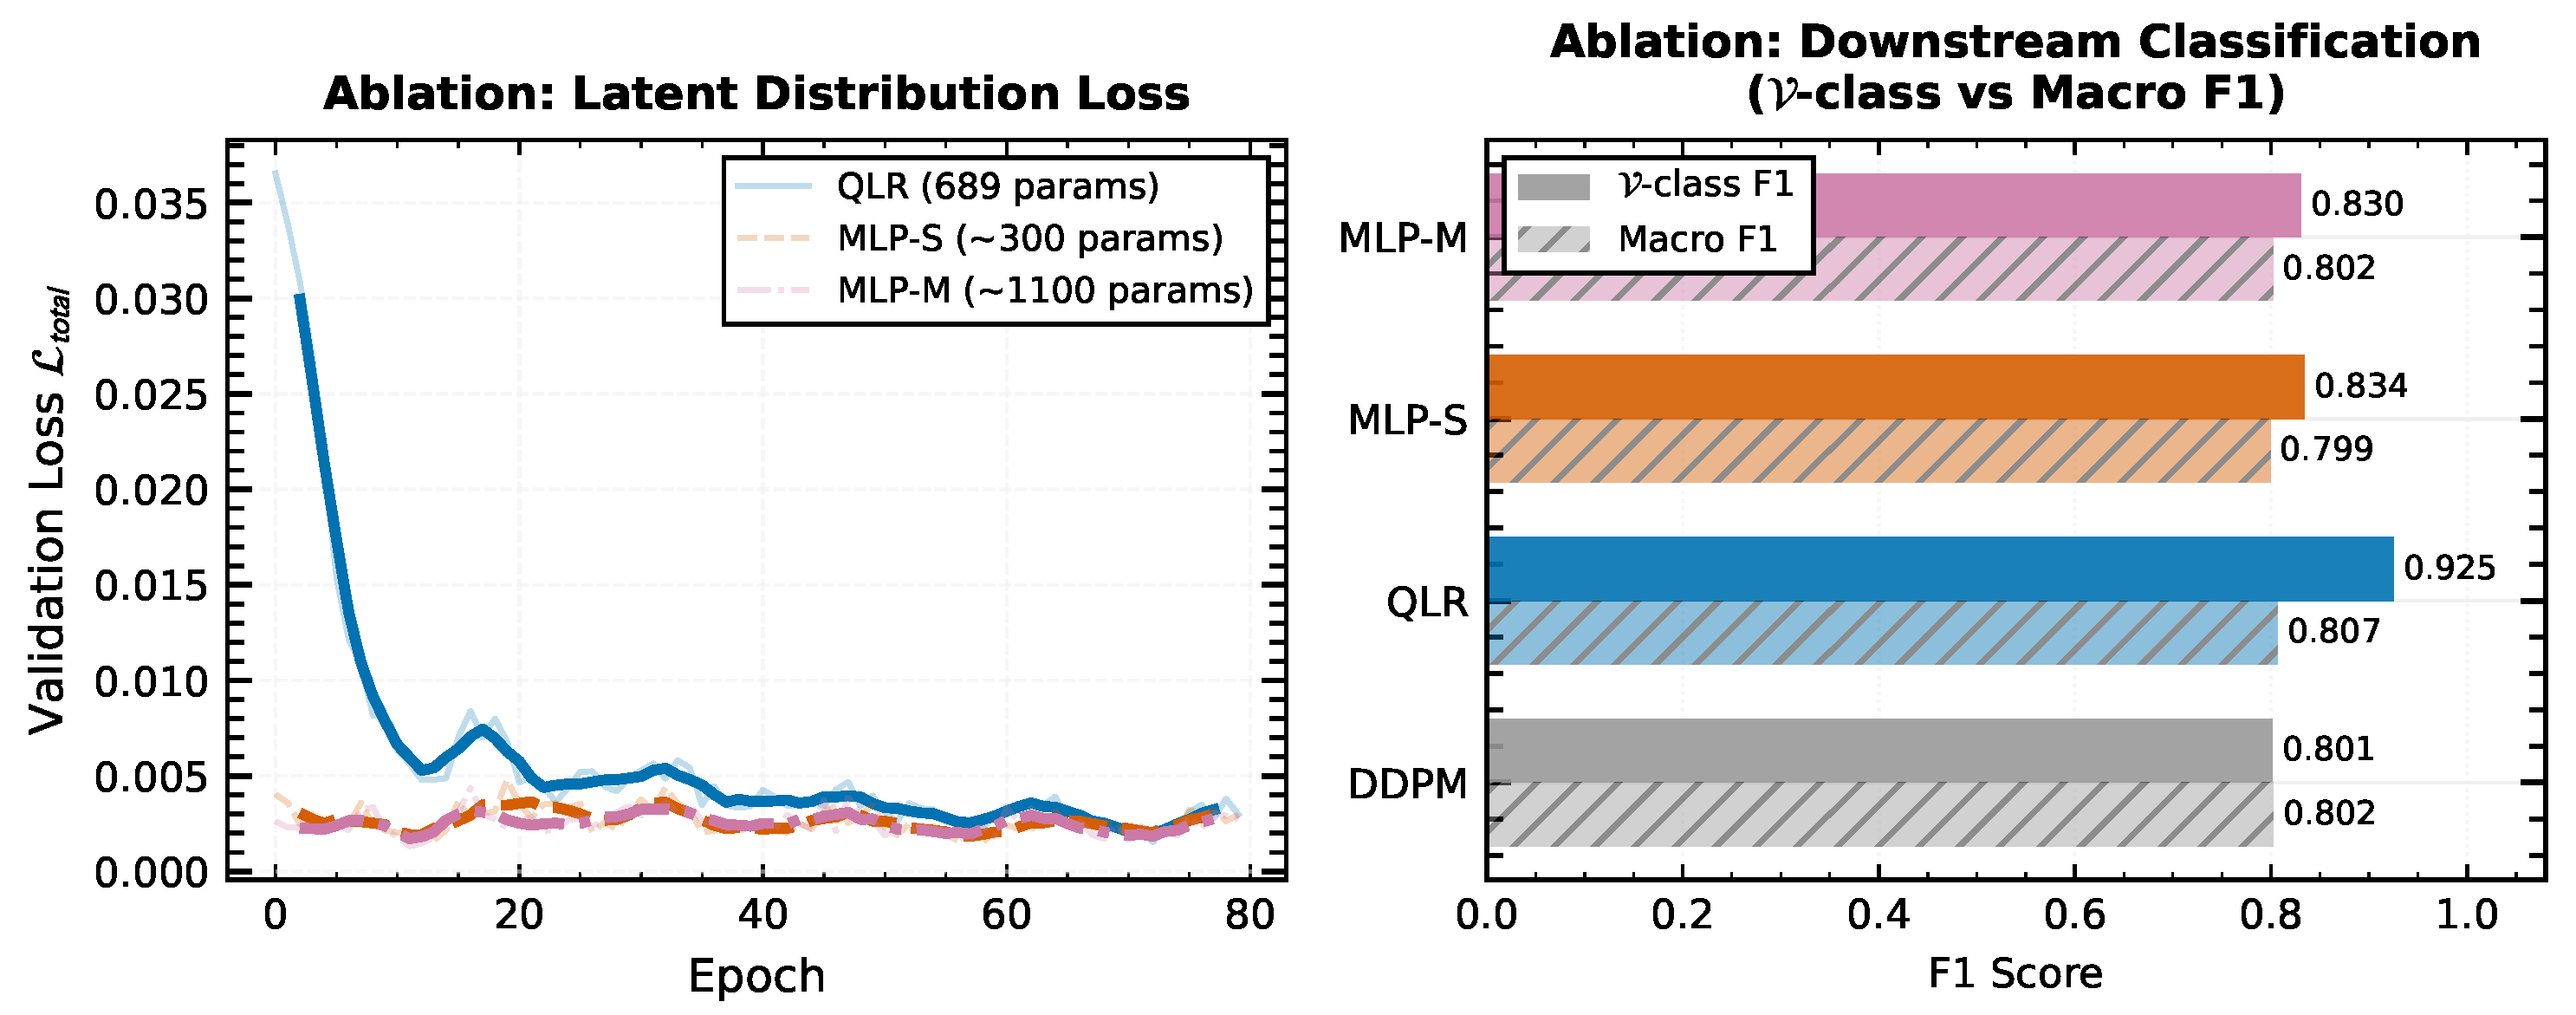
QLR was hypothesized to offer a class-specific downstream advantage over unrefined DDPM output, motivating this ablation. It is conducted on Class V (seed 42, 5527 training beats), the most data-rich minority class and therefore the most statistically stable choice for comparing refiners. S and F are feasible but less informative at this sample scale, since their smaller real-beat pools (2186 and 708 beats) yield high-variance MMD estimates that make it hard to attribute any difference to a systematic effect rather than sampling noise. QLR (689 parameters) and two classical MLP refiners of different capacities (MLP-S: 292 parameters; MLP-M: 1072 parameters) were trained for 80 epochs under identical optimization conditions.
This ablation was re-run at two points during QLR’s development. Without the per-sample gate (Section 2.5), QLR’s validation loss stayed persistently higher than both MLP refiners, and its post-refinement MMD exceeded the baseline—the correction was moving samples away from, not toward, the real distribution. After the gate was added, QLR’s downstream V -class F1 (0.925) and precision (0.883) exceed DDPM (0.801, 0.682) and both MLP refiners (MLP-S: 0.835, 0.732; MLP-M: 0.830, 0.727) by a wide margin (Figure 21), driven by precision rather than recall (all four methods reach comparable V -class recall, 97 % ); post-refinement MMD (QLR: 0.06567; baseline: 0.06581; MLP-S: 0.06328; and MLP-M: 0.06330) is only marginally improved for QLR, without a correspondingly large shift in the aggregate latent distribution.
This ablation is a single-seed illustrative comparison, not a statistically powered test (Section 2.6). Its instability across two runs is a genuine property of the diagnostic at this scale, not noise to average away. The most recent outcome is consistent with the motivating hypothesis that QLR could offer a class-specific advantage in some regime. The primary evidence for QLR’s contribution remains the main multi-seed comparison (Table 4), where QLR does not significantly outperform DDPM at any ratio.
The PQC offers two properties that neither classical MLP refiner provides at a comparable or smaller parameter budget. First, the quantum feature map embeds the 32-dimensional latent input into a 2 8 = 256 -dimensional Hilbert space, providing access to a richer class of inter-dimensional correlations per parameter than a classical network. Second, the layered rotation-entanglement architecture imposes a structured inductive bias over latent co-variation that differs in character from the isotropic smoothing of a fully connected MLP. These properties are a plausible explanation for why QLR reaches a comparable validation loss and MMD to MLP-M with fewer parameters (689 vs. 1072). Whether this translates into a downstream classification advantage is a separate question that this single ablation run cannot answer conclusively: QLR’s V -class F1 numerically exceeded both classical MLP refiners in this instance, but the ablation’s outcome has changed across two development iterations (discussed above), so a single favorable run is not sufficient grounds to claim a reproducible downstream advantage for the quantum module. This is the first application of a PQC as a latent space distributional refiner within a generative augmentation pipeline, distinct from prior work employing quantum circuits as direct classifiers [25], generators [29], anomaly detectors [30], or latent diffusion models [31].

4. Discussion

The unaugmented baseline illustrates the accuracy paradox directly and explains why augmentation is necessary. A classifier with 96.1% test accuracy and only 80.4% Macro F1 (ten-seed mean; Section 3.2.1) is largely unsuited for detecting rare but clinically significant arrhythmias; any evaluation framework reporting only accuracy in this setting would systematically overstate the system’s diagnostic utility [10]. The accuracy paradox documented here is not an artifact of model choice but a direct consequence of training on a severely imbalanced distribution, and the systematic Macro F1 improvements produced by all generative methods confirm that it is correctable through principled augmentation.
The generative pipeline produces synthetic minority class beats with high morphological fidelity, as confirmed by the waveform-level metrics in Table 2. Both the cVAE and DDPM stages independently establish strong reconstruction quality, capturing the dominant morphological signatures of each arrhythmia class. At the waveform level, QLR’s clearest contribution is to Class S , where it improves on plain DDPM on every fidelity metric (Table 2). For Class V , plain DDPM already achieves strong morphological fidelity and QLR does not improve on it further at the waveform-mean level. QLR’s contribution to Class V instead shows up downstream, at the classification level, discussed below. This is precisely the class that matters most from a prognostic standpoint. Frequent Ventricular ectopy—particularly complex forms such as bigeminy, couplets, or non-sustained runs—can precede life-threatening ventricular arrhythmias and may warrant pharmacological or procedural intervention, so both the sensitivity and precision of Ventricular detection carry direct clinical weight. The ensemble V -class operating point (recall and precision reported in Section 3.2.3) is clinically viable for wearable Holter-style monitoring: nearly all true Ventricular events are correctly identified, and the false positive rate is low enough to avoid the alert fatigue that undermines clinical trust in automated arrhythmia monitoring systems. We consider the resulting reduction in V -class false alarms the most practically significant finding in this work from a clinical-deployment standpoint, though we note that this specific comparison—a single pooled ensemble against the ten-seed mean baseline—was not run through the paired significance testing used for the main Macro F1 comparisons in Table 4 and should be read as a promising operating-point observation rather than a statistically confirmed effect.
Supraventricular ectopic beats present a different and more persistent challenge than Ventricular ectopy, revealing a ceiling on S -class recall that warrants careful clinical interpretation. S -class recall does not exceed 60% for any single-seed run across all augmentation methods and all ratios. This ceiling likely reflects the intrinsic morphological proximity between Supraventricular ectopic beats and certain Normal beat variants under the intra-patient temporal split: if a patient’s sinus rhythm morphology evolves between the calibration and test windows—due to rate-related aberrancy or medication effects for example—the S / N boundary in feature space shifts in a way that augmentation cannot compensate for. The improvement in S -class precision rather than recall suggests that augmentation primarily makes the classifier more conservative about assigning the S label, reducing one class of diagnostic error while leaving another largely unaddressed. Improving S -class recall without sacrificing N -class specificity likely requires approaches beyond static data augmentation, such as patient-specific temporal context modeling or explicit morphological feature engineering targeting P-wave characteristics.
SMOTE’s plateau and degradation at high augmentation ratios align with the well-documented limitations of linear interpolation in high-dimensional biomedical feature spaces [16] and explain why deep generative methods are preferable at large synthesis volumes. When a large volume of interpolated beats fills the training set, the natural cluster structure of minority distributions is smoothed over, and boundary-straddling samples add noise to the decision surface. This is most strikingly illustrated by the confusion matrix for the seed-42 SMOTE classifier (Figure 17): 29.2 % of S -class beats are misclassified as Ventricular, higher even than the unaugmented baseline (19.2%), compared to 0.9–10.5% across the three deep generative methods (cVAE, DDPM, and DDPM + QLR respectively; Figure 18, Figure 19 and Figure 20. The elevated S V confusion rate under SMOTE is a concrete clinical consequence: SMOTE generates Supraventricular beats that encroach on the Ventricular feature space, creating a clinically dangerous misclassification pattern in which S -class beats are assigned the more alarming Ventricular label. The deep generative methods avoid this by modeling the underlying distribution directly rather than interpolating between observed points, and their S V confusion rates are substantially lower as a result.
The ablation study does not establish a quantum advantage in the traditional optimization sense: across both runs described above, QLR’s post-refinement MMD is only marginally better than the unrefined baseline and consistently no better than either classical MLP refiner’s MMD. Its downstream classification result has varied across the two runs (Section 3.2.1-adjacent discussion above), which we take as evidence that a single-seed, single-class diagnostic is not a reliable basis for a quantum-advantage claim in either direction, consistent with the caution urged for quantum-related claims throughout this work [21]. The statistically grounded answer to whether QLR outperforms classical alternatives comes from the main multi-seed comparison, not this diagnostic: DDPM + QLR does not significantly outperform plain DDPM at any augmentation ratio (Section 2.6), so neither this ablation nor the main results establish a downstream advantage for the quantum module that would survive statistical scrutiny, though the directional trend at its closest approach to significance (Table 4) leaves this an open rather than a closed question.
Several important limitations apply to this work. The quantum circuit is evaluated entirely on the PennyLane [48] default.qubit classical simulator, which does not model hardware-level noise sources such as qubit decoherence, gate fidelity errors, or readout noise. Performance on actual near-term quantum hardware would likely be lower, and the results presented here should be interpreted as a proof of principle for the architectural design rather than a hardware-ready deployment. The intra-patient temporal split answers the personalized monitoring question but does not establish inter-patient generalizability. A patient-calibrated model cannot be assumed to generalize to a different patient without retraining. More broadly, all experiments in this study are performed on a single benchmark—the MIT-BIH Arrhythmia Database—which was recorded in the late 1970s from a specific patient population (Beth Israel Hospital) using two-channel ambulatory Holter monitors. Its recording conditions, lead configuration, and patient demographics do not necessarily represent contemporary wearable ECG devices or broader clinical populations. Validation on an independent ECG arrhythmia database was not performed in this revision, and we are not aware of a suitable public benchmark that provides the same beat-level AAMI annotations at comparable scale within the timeframe of this revision; we flag this explicitly as an open validation gap rather than a resolved limitation and consider cross-dataset evaluation an important direction for future work. Additionally, the F -class test set of 42 beats is too small for statistically reliable single-seed evaluation, and Fusion-beat results should be treated with corresponding caution. Finally, the QLR module trains a separate quantum circuit per minority class, making the quantum simulation stage the most computationally expensive component of the pipeline and limiting its practical scalability in its current form.

5. Conclusions

This study introduces and evaluates a three-stage hybrid quantum-classical generative pipeline for imbalanced ECG arrhythmia classification. A spectral-guided cVAE compresses beat-level ECG signals into a stable 32-dimensional latent space; a class-conditional latent DDPM generates new minority class latents; and a Quantum Latent Refinement module built on an 8-qubit PQC, evaluated on a classical simulator rather than physical quantum hardware, applies a bounded MMD-guided distributional correction to align synthetic latents with the real class-specific latent manifold. Downstream classification is performed by a lightweight 1D MobileNetV2 evaluated across ten seeds and four augmentation ratios.
All generative augmentation methods (cVAE, DDPM, and DDPM + QLR) outperform the unaugmented baseline (0.804, 95% CI [ 0.794 , 0.814 ] ; paired t-test, p < 0.05 , large effect sizes; Section 2.6), improving Macro F1 to a range of 0.826–0.832 (95% CIs approximately [ 0.81 , 0.84 ] ) at peak ratios; SMOTE’s improvement over baseline (0.807, 95% CI [ 0.797 , 0.817 ] ) does not reach significance ( p = 0.64 ). cVAE attains the highest overall mean Macro F1 (0.832, 95% CI [ 0.825 , 0.840 ] at ρ = 0.75 ); DDPM + QLR is highest specifically at ρ = 1.00 (0.828, 95% CI [ 0.821 , 0.836 ] ), and a ten-model soft-voting ensemble reaches 0.853. Neither difference is statistically significant: DDPM + QLR is not distinguishable from plain DDPM at any augmentation ratio (closest at ρ = 0.50 : p = 0.061 , Cohen’s d = 0.68 , overlapping 95% CIs), nor from cVAE at any ratio. This does not establish a quantum advantage, either over the diffusion baseline or over the simplest stage of the pipeline. It instead frames the quantum module as a distributional regularizer rather than a raw optimization advantage. Across all methods, augmentation primarily corrects precision deficits rather than uniformly boosting recall: macro-averaged precision improves from 0.800 ± 0.024 at baseline to 0.853 ± 0.015 under DDPM + QLR, while macro-averaged recall changes more modestly from 0.824 ± 0.006 to 0.823 ± 0.009 , reflecting the asymmetric nature of the class imbalance problem. The most clinically actionable result is the ensemble V -class performance (recall 97.9%; precision 84.3%), which represents a clinically meaningful improvement over the baseline’s false positive rate and offers a viable operating point for wearable Holter-style arrhythmia monitoring.
Future directions include hardware-aware PQC designs tolerant of realistic noise models and extension of the QLR ablation to all minority classes with a larger number of seeds for statistically powered comparisons. Evaluating inter-patient generalization across multiple ECG databases and integrating end-to-end R-peak detection would move the pipeline toward fully deployable wearable monitoring.

Author Contributions

Conceptualization, G.K., G.N., G.D.B. and G.P.T.; Methodology, G.K., G.N., G.D.B. and G.P.T.; Software, G.K.; Formal Analysis, G.K., G.N., G.D.B. and G.P.T.; Investigation, G.K., G.N., G.D.B. and G.P.T.; Visualization, G.K.; Validation, G.N., G.D.B. and G.P.T.; Writing—original draft preparation, G.K.; Writing—review and editing, G.K., G.N., G.D.B. and G.P.T.; Supervision, G.N., G.D.B. and G.P.T.; Funding acquisition, G.P.T. All authors have read and agreed to the published version of the manuscript.

Funding

This research was funded by the Office of Naval Research Global, USA, Department of the Navy, grant number N629092412119.

Institutional Review Board Statement

This study used exclusively the publicly available, de-identified MIT-BIH Arrhythmia Database (PhysioNet; https://physionet.org/content/mitdb/, accessed on 21 November 2025), which was collected under informed consent at Beth Israel Hospital, Boston, MA, USA. No new human subjects were enrolled. Ethical review and approval were waived for this study, as it constitutes a secondary analysis of a fully de-identified, open-access dataset that does not allow for re-identification of individual participants.

Informed Consent Statement

Not applicable. This study used only the publicly available, de-identified MIT-BIH Arrhythmia Database. No new patient data were collected.

Data Availability Statement

The MIT-BIH Arrhythmia Database is publicly available at https://physionet.org/content/mitdb/ [9] (accessed on 21 November 2025). Results are reported as mean ± standard deviation over ten independent random seeds. Statistical comparisons between augmentation methods use a paired t-test (scipy.stats.ttest_rel) on seed-wise Macro F1 values. Code for the generative pipeline and downstream classifier is publicly available on GitHub at https://github.com/gkritop/ecg-arrhythmia-diffusion-qlr (accessed on 11 August 2026).

Conflicts of Interest

The authors declare no conflicts of interest. The funders had no role in the design of the study; in the collection, analyses, or interpretation of data; in the writing of the manuscript; or in the decision to publish the results.

Abbreviations

The following abbreviations are used in this manuscript:
AAMIAssociation for the Advancement of Medical Instrumentation
cVAEConditional Variational Autoencoder
CFGClassifier-Free Guidance
DDPMDenoising Diffusion Probabilistic Model
ECGElectrocardiogram
ELBOEvidence Lower Bound
EMAExponential Moving Average
KLKullback–Leibler
KDEKernel Density Estimate
MLPMulti-Layer Perceptron
MMDMaximum Mean Discrepancy
PCAPrincipal Component Analysis
PQCParameterized Quantum Circuit
QLRQuantum Latent Refinement
QMLQuantum Machine Learning
RMSDRoot-Mean-Square Deviation
SMOTESynthetic Minority Oversampling Technique
VAEVariational Autoencoder

Appendix A. Extended Architectural Diagrams

Figure A1. Hybrid cVAE architecture. (a) Encoder: convolutional and dense branches extract local and global waveform features, conditioned on a learned class embedding; the merged representation is projected to latent mean μ and log-variance log σ 2 , sampled via the reparameterization trick. (b) Decoder: the latent code and class embedding are decoded through parallel upsampling-convolution and dense branches, fused to reconstruct the beat. Full layer-by-layer detail for Section 2.3.
Aimed 01 00023 g0a1
Figure A2. DDPM denoiser internal architecture. The noisy latent z t R 32 is projected through input_proj and z_upsampler and summed into a 256-dimensional hidden representation. Sinusoidal timestep and class embeddings are added to form the conditioning vector used by six AdaLN-Zero residual blocks. A final adaptive normalization and output head ( 256 128 32 ) produce the predicted noise ϵ ^ . This is the internal detail of the denoiser ϵ θ shown in Figure 5.
Aimed 01 00023 g0a2
Figure A3. Parameterized quantum circuit used in the QLR module: single embedding stage, six trainable rotation-entanglement layers, and multi-observable readout, as described in Section 2.5.
Aimed 01 00023 g0a3
Figure A4. 1D MobileNetV2 classifier architecture. A convolutional stem ( 1 32 , stride 2) feeds seven inverted residual stages and then a 1 × 1 projection ( 320 1280 channels). Adaptive average and max pooling are concatenated into a 2560-dimensional descriptor, passed through dropout ( p = 0.3 ) and a final linear layer ( 2560 4 ) to produce class logits. Full architectural detail for Section 2.6.
Aimed 01 00023 g0a4

Appendix B. Extended Statistical Results

Table A1 reports per-seed wall-clock training time for the three generative stages, all ten seeds. Downstream classifier training (17 configurations per seed) was not separately instrumented; see Section 2.6 for a total-study estimate.
Table A1. Per-seed VAE, DDPM, and QLR training time (seconds).
SeedVAE (s)DDPM (s)QLR (s)
42258.0491.9386.6
88261.0588.4428.4
123288.2643.3411.7
456296.0643.3477.7
789290.1432.2356.1
13285.8583.1391.2
7292.1643.0520.6
99285.6500.4399.0
314217.9450.6370.3
1024221.6649.7461.5
Mean269.6562.6420.3
Table A2 reports paired t-test results (mean difference, p-value, and Cohen’s d) for every method pair at every augmentation ratio, ten seeds, complementing the headline comparisons reported in Table 4 (Section 2.6).
Table A2. Pairwise Macro F1 comparisons across all augmentation ratios.
Method AMethod B ρ Mean diff (A−B)p-ValueCohen’s d
DDPM + QLRDDPM0.25 + 0.0013 0.8530.06
DDPM + QLRDDPM0.50 + 0.0140 0.0610.68
DDPM + QLRDDPM0.75 0.0017 0.793 0.09
DDPM + QLRDDPM1.00 + 0.0056 0.3770.29
DDPM + QLRcVAE0.25 0.0045 0.397 0.28
DDPM + QLRcVAE0.50 + 0.0006 0.9150.04
DDPM + QLRcVAE0.75 0.0076 0.236 0.40
DDPM + QLRcVAE1.00 + 0.0030 0.6080.17
DDPM + QLRSMOTE0.25 + 0.0177 0.0280.83
DDPM + QLRSMOTE0.50 + 0.0223 0.0180.91
DDPM + QLRSMOTE0.75 + 0.0176 0.0240.86
DDPM + QLRSMOTE1.00 + 0.0256 0.0011.53
cVAEDDPM0.25 + 0.0058 0.3430.32
cVAEDDPM0.50 + 0.0134 0.0650.66
cVAEDDPM0.75 + 0.0059 0.4330.26
cVAEDDPM1.00 + 0.0026 0.5180.21
cVAESMOTE0.25 + 0.0222 0.0041.21
cVAESMOTE0.50 + 0.0217 0.0121.00
cVAESMOTE0.75 + 0.0251 0.0011.47
cVAESMOTE1.00 + 0.0226 0.0061.13
DDPMSMOTE0.25 + 0.0164 0.0640.67
DDPMSMOTE0.50 + 0.0084 0.3190.33
DDPMSMOTE0.75 + 0.0192 0.0101.02
DDPMSMOTE1.00 + 0.0200 0.0121.00
Bold p-values indicate statistical significance at α = 0.05 . Notably, DDPM + QLR and cVAE each significantly outperform SMOTE at every augmentation ratio tested, reinforcing that classical interpolation-based oversampling is not competitive with deep generative augmentation in this setting—a more complete statistical picture than the ratio-specific comparisons highlighted in the main text. Mean differences are computed from unrounded per-seed values and may not exactly reproduce the difference of the 3-decimal means shown in Table 4.

References

  1. Roth, G.A.; Mensah, G.A.; Johnson, C.O.; Addolorato, G.; Ammirati, E.; Baddour, L.M.; Barengo, N.C.; Beaton, A.Z.; Benjamin, E.J.; Benziger, C.P.; et al. Global Burden of Cardiovascular Diseases and Risk Factors, 1990–2019: Update From the GBD 2019 Study. J. Am. Coll. Cardiol. 2020, 76, 2982–3021. [Google Scholar] [CrossRef] [Scilit] [PubMed]
  2. Alonso, S.; Bär, M.; Echebarria, B. Nonlinear physics of electrical wave propagation in the heart: A review. Rep. Prog. Phys. 2016, 79, 096601. [Google Scholar] [CrossRef] [Scilit] [PubMed]
  3. Schläpfer, J.; Wellens, H.J.J. Computer-Interpreted Electrocardiograms: Benefits and Limitations. J. Am. Coll. Cardiol. 2017, 70, 1183–1192. [Google Scholar] [PubMed]
  4. Kiranyaz, S.; Ince, T.; Gabbouj, M. Real-Time Patient-Specific ECG Classification by 1-D Convolutional Neural Networks. IEEE Trans. Biomed. Eng. 2016, 63, 664–675. [Google Scholar] [CrossRef] [Scilit] [PubMed]
  5. Kuo, C.C.J. Understanding Convolutional Neural Networks with A Mathematical Model. J. Vis. Commun. Image Represent. 2016, 41, 406–413. [Google Scholar] [CrossRef] [Scilit]
  6. Chauhan, S.; Vig, P. Anomaly Detection in ECG Time Signals via Deep Long Short-Term Memory Networks. In Proceedings of the IEEE International Conference on Data Science and Advanced Analytics, Paris, France, 19–21 October 2015; pp. 1–7. [Google Scholar] [CrossRef] [Scilit]
  7. Schäfer, A.M.; Udluft, S.; Zimmermann, H.G. Learning Long Term Dependencies with Recurrent Neural Networks. In Proceedings of the Artificial Neural Networks—ICANN 2006; Kollias, S.D., Stafylopatis, A., Duch, W., Oja, E., Eds.; Lecture Notes in Computer Science; Springer: Berlin/Heidelberg, Germany, 2006; Volume 4131, pp. 71–80. [Google Scholar] [CrossRef] [Scilit]
  8. Du, C.; Liu, P.X.; Zheng, M. Classification of Imbalanced Electrocardiosignal Data using Convolutional Neural Network. Comput. Methods Programs Biomed. 2022, 214, 106483. [Google Scholar] [CrossRef] [Scilit] [PubMed]
  9. Moody, G.; Mark, R. The impact of the MIT-BIH Arrhythmia Database. IEEE Eng. Med. Biol. Mag. 2001, 20, 45–50. [Google Scholar] [CrossRef] [Scilit] [PubMed]
  10. Japkowicz, N.; Stephen, S. The Class Imbalance Problem: A Systematic Study. Intell. Data Anal. 2002, 6, 429–449. [Google Scholar] [CrossRef] [Scilit]
  11. Owusu-Adjei, M.; Hayfron-Acquah, J.B.; Frimpong, T.; Abdul-Salaam, G. Imbalanced class distribution and performance evaluation metrics: A systematic review of prediction accuracy for determining model performance in healthcare systems. PLoS Digit. Health 2023, 2, e0000984. [Google Scholar] [CrossRef] [Scilit] [PubMed]
  12. Davis, J.; Goadrich, M. The relationship between Precision-Recall and ROC curves. In Proceedings of the 23rd International Conference on Machine Learning, New York, NY, USA, 25–29 June 2006; pp. 233–240. [Google Scholar] [CrossRef] [Scilit]
  13. Bikkina, M.; Larson, M.G.; Levy, D. Prognostic implications of asymptomatic ventricular arrhythmias: The Framingham Heart Study. Ann. Intern. Med. 1992, 117, 990–996. [Google Scholar] [CrossRef] [Scilit] [PubMed]
  14. Sendelbach, S.; Funk, M. Alarm fatigue: A patient safety concern. AACN Adv. Crit. Care 2013, 24, 378–386. [Google Scholar] [CrossRef]
  15. Chawla, N.V.; Bowyer, K.W.; Hall, L.O.; Kegelmeyer, W.P. SMOTE: Synthetic Minority Over-sampling Technique. J. Artif. Intell. Res. 2002, 16, 321–357. [Google Scholar] [CrossRef] [Scilit]
  16. Tarawneh, A.S.; Hassanat, A.B.; Altarawneh, G.A.; Almuhaimeed, A. Stop Oversampling for Class Imbalance Learning: A Review. IEEE Access 2022, 10, 47743–47760. [Google Scholar] [CrossRef] [Scilit]
  17. Goodfellow, I.; Pouget-Abadie, J.; Mirza, M.; Xu, B.; Warde-Farley, D.; Ozair, S.; Courville, A.; Bengio, Y. Generative Adversarial Nets. Adv. Neural Inf. Process. Syst. 2014, 27, 2672–2680. [Google Scholar]
  18. Ho, J.; Jain, A.; Abbeel, P. Denoising Diffusion Probabilistic Models. Adv. Neural Inf. Process. Syst. 2020, 33, 6840–6851. [Google Scholar]
  19. Gallon, D.; Jentzen, A.; von Wurstemberger, P. An overview of diffusion models for generative artificial intelligence. arXiv 2024, arXiv:2412.01371. [Google Scholar]
  20. Ghojogh, B.; Ghodsi, A. Diffusion Models: Tutorial and Survey. 2024. Available online: https://osf.io/preprints/osf/w7jcm (accessed on 25 December 2025).
  21. Benedetti, M.; Lloyd, E.; Sack, S.; Fiorentini, M. Parameterized quantum circuits as machine learning models. Quantum Sci. Technol. 2019, 4, 043001. [Google Scholar] [CrossRef] [Scilit]
  22. McClean, J.R.; Boixo, S.; Smelyanskiy, V.N.; Babbush, R.; Neven, H. Barren Plateaus in Quantum Neural Network Training Landscapes. Nat. Commun. 2018, 9, 4812. [Google Scholar] [CrossRef] [Scilit] [PubMed]
  23. Tripathi, S.M.; Upadhyay, H.; Soni, J. Advanced Cardiovascular Health in a Quantum AI-driven Healthcare Framework. TechRxiv 2024. [Google Scholar] [CrossRef] [Scilit] [PubMed]
  24. Rani, S.; Kumar Pareek, P.; Kaur, J.; Chauhan, M.; Bhambri, P. Quantum Machine Learning in Healthcare: Developments and Challenges. In Proceedings of the 2023 IEEE International Conference on Integrated Circuits and Communication Systems (ICICACS), Raichur, India, 24–25 February 2023; pp. 1–7. [Google Scholar] [CrossRef] [Scilit]
  25. Prabhu, S.; Gupta, S.; Prabhu, G.M.; Dhanuka, A.V.; Bhat, K.V. QuCardio: Application of Quantum Machine Learning for Detection of Cardiovascular Diseases. IEEE Access 2023, 11, 136122–136135. [Google Scholar] [CrossRef] [Scilit]
  26. Ozpolat, Z.; Karabatak, M. Performance Evaluation of Quantum-Based Machine Learning Algorithms for Cardiac Arrhythmia Classification. Diagnostics 2023, 13, 1099. [Google Scholar] [CrossRef] [Scilit] [PubMed]
  27. Enad, H.G.; Mohammed, M.A. A Review on Artificial Intelligence and Quantum Machine Learning for Heart Disease Diagnosis: Current Techniques, Challenges and Issues, Recent Developments, and Future Directions. Fusion Pract. Appl. 2023, 11, 8–25. [Google Scholar] [CrossRef] [Scilit]
  28. Babu, S.V.; Ramya, P.; Gracewell, J. Revolutionizing Heart Disease Prediction with Quantum-Enhanced Machine Learning. Sci. Rep. 2024, 14, 7453. [Google Scholar] [CrossRef] [Scilit] [PubMed]
  29. Qu, Z.; Shi, W.; Tiwari, P. Quantum conditional generative adversarial network based on patch method for abnormal electrocardiogram generation. Comput. Biol. Med. 2023, 166, 107549. [Google Scholar] [CrossRef] [Scilit] [PubMed]
  30. Belis, V.; Woźniak, K.A.; Puljak, E.; Barkoutsos, P.; Dissertori, G.; Grossi, M.; Pierini, M.; Reiter, F.; Tavernelli, I.; Vallecorsa, S. Quantum Anomaly Detection in the Latent Space of Proton Collision Events at the LHC. Commun. Phys. 2024, 7, 334. [Google Scholar] [CrossRef] [Scilit]
  31. De Falco, F.; Ceschini, A.; Sebastianelli, A.; Le Saux, B.; Panella, M. Quantum Latent Diffusion Models. Quantum Mach. Intell. 2024, 6, 85. [Google Scholar] [CrossRef] [Scilit]
  32. Sandler, M.; Howard, A.; Zhu, M.; Zhmoginov, A.; Chen, L.C. MobileNetV2: Inverted Residuals and Linear Bottlenecks. In Proceedings of the IEEE Conference on Computer Vision and Pattern Recognition (CVPR), Salt Lake City, UT, USA, 18–23 June 2018; pp. 4510–4520. [Google Scholar] [CrossRef] [Scilit]
  33. ANSI/AAMI EC57:1998/(R)2008; Testing and Reporting Performance Results of Cardiac Rhythm and ST Segment Measurement Algorithms. Association for the Advancement of Medical Instrumentation: Arlington, VA, USA, 2008.
  34. Dewland, T.A.; Vittinghoff, E.; Mandyam, M.C.; Heckbert, S.R.; Siscovick, D.S.; Stein, P.K.; Psaty, B.M.; Sotoodehnia, N.; Gottdiener, J.S.; Marcus, G.M. Atrial ectopy as a predictor of incident atrial fibrillation: A cohort study. Ann. Intern. Med. 2013, 159, 721–728. [Google Scholar] [CrossRef] [Scilit] [PubMed]
  35. Kwak, J.; Jung, J. Classification of imbalanced ECGs through segmentation models and augmented by conditional diffusion model. PeerJ Comput. Sci. 2024, 10, e2299. [Google Scholar] [CrossRef] [Scilit] [PubMed]
  36. Kingma, D.P.; Welling, M. Auto-Encoding Variational Bayes. arXiv 2013, arXiv:1312.6114. [Google Scholar] [CrossRef] [Scilit]
  37. Kuznetsov, V.V.; Moskalenko, V.A.; Gribanov, D.V.; Zolotykh, N.Y. Interpretable Feature Generation in ECG Using a Variational Autoencoder. Front. Genet. 2021, 12, 638191. [Google Scholar] [CrossRef] [Scilit] [PubMed]
  38. Bowman, S.R.; Vilnis, L.; Vinyals, O.; Dai, A.M.; Jozefowicz, R.; Bengio, S. Generating Sentences from a Continuous Space. In Proceedings of the 20th SIGNLL Conference on Computational Natural Language Learning, Berlin, Germany, 1–12 August 2016; pp. 10–21. [Google Scholar] [CrossRef] [Scilit]
  39. Kingma, D.P.; Ba, J. Adam: A Method for Stochastic Optimization. arXiv 2014, arXiv:1412.6980. [Google Scholar] [CrossRef] [Scilit]
  40. Peebles, W.; Xie, S. Scalable Diffusion Models with Transformers. In Proceedings of the IEEE/CVF International Conference on Computer Vision, Paris, France, 1–6 October 2023; pp. 4195–4205. [Google Scholar] [CrossRef] [Scilit]
  41. Ho, J.; Salimans, T. Classifier-Free Diffusion Guidance. arXiv 2022, arXiv:2207.12598. [Google Scholar]
  42. Pérez-Salinas, A.; Cervera-Lierta, A.; Gil-Fuster, E.; Latorre, J.I. Data Re-uploading for a Universal Quantum Classifier. Quantum 2020, 4, 226. [Google Scholar] [CrossRef] [Scilit]
  43. Mari, A.; Bromley, T.R.; Izaac, J.; Schuld, M.; Killoran, N. Transfer Learning in Hybrid Classical-Quantum Neural Networks. Quantum 2020, 4, 340. [Google Scholar] [CrossRef] [Scilit]
  44. Bachlechner, T.; Majumder, B.P.; Mao, H.; Cottrell, G.; McAuley, J. ReZero is all you need: Fast convergence at large depth. In Proceedings of the Thirty-Seventh Conference on Uncertainty in Artificial Intelligence, PMLR, Online, 27–30 July 2021; Volume 161, pp. 1352–1361. [Google Scholar]
  45. Gretton, A.; Borgwardt, K.M.; Rasch, M.J.; Schölkopf, B.; Smola, A. A Kernel Two-Sample Test. J. Mach. Learn. Res. 2012, 13, 723–773. [Google Scholar]
  46. Li, Y.; Swersky, K.; Zemel, R. Generative Moment Matching Networks. In Proceedings of the 32nd International Conference on Machine Learning (ICML), PMLR, Lille, France, 6–11 July 2015; Volume 37, pp. 1718–1727. [Google Scholar]
  47. Loshchilov, I.; Hutter, F. SGDR: Stochastic Gradient Descent with Warm Restarts. arXiv 2016, arXiv:1608.03983. [Google Scholar] [CrossRef] [Scilit]
  48. Bergholm, V.; Izaac, J.; Schuld, M.; Gogolin, C.; Ahmed, S.; Ajith, V.; Alam, M.S.; Alonso-Linaje, G.; AkashNarayanan, B.; Asadi, A.; et al. PennyLane: Automatic differentiation of hybrid quantum-classical computations. arXiv 2018, arXiv:1811.04968. [Google Scholar]
  49. Paszke, A.; Gross, S.; Massa, F.; Lerer, A.; Bradbury, J.; Chanan, G.; Killeen, T.; Lin, Z.; Gimelshein, N.; Antiga, L.; et al. PyTorch: An Imperative Style, High-Performance Deep Learning Library. Adv. Neural Inf. Process. Syst. 2019, 32, 8024–8035. [Google Scholar]
Figure 1. Beat-annotation distribution in the MIT-BIH database prior to filtering. Normal beats are 82.9% of raw annotations; the unknown class (7.3%) was discarded. Among the four retained AAMI classes, Class N is 89.4%, with the minority classes ( S , V , and F ) together only 10.6%—the primary motivation for generative augmentation.
Aimed 01 00023 g001
Figure 2. Representative beat segments from the training split for each of the four AAMI classes described in Section 2.1 (three randomly selected samples per row). Amplitude is in arbitrary units after global normalization and time is in samples at 360 Hz .
Aimed 01 00023 g002
Figure 3. Training class counts before and after synthetic augmentation (log scale). Grey bars are real beats; blue hatched layers show cumulative synthetic beats added at each ratio ρ { 0.25 , 0.50 , 0.75 , 1.00 } , where ρ = 1.00 brings minority classes to parity with N = 72 , 136 . Class F has under 1% as many real beats as Class N , making it most dependent on synthetic data.
Aimed 01 00023 g003
Figure 4. Overview of the cVAE latent space and its role in the pipeline. The encoder maps ECG beats into the shared 32-dimensional latent space via the class-conditional posterior μ , σ ( z | x , c ) (steps 1–3). cVAE-only generation (step 4) samples unconditionally with decoder-only class conditioning. At inference, DDPM generates class-conditional latents (step 5), QLR applies a bounded correction (step 6), and the shared decoder reconstructs synthetic beats (step 7).
Aimed 01 00023 g004
Figure 5. Class-conditional latent DDPM. Noise added to z 0 forms z t ; the denoiser ϵ θ minimizes ϵ ^ ϵ 2 . Sampling reverses this with classifier-free guidance ( s = 2.0 ) to recover z 0 gen . The denoiser’s internal AdaLN-Zero block architecture is detailed in Appendix A, Figure A2.
Aimed 01 00023 g005
Figure 6. QLR module. (a) The PQC produces a correction direction, gated and scaled before being added to the normalized latent and mapped back to latent space (Equation (3)). (b) A DDPM-sampled latent is refined and compared to its source (stay loss) and the real class bank (MMD loss), jointly optimizing the PQC and gate (Equation (4)).
Aimed 01 00023 g006
Figure 7. Overview of the hybrid generative pipeline. ECG beats are encoded into a 32-dimensional cVAE latent space, which feeds cVAE sampling, class-conditional latent DDPM, and optional QLR. A shared decoder maps latents back to synthetic beats, combined with real beats to augment training. A 1D MobileNetV2 classifier is trained on the augmented set and evaluated via Macro F1, precision, and recall.
Aimed 01 00023 g007
Figure 8. Training and validation convergence curves for the cVAE (Panel (A)) and latent DDPM (Panel (B)). The KL annealing-induced rise in the ELBO loss (Panel (A), epochs 0–40) is characteristic of β -VAE training; the loss descends monotonically after annealing completes. The EMA-smoothed DDPM loss (Panel (B)) decreases consistently from ∼0.42 to ∼0.16.
Aimed 01 00023 g008
Figure 9. Morphology comparison for Class S . Real mean ± 1 σ envelope overlaid with synthetic statistics for cVAE (A), DDPM (B), and DDPM + QLR (C). DDPM + QLR achieves the lowest RMSD (0.047), the smallest maximum absolute deviation (0.212), and ties DDPM for the highest cosine similarity (0.995)—the clearest and most consistent morphological improvement QLR provides across the three minority classes.
Aimed 01 00023 g009
Figure 10. Morphology comparison for Class V . Real mean ± 1 σ envelope (broadest of the three classes, reflecting high morphological variability) overlaid with synthetic statistics for (A) cVAE, a clear outlier (RMSD 0.140), reflecting the difficulty of modeling V ’s multimodal structure without a diffusion stage; (B) DDPM, which achieves the best RMSD (0.070) and lowest max deviation (0.289); and (C) DDPM + QLR, which tracks closely (RMSD 0.070, max deviation 0.302) without further improvement.
Aimed 01 00023 g010
Figure 11. Morphology comparison for Class F . Real mean ± 1 σ envelope overlaid with synthetic statistics for (A) cVAE, which achieves the best RMSD (0.120) and lowest maximum absolute deviation (0.448) for this class; (B) DDPM; and (C) DDPM + QLR, which attains the highest cosine similarity (0.999), marginally ahead of DDPM (0.999). All three methods capture the hybrid QRS morphology with similar fidelity.
Aimed 01 00023 g011
Figure 12. PCA projections of the 32-dimensional cVAE latent space for minority classes S (A), V (B), and F (C). Grey scatter points are DDPM-generated latent samples, and shaded regions show the KDE of the real latent bank. Distribution drift values are 0.06, 0.12, and 0.19 for classes S , V , and F , respectively.
Aimed 01 00023 g012
Figure 13. Latent shift induced by the QLR module for Class S . Hollow circles: DDPM latents before refinement; filled circles: quantum-refined latents, overlaid on the real latent KDE. Refined points shift toward higher-density regions without collapsing to a single mode.
Aimed 01 00023 g013
Figure 14. Latent shift induced by the QLR module for Class V . The QLR moves several outlier DDPM points toward the main density mass of the Ventricular latent distribution.
Aimed 01 00023 g014
Figure 15. Latent shift induced by the QLR module for Class F . The multimodal Fusion latent distribution has two to three distinct clusters. The QLR realigns samples within each cluster without merging distinct modes, preserving intra-class morphological diversity.
Aimed 01 00023 g015
Figure 16. Confusion matrix for the unaugmented baseline (seed 42, Macro F1 = 0.799). V -class recall is high (96.3%) but precision is only 71.9%, generating a high false Ventricular alarm rate. S -class recall is 57.4%, with 19.2% of Supraventricular beats misclassified as Ventricular.
Aimed 01 00023 g016
Figure 17. SMOTE ( ρ = 0.75 ). F -class recall reaches 76.2%, but 29.2% of S -class beats are misclassified as Ventricular—higher than baseline (19.2%) and the deep generative methods (Figure 18, Figure 19 and Figure 20)—suggesting SMOTE-interpolated S beats overlap with the Ventricular feature space.
Aimed 01 00023 g017
Figure 18. cVAE ( ρ = 0.50 ). N -class recall improves to 98.9% and V -class precision improves markedly over baseline (71.9% to 89.8%). S -to- V confusion falls to just 0.9%, the lowest of any method shown in Figure 16, Figure 17, Figure 18, Figure 19 and Figure 20.
Aimed 01 00023 g018
Figure 19. DDPM ( ρ = 0.75 ). N -class recall rises to 97.7%, V -class precision improves to 79.4%, and S V confusion falls to 3.5%.
Aimed 01 00023 g019
Figure 20. DDPM + QLR ( ρ = 0.50 ). V -class precision reaches 88.5%. S V confusion (10.5%) is well below SMOTE (29.2%) and baseline (19.2%).
Aimed 01 00023 g020
Figure 21. Class V ablation, seed 42. (Left): validation loss (Equation (4)-equivalent objective) over training for QLR (689 parameters) and two classical MLP refiners (MLP-S: 292; MLP-M: 1072). (Right): downstream V -class F1 and Macro F1 for each refiner plus the unrefined DDPM baseline.
Aimed 01 00023 g021
Table 1. Real-beat counts per AAMI class and data partition after intra-patient temporal splitting across all 44 retained MIT-BIH records (80/10/10 split).
ClassTrainValidationTest
N (Normal)72,13690468943
S (Supraventricular)2186252343
V (Ventricular)5527718764
F (Fusion)7085342
Total80,55710,06910,092
Table 2. Morphological fidelity metrics comparing real and synthetic class-mean waveforms. RMSD: root-mean-square deviation. Max | Δ | : maximum point-wise absolute deviation. CosSim: cosine similarity. Lower RMSD and Max | Δ | and higher CosSim indicate better waveform alignment.
ClassMethodRMSDMax | Δ | CosSim
S cVAE0.05180.30360.9935
S DDPM0.04740.21700.9946
S DDPM + QLR0.0471 0.2122 0.9946
V cVAE0.14000.68370.9838
V DDPM 0.0695 0.2890 0.9847
V DDPM + QLR0.07000.30180.9845
F cVAE 0.1200 0.4479 0.9951
F DDPM0.12690.67640.9988
F DDPM + QLR0.12320.6522 0.9989
Table 3. Mean diversity and novelty on decoded-signal space over ten seeds.
ClassMethodDiversityNovelty
S cVAE11.630.1023
S DDPM10.400.0391
S DDPM + QLR10.080.0389
V cVAE22.670.0876
V DDPM36.450.0280
V DDPM + QLR35.510.0281
F cVAE22.470.0620
F DDPM27.300.0117
F DDPM + QLR27.140.0131
Table 4. Macro F1 (mean ± std, ten seeds) for each augmentation method across ratios ρ { 0.25 , 0.50 , 0.75 , 1.00 } . Unaugmented baseline: 0.804 ± 0.014 . Best result per ratio shown in bold.
Method ρ = 0.25 ρ = 0.50 ρ = 0.75 ρ = 1.00
SMOTE 0.801 ± 0.012 0.804 ± 0.016 0.807 ± 0.014 0.803 ± 0.012
cVAE 0 . 823 ± 0 . 014 0.826 ± 0.013 0 . 832 ± 0 . 010 0.825 ± 0.014
DDPM 0.817 ± 0.014 0.813 ± 0.015 0.826 ± 0.017 0.823 ± 0.015
DDPM + QLR 0.818 ± 0.016 0 . 827 ± 0 . 013 0.825 ± 0.015 0 . 828 ± 0 . 010
Table 5. Per-class precision (PPV) and recall (SEN) at each method’s best ratio (mean ± std, ten seeds): SMOTE, cVAE, DDPM at ρ = 0.75 ; DDPM + QLR at ρ = 1.00 . Best value per metric in bold. Top: macro-averaged PPV/SEN, Classes N , S . Bottom: Classes V , F .
All ClassesClass  N Class  S
MethodPPVSENPPVSENPPVSEN
Baseline 0.800 ± 0.024 0.824 ± 0.006 0.987 ± 0.005 0.976 ± 0.006 0.768 ± 0.050 0.579 ± 0.016
SMOTE 0.816 ± 0.026 0.821 ± 0.009 0 . 992 ± 0 . 004 0.975 ± 0.008 0.854 ± 0.027 0 . 595 ± 0 . 012
cVAE 0 . 861 ± 0 . 019 0.823 ± 0.010 0.983 ± 0.003 0 . 984 ± 0 . 007 0.873 ± 0.039 0.572 ± 0.014
DDPM 0.846 ± 0.031 0 . 827 ± 0 . 013 0.985 ± 0.004 0.978 ± 0.006 0.862 ± 0.040 0.583 ± 0.021
DDPM + QLR 0.853 ± 0.015 0.823 ± 0.009 0.984 ± 0.003 0.981 ± 0.006 0 . 878 ± 0 . 022 0.580 ± 0.014
Class V Class F   
MethodPPVSENPPVSEN  
Baseline 0.795 ± 0.053 0.966 ± 0.008 0.651 ± 0.077 0 . 774 ± 0 . 023   
SMOTE 0.740 ± 0.062 0 . 975 ± 0 . 003 0.678 ± 0.063 0.738 ± 0.037   
cVAE 0 . 853 ± 0 . 072 0.970 ± 0.008 0.735 ± 0.052 0.767 ± 0.040   
DDPM 0.798 ± 0.049 0.973 ± 0.005 0 . 737 ± 0 . 061 0 . 774 ± 0 . 047   
DDPM + QLR 0.821 ± 0.047 0.969 ± 0.008 0.730 ± 0.061 0.762 ± 0.037   
Disclaimer/Publisher’s Note: The statements, opinions and data contained in all publications are solely those of the individual author(s) and contributor(s) and not of MDPI and/or the editor(s). MDPI and/or the editor(s) disclaim responsibility for any injury to people or property resulting from any ideas, methods, instructions or products referred to in the content.