1. Introduction
Innovation grants, tax incentives, subsidized loans, and related instruments are now standard components of industrial and regional policy. Their rationale is familiar: because innovation generates spillovers, is uncertain, and often requires intangible investment that is difficult to collateralize, private firms may invest less than is socially desirable, particularly where small- and medium-sized enterprises (SMEs) face binding financing constraints [
1,
2,
3,
4].
Most empirical work evaluates these instruments through research and development (R&D) expenditure, patenting, employment, productivity, or project outputs. These outcomes are indispensable, but they do not fully answer a related question. Once a subsidized project has been selected, implemented, and closed, does it become economically visible in the beneficiary firm? Does support appear in revenues, capitalized intangibles, labour costs, or profitability in a way that suggests that innovation has been absorbed into the firm’s structure and operations?
This paper studies whether subsidized innovation becomes economically visible in beneficiary firms’ accounts.
Firm accounts are used here as a complementary diagnostic of firm-level economic absorption. A subsidized project may satisfy administrative requirements and generate technical deliverables without leaving a durable trace in the beneficiary’s accounts. Conversely, it may increase the firm’s cost base or asset stock without corresponding commercial gains. Financial statements cannot resolve these ambiguities on their own, but they are precisely the source in which such tensions become visible.
Italy offers a useful setting because regional disparities in productive structure, firm size, sectoral specialization, and administrative capacity remain substantial. Lombardy represents a larger, manufacturing-intensive northern environment with dense supply chains and comparatively strong implementation capacity. Sicily represents a structurally weaker southern environment with more micro-firms, a more heterogeneous productive base, and more demanding administrative conditions. If territorial context shapes the way public support is absorbed, the two regions need not display the same financial-statement patterns even under the same European funding cycle.
This paper compares European Regional Development Fund (ERDF) 2007–2013 innovation beneficiaries in Lombardy and Sicily over a common 2010–2018 horizon. Official beneficiary lists and grant decrees are matched to firm accounts from the Italian Business Register, yielding panels of 60 firms in Lombardy and 69 firms in Sicily. The analysis relates subsidy intensity to accounting change among beneficiaries: two features of the design guide interpretation. First, Lombardy and Sicily are treated as two separate regional samples and are never combined into a single pooled sample; each region is estimated on its own. Second, the design observes two financial-statement years, 2010 and 2018, and includes only beneficiary firms, with neither rejected applicants nor non-beneficiary firms in the data. The analysis therefore documents associations among beneficiaries, which reflect patterns of accounting visibility and may incorporate pre-existing heterogeneity across firms.
This paper has two linked objectives. The first is descriptive: to test whether, among beneficiary firms, higher subsidy intensity is associated with stronger medium-term changes in revenues, personnel costs, intangible assets, and related financial-statement outcomes. The second is comparative: to assess whether the detectability of these financial-statement patterns differs between Lombardy and Sicily in ways consistent with productive structure and programme delivery. Empirically, the paper extends a protocol previously applied to Lombardy to a harmonized North–South comparison; conceptually, it proposes a replicable accounting-based diagnostic of economic absorption as a complement to causal estimates of policy effectiveness.
The remainder of the paper proceeds as follows.
Section 2 reviews the literature and sets out the analytical framework.
Section 3 describes the two regional programmes.
Section 4 presents the data, variables, and empirical strategy.
Section 5 reports the results.
Section 6 discusses their interpretation.
Section 7 concludes.
2. Literature Review and Analytical Framework
2.1. Public Support, Market Failures, and Heterogeneity
The standard rationale for innovation support rests on knowledge spillovers, high uncertainty, incomplete appropriability, and financing frictions. These problems are especially acute for SMEs, whose innovation expenditure is risky, intangible, and only imperfectly collateralizable. In such settings, external finance may be rationed or excessively costly, so public support can relax underinvestment linked to credit constraints [
1,
2,
3,
4].
The policy framework, however, is broader than the subsidization of formal research and development alone. Innovation policy now includes R&D-oriented, systems-oriented, and transformative frames, often implemented through multilevel policy mixes in which regional, national, and European instruments interact [
5,
6]. This broader perspective matters for evaluation because different instruments, beneficiaries, and territorial settings are not expected to generate identical economic consequences.
Empirical studies generally find positive average effects of public support, but they also stress strong heterogeneity. Reviews and meta-analyses report complementarity between public and private innovative effort in many settings, although estimated effects depend on programme design, industry, and identification strategy [
7,
8,
9]. Quasi-experimental evidence on tax incentives in the United Kingdom and France likewise reports positive effects on private innovative effort [
10,
11]. Evidence on direct grants and place-based support shows that outcomes depend on local absorptive capacity, productive structure, and administrative quality [
12,
13,
14,
15].
Recent work further shows that the same nominal policy tool may operate differently across ownership structures, leverage positions, governance arrangements, sectors, and phases of the innovation cycle [
16,
17,
18,
19]. Collaborative schemes add another layer of complexity because they may widen learning opportunities, but their benefits depend on prior collaboration experience and organizational capability [
20]. The broader literature therefore cautions against treating average programme effects as if they were institutionally uniform.
2.2. Why Firm Accounts Matter
Most evaluations nonetheless focus on innovation inputs or outputs: R&D spending, patents, collaborations, employment, productivity, or survey-based innovation measures. These outcomes remain indispensable, yet they do not fully reveal whether supported innovation becomes economically embedded in the beneficiary firm. If a subsidized activity is internalized and commercialized, it may appear in revenues, personnel costs, asset composition, or eventually profitability. If it is only weakly absorbed, the same support may appear primarily as cost growth, fragile margins, or balance-sheet movements without durable market gains.
This paper refers to systematic statistical associations of this kind as financial-statement patterns. The term does not imply that financial accounts reveal policy effectiveness mechanically. Rather, firm accounts are treated as a complementary diagnostic of economic absorption, that is, the extent to which supported activity is integrated into the firm’s productive, organizational, and financial structure.
This diagnostic lens differs from the notion of absorption most common in the cohesion-policy debate. Programmes are frequently assessed by their spending (or financial-administrative) absorption—the speed and completeness with which allocated funds are committed, spent, and certified. High spending absorption signals procedural efficiency, but it does not reveal whether public resources have been converted into durable economic capacity. Economic absorption, by contrast, asks whether support leaves an observable trace in the beneficiary’s accounts. The two need not coincide: a programme may disburse fully and still leave little economic footprint, whereas slower disbursement may nonetheless accompany genuine capability building. This paper is concerned with economic absorption, which it distinguishes from spending absorption and from programme-effectiveness evaluation.
A recent study of Lombardy beneficiaries found that higher subsidy intensity was associated with subsequent growth in revenues, intangible assets, and personnel costs, especially in manufacturing [
21]. The present paper extends that logic to a comparative setting and embeds it in a broader analytical discussion of place, governance, and accounting visibility.
Three features of this prior evidence are directly relevant to the comparison developed here, and they frame the discussion of our own findings in
Section 6. First, the firm-level effects of innovation support tend to be concentrated in identifiable subgroups rather than spread evenly across beneficiaries: Criscuolo et al. [
13] show that the employment effects of UK investment subsidies are driven almost entirely by smaller firms, while Bronzini and Piselli [
12] find that the patenting response to an Italian regional programme is stronger for smaller firms. Second, the magnitude and even the persistence of measured effects depend on macroeconomic and design conditions, with reported effects varying over the business cycle [
22] and, in some settings, proving partly transitory [
23]. Third, additionality is itself heterogeneous across instruments, government levels, and industries [
7,
8,
24], while productivity gains from R&D subsidies are documented but uneven across contexts [
25]. Taken together, this literature warns against expecting a single, uniform accounting signature of support and motivates the explicitly comparative, heterogeneity-aware reading adopted below.
2.3. Interpreting Accounting Signals
Using firm accounts for policy evaluation requires caution because the same accounting movement can have different substantive meanings. Revenue growth may indicate successful commercialization, but it may also reflect broader market conditions. Higher personnel costs may signal capability building and the recruitment of skilled labour, but they may also indicate a heavier cost structure if not matched by output growth. Profitability can remain flat in the medium term, even when projects are economically meaningful, for example during experimentation, scaling, or market development.
Intangible assets are especially ambiguous. They do not measure innovation directly; they measure the portion of development expenditure or knowledge that accounting standards allow firms to recognize as assets. Capitalization depends on sectoral business models, firm behaviour, and accounting rules [
26,
27]. In collaborative projects, some knowledge may also remain embodied in research partners rather than in the beneficiary firm’s balance sheet [
20]. For this reason, the relevant interpretive unit is not any single accounting item in isolation but the broader configuration across revenues, intangibles, labour costs, and profitability.
Place and governance shape this configuration. Local productive structure, knowledge stocks, firm-size distribution, and administrative quality influence both the implementation of support and the ability of firms to absorb it [
13,
28,
29,
30]. Many regional programmes do not make rejected applications, scores, or sharp running variables publicly available, which limits quasi-experimental identification. In such settings, the evidence shows whether more intensive support is associated with stronger or weaker accounting adjustments among beneficiaries within a design that includes only beneficiaries and no comparison group. The analytical expectation is therefore configurational: where subsidized innovation is commercially and organizationally embedded, higher subsidy intensity should be associated, in normalized terms, with stronger revenue growth, greater personnel-cost growth, and, especially in sectors where capitalization is common, larger intangible assets.
2.4. How Financial-Statement Variables Capture Subsidized Innovation
The use of accounting variables as a diagnostic of economic absorption rests on an explicit, if partial, mapping between the economics of a subsidized project and the way it is recorded in financial statements. When support finances activities that are subsequently commercialized, the resulting output is recognized as revenue under ordinary revenue-recognition rules, so the commercialization of subsidized innovation is expected to surface with a lag in turnover. When support finances capability building—hiring or retaining technical staff—the corresponding outlay is recorded as personnel cost in the income statement, which is why labour cost is informative about the internalization of project activity. Profitability ratios (ROE, ROI, and ROS) capture whether these revenue and cost dynamics translate into margins, but they are deliberately treated as lagging and ambiguous indicators, because experimentation and scaling can compress margins in the medium term even for economically meaningful projects.
The most delicate mapping concerns intangible assets. Innovation expenditure becomes a recognized intangible asset only to the extent that accounting standards permit capitalization. Under IAS 38 [
31] and the Italian standard OIC 24 [
32], research costs must be expensed as incurred, and development costs may be capitalized only when technical feasibility, the intention and ability to complete the asset, and the availability of adequate resources can be demonstrated. Recorded intangible fixed assets are therefore a conservative and selective proxy for codified knowledge investment, and they tend to understate innovation effort—particularly in SMEs, which frequently expense rather than capitalize development outlays [
26,
27]. Two implications follow. First, the absence of an intangible-asset response cannot be read as the absence of innovation. Second, because capitalization practices vary systematically across sectors, intangible-asset effects are expected to be most visible where capitalization is common, which is one reason the analysis examines sectoral heterogeneity. Throughout, the relevant interpretive unit is the configuration across revenues, personnel costs, intangible assets, and profitability rather than any single line item, consistent with the view that accounting captures the visibility—not the full economic substance—of innovation [
33].
Whether economic absorption becomes visible is not a property of the firm alone; it is shaped by the wider setting in which support is granted and used. Three levels can be distinguished. At the firm level, absorptive capacity—the ability to recognize, assimilate, and exploit new knowledge, which depends on prior investment and human capital—conditions whether support is turned into investment and marketable output [
29,
34]. At the level of the regional productive structure, sectoral composition and the firm-size distribution shape capital intensity, capitalization practices, and the scope for commercial scaling, and thus the accounting channels through which support can surface. At the level of the regional administration, institutional capacity and the delivery architecture—selection, financial screening, monitoring, verification, and beneficiary structures—affect which firms are supported and how regularly projects are implemented [
13,
14,
28,
30]. The resulting analytical expectation is configurational rather than causal: support is more likely to be visible in beneficiary accounts where firm absorptive capacity, a manufacturing-oriented productive structure, and a more result-oriented delivery architecture coincide. The conceptual framework presented in
Section 6 outlines this configuration, providing a structure for both the institutional analysis in
Section 3 and the subsequent discussion in
Section 6; it is an interpretive lens that organizes the descriptive evidence into a coherent reading.
3. Institutional Setting and Case Selection
The empirical comparison focuses on two regional programmes financed under the 2007–2013 ERDF cycle. The common European framework provides broad comparability in competitive selection, staged disbursement, auditability, and state-aid compliance. The cases nevertheless differ in productive context and delivery architecture, which makes the pair analytically informative.
In Sicily, the analysis examines Line 4.1.1.1 of the Regional Operational Programme, implemented through two sequential calls (a 2010 call for research and experimental development and a 2011 follow-up call, commonly referred to as “Bando BIS”). The scheme was grant-based and centred on mandatory consortia comprising at least three SMEs and one university or research organization, with one enterprise acting as the lead partner. Applications and reporting relied mainly on documentary submission through postal channels or certified electronic mail. Disbursement followed a three-tranche structure, with guarantees advance payments and documentary conditions for subsequent tranches. Monitoring used the regional back-office platform Caronte, but the calls did not rely on an end-to-end digital front-office platform.
In Lombardy, the analysis focuses on Axis 1 of the Regional Operational Programme and, more specifically, on a portfolio of innovation calls rather than a single instrument: an energy-efficiency call, a process-and-service-innovation call, and a joint call with the Ministry of University and Research (MIUR). The first two were grant-only, whereas the 2011 call combined a grant with a subsidized loan and included explicit financial screening. Compared with Sicily, the Lombardy setting was characterized by more digitalized workflow support through the Gestione Finanziamenti (GEFO) platform, a more varied instrument design, and a more articulated chain of technical and financial verification involving specialized entities such as Finlombarda and Cestec. Beneficiary structures were also more flexible than the mandatory consortium model used in Sicily.
These contrasts are not introduced as direct regressors. They are part of the interpretive framework used later to assess whether observed financial-statement patterns are consistent with different productive and implementation environments. Two points are especially relevant. First, Sicily’s consortium-based design may reduce the visibility of innovation in beneficiary firm accounts, especially for intangible assets, if knowledge production or intellectual-property arrangements remain partly external to the lead firm. Second, Lombardy’s more standardized workflow and explicit financial screening may contribute to more homogeneous implementation paths.
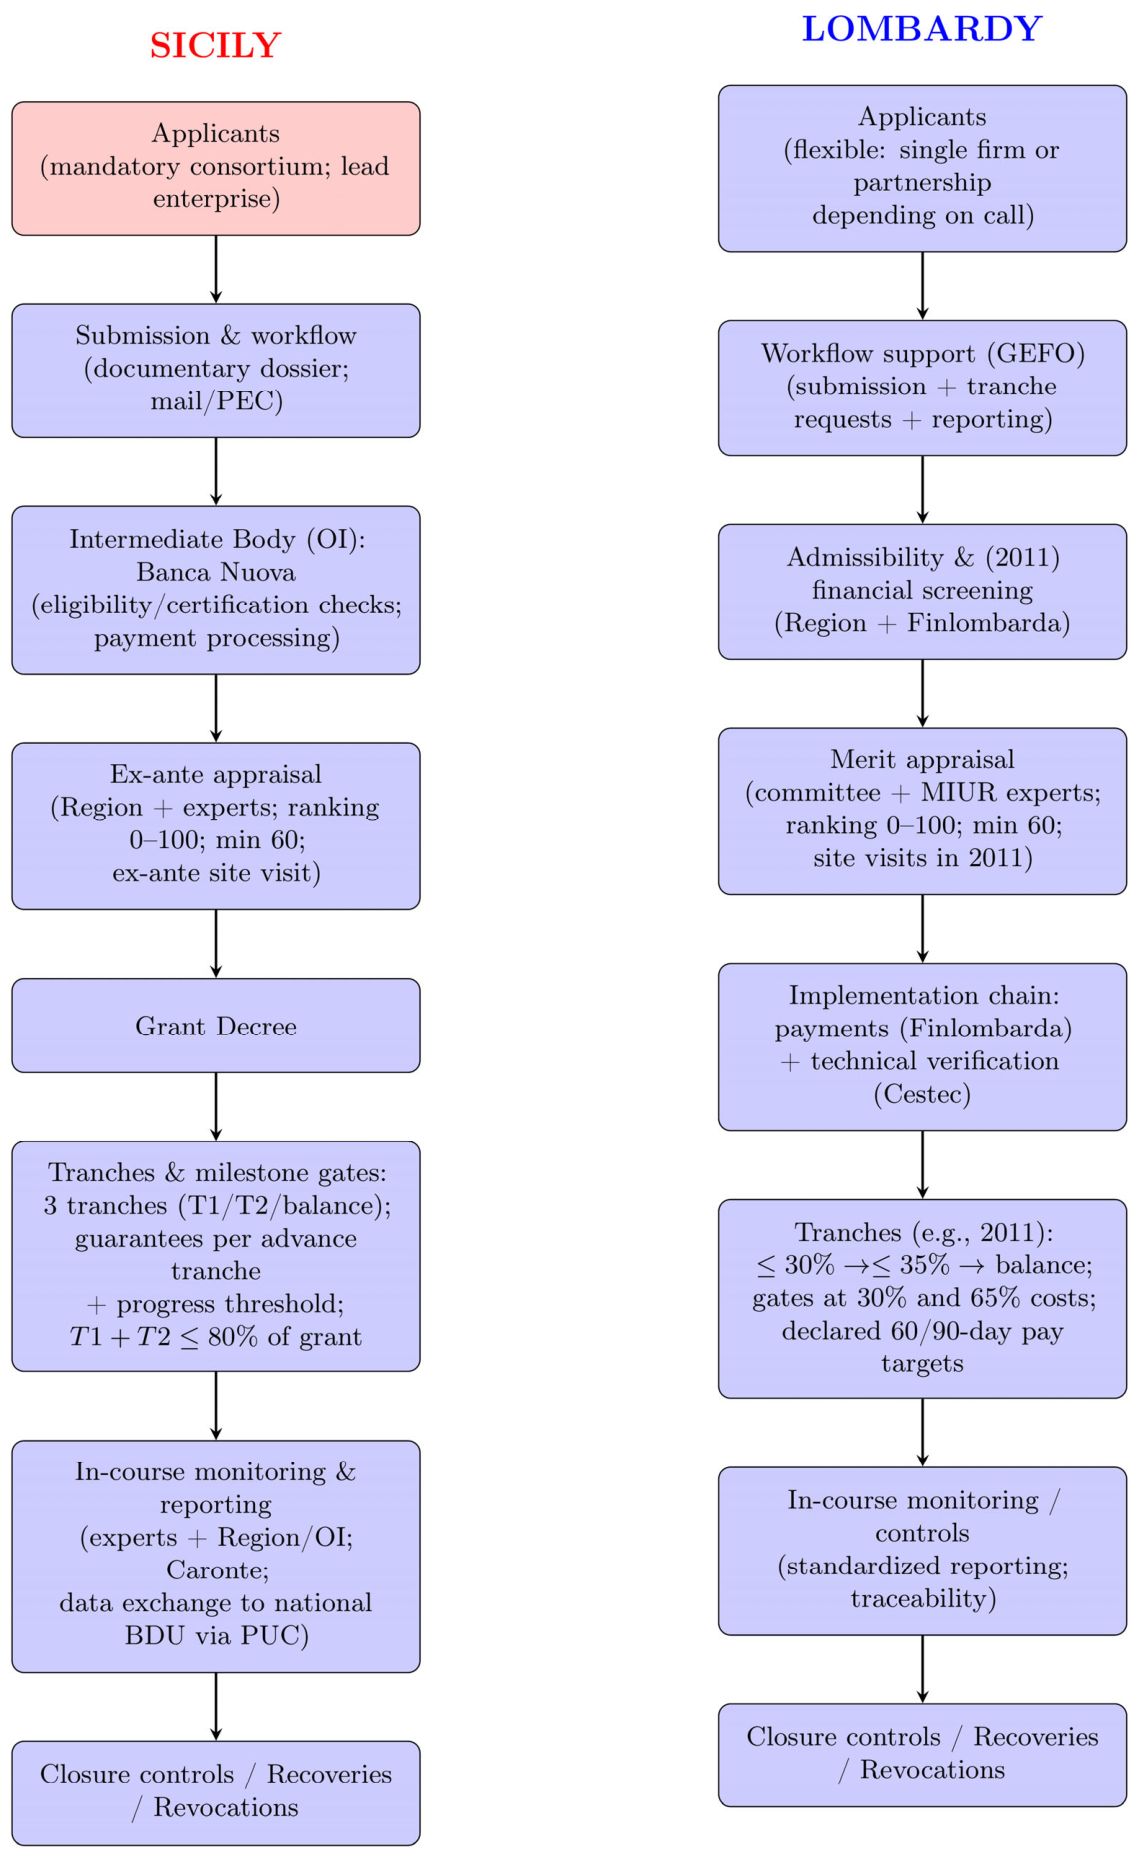
Figure 1 summarizes the two delivery chains and highlights differences in beneficiary structure, workflow, screening, disbursement, and monitoring.
Figure 1 should be read as a stylized process map rather than as a causal model. Each column follows the administrative chain from applicant configuration to closure controls. The Sicily chain combines mandatory consortia led by a firm, documentary submission, an intermediate body involved in eligibility/certification checks and payment processing, and three tranches tied to guarantees and progress thresholds. The Lombardy chain combines more flexible beneficiary structures, a GEFO-supported workflow, explicit financial screening in the 2011 call, separate technical and financial verification functions, and more standardized reporting. The purpose of the figure is to show why nominally similar ERDF support may leave different traces in beneficiary firms’ accounts even within the same programming period. Differences in consortium design, workflow digitalization, screening, and monitoring may affect project selection, implementation regularity, disbursement timing, and the extent to which project outputs remain internalized within the beneficiary firm. These delivery-chain contrasts are not entered as regressors; they provide the institutional background for interpreting the regional asymmetry documented in the normalized accounting results.
4. Data, Variables, and Empirical Strategy
4.1. Data Sources and Sample Construction
The analysis combines administrative programme records and firm financial statements. Official beneficiary lists and legally binding grant decrees identify supported firms and the amount of awarded support. These records are matched, through value-added tax (VAT) identifiers, to firm accounts from the Italian Business Register. The comparison uses 2010 as the baseline and 2018 as the follow-up year. The baseline aligns with the end-of-beneficiary selection and captures pre-intervention firm conditions; the follow-up provides sufficient distance for commercial maturation while excluding the distortions of the COVID-19 period. Two features of the data guide interpretation. First, the design is a two-period comparison based on two financial-statement years (2010 and 2018); intermediate years are not used. Second, Lombardy and Sicily are constructed and analysed as two separate regional samples and are never combined into a single pooled sample. The data contain neither rejected applicants nor non-beneficiary firms, because the regional administrations do not release rejected applications, scores, or running variables for these programmes. The analysis therefore compares beneficiaries among themselves, without a non-beneficiary counterfactual.
The Lombardy sample draws on the three Axis 1 innovation calls described in
Section 3—energy efficiency (Azione B), process and service innovation (Azione C), and the joint MIUR call. Across these three calls, 93 beneficiary firms were initially identified with complete financial statements for 2010 and 2018; after consistency and data-quality screening (excluded: inconsistent ATECO classification, n = 18; extreme outliers, n = 10; residual data-quality issues, n = 5), the final usable sample comprises 60 firms. This construction reproduces, within the present comparative framework, the protocol of the companion study of that region [
21].
The Sicily sample draws on the two sequential calls of Line 4.1.1.1. The two calls together financed 94 research and innovation projects (44 under the 2010 call, DDG 1703/2010; 50 under the 2011 follow-up, DDG 4591/2011). Each project involves a mandatory consortium of at least four independent legal entities (at least three firms and one research organization). Beneficiary firms were matched by a VAT identifier to the Italian Business Register; only those with complete financial statements for both 2010 and 2018 were retained. Firms that had changed their company name, ceased operations, or were absorbed through mergers or acquisitions over the period were necessarily excluded by the two-point data requirement. After applying the same ATECO-consistency, outlier, and data-quality checks used for Lombardy, the final sample contains 69 firms.
In normalized models, the effective number of observations varies by outcome because proportional change is undefined when the 2010 baseline value is zero; in Sicily, for example, the effective sample falls to 58 for revenue, 57 for personnel cost, and 52 for intangible assets, where several firms report a zero baseline.
To support reproducibility,
Table 1 documents the construction of both samples.
This construction applies a survivorship filter. By design, the analysis retains only firms that remained active and filed complete financial statements in both 2010 and 2018. Beneficiaries that exited the market were absorbed through mergers or acquisitions or ceased to file usable accounts that are necessarily excluded. Surviving firms are plausibly more resilient, better managed, or financially stronger than the full population of beneficiaries, so the estimates describe the subset of survivors rather than all supported firms. This survivorship bias defines the scope of the findings: any association between subsidy intensity and accounting change is conditional on survival, and the results are accounting-visibility diagnostics, not programme-effect estimates.
A related consideration concerns the interpretation of 2018 values. A firm’s accounts in 2018 reflect not only the subsidized project but also general macroeconomic conditions over 2010–2018, sector-specific dynamics, and firm-specific developments—for example ownership changes, diversification, or idiosyncratic shocks—that are unrelated to the grant. The two-period design does not separate these influences from the subsidy; 2018 was chosen as the follow-up year precisely to allow for post-project maturation while stopping short of the COVID-19 discontinuity that contaminates later accounts. The associations reported below are therefore gross associations—they include these other influences alongside the effect of support.
The final dataset is therefore a two-period beneficiary panel. It is not intended to represent the full population of firms in either region. Rather, it captures the subset of beneficiary firms that can be consistently matched to financial statements and analysed under a common protocol. This matters for interpretation: manufacturing is overrepresented in Lombardy, whereas the residual non-manufacturing group is overrepresented in Sicily.
4.2. Variables and Notation
The outcomes are designed to capture different dimensions of firm-level economic absorption. Revenue proxies commercialization and scale expansion. Intangible fixed assets capture the accounting visibility of codified knowledge investment. Tangible fixed assets test whether supported activity is associated with changes in the physical capital base. Personnel cost captures labour absorption and capability building. Return on equity (ROE), return on investment (ROI), and return on sales (ROS) capture profitability, while the capital–turnover ratio, defined as tk = Revenue/Total Assets, captures asset utilization.
For a firm
i, let
Yi,t denote a given outcome in year
t. Absolute and normalized changes are defined as follows:
The support variable
Incentivei is the amount awarded in the administrative decree. The key normalized regressor is subsidy intensity:
Revenue is used as the normalization base because it provides a common scale across sectors and makes the support measure interpretable relative to pre-existing market activity.
To explore sectoral heterogeneity, firms are grouped into three broad categories based on ATECO, the Italian statistical classification of economic activities: manufacturing (C), professional, scientific and technical activities (M), and a residual group containing all remaining activities (AA). The aggregation is deliberately coarse, but the available sample size, particularly in Sicily, does not support finer sectoral partitions. Variables, notations, and their accounting interpretation are summarized in
Appendix A Table A1.
4.3. Empirical Roadmap and Specification
The empirical analysis proceeds in five steps. First, Equation (4) estimates pooled OLS models in absolute changes as a benchmark; these are reported briefly because nominal euro changes remain strongly affected by the baseline firm size. Second, Equation (5)—the preferred specification—relates normalized outcome changes to subsidy intensity. Third, Equation (6) allows for the intensity slope to vary across the three broad sector groups, and Equation (7) reports a sample-share-weighted summary slope for descriptive convenience. Fourth, because Sicilian intensity ratios are highly skewed, Sicilian OLS is estimated on the common band si ∈ [0, 0.6], while permutation tests on the full distribution assess whether any dependence is concentrated in the upper tail. Fifth, robust and diagnostic tests assess sensitivity to non-normality, heteroscedasticity, and influential observations. Throughout, the design compares beneficiaries among themselves, without a non-beneficiary counterfactual.
The first specification uses ordinary least squares (OLS) to relate absolute changes in outcomes to nominal awarded support:
This pooled absolute-change model asks whether firms receiving larger grants show larger absolute accounting changes. Because the baseline firm size differs sharply across beneficiaries, these models are expected to be difficult to interpret.
The main specification relates normalized changes to subsidy intensity:
This pooled normalized model asks whether firms receiving larger support relative to the baseline turnover exhibit stronger proportional changes in the outcome. Because normalization addresses scale heterogeneity more directly, Equation (5) is the preferred specification for cross-firm comparison.
Sectoral heterogeneity is explored with a normalized interaction model:
where
Di,C and
Di,M are sector dummies, and
AA is the omitted group. For descriptive convenience, the paper also reports a sample-share-weighted marginal slope:
Here, wAA, wC, and wM are the observed sample shares of AA, C, and M firms in the estimation sample.
Appendix A Table A2 summarizes the meaning of the coefficients and dummy terms used in Equations (4)–(7).
4.4. Sicily’s Intensity Distribution and Diagnostics
A specific issue arises in Sicily because subsidy intensity is extremely skewed. Some micro-firms received support amounts that were very large relative to the baseline turnover, generating ratios far above the Lombardy range. A single OLS line fitted to the full distribution would therefore be dominated by a small upper tail.
For this reason, Sicilian OLS estimates are reported for a trimmed analytical band, si ∈ [0, 0.6]. The choice of the 0.6 upper bound is dictated by cross-regional comparability rather than by a data-driven search over thresholds. In Lombardy, subsidy intensity ranges from about 0.30% to 56.57% (mean 8.93%), so virtually all Lombardy firms satisfy si ≤ 0.6. In Sicily, by contrast, intensity ranges from 0.32% to 3991.11% (mean: 145.14%), because a small number of micro-firms received grants several times larger than their baseline turnover. Setting the upper bound to 0.6—approximately the Lombardy maximum—therefore defines the common support over which the two regions can be compared on equal terms and prevents a few extreme Sicilian observations from mechanically determining the slope and the associated inference. Because the bound is fixed by the Lombardy range rather than tuned to each outcome, it does not amount to selecting firms on the basis of their results; the sensitivity of the conclusions to this choice is examined through the full-distribution permutation tests described next. To assess whether any dependence remains outside that common interval, permutation tests are also run on the full Sicilian distribution. This combination makes it possible to distinguish the absence of a stable average linear pattern from the presence of tail-driven covariance.
4.5. Robustness and Design Limits
The analysis complements OLS with Shapiro–Wilk tests for normality, Breusch–Pagan tests for heteroscedasticity, variance inflation factor checks, Huber-type robust regression, and permutation tests based on 10,000 iterations. These procedures assess the sensitivity of the observed associations to distributional assumptions and to influential observations.
The effective sample size is adequate relative to the dimensionality of the models estimated here, including the sector-interaction specification. Even the most parameterized model includes only five explanatory terms, so the outcome-specific samples provide roughly ten or more observations per regressor. Sector-specific estimates, particularly for Sicily, are nevertheless interpreted with appropriate caution because smaller sectoral cells imply lower precision. This is consistent with the broader simulation-based point highlighted by [
35]—albeit in a logistic-regression setting—that estimation becomes less reliable when the information available for each estimated term is too limited.
The design is observational, non-causal and treated-only: it includes only beneficiary firms with no comparison group, and the estimates are within-sample associations that do not support causal inference. The design includes no unsuccessful applicants, non-beneficiaries, rejected scores, or running variable that would support regression discontinuity, and no realized disbursements or project-specific firm expenditures; the central support measure is the amount awarded in the decree. Because the design includes only beneficiaries with no comparison group, the association between subsidy intensity and accounting change incorporates pre-existing differences across beneficiary firms—in size, sector, managerial quality, or growth trajectory—that may be correlated with both the intensity of support received and subsequent accounting dynamics. The findings are therefore presented as accounting-visibility diagnostics consistent with the scope of the design.
The empirical analysis was implemented in Python (version 3.9.23) using a comprehensive set of open-source libraries. Data handling and numerical operations relied on pandas (v2.3.3) and numpy (v2.0.2). Regression modelling, analysis of variance, diagnostic tests, and power calculations were conducted with statsmodels (v0.14.6), scipy (v1.13.1), and patsy (v1.0.2). Visualisations were created with matplotlib (v3.9.4) and seaborn (v0.13.2), while Excel file operations were handled via openpyxl (v3.1.5). All computations were executed in a dedicated Conda environment to ensure full reproducibility.
5. Results
5.1. Descriptive Evidence
The two treated samples differ markedly in baseline scale and sector composition. Lombardy beneficiaries are substantially larger in revenues, tangible assets, intangible assets, and personnel costs, and the sample is strongly manufacturing-oriented. Sicily contains smaller firms, a more heterogeneous sector mix, and a much larger residual-sector component. The most consequential difference for the econometric analysis concerns subsidy intensity: it remains within a moderate range in Lombardy but is highly dispersed in Sicily, where a small set of micro-firms received support that was very large relative to the baseline turnover. These differences already suggest that absolute euro changes are unlikely to be very informative across the two samples, as shown in
Table 2.
5.2. Pooled Absolute-Change Models
The pooled absolute-change models of Equation (4) are largely uninformative in both regions. Across revenues, tangibles, intangibles, personnel costs, profitability ratios, and the capital–turnover ratio, the estimated coefficients are small relative to the dispersion of the dependent variables, and the model fit is poor. This is consistent with the dominance of scale heterogeneity: the same nominal grant does not carry the same economic meaning for firms with a very different initial size. For this reason, the discussion below focuses on normalized models.
5.3. Main Pooled Normalized Results
Once both support and outcomes are expressed relative to the baseline firm size, a clearer regional contrast emerges.
Table 3 reports the main pooled normalized results for revenue change, intangible-asset change, and personnel-cost change. Full pooled normalized OLS results, including fit and robustness statistics, are reported in
Appendix A Table A3 and
Table A4.
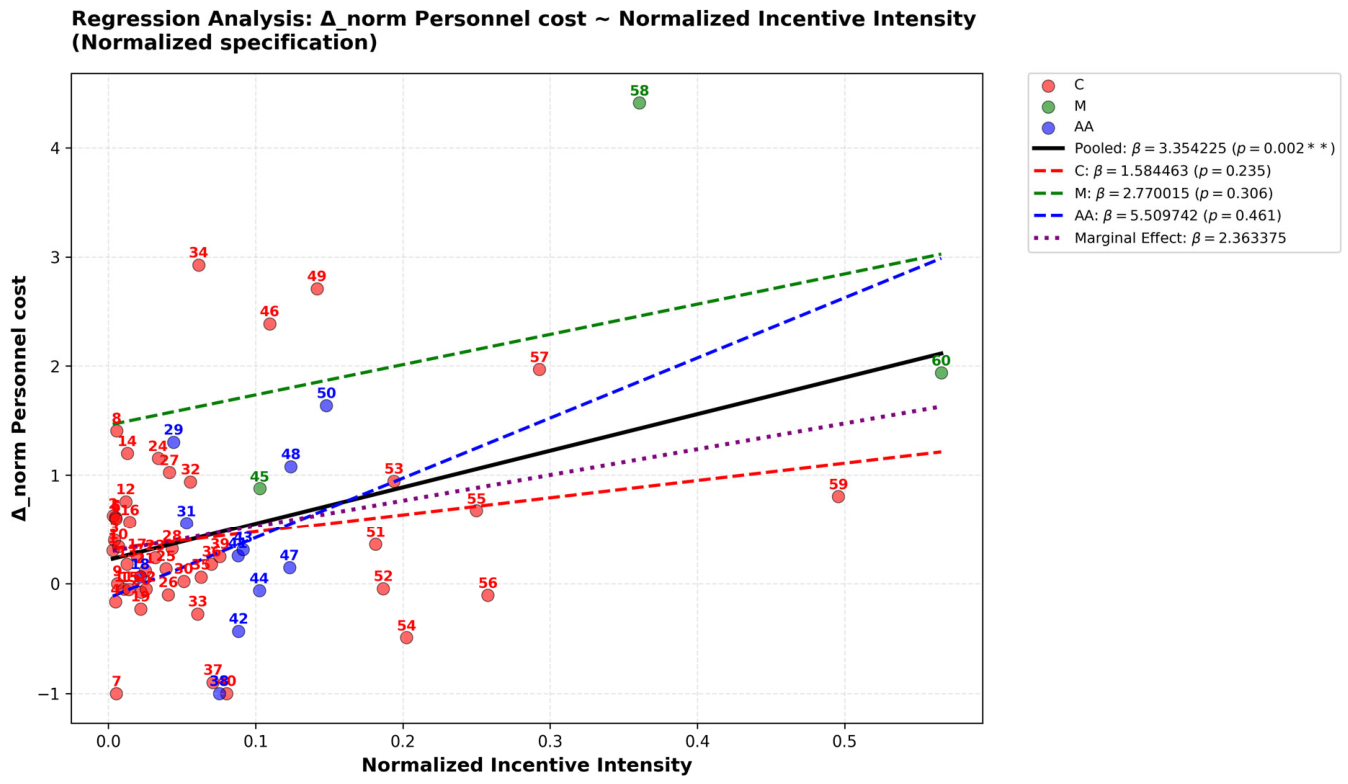
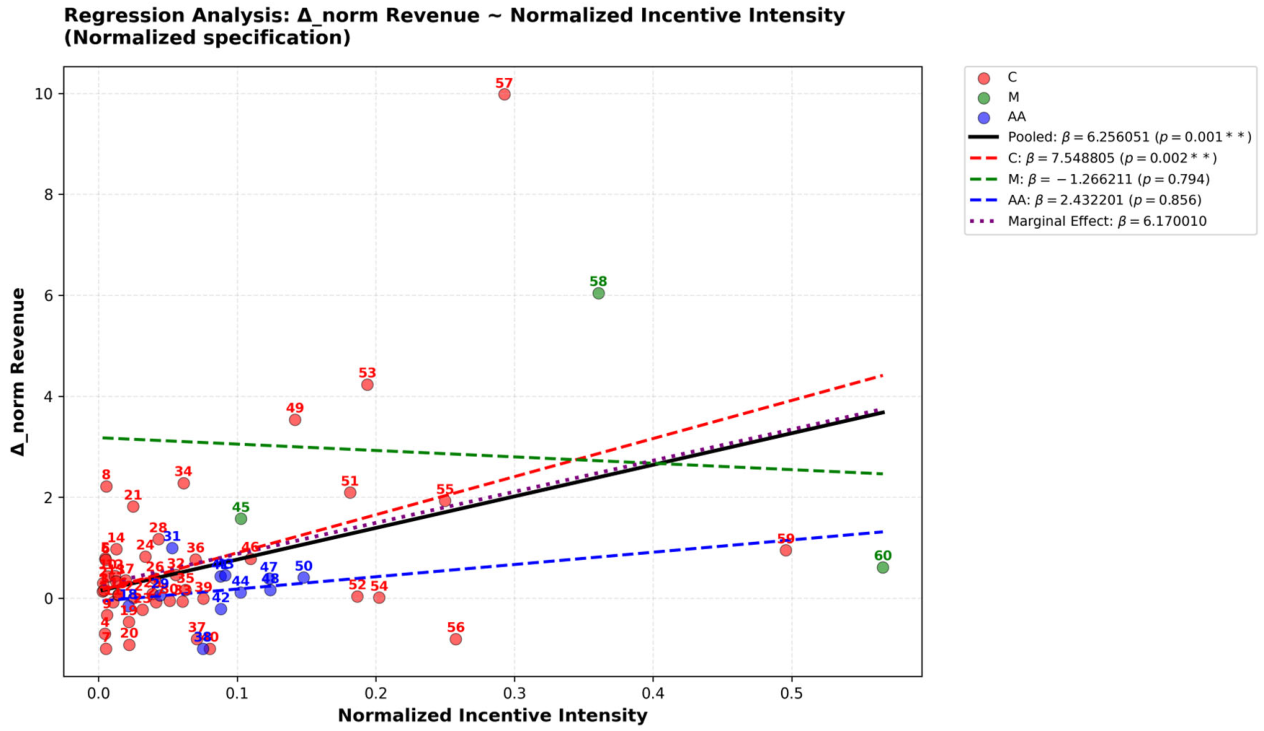
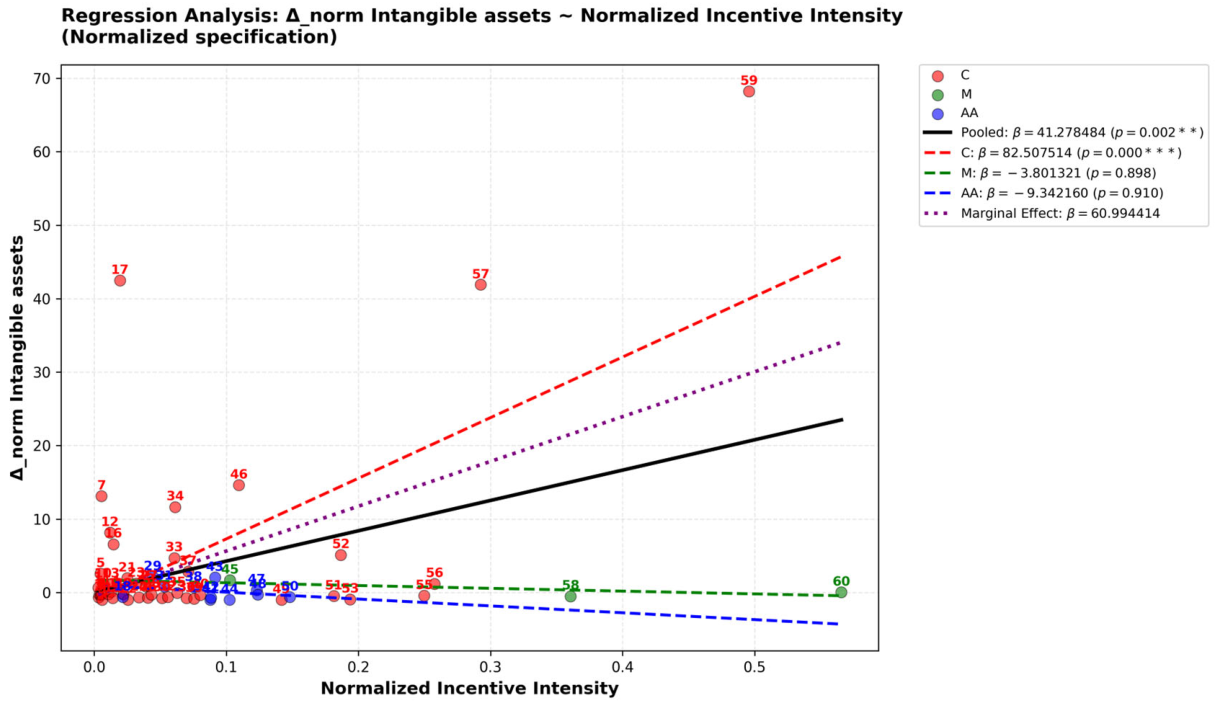
In Lombardy, the pooled normalized model of Equation (5) yields positive and statistically significant slopes for all three outcomes. The estimated slope on subsidy intensity is 6.2561 for normalized revenue change (p = 0.0011), 41.2785 for normalized intangible-asset change (p = 0.0018), and 3.3542 for normalized personnel-cost change (p = 0.0018). Adjusted R2 values are modest but non-negligible for firm-level observational data, and permutation tests confirm that the revenue and personnel-cost associations are unlikely to arise under random reassignment.
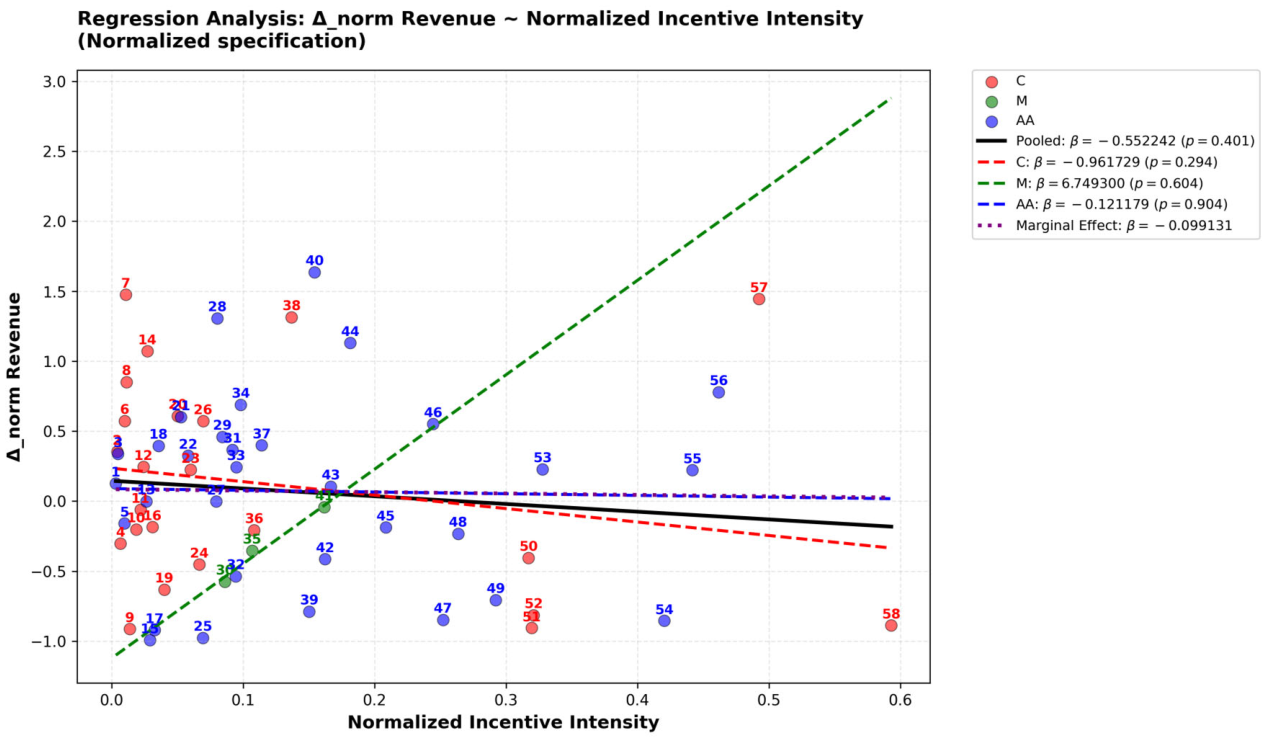
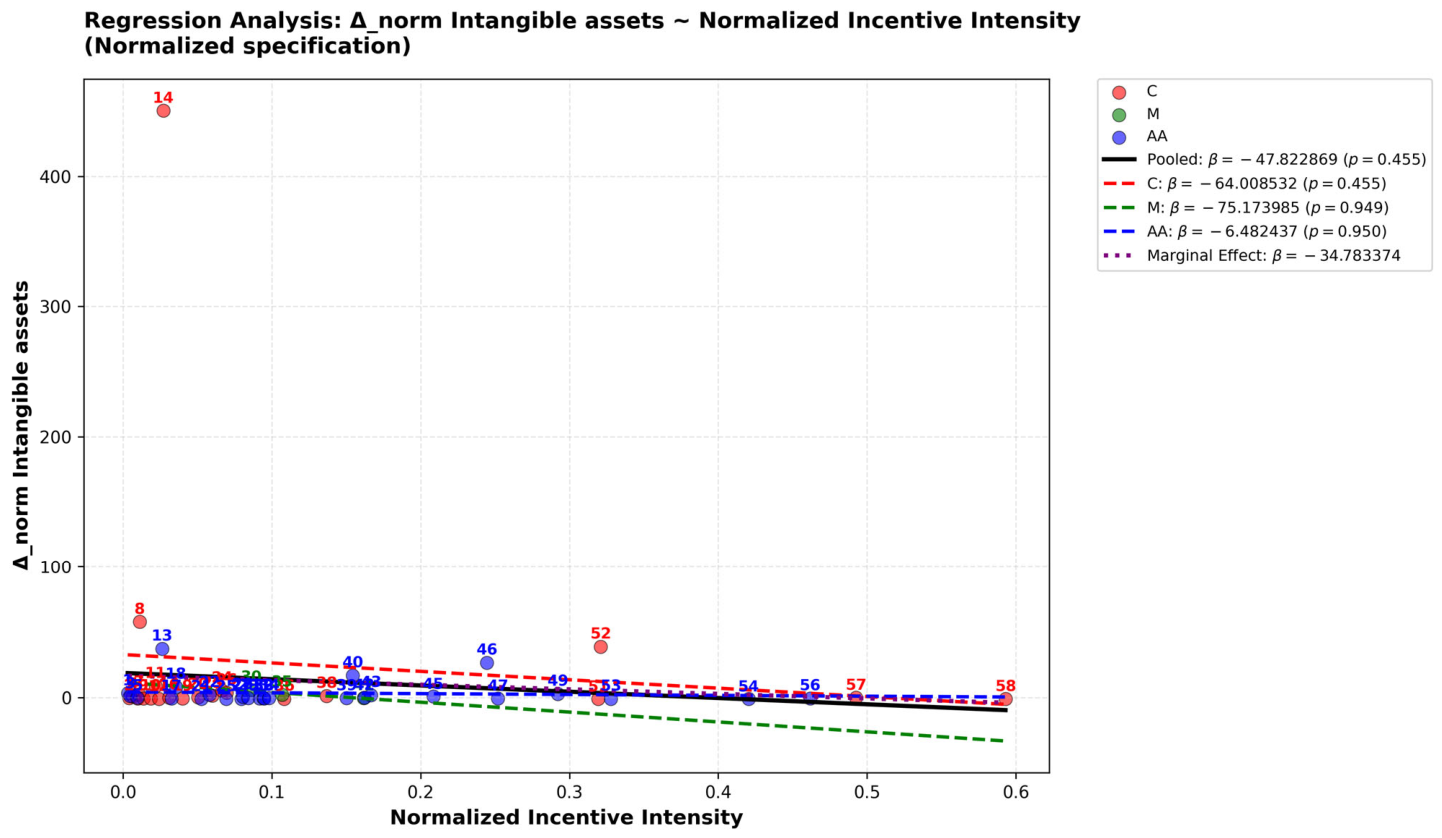
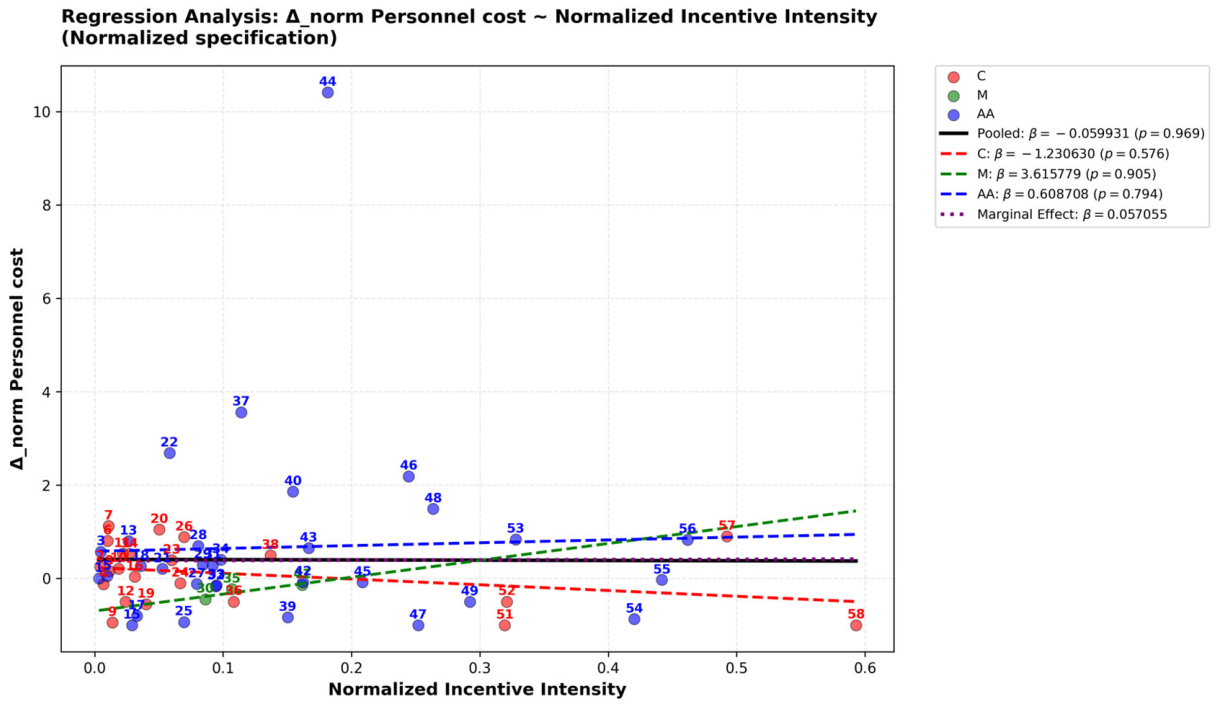
In Sicily, the trimmed ordinary least squares models do not reveal a stable common linear relationship within the Lombardy-comparable intensity range. The slope for revenue is slightly negative and non-significant (−0.5522, p = 0.4006), the slope for intangible assets is negative and highly imprecise (−47.8229, p = 0.4547), and the slope for personnel costs is essentially zero (−0.0599, p = 0.9694). Adjusted R2 values are negligible or negative. Yet full-sample permutation tests still detect statistically unusual covariance for these three outcomes. Taken together, these findings indicate dependence concentrated in the upper tail of the Sicilian intensity distribution rather than a stable average linear pattern within the common support range. The contrast between the two results is not contradictory but informative about where the dependence lies. The trimmed OLS is estimated only on firms in the common band si ∈ [0, 0.6] and asks whether, among the bulk of comparable beneficiaries, more intensive support is linearly associated with larger proportional change; within this band the answer is no. The permutation test is instead computed on the full Sicilian distribution—including the small set of micro-firms with extreme intensity ratios—and is a non-parametric assessment of whether the observed configuration of (intensity, outcome) pairs is unusual relative to a random reassignment of the outcome. A low permutation p-value combined with a null trimmed slope therefore indicates that whatever co-movement exists is generated by these few high-intensity observations in the upper tail rather than by a regular linear relationship across the comparable range. Because such tail-concentrated covariance rests on a handful of influential firms and does not survive restriction to the common support, it indicates a tail-driven, heterogeneous pattern within the Sicilian subsample.
Figure 2,
Figure 3 and
Figure 4 plot the Lombardy pooled normalized relations for revenues, intangible assets, and personnel costs, respectively.
Figure 5,
Figure 6 and
Figure 7 plot the corresponding Sicilian relations over the trimmed analytical band. Visually, the Lombardy plots show upward-sloping fitted lines, clearest for revenues and personnel costs, whereas the Sicilian plots show wide vertical dispersion around approximately flat lines. This contrast between upward-sloping Lombardy relations and flat Sicilian relations is one of the central descriptive findings of this paper.
5.4. Sector Heterogeneity
Table 4 shows that the pooled Lombardy results mask meaningful sectoral asymmetry. In the normalized interaction model of Equation (6), the positive revenue association is driven mainly by manufacturing firms. The manufacturing-specific slope is 7.5488 for normalized revenue change (
p = 0.0025). The same is even more evident for intangible assets: the manufacturing-specific slope is 82.5075 (
p < 0.001), whereas non-manufacturing slopes are flat or weakly negative. Personnel costs show a broader positive pattern, but sectoral differentiation is less robust. These findings are consistent with a setting in which commercialization and capitalization effects are most visible where manufacturing beneficiaries are prevalent. Full normalized interaction results are reported in
Appendix A Table A5 and
Table A6.
In Sicily, none of the sector-specific slopes provide evidence of a stable channel. Point estimates vary in sign across sectors, but all are imprecisely estimated, especially in the small M-group cell. The interaction results therefore reinforce the view that Sicily lacks a common linear financial-statement pattern within the trimmed analytical band.
5.5. Other Outcomes and Robustness
Across both regions, normalized tangible assets, profitability ratios, and the capital–turnover ratio do not show robust associations with subsidy intensity. The clearest accounting manifestations of support, where they appear, concern commercialization, labour absorption, and the accounting visibility of intangible investment rather than physical capital deepening or immediate profitability gains.
The robustness checks sharpen the interpretation of the Lombardy findings. Because residuals in the normalized models are not fully well-behaved, robust regression and permutation inference are used alongside ordinary least squares. These checks attenuate but do not eliminate the positive associations for normalized revenues and personnel costs. The pooled intangible-asset coefficient is more sensitive to influential observations and trimming, although the manufacturing-specific slope remains large. In Sicily, neither robust estimation nor trimming recovers a stable linear relation for the three focal outcomes. The Sicilian evidence is therefore heterogeneous and tail-driven.
6. Discussion
This paper addresses a simple question: once an innovation subsidy has been awarded and the project has been completed, does the support become visible in the beneficiary firm’s financial statements? The question is deliberately one of accounting visibility and economic absorption among beneficiaries, not one of causal policy effectiveness. The comparison between Lombardy and Sicily provides a clear answer. In Lombardy, higher subsidy intensity is associated with better economic dynamics in the beneficiary firms, especially higher revenues, higher personnel costs, and, in manufacturing, higher intangible assets. In Sicily, no stable common relationship emerges within the common intensity range. Among comparable beneficiaries, support is visible in Lombardy beneficiary accounts, whereas in Sicily no common association between subsidy intensity and balance-sheet outcomes is detectable within the common intensity range. This finding reflects the visibility of support among beneficiaries and is distinct from an assessment of programme effectiveness.
The first reason for this contrast is the different productive structure of the two regional samples. Lombardy is much more manufacturing-oriented and includes larger firms with stronger pre-existing organizational and knowledge bases. In this setting, firms are more likely to transform public support into products, processes, and market outcomes that become visible in their accounts. This interpretation is consistent with our results, since the strongest Lombardy association concerns manufacturing firms, especially for intangible assets. Sicily, by contrast, includes more micro-firms and a more heterogeneous sector mix. In such a context, firms are more fragile, more diverse, and often less able to absorb innovation support in a way that produces clear accounting effects. For this reason, a common pattern is much harder to detect.
The second reason concerns the rules of the programmes. The two regions did not operate with the same “rules of the game”. Compared with Sicily, Lombardy had a more structured selection process, more digitalized procedures, more explicit financial screening in part of the programme, and a more articulated system of controls during project implementation and at project closure. These features are consistent with a setting in which firms are selected more rigorously, projects are monitored more closely, and final results are more likely to translate into firm-level economic outcomes. Sicily followed a less standardized administrative path, which can increase heterogeneity across projects and weaken the observable link between support and financial-statement results. Furthermore, the tail-dominated intensity distribution is likely a reflection of an efficiency and effectiveness issue during the process of defining selection rules for companies receiving financial support.
A third factor is Sicily’s consortium-based design. In the Sicilian programme, projects had to be carried out by consortia including a university or a research body. This may have encouraged technical collaboration, but it may have also reduced the firm’s direct responsibility for turning the project into market and organizational results. When part of the knowledge creation remains with external partners, the beneficiary firm may complete the project formally without obtaining a clear and durable benefit in its own revenues, internal capabilities, or intangible assets. In this sense, the consortium model may weaken the economic embedding of the subsidy inside the firm. Taken together, these three reasons are best read not as separate factors but as a single configuration corresponding to the three levels—or mediators—of economic absorption set out in
Section 2.4: firm absorptive capacity, the regional productive structure, and the regional delivery architecture. What distinguishes the two regions is less the strength of any single level than whether the three are aligned. In Lombardy the levels reinforce one another: a markedly manufacturing-oriented sample of larger firms (
Table 2), whose prior organizational and knowledge bases support absorptive capacity [
29,
34], operates within a more standardized and result-oriented delivery architecture—explicit financial screening, a GEFO-supported workflow, and articulated technical and financial verification (
Section 3) [
13,
14,
28,
30]—so that higher support tends to surface as a relatively diffuse and stable association across comparable beneficiaries. In Sicily the same levels point in different directions: a more fragmented and less capital-intensive productive structure with a large residual-sector component (
Table 2), firms whose absorptive capacity is unevenly distributed, and a delivery architecture—documentary submission, delegated certification, mandatory consortia, and back-office rather than end-to-end monitoring (
Section 3)—that stringently screens at entry but dilutes the firm’s responsibility for final results and adds administrative fragility. This is the sense in which the same European framework, mediated by different regional configurations, can leave different traces in beneficiary accounts [
21]: where the three levels are misaligned, support is less likely to surface as a common pattern across comparable beneficiaries. The reading is configurational.
For these reasons, the Sicilian results show that no association between the balance-sheet variables and the subsidy incentive is detectable among comparable beneficiaries, and the interpretation should foreground heterogeneity within the Sicilian subsample. The permutation evidence on the full distribution suggests that economic absorption may be concentrated in a small subset of firms—for instance, those with the absorptive capacity to convert unusually large grants into accounting change—rather than diffused across beneficiaries as in Lombardy [
29,
34]. The Sicilian configuration reads as a concentration of absorption in a few firms coexisting with its absence in the majority, which is precisely what prevents a stable common slope from emerging within the comparable range. Disentangling genuine programme effects from this internal heterogeneity would require a comparison group and richer firm-level data, which are beyond the scope of the present design.
These findings can also be related to previous research on the firm-level effects of innovation support. The concentration of detectable change among Lombardy manufacturing firms is consistent with evidence that the effects of subsidies are uneven and depend on absorptive capacity, productive structure, and administrative quality [
12,
13,
14,
15,
29]: Criscuolo et al. [
13] and Bronzini and Piselli [
12] likewise find effects concentrated in particular firm subgroups rather than spread uniformly across beneficiaries. The weak, tail-driven Sicilian pattern is in line with meta-analytic and review evidence that additionality is heterogeneous and contingent on programme design and context [
7,
9,
24], and with findings that the visibility of effects depends on macroeconomic and implementation conditions [
22,
23]. At the same time, our results offer a complementary perspective to studies reporting average treatment effects: the accounting approach measures the visibility of absorption among surviving beneficiaries, a diagnostic distinct from—and complementary to—input- and output-based evaluations of subsidy programmes.
Taken together, the evidence supports two interpretive hypotheses. In Lombardy, the results are consistent with a more result-oriented implementation setting: stronger initial selection, closer monitoring, stricter final verification, and a more manufacturing-based regional productive structure seem to have helped beneficiary firms translate subsidies into visible firm-level results. These are interpretive hypotheses based on three elements taken together: the accounting results presented in
Section 5; the documentary analysis of the procedures used to award, monitor and verify the subsidies; and the productive characteristics of the firms and regional contexts examined here.
Before turning to policy, two registers should be distinguished. The empirical contribution of this study is to document whether, and where, subsidy intensity is associated with accounting change among beneficiaries. Statements about programme effectiveness belong to a separate register; the policy reflections below are offered as conditional implications consistent with the evidence.
The policy message is straightforward. Innovation support is more likely to generate visible firm-level results when it operates in a regional productive structure with a stronger manufacturing base and firms with sufficient absorptive capacity, when selection is rigorous, and when controls during implementation and final verification keep the beneficiary clearly responsible for the outcome. The Lombardy case is consistent with this combination, whereas the Sicilian case does not display a comparable common pattern. Future programmes should therefore take regional productive structure into account; strengthen ex ante screening, in-course monitoring, and final verification; and avoid beneficiary structures that dilute the firm’s responsibility for results.
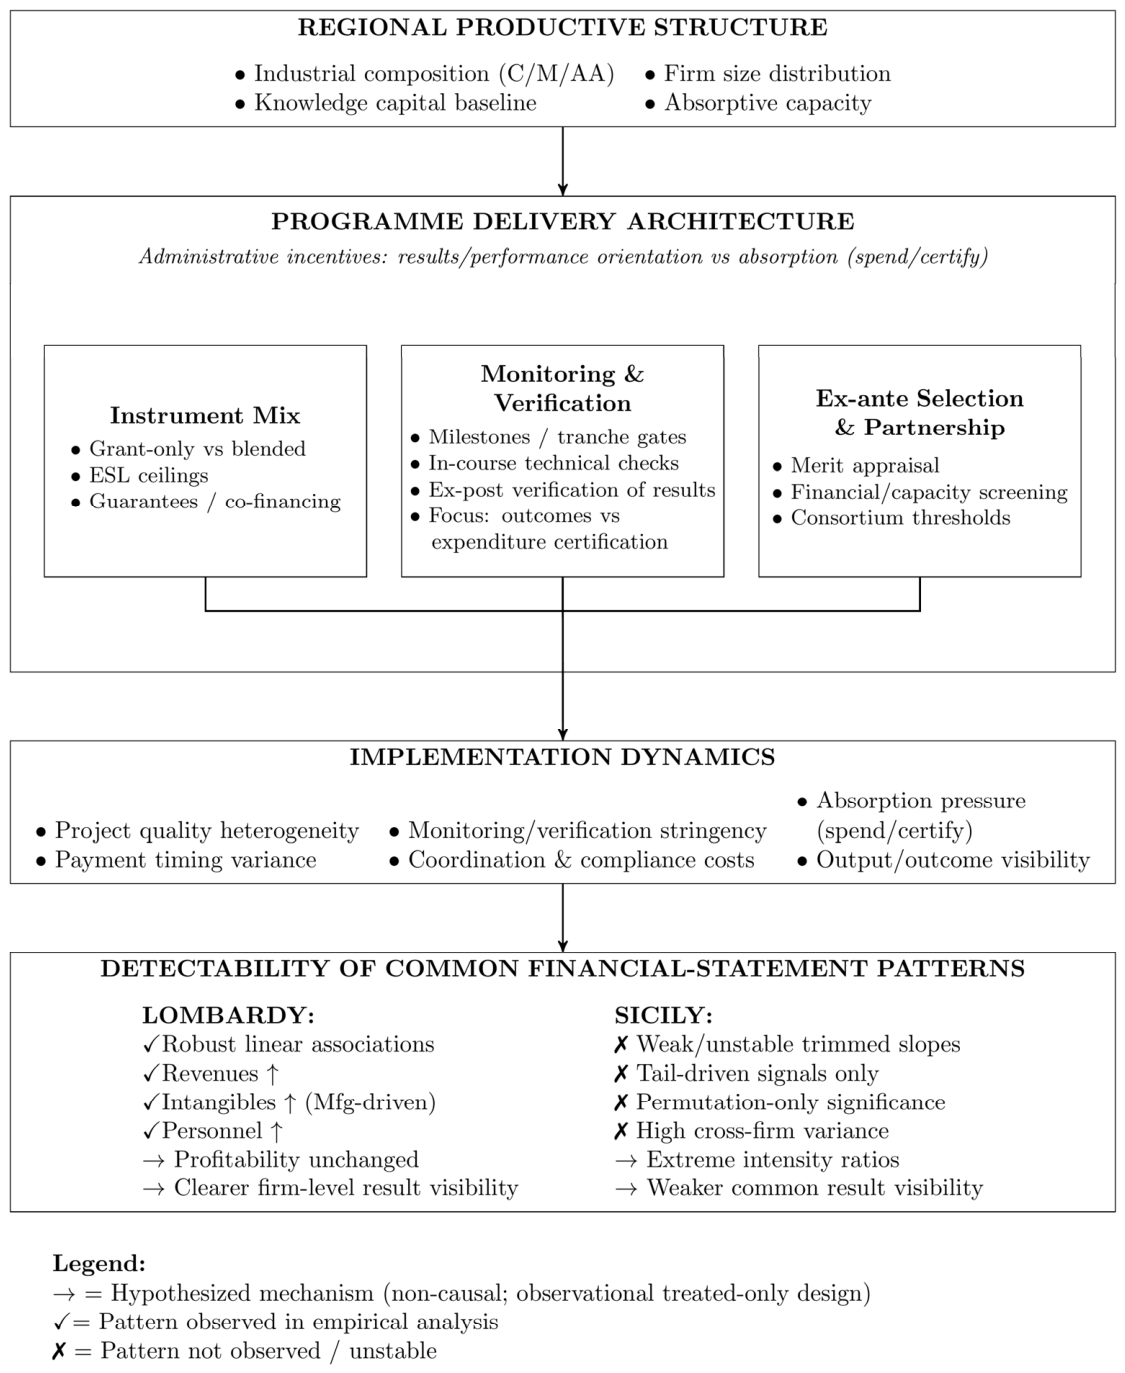
Read through the lens of economic absorption and its three mediators—firm absorptive capacity, regional productive structure, and the regional delivery architecture—
Figure 8 summarizes this interpretation by contrasting clearer firm-level result visibility in Lombardy with weaker common result visibility in Sicily; these links are interpretive.
7. Conclusions
This paper examined whether innovation subsidies are associated with the economic results of beneficiary firms as observed in their financial statements. Using two separate regional samples of beneficiaries—60 firms in Lombardy and 69 in Sicily—each compared between the 2010 baseline and the 2018 follow-up, we related subsidy intensity to subsequent changes in revenues, assets, personnel costs, and profitability, treating each region separately rather than as a single pooled sample. In other words, we asked whether innovation incentives appear to be useful once one looks at firms’ economic results.
The comparison gives a clear result. In Lombardy, higher subsidy intensity is associated with stronger revenue growth, stronger personnel-cost growth, and, especially in manufacturing, higher intangible assets. In Sicily, no comparable linear relationship emerges within the common support range. We then discussed three reasons that are consistent with this difference: a stronger manufacturing base in Lombardy, more rigorous rules for selection and project control, and, in Sicily, a consortium model with research bodies that may weaken the firm’s direct responsibility and reduce the real economic benefit captured by the company. These three reasons correspond to the three levels of economic absorption distinguished in
Section 2.4—firm absorptive capacity, regional productive structure, and the regional delivery architecture—whose alignment in Lombardy and misalignment in Sicily offer a configurational reading of the contrast.
The scope of these conclusions is defined by the non-causal, treated-only design adopted: it includes only beneficiary firms, with no non-beneficiary controls, two financial-statement years, two regions and programmes, and moderate sample sizes—especially within sector cells. Survivorship is inherent in the two-period requirement, so the estimates describe surviving beneficiaries rather than the full population. Financial-statement variables are conservative proxies—particularly intangible assets under restrictive capitalization rules—and capture the accounting visibility of support, not innovation directly.
The evidence is most informative for surviving, manufacturing-oriented beneficiaries of the kind that predominate in the Lombardy sample. Future research could extend the scope by constructing comparison groups of non-beneficiary or rejected applicants and exploiting selection thresholds for quasi-experimental identification; by extending the panel beyond 2018 to test the persistence of absorption; by widening the analysis to additional regions and programmes so as to separate institutional design from territorial structure; and by combining accounting data with qualitative, firm-level evidence to distinguish accounting visibility from economic substance.
The main policy implication is that funding alone is not enough. The design of the instrument matters: who is selected, how projects are monitored, and who remains responsible for final results. The evidence documents associations among beneficiaries; it can still help policymakers design future innovation programmes that are more selective, more accountable, and more capable of generating real firm-level results.