Article

Ammonia Losses, Wheat Biomass, and N Dynamics as Influenced by Organo-Mineral Fertilizer

by
Helen Carla Santana Amorim
1,2,
Francielle Roberta Dias de Lima
1,3,
Mariene Helena Duarte
1,
Rafael Marta Carbone Carneiro
1,
Gustavo Avelar Zorgdrager Van Opbergen
1,
Raphael Felipe Rodrigues Corrêa
1 and
Luiz Roberto Guimarães Guilherme
1,*
1
Department of Soil Science, School of Agricultural Sciences, Universidade Federal de Lavras, Lavras 37203-202, MG, Brazil
2
Crop, Soil and Environmental Sciences Department, University of Arkansas, 1260 W. Maple Street, Fayetteville, AR 72701, USA
3
University of California Cooperative Extension Kings County, University of California Agriculture and Natural Resources, 680 N. Campus Dr Suite A, Hanford, CA 93230, USA
*
Author to whom correspondence should be addressed.
Biosphere 2025, 1(1), 4; https://doi.org/10.3390/biosphere1010004
Submission received: 12 May 2025 / Revised: 15 June 2025 / Accepted: 26 June 2025 / Published: 1 July 2025

Abstract

Organo-mineral fertilizers can slow N release to plants, reducing N losses to the environment and enhancing N use efficiency (NUE). Yet, this greater NUE is not always coupled to greater crop yields, which warrants further investigation. Here, we assessed the relationship between N-NH3 losses from volatilization and wheat (Triticum aestivum L.) biomass and N status. The following treatments were tested: conventional urea (U, 45% N), urea treated with NBPT (N-(n-butyl) thiophosphoric triamide) (U + NBPT, 45.6% N), S-coated urea (U + S; 37% N), Se-coated urea (U + Se; 45% N), organo-mineral fertilizer Azoslow 29 (OMF, 29% N + 50% Azogel®). The above treatments and non-fertilized control were tested in two soils (LVd and LVAd, 71 and 25% clay, respectively). Semi-open static collectors were used to determine N-NH3 volatilization 1, 2, 4, 8, 11, 15, 18, 23, 29, and 36 days after application of treatments. Wheat was cultivated for 35 days, and shoot dry mass and total leaf N were determined after harvest. Cumulative N-NH3 losses from OMF (27 and 32% of N applied in the LVd and LVAd soils, respectively) did not differ from U and (26–32%) and U + Se (24–31%), likely due to organic matter inputs enhancing urease activity in soils. Nevertheless, OMF resulted in 2–4 times greater wheat dry matter than U, U + Se, and U + S, with similar dry mass of U + NBPT for LVAd soils. OMF application enhanced total N removal in wheat leaves relative to the unfertilized control and most N sources. N-NH3 losses did not reduce biomass yield, but were negatively linked to N accumulation in wheat. The OMF enhanced wheat biomass and nutrition while sustaining environmental quality and promoting circularity in agroecosystems.

1. Introduction

Tropical agriculture is growing in response to the increasing demand for food and feed and economic development of developing countries [1]. This expansion occurs in a scenario of increased synthetic fertilizer use and degradation of natural resources, including soil acidification and loss of biodiversity, water quality issues, and increasing greenhouse gas (GHG) emissions. The recycling of industrial by-products allows for alternative, eco-friendly nutrient sources while mitigating the environmental impacts of landfill waste accumulation. Both efforts (alternative nutrient sources and reduction of environmental waste) are aligned with global initiatives to foster sustainable production patterns [2], enhance circularity in agricultural systems [3], and promote regional food security. This can be particularly relevant for communities with limited access to agricultural inputs and subsidies, oftentimes more susceptible to disruptions in the global fertilizer market, as well as for fertilizer companies seeking to develop more sustainable solutions for plant nutrition.
Raw or treated leather wastes are major by-products of the leather industry (i.e., tanneries) and contain up to 11% protein, which can be hydrolyzed to obtain collagen as a raw material for several industries [4,5,6]. Owing to high N and micronutrient contents, hydrolyzed collagen can be used in organic fertilizers or soil improvers, allowing for the partial displacement of synthetic, fossil fuel-based N fertilizers. The development of alternative N sources is a pressing issue in the agricultural sector, as N is one of the most demanded macronutrients by most crops, with synthetic N-fertilizers accounting for ⅓ of farm operational costs, and causing 2% of global GHG emissions [7]. As such, the use of organo-mineral fertilizers derived from hydrolyzed collagen can enhance agricultural sustainability, potentially reducing production costs and alleviating environmental impacts from synthetic N-fertilizers.
Nitrogen (N) losses due to ammonia (NH3) volatilization are a major challenge for N use efficiency in agriculture. When surface-applied, conventional urea can have N losses of up to 60% under field conditions, depending on soil type and management practices [8]. Therefore, several fertilizer technologies have been employed to mitigate N-NH3 losses, including stabilized fertilizers, slow- or controlled-release fertilizers coated with polymers, and urease inhibitors, such as NBPT (N(n-butyl) thiophosphoric amide) [9,10]. Organo-mineral fertilizers based on hydrolyzed collagen have the potential to reduce N-NH3 losses, as the organic matrix can contribute to a slower and more gradual N release, thus increasing plant uptake and N use efficiency. Yet, knowledge on the impacts of these organo-mineral fertilizers on N-NH3 losses is scarce, and comparative studies are needed to support their use as an emerging N-fertilizer.
Lastly, the relationship between N-NH3 losses from various N-fertilizers and crop productivity and nutrition warrants further investigation. Several studies have shown that technologies for fertilizers, including polymer-coated urea or urea treated with urease inhibitors, effectively reduce N-NH3 losses. However, these lower losses are not necessarily followed by increasing N uptake by plants or higher crop production compared to conventional N sources, such as urea [CO(NH2)2] [11,12,13,14]. For instance, Cantarella et al. [15] showcased that urea treated with NBPT reduced N-NH3 losses by 53%, with productivity increases of 5–12% according to cropping system and soil type. Recently, Santos et al. [9] demonstrated organo-mineral-coated urea reduced N-NH3 losses by 70% compared to conventional urea, but no gains in foliar N concentration or corn (Zea mays L.) yields were observed. The N-NH3 volatilization negative impacts on crop yields can be linked to other soil and environmental factors (e.g., light, moisture, and temperature conditions), with N application rates and microbial activity often having an overarching effect on N-NH3 losses, highlighting the complexity of N dynamics in agroecosystems.
Considering the potential benefits from organo-mineral (OMF) fertilizers, the following hypotheses will be tested in this study: (1) N-NH3 losses from organo-mineral fertilizers will be lower than synthetic N-fertilizers (e.g., conventional urea) and will vary according to soil type, and (2) lower N-NH3 losses will contribute to enhanced wheat (Triticum aestivum L.) biomass and N uptake in the OMF-amended plants. The overall goal of this study is to assess the impacts of an organo-mineral fertilizer derived from hydrolyzed collagen [Azoslow 29 (29% N, 50% Azogel®, hereafter referred to as organo-mineral fertilizer (OMF)], on N-NH3 losses by volatilization, wheat biomass, and foliar N concentration to further support the use of more sustainable N sources and promote circularity in tropical agriculture. The following N fertilizers were compared: OMF, conventional urea (U, 45% N), urea coated with NBPT (N(n-butyl) thiophosphoric amide) (U + NBPT; 45.6% N), S-coated urea (U + S; 37% N), and Se-coated urea (U + Se; 45% N).

2. Materials and Methods

2.1. Study Location and Soil Characterization

The N-NH3 volatilization experiment was performed between November and December, 2021, in a greenhouse at the Soil Science Department at Universidade Federal de Lavras, Lavras, Minas Gerais, Brazil (21°13′35″ S, 44°58′43″ W). Temperature (25–32 °C) and humidity conditions were controlled throughout the duration of the experiment. Greenhouse lighting conditions were natural throughout the experiment. The soil samples used as substrate for the N-NH3 loss experiment were collected from the 0–20 cm depth layer from an area under native Cerrado vegetation (Lavras, Minas Gerais, Brazil). According to the Brazilian Soil Taxonomy [16], the soils were classified as typical dystrophic Red Yellow Latosol (LVAd), with medium texture (25% clay), and typical dystrophic Red Latosol (LVd), with very clayey texture (71% clay). Both soils can be classified as a Typic Haplustox according to the USDA NRCS Soil Taxonomy [17].
After sampling, the soils were air-dried, crushed, and passed through a 4-mm sieve. Then, soil samples were homogenized and stored in plastic bags for further physiochemical analyses. Soil chemical characterization (Table 1) was performed on the air-dried fine soil, i.e., in the fraction < 2 mm. Soil pH was measured in a soil: water suspension of 1:2.5 (v/v). Soil organic matter (SOM) was determined by Na2Cr2O7 4 N + H2SO4 10 N oxidation. Exchangeable cations (Ca2+, Mg2+, and Al3+) were extracted using KCl 1 M. Soil P, Na, and K were extracted using the Mehlich-1 solution (0.05 M HCl + 0.0125 M H2SO4) in a 1:10 soil: solution (v/v). Soil sulfate was extracted by a solution of Ca(H2PO4)2H2O 0.01 M and activated carbon, shaking for 5 min followed by 16 h of standing [soil: solution ratio of 1:2.5 (v/v)]. Exchangeable Al was determined by NaOH 0.025 M titration; P and S were determined colorimetrically using a UV/VIS spectrophotometer (B582 model from Micronal, São Paulo, Brazil); K by flame emission photometry (DM-62 model from Digimed, São Paulo, Brazil); and Ca and Mg were determined by atomic absorption spectrometry (AAnalyst 400 model from PerkinElmer, São Paulo, Brazil) [18].
The attributes related to soil fertility (SB, sum of basic cations; t, cation exchange capacity; T, cation exchange capacity at pH 7.0; V, base saturation index; and m, aluminum saturation index) were calculated according to Teixeira et al. [19].
Base saturation was increased to 60% by applying a mixture of Ca and Mg carbonates (p.a.) in a 3:1 molar ratio. Additionally, the soils received basic fertilization, prepared following the fertilization recommendations for pot experiments [20]. A stock solution was prepared using reagent-grade (p.a.) chemicals, including K- and NH4 phosphates, Cu, Fe, Mn, and Zn sulfates, ammonium molybdate [(NH4)6Mo7O24], and boric acid (H3BO3), designed to supply 300 mg dm−3 of P, 200 mg dm−3 of K, 50 mg dm−3 of S, 0.8 mg dm−3 of B, 1.5 mg dm−3 of Cu, 5 mg dm−3 of Fe, 4 mg dm−3 of Mn, 5 mg dm−3 of Zn, and 0.15 mg dm−3 of Mo. Nitrogen was not included in the basic fertilization, as it was provided through the experimental treatments. The stock solution was applied to the dry soil inside plastic bags, which were shaken until the mixture was fully homogenized. Subsequently, approximately 0.5 kg of soil was transferred to pots, which were taken to the greenhouse and maintained until the experiment installation.

2.2. Treatments and N-NH3 Volatilization Experiment

The greenhouse experiment was set up in a 2 × (5 + 1) factorial with 3 replicates (36 experimental units), corresponding to two soils (LVd and LVAd) receiving five N-fertilizers [conventional urea (U, 45% N), urea coated with NBPT (U + NBPT; 45.6% N); urea coated with S (U + S; 37% N), urea coated with Se (U + Se; 45% N), and the organo-mineral fertilizer (OMF) Azoslow 29 (29% N, 50% Azogel®)], besides the unamended control (no fertilizer application), in a completely randomized design. The OMF organic matrix utilizes hydrolyzed collagen derived from by-products of the tannery industry (e.g., hides and skins; [18]). The OMF consists of 18% C, 24% inorganic-N, and 5% organic-N.
Soil moisture in the soil pots was kept at 60% of field capacity before the application of the treatments. Fertilizers were hand-applied homogeneously to the soil surface to provide 2 g N per pot. Ammonia was collected using semi-open collection chambers made from plastic bottles (Figure S1). The bottom of each bottle was removed and put on top of the bottles using galvanized baling wire. Inside each collector, a polyurethane foam soaked into 10 mL of acid solution (H2SO4 1 M) was suspended vertically using a rigid wire. The foam served as a trap to capture the volatilized N-NH3. An 80 mL plastic container was placed at the base of the rigid wire to prevent acid solution leakage and losses (Figure S1). Further details on the construction and assembly of the chambers are described in Araújo et al. [21] and Martins et al. [22]. The chambers were positioned on the soil surface and buried approximately 1 cm into the soil for improved sealing, which allows for consistent N-NH3 collection under controlled conditions [22]. Wooden sticks and rubber bands were used to improve the fixation of the chambers in the soil. Martins et al. [22] showed that the values of N-NH3 trapped by the chamber and the N-NH3 losses measured in the field are linearly correlated (y = 1.66x, R2 = 0.99), indicating that the semi-static chambers are a reliable method for N-NH3 volatilization measurements.
The samples were collected at 1, 2, 4, 8, 11, 15, 18, 23, 29, and 36 days after treatment application. At each collection, the chambers were carefully removed from the soil, the foam was collected and stored in the 80-mL vial, and a new foam soaked in acid solution was placed inside the chamber. Then, the chambers were returned to their respective soil pots, and this procedure was repeated until the end of the evaluation period (36th day). After each collection, the 80 mL vials containing foams soaked in acid solution were taken to the laboratory. The volume was then completed to 50 mL. Aliquots from this extract were transferred to test tubes for distillation by the Kjeldahl method [23], followed by titration with HCl 0.07413 mol L−1 to assess the total N concentration.

2.3. Determination of N-NH3 Losses

The N values obtained in the laboratory were converted into total N-NH3 losses according to the following Equation (1):
N N H 3 = H C l   v o l u m e × 14 × 50 × F × 0.07143 a l i q u o t   v o l u m e
where, N-NH3 is the amount of N-NH3 volatilized (mg); HCl volume is the volume of HCl 0.07413 mol L−1 consumed per sample during titration (mL); 14 is the N molar mass (g mol−1); 50 is the total volume of the H2SO4 solution that collected the N-NH3 in the chamber (mL); F is the correction factor of the acid used in the titration; 0.07413 is the HCl concentration used in the titration (mol L−1); and aliquot volume is the volume of the H2SO4 solution aliquot used in the distillation (mL).
Thus, the daily N-NH3 losses by volatilization (mg) were obtained per fertilizer treatment and converted into percentage based on the N amount applied via fertilizers (2 g N per pot). To determine the cumulative losses, the daily N-NH3 losses from the first and second day of collection were summed; these were added to the losses from the fourth day of collection, and so on, until the last sampling date (36th day) [24]. The N-NH3 values obtained from the semi-static chambers were not calibrated with an external method; as such, it is possible that the measured N-NH3 values were underestimated for all treatments. Nevertheless, the relative differences among treatments remain valid and should not be affected by this limitation.

2.4. Wheat Cultivation and Harvest

In February 2022, wheat (Triticum aestivum L.), cultivar TBIO Aton, was sown in the soil pots that received the N-fertilizers (November–December, 2021). The pots were randomly displaced on a bench in a greenhouse, following the same experimental design described in Section 2.2 [2 × (5 + 1) factorial with 3 replicates]. Initially, each soil pot received five wheat seeds. Fifteen days after sowing, wheat seedlings were thinned, leaving only three wheat plants per pot.
In the same week, wheat was newly sown in the LVd soil pots. For these soils, seed emergence and seedling growth was initially disrupted due to the formation of a clayey surface crust. As such, the soil surface was gently tilled using a steel trowel to improve soil structure, thus allowing for proper seed germination and radicle development. After 15 days, wheat seedlings were thinned in the LVd soils, leaving only three wheat plants per pot. Daily irrigations kept soil moisture at 60% of field capacity. After 35 days of seedling emergence in the LVd soils, wheat plants were harvested using a garden scissor and split into below- and above-ground biomass [i.e., root and shoot (tillers and leaves)].
Wheat leaves and tillers were triple-washed (distilled water, HCl 10% v/v solution, then distilled water), stored in paper bags, and oven-dried at 65 °C until constant weight (after ±72 h). Then, the dried material was weighed, and a subsample was finely ground in an electric crusher for total N analysis.

2.5. Total N Concentration in Wheat Plants

The total N concentration in shoot dry matter was determined by Kjeldahl distillation [23], followed by titration with HCl 0.07143 mol L−1. The HCl volume consumed during the titration was recorded for each sample and converted into total N concentration according to the Equation (2):
T o t a l   N = 0.07143 × 14 × H C l   v o l u m e m × 1000
where, N is the total N concentration in shoot dry matter (g kg−1); 0.07413 is the concentration of HCl used in the titration (mol L−1); 14 is the N molar mass (g mol−1); HCl volume is the volume of HCl 0.07143 mol L−1 consumed per sample during the titration (mL); and m is the mass of the wheat shoot subsample (mg).

2.6. Statistical Analyses

Statistical analyses were performed in the R software v. 4.2.2 [25] using the emmeans package. The assumptions of residue normality and homogeneity of variance were verified by the Shapiro-Wilk and Levene tests (p > 0.05), respectively. Analysis of variance was used to assess the effect of N-fertilizers on daily N-NH3 volatilization, cumulative N-NH3 losses, shoot dry mass, and total N concentration in wheat plants. When significant effects were identified, treatments were compared using the Tukey HSD test (p < 0.05). In addition, linear regressions were performed between N-NH3 losses, wheat shoot dry mass and N concentration to assess potential relationships between N-NH3 volatilization and plant productivity and nutrition as affected by N-fertilizers.

3. Results

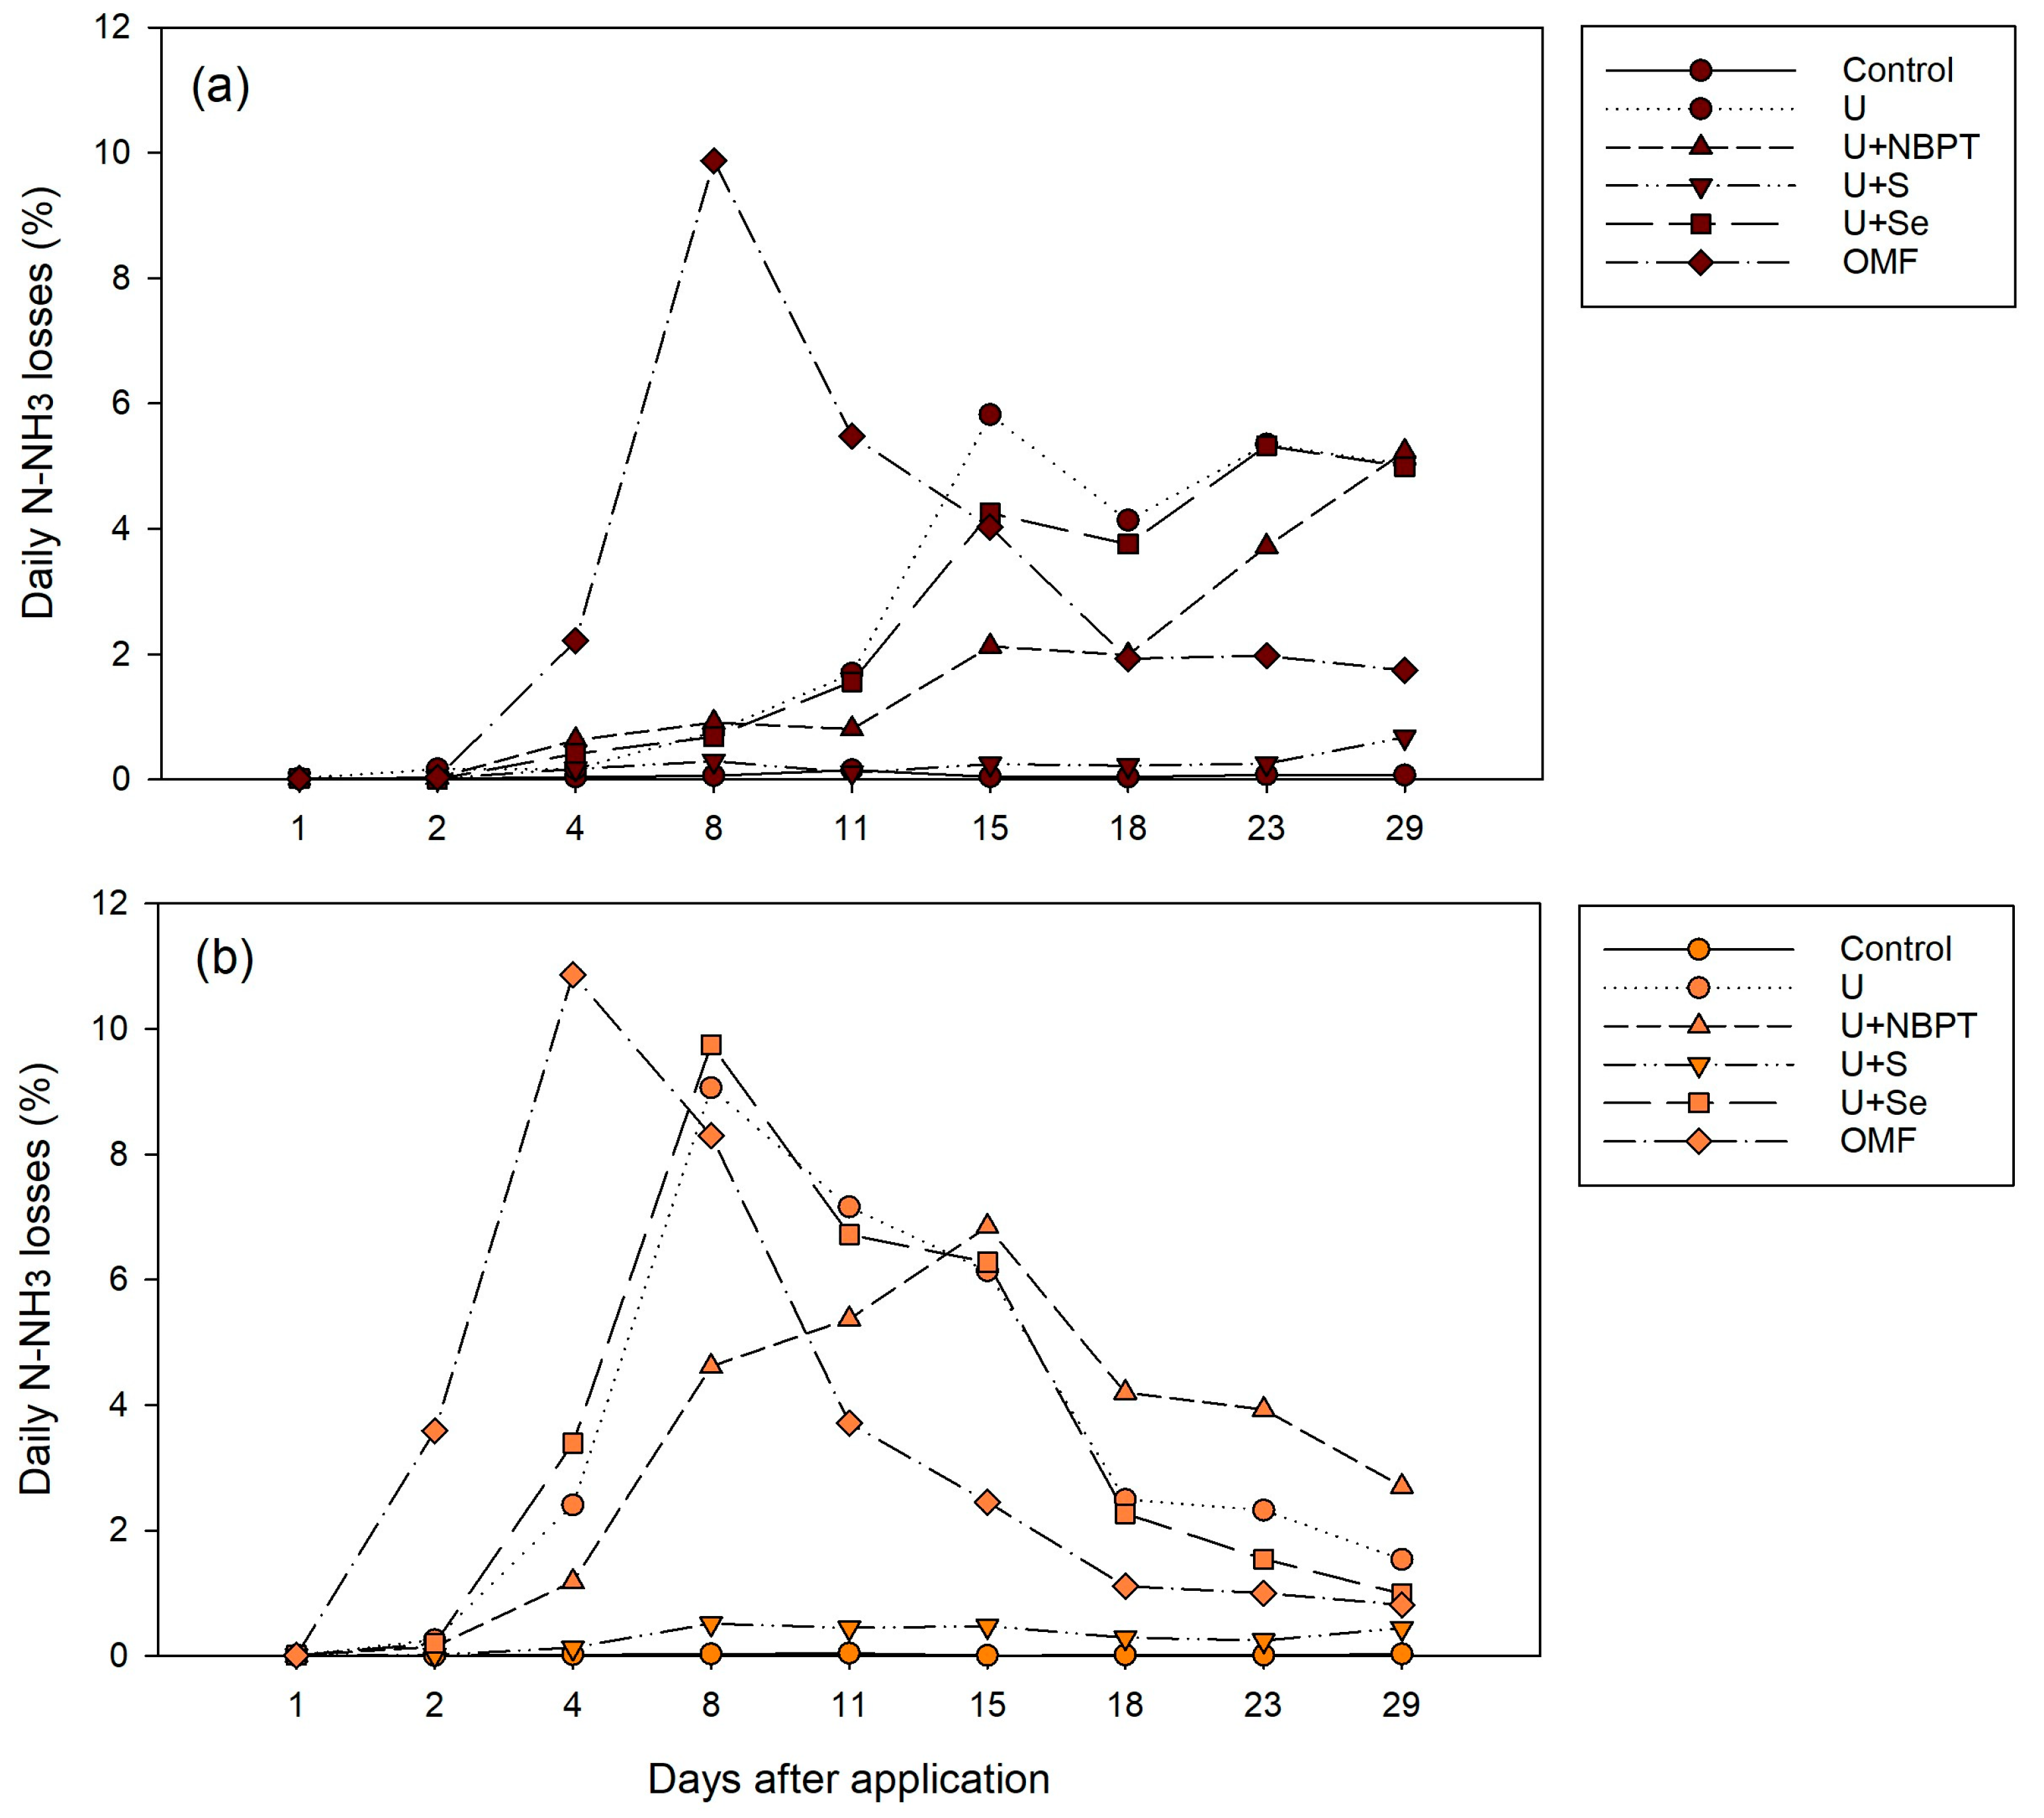
3.1. Daily N-NH3 Losses by Volatilization

Daily N-NH3 losses remained mostly similar in the first two days of evaluation (Figure 1a; Table S1). On day 4, the OMF had a 2.22% N-NH3 loss, higher than the other treatments, and on day 8, it showed a volatilization peak (9.87%; Figure 1a). On day 11, the OMF daily N-NH3 emission reduced to 4.57%, remaining higher than the losses from the other treatments. On day 15, N-NH3 loss of conventional urea (5.82%) exceeded those of OMF, which then had losses of less than 2% until the end of the experiment. From day 15 onwards, conventional urea and U + Se had the highest daily N-NH3 losses, reaching approximately 5% on days 23 and 29 after application of the treatments (Figure 1a; Table S1). U + NBPT had increasing daily losses after 18 days of evaluation, peaking at 5.24% on day 29 but not differing from conventional urea and U + Se. In general, U + S had the lowest daily N-NH3 losses in the LVd soil, differing from the control only on the last day of evaluation (Table S1; p < 0.05).
As for the LVAd soil, peaks of N-NH3 losses started 4 days after treatment application (Figure 1b). On day 2, OMF had the highest N-NH3 loss among N-fertilizers (3.59%; Table S2), and on day 4, it showed a volatilization peak of 10.87%. On day 8, the U and U + Se treatments had peaks of N-NH3 losses of 9%, surpassing the OMF N-NH3 loss, which had a sharp reduction in N-NH3 losses after 8 days (Figure 1b). Between days 8 and 15, U and U + Se had the highest N-NH3 losses. The peak daily loss of U + NBPT occurred on day 15, not differing from N-NH3 losses of conventional urea and U + Se (p > 0.05; Table S2). Then, U + NBPT remained as the treatment with highest N-NH3 losses (1.24–4.2%). Similar to the LVd soil, U + S had the lowest N-NH3 losses throughout the experiment, differing from the control only on the last day of evaluation.

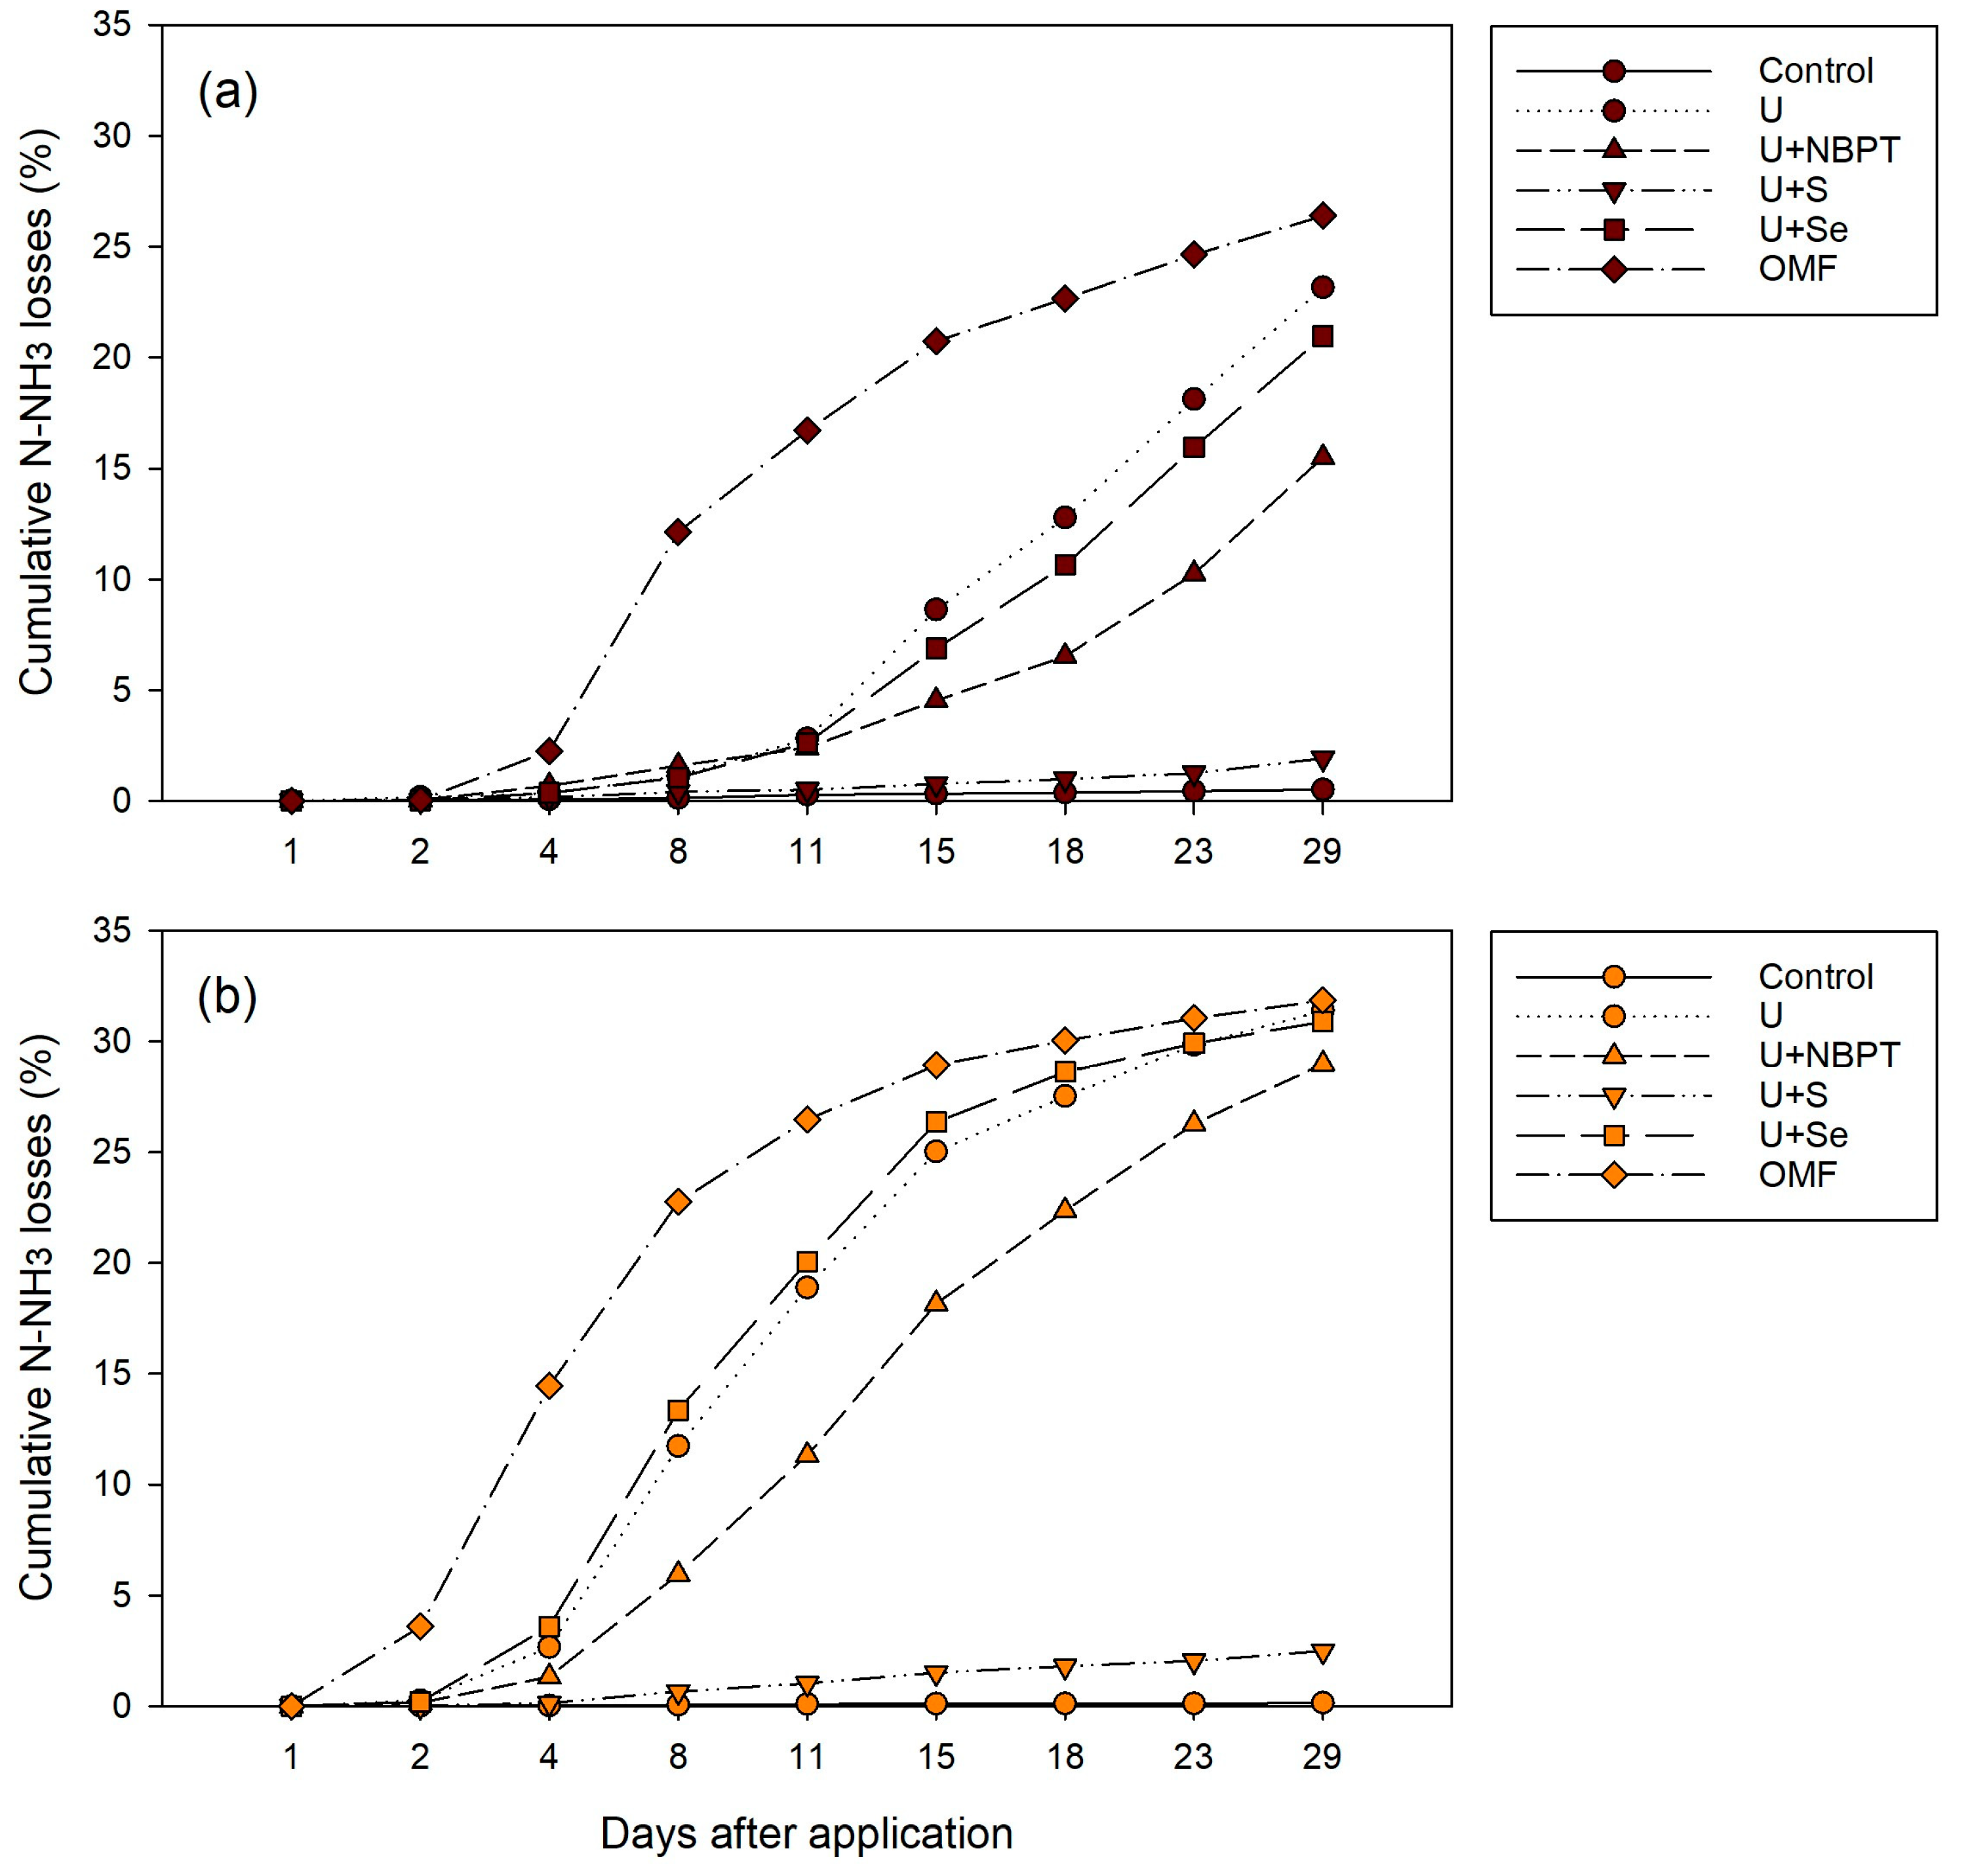
3.2. Cumulative N-NH3 Losses as Affected by N-Fertilizers

Due to the increased daily N-NH3 emissions, OMF had the highest cumulative N-NH3 losses in the LVd soil from day 4 to the end of the experiment (Figure 2a; Table S3), reaching a cumulative N-NH3 loss of 27.31%. Conventional urea also had increased N-NH3 losses, reaching 26.26% at the end of the evaluation period, not differing from OMF (Table S3). Urea coated with S had the lowest cumulative losses at the end of the experiment (2.52%), being similar to the control.
As for LVAd, OMF had the highest cumulative N-NH3 losses from day 2 until day 15 (Figure 2b; Table S4). On day 18, U + Se reached a cumulative N-NH3 loss of 28.62%, not differing from OMF (30.04%; p > 0.05). After 23 days, the cumulative N-NH3 losses from OMF, U, and U + Se reached similar values (nearly 30%). On day 36, U + NBPT reached a cumulative N-NH3 loss of 30.23%, not differing from OMF, U, and U + Se. Again, U + S was the treatment with the lowest accumulated losses, differing from the control only on the last day of the experiment.
In general, cumulative N-NH3 losses were greater in the LVAd than in LVd (Figure 3). At the end of the experiment (36th day), conventional urea, OMF, U + Se, and U + NBPT applied to LVAd had the highest cumulative N-NH3 losses, and the U + NBPT losses in the LVAd soil (30.23%) did not differ from OMF N-NH3 losses in LVd (26.26%; p > 0.05). Regardless of soil type, U + S application resulted in the lowest cumulative N-NH3.

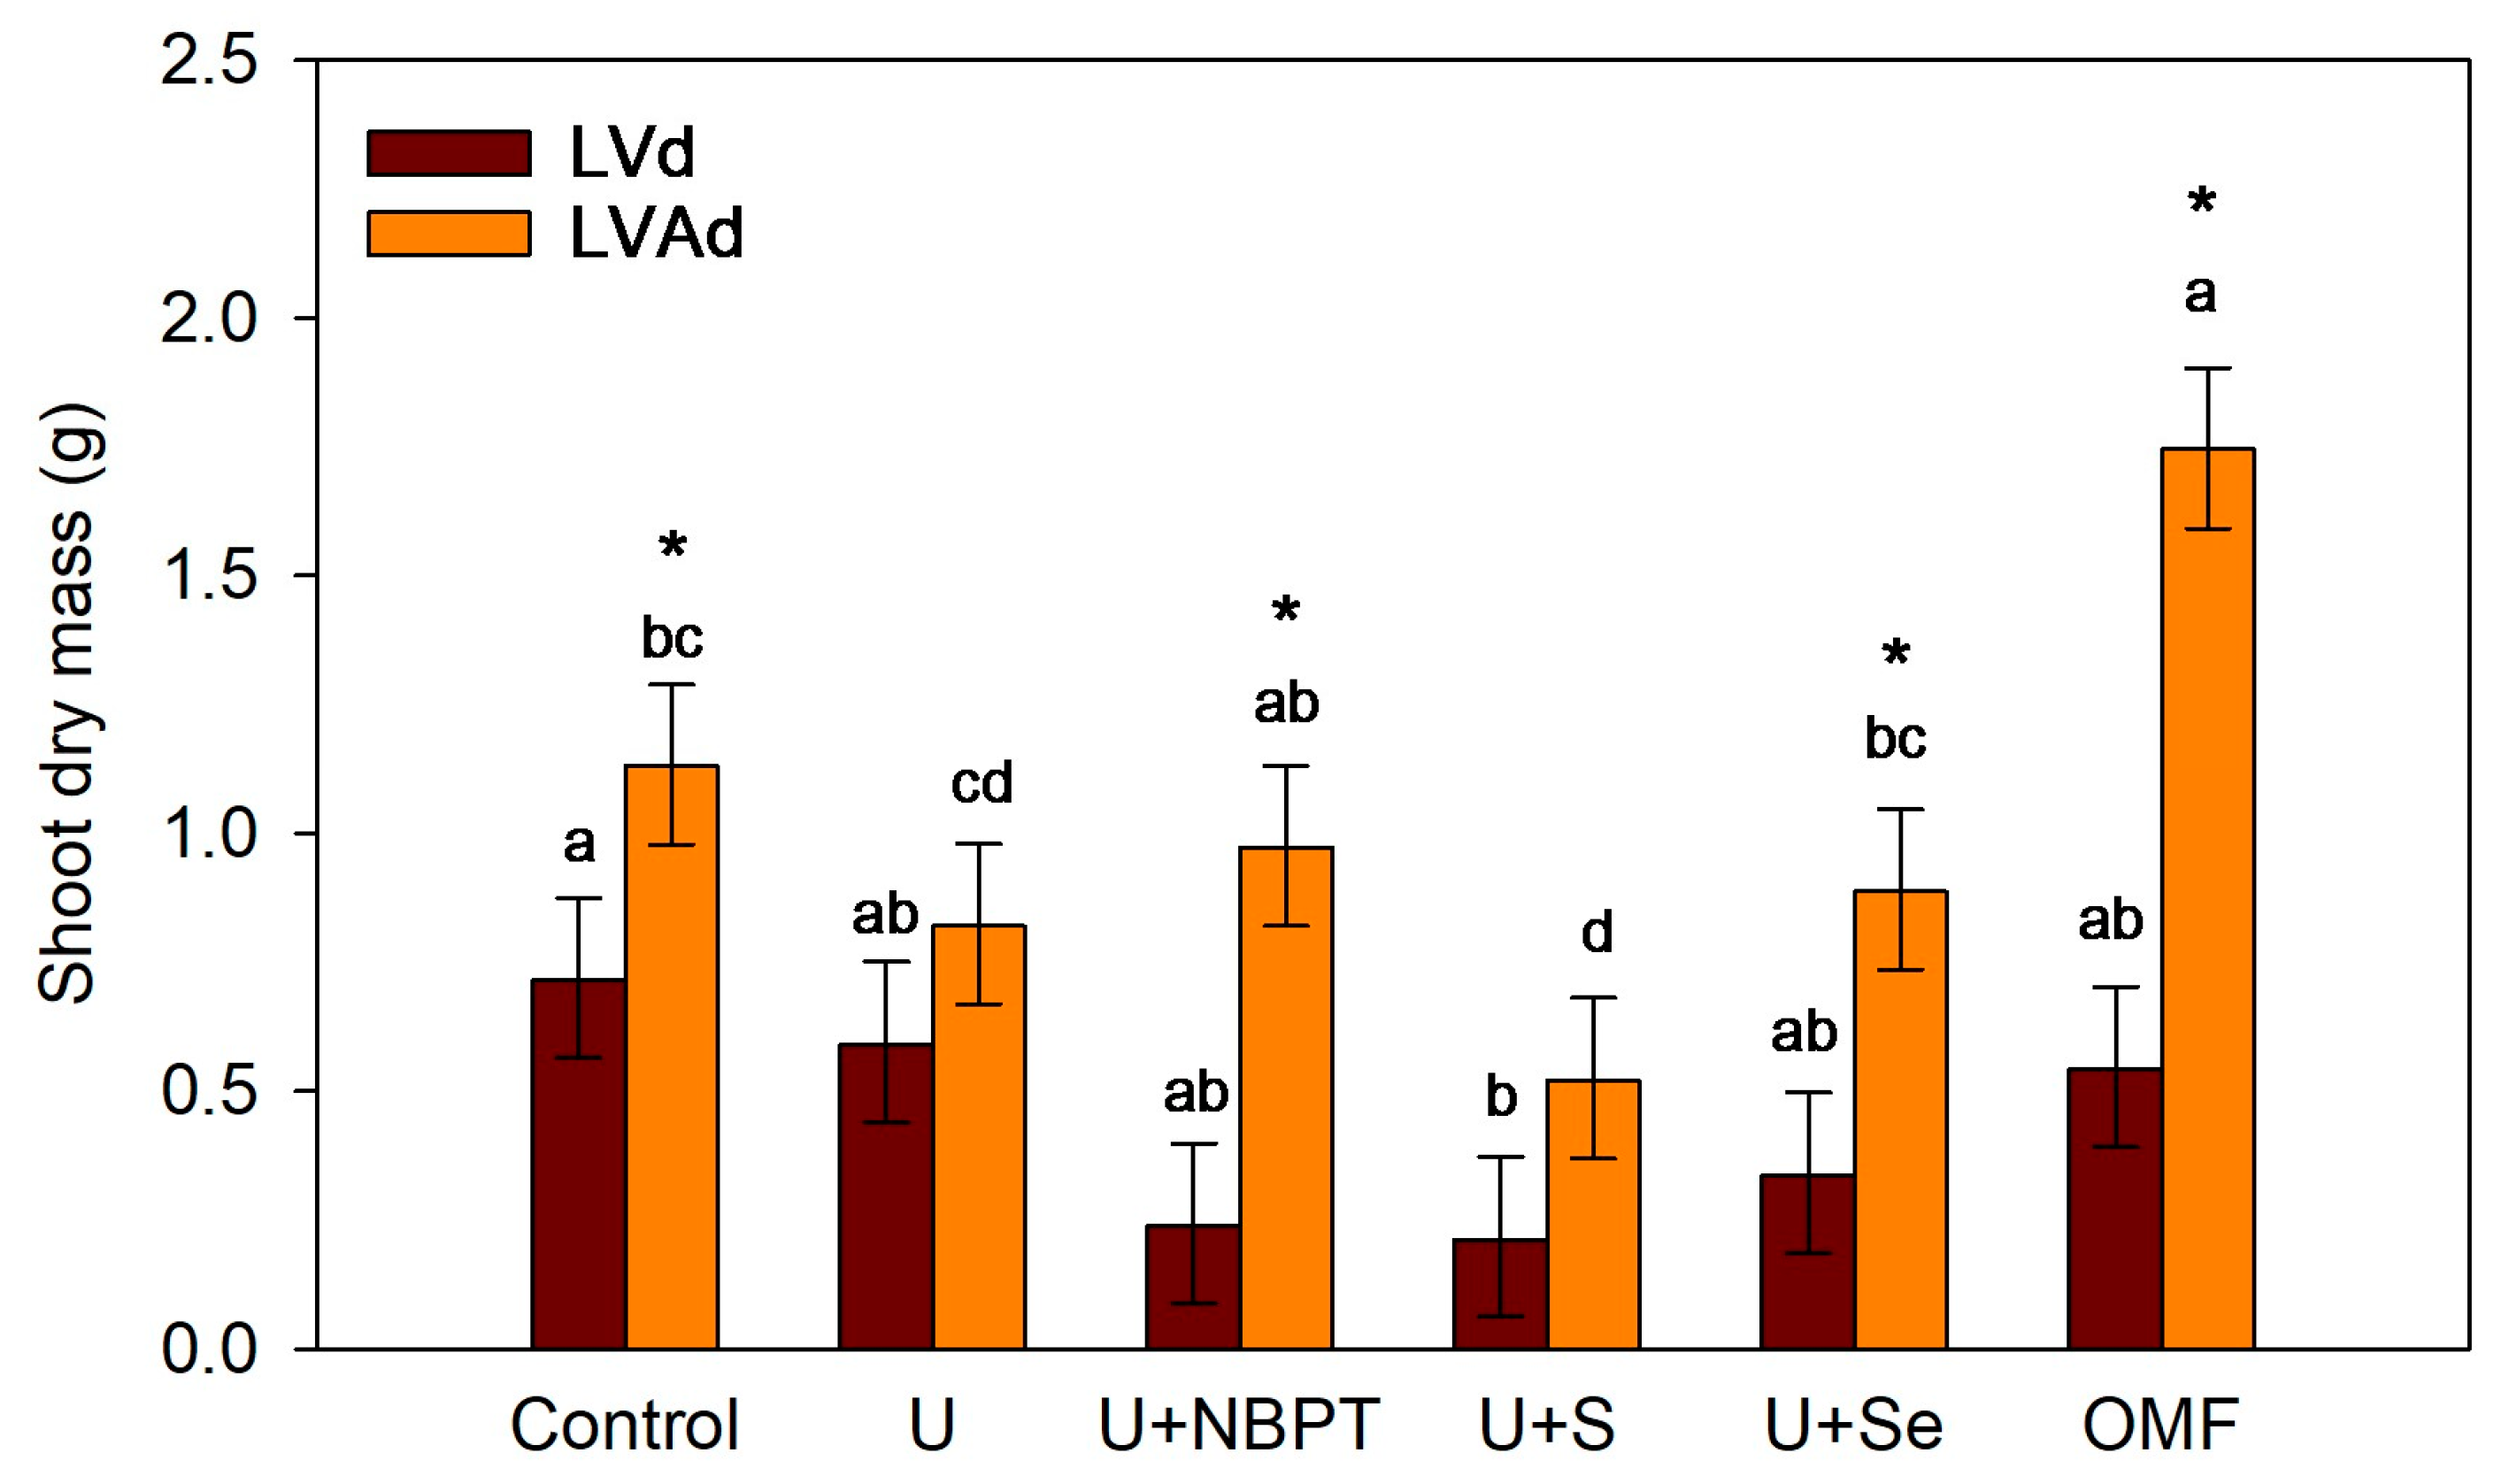
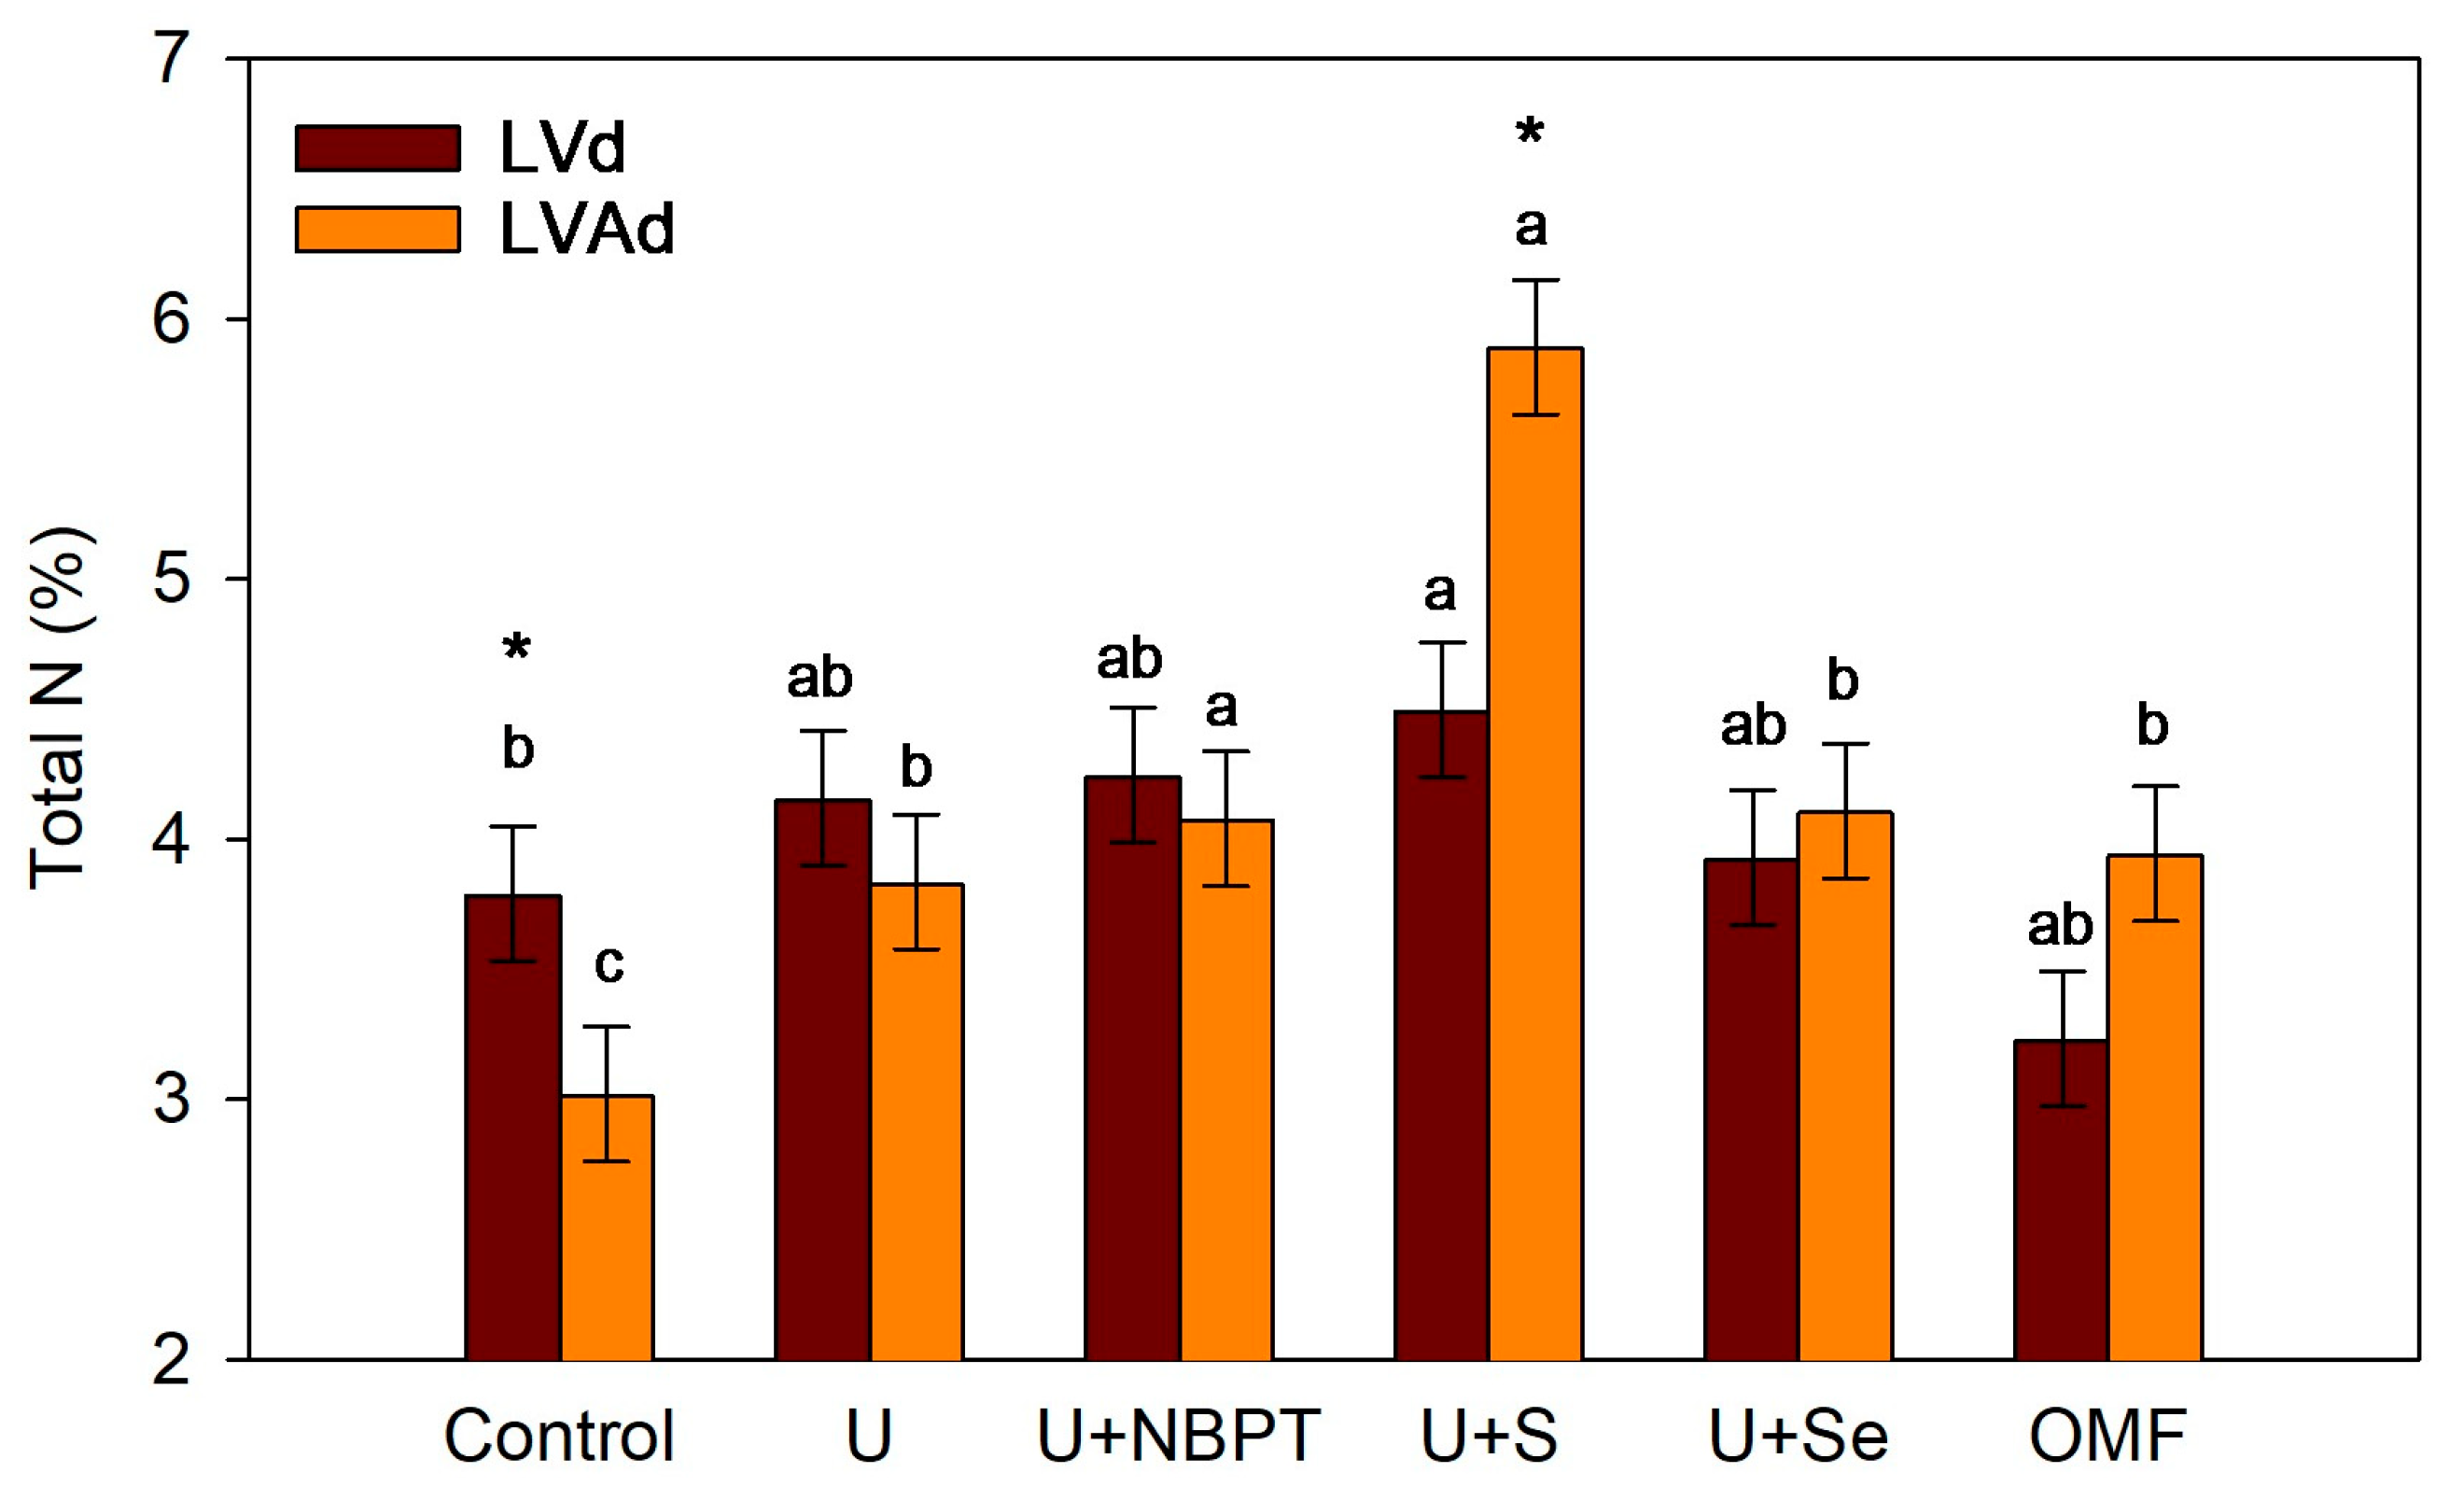
3.3. Shoot Drymass and N Concentration in Wheat

An interactive effect of soil type × N-fertilizers was observed for shoot dry mass of wheat plants (p < 0.05). In the LVd soil, wheat plants had lower shoot dry mass than those grown in the LVAd, except for the U and U + S treatments (Figure 4). Shoot dry mass ranged from 0.22 to 0.72 g for LVd, while in LVAd, the mean values ranged from 0.35 to 1.75 g (Figure 4). The lower dry mass observed in LVd was likely a consequence of the delayed seedling emergence caused by crusting in this clayey soil (71% clay content).
In LVd, the highest mean dry mass value was observed for the control treatment (0.72 g), while the lowest value was obtained for the U + S treatment (0.22 g). As for LVAd, OMF led to the highest shoot dry mass (1.75 g), although not differing from U + NBPT (1.34 g; p > 0.05). The application of OMF to LVAd soils increased shoot dry mass by 54% relative to the control, being 2-times higher than conventional urea and U + Se, and 4-times higher than U + S (Figure 4; Figure S2). U + S had the lowest shoot dry mass value for LVAd, with plants being notably smaller than the other treatments (Figure S3).
The soil type × N-fertilizers interactive effect was also significant for the total N concentration (p < 0.05; Figure 5). In general, the mean total N concentration did not differ between plants grown in LVd and LVAd soils, except for the control treatment and for plants that received U + S (Figure 5). In the control treatment, the mean total N concentration in plants grown in LVd (3.8%) was higher than in LVAd (3.0%). In the U + S treatment, the mean total N concentration in plants grown in LVAd (5.9%) was higher than in LVd (4.5%). In both soils, the mean total N concentration in plants that received the U + S treatment was higher than in the control treatment, and the other treatments showed intermediate values. Specifically, the application of OMF increased shoot N concentration in wheat plants by nearly 30% compared to the control in the LVAd soil, not differing from other N sources (p > 0.05).
As a result of increased biomass production, OMF had the highest total N removal across treatments (Table 2; p < 0.05), although not differing from U + Se in the LVAd. In general, total N removal was greater for LVAd soil than LVd across N sources (Table 2). In the LVd, total N removal was mostly similar among treatments (9.7–24.8 mg), with U + NBPT and U + S showing 1–2-times lower N uptake than OMF (p < 0.05). Similarly, in the LVAd soil, OMF increased N removal by 2-times compared to the control, conventional urea, and U + NBPT, and nearly 3-times relative to the U + S treatment.

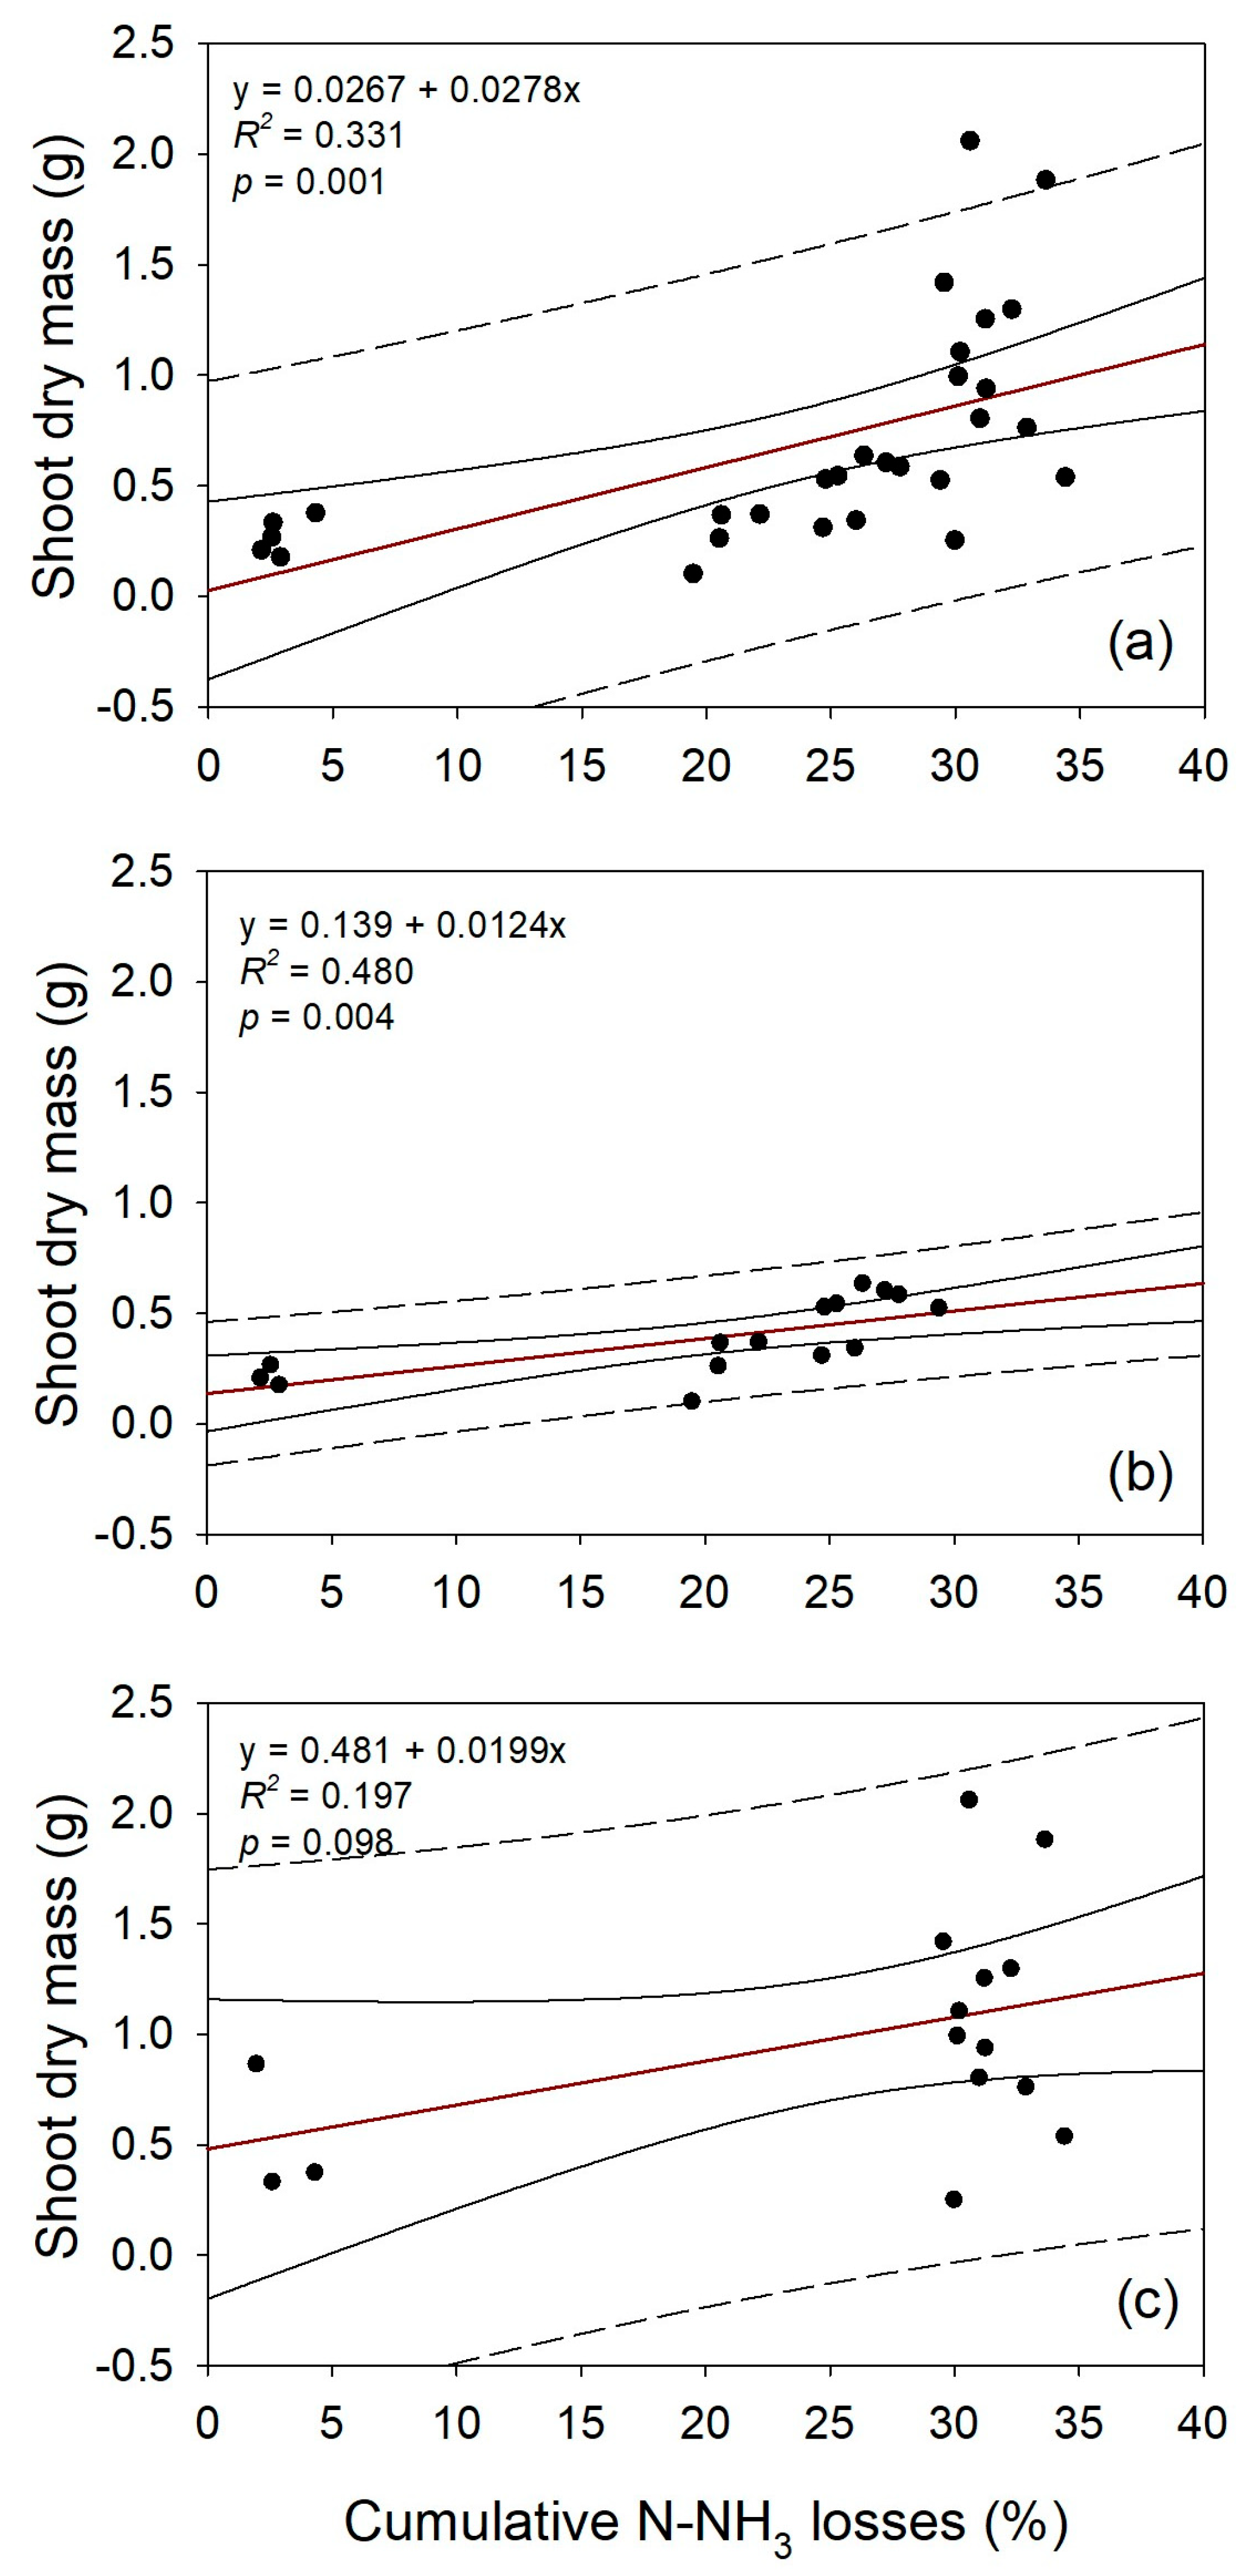
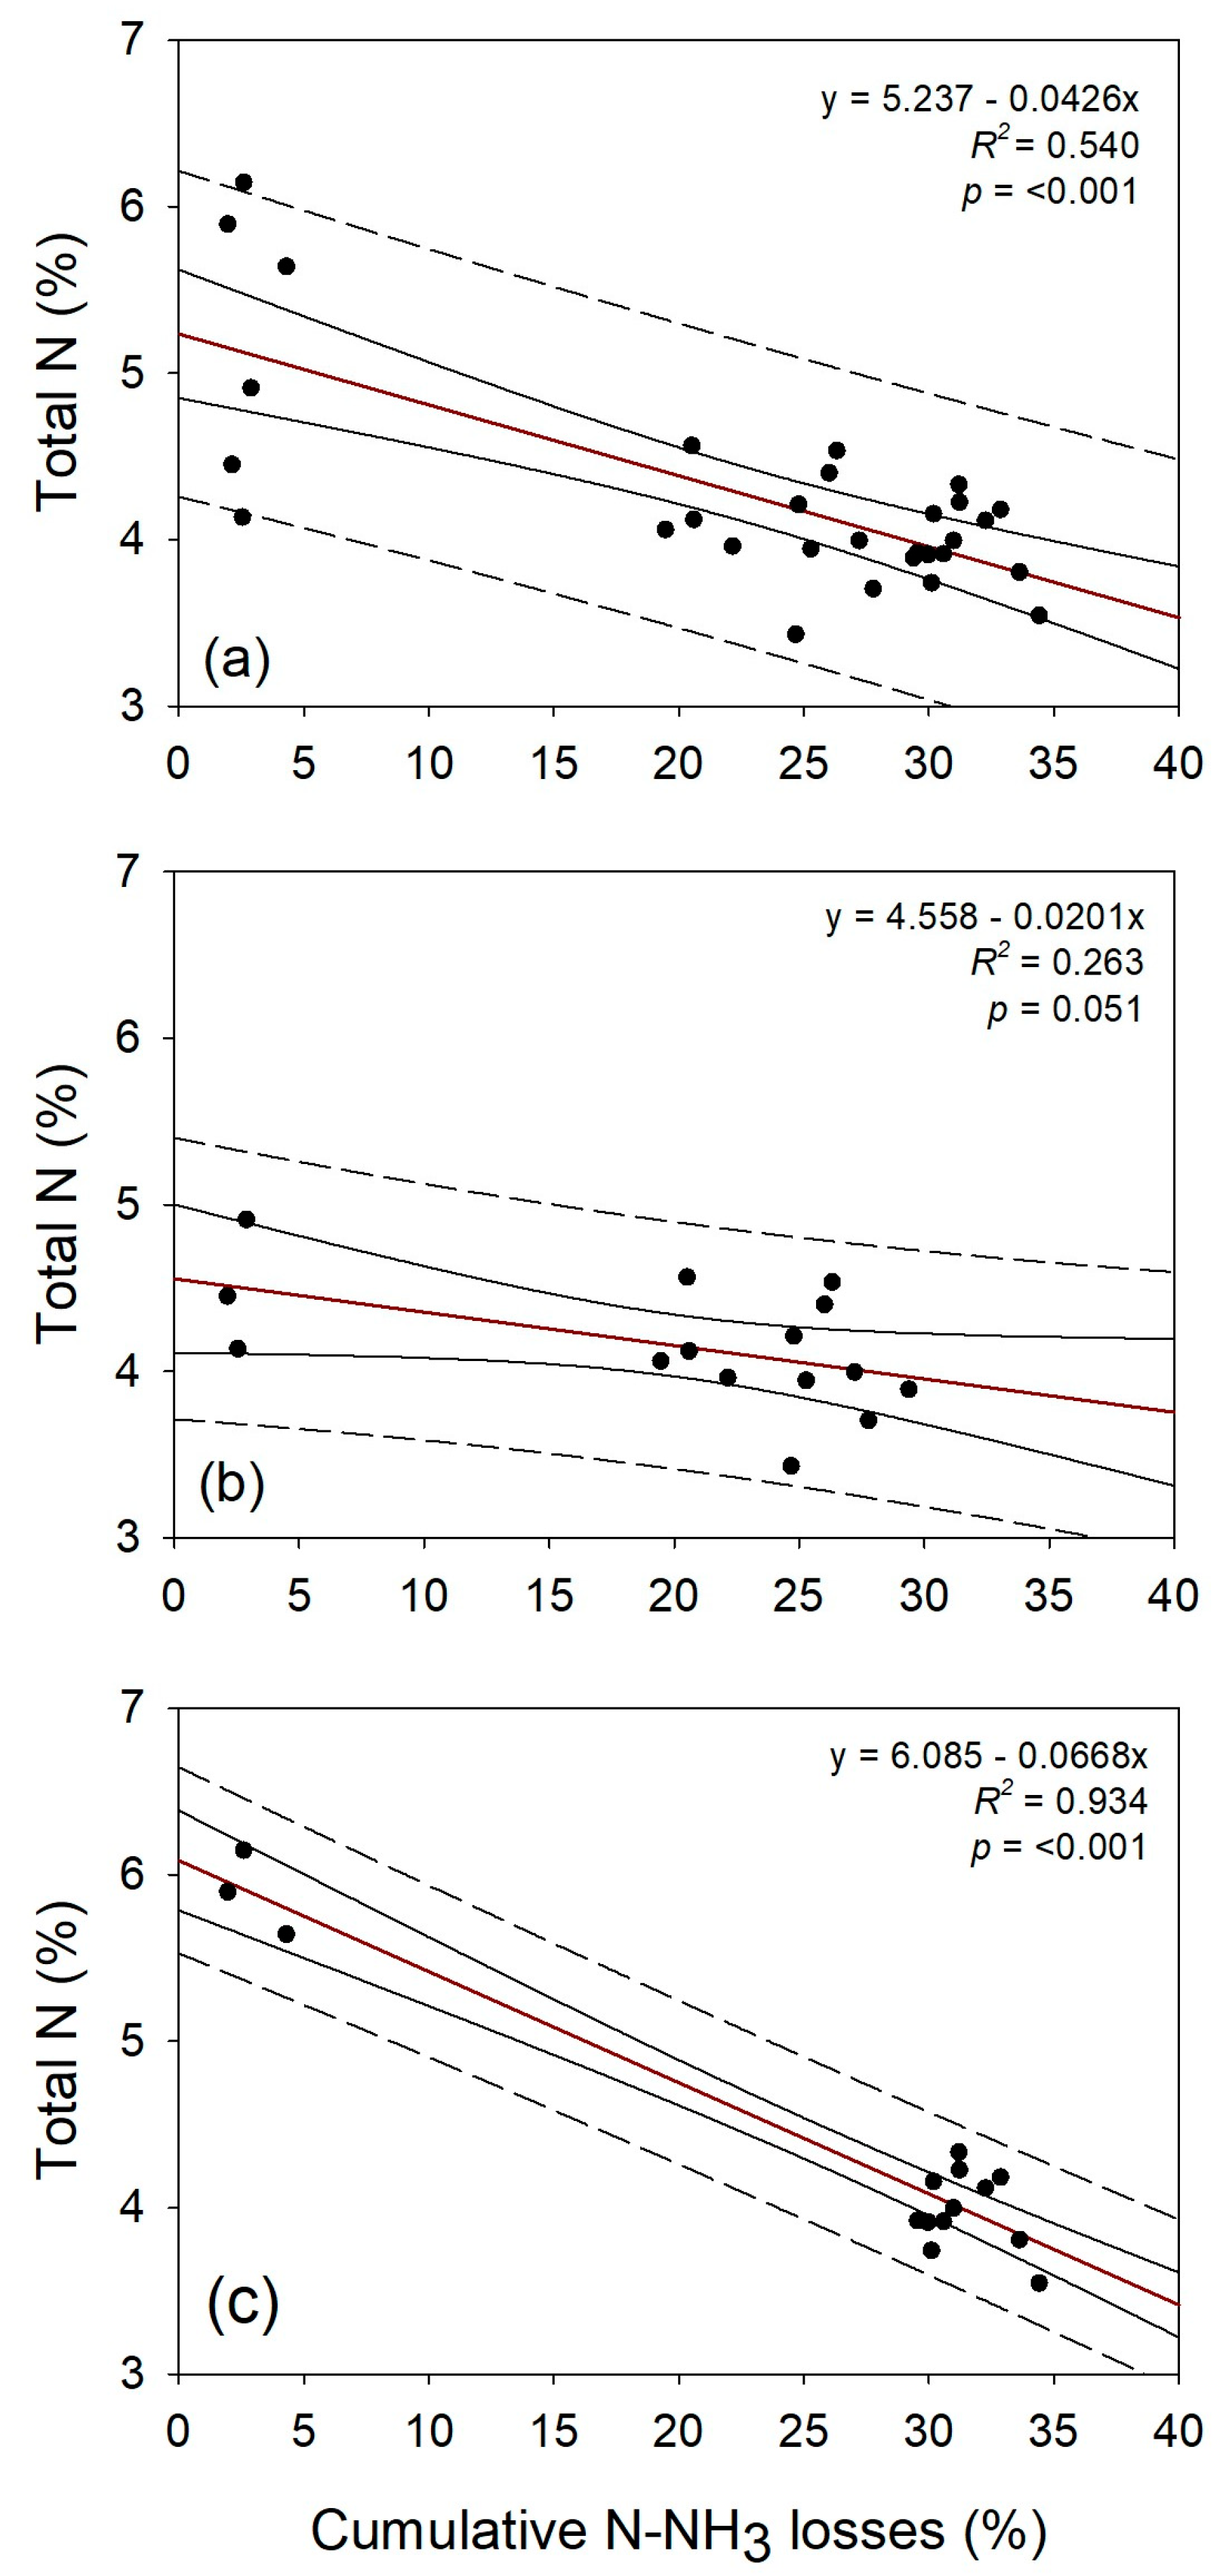
3.4. Relationship Between N-NH3 Losses, Aboveground Biomass, and N Concentration

The shoot dry mass of wheat plants increased with increasing cumulative N-NH3 losses (Figure 6a), when analyzing data from both soils and excluding the losses from the control treatment (no fertilizer). This becomes more evident when the N-NH3 losses are analyzed separately by soils (Figure 6b), with improved coefficients of determination (R2) of 0.48for LVd. This trend is reflective of the greater cumulative N-NH3 losses in the treatments that received the application of OMF and U + NBPT, which also provided a greater shoot dry mass for wheat plants grown in LVAd (Figure 4).
In contrast, the mean total N concentration in the shoots of wheat plants decreased with increasing cumulative N-NH3 losses (Figure 7). This reduction was observed in the models that included data on N-NH3 losses and mean total N concentration collected in both soils (Figure 7a), and in the models that included data collected separately in the LVd and LVAd soils (Figure 7b and Figure 7c, respectively). The LVd regression model had a low R2 (0.26), possibly due to the low variability of the mean total N concentrations in this soil. The LVAd regression model presented an R2 of 0.94, indicating an excellent fit of the model. This fit was probably influenced by the high mean total N concentration in the plants that received U + S application, which also showed the lowest cumulative N-NH3 losses (2.5% in LVd and 2.9% in LVAd, on average) after 35 days of application.

4. Discussion

Since humidity and temperature in the greenhouse were controlled throughout the experiment, N losses by ammonia (NH3) volatilization were due to fertilizer and soil properties. In general, the highest peaks of N-NH3 losses from OMF application (9.87 and 10.87% in LVd and LVAd, respectively) may be related to the organic matrix in its composition. Adding an organic component in soils with low organic matter concentrations (<0.2%) may have stimulated soil urease activity [26]. During hydrolysis, the urea in the OMF decomposes into CO2 and NH3, which is then lost through volatilization [27]. Urease activity is highly correlated with organic C [26], which comprises 18% of the OMF used in the present study. Management practices that enhance organic matter levels in soils (e.g., no-till, manure inputs, organo-mineral fertilization) can favor urease activity by providing C as a nutrient source, further enhancing overall microbial activity and N-NH3 losses [28]. The highest volatilization peaks on the first days of evaluation (day 8 and day 4 in LVd and LVAd, respectively) contributed to the highest cumulative N-NH3 losses from OMF compared to the other treatments. These volatilization peaks were critical for the cumulative OMF N-NH3 losses after 36 days, corresponding to nearly 35% of the accumulated losses during the evaluation period. Other aspects of the OMF formulation may have affected N-NH3 losses, including the larger particle-size compared to the other fertilizers, or the presence of organic N (5%).
The N-NH3 losses from the other N sources are comparable to those observed in other studies under controlled conditions, highlighting the use of semi-static chambers as a reliable method for N-NH3 volatilization measurements. Cumulative N-NH3 losses after conventional urea application in a clayey Oxisol reached 26%, with an 8% loss peak after 4 days [29]. In that study, the SOM concentration was much higher (2.4%) than the soils used in the present study, which may have favored greater urease activity and enhanced N-NH3 loss peaks after 4 days. Here, the N-NH3 volatilization peak for urea was 9% and occurred 8 days after application of the treatments in the LVAd. Faria et al. [30] observed a peak N-NH3 loss of 16% after surface application of conventional urea on the second day of evaluation, and a cumulative loss of 50% after 27 days. However, in that study, the authors used a sandy soil (80% sand) and covered the surface with organic residues of palisade grass [Urochloa brizantha (Hochst. ex A.Rich.) R.Webster]. The addition of organic residues prevents fertilizer incorporation into the soil and provides C as a nutrient source, thus enhancing urease activity [26] and N-NH3 losses from N-amide sources, such as conventional urea.
Urease activity inhibitors, such as NBPT or Se, can reduce N-NH3 losses by volatilization in conventional urea [9,30]. However, this was not the case for the present study. In general, N-NH3 losses for U + Se followed a similar trend to those from conventional urea, with no differences in terms of cumulative N-NH3 losses. In the study conducted by Faria et al. [30], daily N-NH3 losses for the U + Se treatment reached 8% after 2 days, with a cumulative loss of 39% at the end of the evaluation period. Here, a peak loss of 9.75% was observed on the 8th day after the application of U + Se in LVAd. This relative delay in the N-NH3 loss peak was probably due to the lower SOM concentration and lack of organic residues in the soil used in the current study, which may have contributed to maintaining a low urease activity in the soil in the first week of evaluation.
Urea + NBPT delayed the N-NH3 volatilization peak for LVd, which occurred only 29 days after application of the treatments, resulting in lower cumulative N-NH3 losses (20.19%) compared to conventional urea (26.26%) at the end of the experiment. Delays in the peaks of N-NH3 losses are beneficial, as they allow for enhanced N use at the initial stages of crop development. This positive impact, however, was lesser for LVAd, which showed a N-NH3 volatilization peak 15 days after U + NBPT application. Moreover, cumulative N-NH3 losses from U + NBPT equaled those of conventional urea at the end of the experiment (Figure 3). Some authors report that the NBPT efficiency as a urease inhibitor can vary between 3 and 14 days, and after this period NBPT loses its inhibitory effect [31], which could explain the reduced efficiency of U + NBPT in the LVAd soil.
Among all treatments, U + S stood out as the one with the lowest N-NH3 losses. These findings agree with those obtained by Sousa et al. [29], who demonstrated cumulative N-NH3 losses of 0.4% 16 days after application of U + S. Fertilizers containing water-soluble polymers, such as U + S, gradually release the N-amide contained inside the granules, substantially reducing N losses through NH3 volatilization. Thus, the N-NH3 losses from urea coated with S are related to the coating’s dissolution rate. With gradual release, the hydrolysis of urea and the subsequent accumulation of NH4+ and NH3 on the soil are reduced [32]. It has been demonstrated that even under high temperature (32 °C) and low soil moisture, the urea coated with S substantially minimized N losses [32].
Our findings indicate that N-NH3 losses do not reduce biomass production in wheat plants under the investigated conditions (i.e., tropical soils and until 36 days). Similar results were observed by Cancellier et al. [11]. The authors demonstrated that different technologies for N-fertilizers, including urea coated with S and polymers, reduced N-NH3 losses by 37% compared to conventional urea, but did not increase productivity or N concentration in corn (Zea mays L.) plants, which was attributed to soils having increased organic matter levels and N supply, thus preventing a significant impact from the N-fertilizers. Here, the increased dry mass production and N removal observed in the OMF treatment may be attributed to other beneficial properties of this product, not directly measured in this study, such as increased soil nutrient availability, increased soil organic matter content, and greater soil biological activity [5,33]. The lower loss of N-NH3 from the U + S treatment had no effect on the increase in biomass. The benefits of S-coated urea can influence biomass and productivity in S deficient soils. Shivay et al. (2019) [34] demonstrated that sulfur-coated urea increased rice productivity by up to 25% and improved N use efficiency.
Another potential explanation for the increased biomass after OMF applications includes the N release timing from the fertilizer, which may have better synchronized with plant uptake dynamics, thus leading to greater biomass and N removal. Root dry mass for OMF (0.56 ± 0.08 g) was 2–3 times greater than U + NBPT (0.28 ± 0.08 g), U + S (0.19 ± 0.08 g), and U + Se (0.26 ± 0.08 g), not differing from the control (0.69 ± 0.08 g) or conventional urea (0.39 ± 0.08 g; p = 0.007) when averaged across soils. As such, enhanced root development may have contributed to greater nutrient uptake and above-ground wheat biomass. It is worth mentioning that the biomass results reported in the current study reflect a pot experiment under greenhouse conditions. Pot experiments can limit root development as well as plant growth and nutrient uptake, and results may be different under field conditions.
Other studies have shown lower N-NH3 losses followed by and/or associated with greater N accumulation in the plant and, therefore, higher N use efficiency. Santos et al. [35] evaluated N-NH3 losses and the nutritional status of corn plants that received N-fertilizers and showed a trend of reduced foliar N concentration with increased net N-NH3 volatilization. In a meta-analysis, Abalos et al. [36] showed that nitrification and urease inhibitors increased N use efficiency by 12.9%, but this effect varied according to soil and environmental factors. Some authors, however, found no correlation between lower N-NH3 losses after the application of N-fertilizer technologies and increased N concentration in the plant [11,13,14]. Instead, the increase in N concentration in corn leaves and grains seems to be better correlated with the increase in N rates applied to the soil, underscoring the relevance of best nutrient management practices for enhanced agronomic efficiency and environmental quality [37].

5. Conclusions

This study assessed the impacts of various N-fertilizers on ammonia (NH3) losses, wheat biomass production, and N uptake. The cumulative N-NH3 losses by volatilization resulting from OMF application did not differ from conventional urea and the U + NBPT and U + Se treatments. These higher losses after OMF application are probably linked to the presence of an organic matrix, which may have enhanced urease activity in the soil. Lower N-NH3 losses following the application of N-fertilizers do not increase dry mass production, but can lead to increases in foliar N concentration in wheat. The U + S treatment, which had the lowest N-NH3 losses, had the lowest dry mass production and the highest total N concentration. On the other hand, the OMF treatment, which had cumulative N-NH3 losses comparable to those of conventional urea, U + NBPT, and U + Se, promoted the highest dry mass production when applied in LVAd, not differing from the U + NBPT treatment. In addition, OMF increased the total N concentration in wheat plants compared to the control treatment, showing promise as a sustainable N-fertilizer for highly weathered soils and under the experimental conditions investigated. While these results are encouraging, it should be noted that the effectiveness of OMF may vary depending on soil type, climate, and management practices. Nevertheless, the use of OMF may represent an interesting alternative N- source for wheat production, potentially reducing operational costs and promoting circularity in agricultural systems.

Supplementary Materials

The following Supporting Information can be downloaded at https://www.mdpi.com/article/10.3390/biosphere1010004/s1. Figure S1: Semi-open collection chambers used in the NH3 volatilization experiment. Design based on Araújo et al. [22]. Table S1: Daily N-NH3 losses (%) after the application of N-fertilizers in a typical dystrophic Red Latosol (LVd). Table S2: Daily N-NH3 losses (%) after the application of N-fertilizers in a typical dystrophic Red Yellow Latosol (LVAd). Table S3: Cumulative N-NH3 losses (%) over 36 days after the application of N-fertilizers in a typical dystrophic Red Latosol (LVd). Table S4: Cumulative N-NH3 losses (%) over 36 days after the application of different N-fertilizers in a typical dystrophic Red Yellow Latosol (LVAd). Figure S2: Wheat plants (Triticum aestivum L. cultivar TBIO Aton) grown in a typical dystrophic Red Latosol (LVd; a) and in a typical dystrophic Red Yellow Latosol (LVAd; b) 35 days after seedling emergence. Pots 1–6: Control treatment. Pots 27–32: OMF treatment. Figure S3: Wheat plants (Triticum aestivum L. cultivar TBIO Aton) grown in a typical dystrophic Red Latosol (LVd; a) and in a typical dystrophic Red Yellow Latosol (LVAd; b) 35 days after seedling emergence. Pots 1–6: Control treatment (no fertilizer). Pots 21–26: U + S treatment.

Author Contributions

Conceptualization, H.C.S.A. and L.R.G.G.; methodology, H.C.S.A., M.H.D., R.M.C.C., G.A.Z.V.O. and R.F.R.C.; validation, H.C.S.A., F.R.D.d.L., M.H.D., R.M.C.C., G.A.Z.V.O., R.F.R.C. and L.R.G.G.; formal analysis, H.C.S.A.; investigation, H.C.S.A., F.R.D.d.L. and L.R.G.G.; resources, L.R.G.G.; data curation, H.C.S.A.; writing—original draft preparation, H.C.S.A.; writing—review and editing, H.C.S.A., F.R.D.d.L. and L.R.G.G.; visualization, H.C.S.A.; supervision, L.R.G.G.; project administration, L.R.G.G.; funding acquisition, L.R.G.G. All authors have read and agreed to the published version of the manuscript.

Funding

This research was funded by grants from the Minas Gerais State Research Foundation (FAPEMIG RDP-00001-20), National Council for Scientific and Technological Development (CNPq), and Coordination for the Improvement of Higher Education Personnel (CAPES).

Institutional Review Board Statement

Not applicable.

Informed Consent Statement

Not applicable.

Data Availability Statement

The datasets generated and/or analyzed during the current study are available from the corresponding author upon reasonable request.

Acknowledgments

The authors would like to thank the funding agencies Minas Gerais State Research Foundation (FAPEMIG), National Council for Scientific and Technological Development (CNPq), and Coordination for the Improvement of Higher Education Personnel (CAPES) for the financial support of this study and the scholarships provided. Also, the authors thank the National Institute of Science and Technology on Soil and Food Security (CNPq Grant #406577/2022-6) and ILSA Brazil Fertilizers.

Conflicts of Interest

The authors declare no conflicts of interest.

References

  1. FAO—Food and Agriculture Organization of the United Nations. The Future of Food and Agriculture—Alternative Pathways to 2050, 1st ed.; FAO: Rome, Italy, 2018; Available online: https://openknowledge.fao.org/handle/20.500.14283/i8429en (accessed on 26 March 2025).
  2. United Nations. The 17 Goals; United Nations: New York, NY, USA, 2025; Available online: https://www.un.org/sustainabledevelopment/sustainable-development-goals/ (accessed on 26 March 2025).
  3. Velenturf, A.P.M.; Purnell, P. Principles for a sustainable circular economy. Sustain. Prod. Consum. 2021, 27, 1437–1457. [Google Scholar] [CrossRef]
  4. Lima, D.Q.; Oliveira, L.C.A.; Bastos, A.R.R.; Carvalho, G.S.; Marques, J.J.G.S.M.; Carvalho, J.G.; De Souza, G.A. Leather industry solid waste as nitrogen source for growth of common bean plants. Appl. Environ. Soil Sci. 2010, 2010, 703842. [Google Scholar] [CrossRef]
  5. Coelho, L.C.; Ferreira, M.M.; Bastos, A.R.R.; Oliveira, L.C.A.D.; Ferreira, E.D. Resíduo de curtumes como fonte de nitrogênio para trigo e arroz em sucessão. Rev. Bras. Ciênc. Solo 2015, 39, 1445–1455. [Google Scholar] [CrossRef]
  6. Majee, S.; Halder, G.; Mandal, D.D.; Tiwari, O.N.; Mandal, T. Transforming wet blue leather and potato peel into an eco-friendly bio-organic NPK fertilizer for intensifying crop productivity and retrieving value-added recyclable chromium salts. J. Hazard. Mater. 2021, 411, 125046. [Google Scholar] [CrossRef] [PubMed]
  7. Menegat, S.; Ledo, A.; Tirado, R. Greenhouse gas emissions from global production and use of nitrogen synthetic fertilisers in agriculture. Sci. Rep. 2022, 12, 14490. [Google Scholar] [CrossRef]
  8. Tasca, F.A.; Ernani, P.R.; Rogeri, D.A.; Gatiboni, L.C.; Cassol, P.C. Volatilização de amônia do solo após a aplicação de ureia convencional ou com inibidor de urease. Rev. Bras. Ciênc. Solo 2011, 35, 493–509. [Google Scholar] [CrossRef]
  9. Santos, C.F.; Aragão, O.O.S.; Silva, D.R.G.; Jesus, E.C.; Chagas, W.F.T.; Correia, P.S.; Moreira, F.M.S. Environmentally friendly urea produced from the association of N-(n-butyl) thiophosphoric triamide with biodegradable polymer coating obtained from a soybean processing byproduct. J. Clean. Prod. 2020, 276, 123014. [Google Scholar] [CrossRef]
  10. Santos, C.F.; Nunes, A.P.P.; Aragão, O.O.S.; Guelfi, D.; Souza, A.A.; Abreu, L.B.; Lima, A.D.C. Dual functional coatings for urea to reduce ammonia volatilization and improve nutrients use efficiency in a Brazilian corn crop system. J. Soil Sci. Plant Nutr. 2021, 21, 1591–1609. [Google Scholar] [CrossRef]
  11. Cancellier, E.L.; Silva, D.R.G.; Faquin, V.; Gonçalves, B.A.; Cancellier, L.L.; Spehar, C.R. Ammonia volatilization from enhanced-efficiency urea on no-till maize in Brazilian cerrado with improved soil fertility. Ciênc. Agrotec. 2016, 40, 133–144. [Google Scholar] [CrossRef]
  12. Pereira, H.S.; Leão, A.F.; Verginassi, A.; Carneiro, M.A.C. Ammonia volatilization of urea in the out-of-season corn. Rev. Bras. Ciênc. Solo 2009, 33, 1685–1694. [Google Scholar] [CrossRef]
  13. Prando, A.M.; Zucareli, C.; Fronza, V.; Bassoi, M.C.; Oliveira, F.Á. Formas de ureia e doses de nitrogênio em cobertura no desempenho agronômico de genótipos de trigo. Semin. Agrar. 2012, 33, 621–632. [Google Scholar] [CrossRef]
  14. Zavaschi, E.; Faria, L.A.; Vitti, G.C.; Nascimento, C.A.C.; Moura, T.A.; Vale, D.W.; Mendes, F.L.; Kamogawa, M.Y. Ammonia volatilization and yield components after application of polymer-coated urea to maize. Rev. Bras. Ciênc. Solo 2014, 38, 1200–1206. [Google Scholar] [CrossRef]
  15. Cantarella, H.; Otto, R.; Soares, J.R.; Silva, A.G.B. Agronomic efficiency of NBPT as a urease inhibitor: A review. J. Adv. Res. 2018, 13, 19–27. [Google Scholar] [CrossRef] [PubMed]
  16. Santos, H.G.; Jacomine, P.K.T.; Anjos, L.H.C.; Oliveira, V.A.; Lumbreras, J.F.; Coelho, M.R.; Almeida, J.A.; Araújo Filho, J.C.; Oliveira, J.B.; Cunha, T.J.F. Sistema Brasileiro de Classificação de Solos, 5th ed.; Embrapa Solos: Rio de Janeiro, Brazil, 2018. [Google Scholar]
  17. Soil Survey Staff. Keys to Soil Taxonomy, 13th ed.; USDA-Natural Resources Conservation Service (NRCS): Washington, DC, USA, 2022.
  18. Lima, F.R.D.D.; Silva, A.O.; Amorim, H.C.S.; Figueredo, E.S.S.; Carneiro, R.M.C.; Jara, M.S.; Carneiro, M.A.C.; Guilherme, L.R.G. Agronomic and environmental aspects of organo-mineral fertilizers produced with a by-product of the intermediate process of tanning. Front. Agron. 2023, 5, 1215448. [Google Scholar] [CrossRef]
  19. Teixeira, P.C.; Donagemma, G.K.; Fontana, A.; Teixeira, W.G. (Eds.) Manual de Métodos de Análise de Solo, 3rd ed.; Embrapa: Brasília, Brazil, 2017; Available online: http://www.infoteca.cnptia.embrapa.br/infoteca/handle/doc/1085209 (accessed on 26 March 2025).
  20. Malavolta, E. Elementos da Nutrição Mineral de Plantas; Agronômica Ceres: Piracicaba, Brazil, 1980. [Google Scholar]
  21. Araújo, E.D.S.; Marsola, T.; Miyazawa, M.; Soares, L.H.B.; Urquiaga, S.; Boddey, R.M.; Alves, B.J.R. Calibration of a semi-opened static chamber for the quantification of volatilized ammonia from soil. Pesqui. Agropecu. Bras. 2009, 44, 769–776. [Google Scholar] [CrossRef]
  22. Martins, M.R.; Sarkis, L.F.; Sant’Anna, S.A.C.; Santos, C.A.; Araujo, K.E.; Santos, R.C.; Araújo, E.S.; Alves, B.J.R.; Jantalia, C.P.; Boddey, R.M.; et al. Optimizing the use of open chambers to measure ammonia volatilization in field plots amended with urea. Pedosphere 2021, 31, 243–254. [Google Scholar] [CrossRef]
  23. Bremner, J.M. Determination of nitrogen in soil by the Kjeldahl method. J. Agric. Sci. 1960, 55, 11–33. [Google Scholar] [CrossRef]
  24. Fonseca, A.B.; Santos, C.; Nunes, A.P.P.; Oliveira, D.P.; Melo, M.E.A.; Takayama, T.; Mansur, B.L.; Fernandes, T.J.; Alexandrino, G.C.; Dias, M.A.N.; et al. Urease inhibitors technologies as strategy to mitigate agricultural ammonia emissions and enhance the use efficiency of urea-based fertilizers. Sci. Rep. 2023, 13, 22739. [Google Scholar] [CrossRef]
  25. R Core Team. R: A Language and Environment for Statistical Computing; R Foundation for Statistical Computing: Vienna, Austria, 2022. [Google Scholar]
  26. Zantua, M.I.; Dumenil, L.C.; Bremner, J.M. Relationships between soil urease activity and other soil properties. Soil Sci. Soc. Am. J. 1977, 41, 350–352. [Google Scholar] [CrossRef]
  27. Tabatabai, M.A.; Bremner, J.M. Assay of urease activity in soils. Soil Biol. Biochem. 1972, 4, 479–487. [Google Scholar] [CrossRef]
  28. Roscoe, R.; Vasconcellos, C.A.; Furtini Neto, A.E.; Guedes, G.A.A.; Fernandes, L.A. Urease activity and its relation to soil organic matter, microbial biomass nitrogen and urea-nitrogen assimilation by maize in a Brazilian Oxisol under no-tillage and tillage systems. Biol. Fertil. Soils 2000, 32, 52–59. [Google Scholar] [CrossRef]
  29. Sousa, R.D.M.; Cantarella, H.; Soares, J.R.; Abreu, F.D.; Moraes, J.G.D. Volatilização de NH3 de ureia recoberta por polímero não hidrossolúvel aplicada na superfície do solo. In Proceedings of the Congresso Brasileiro de Ciência do Solo, Florianópolis, SC, Brazil, 28 July–2 August 2013; Volume 1, pp. 1–4. [Google Scholar]
  30. Faria, L.; Karp, F.H.S.; Machado, M.C.; Abdalla, A.L. Ammonia volatilization losses from urea coated with copper, boron, and selenium. Semin. Ciênc. Agrar. 2020, 41, 1415–1420. [Google Scholar] [CrossRef]
  31. Cantarella, H.; Trivelin, P.C.O.; Contin, T.L.M.; Dias, F.L.F.; Rossetto, R.; Marcelino, R.; Coimbra, R.B.; Quaggio, J.A. Ammonia volatilisation from urease inhibitor-treated urea applied to sugarcane trash blankets. Sci. Agric. 2008, 65, 397–401. [Google Scholar] [CrossRef]
  32. Prasad, M. Gaseous Loss of Ammonia from Sulfur-Coated Urea, Ammonium Sulfate, and Urea Applied to Calcareous Soil (pH 7.3). Soil Sci. Soc. Am. J. 1976, 40, 131–134. [Google Scholar] [CrossRef]
  33. Oliveira-Longatti, S.M.; Cannata, M.G.; Costa Ferrazani, T.S.C.C.C.; Guilherme, L.R.G. Agronomic and environmental implications of using a by-product of the intermediate process. Sci. Agric. 2017, 74, 250–257. [Google Scholar] [CrossRef]
  34. Shivay, Y.S.; Pooniya, V.; Pal, M.; Ghasal, P.C.; Bana, R.; Jat, S.L. Coated Urea Materials for Improving Yields, Profitability, and Nutrient Use Efficiencies of Aromatic Rice. Glob. Chall. 2019, 3, 1900013. [Google Scholar] [CrossRef]
  35. Santos, W.M.; Alves, B.J.R.; Urquiaga, S.; Pacheco, E.P.; Barros, I.; Fernandes, M.F.; Batista, J.N.; Bender, E.P.; Souza, H.N.; Jantalia, C.P. Ammonia volatilization and yield of corn fertilized with different nitrogen sources in the Brazilian semiarid. Pesqui. Agropecu. Bras. 2020, 55, e01036. [Google Scholar] [CrossRef]
  36. Abalos, D.; Jeffery, S.; Sanz-Cobena, A.; Guardia, G.; Vallejo, A. Meta-analysis of the effect of urease and nitrification inhibitors on crop productivity and nitrogen use efficiency. Agric. Ecosyst. Environ. 2014, 189, 136–144. [Google Scholar] [CrossRef]
  37. Amorim, H.C.S.; Ashworth, A.J.; Arsi, K.; Rojas, M.G.; Morales-Ramos, J.A.; Donoghue, A.; Robinson, K. Insect frass composition and potential use as an organic fertilizer in circular economies. J. Econ. Entomol. 2024, 117, 1261–1268. [Google Scholar] [CrossRef]
Figure 1. Daily N-NH3 losses (% of N applied) after the application of N-fertilizers: control (without fertilizer application); conventional urea (U; 45% N); NBPT-coated urea (U + NBPT; 45% N); S-coated urea (U + S; 37% N); Se-coated urea (U + Se; 45% N), and the organo-mineral fertilizer (OMF; 29% N) in a typical dystrophic Red Latosol (LVd) (a) and typical dystrophic Red Yellow Latosol (LVAd) (b).
Biosphere 01 00004 g001
Figure 2. Cumulative N-NH3 losses (% of N applied) over 36 days after the application of N-fertilizers: Control (without fertilizer application); conventional urea (U; 45% N); NBPT-coated urea (U + NBPT; 45% N); S-coated urea (U + S; 37% N); Se-coated urea (U + Se; 45% N); and the organo-mineral fertilizer (OMF; 29% N) in a typical dystrophic Red Latosol (LVd) (a) and a typical dystrophic Red Yellow Latosol (LVAd) (b).
Biosphere 01 00004 g002
Figure 3. Cumulative N-NH3 losses (% of N applied) 36 days after the application of N-fertilizers: Control (without fertilizer application); conventional urea (U; 45% N); NBPT-coated urea (U + NBPT; 45% N); S-coated urea (U + S; 37% N); Se-coated urea (U + Se; 45% N); and the organo-mineral fertilizer (OMF; 29% N) in a typical dystrophic Red Latosol (LVd) and a typical dystrophic Red Yellow Latosol (LVAd). Means followed by the same letter do not differ by the Tukey test (p > 0.05).
Biosphere 01 00004 g003
Figure 4. Shoot dry mass of wheat plants grown in typical dystrophic Red Latosol (LVd) and a typical dystrophic Red Yellow Latosol (LVAd) receiving the N-fertilizers: Control (without fertilizer application); conventional urea (U; 45% N); NBPT-coated urea (U + NBPT; 45% N); S-coated urea (U + S; 37% N); Se-coated urea (U + Se; 45% N); and the organo-mineral fertilizer (OMF; 29% N). Means followed by the same letter within a soil do not differ by the Tukey test (p > 0.05). Asterisks indicate difference (p < 0.05) between soil types within the same treatment.
Biosphere 01 00004 g004
Figure 5. Total N concentration in shoot of wheat plants grown in a typical dystrophic Red Latosol (LVd) and a typical dystrophic Red Yellow Latosol (LVAd) receiving the N-fertilizers: Control (without fertilizer application); conventional urea (U; 45% N); NBPT-coated urea (U + NBPT; 45% N); S-coated urea (U + S; 37% N); Se-coated urea (U + Se; 45% N); and the organo-mineral fertilizer (OMF; 29% N). Means followed by the same letter within a soil do not differ by the Tukey test (p > 0.05). Asterisks indicate difference (p < 0.05) between soil types within the same treatment.
Biosphere 01 00004 g005
Figure 6. Regression models of cumulative N-NH3 losses over 36 days and shoot dry mass of wheat plants grown in a typical dystrophic Red Latosol (LVd) and a typical dystrophic Red Yellow Latosol (LVAd) receiving N-fertilizers. The models include N-NH3 losses and shoot dry mass data of both soils (a), the LVd (b), and the LVAd (c), excluding the control treatment data. The regression line is shown in red. Solid black and dashed lines correspond to the 95% confidence and prediction intervals, respectively.
Biosphere 01 00004 g006
Figure 7. Regression models of cumulative N-NH3 losses over 36 days and total N concentration in shoot of wheat plants grown in a typical dystrophic Red Latosol (LVd) and a typical dystrophic Red Yellow Latosol (LVAd) receiving N-fertilizers. The models include N-NH3 losses and total N concentration data of both soils (a), the LVd (b), and the LVAd (c), excluding the control treatment data. The regression line is shown in red. Solid black and dashed lines correspond to the 95% confidence and prediction intervals, respectively.
Biosphere 01 00004 g007
Table 1. Chemical characterization of the typical dystrophic Red Yellow Latosol (LVAd) and typical dystrophic Red Latosol (LVd) soils used in the N-NH3 losses experiment.
Soil †Chemical Characterization ‡
pHSOMPKCaMgS
1:2.5 (H2O)%mg dm−3
LVd5.85<0.22.5119.810.46<0.115.27
LVAd4.81<0.23.1552.680.14<0.12.70
SBtTVmAlH + Al
cmolc dm−3%cmolc dm−3
LVd0.610.711.1951.000<0.10.58
LVAd0.370.472.3516.000<0.11.98
† LVd, typical dystrophic Red Latosol (LVd); LVAd, typical dystrophic Red Yellow Latosol; ‡ SOM, soil organic matter; SB, sum of basic cations; t, cation exchange capacity; T, cation exchange capacity at pH 7.0; V, base saturation (%); m, Al saturation (%).
Table 2. Total N removal (mg), calculated as total N concentration (%) × shoot dry mass (g), from wheat plants grown in a typical dystrophic Red Latosol (LVd) and a typical dystrophic Red Yellow Latosol (LVAd) receiving the N-fertilizers: Control (without fertilizer application); conventional urea (U; 45% N); NBPT-coated urea (U + NBPT; 45% N); S-coated urea (U + S; 37% N); Se-coated urea (U + Se; 45% N); and the organo-mineral fertilizer (OMF; 29% N).
TreatmentsSoils
LVdLVAd
Control27.0 ± 5.7 b †32.2 ± 5.7 b
U24.8 ± 5.7 bc32.0 ± 5.7 b
U + NBPT10.4 ± 5.7 d39.9 ± 5.7 b
U + S9.7 ± 5.7 d20.8 ± 7.1 bc
U + Se13.5 ± 5.7 cd36.7 ± 5.7 ab
OMF21.5 ± 5.7 bc68.6 ± 5.7 a
† Means followed by the same letter do not differ by the Tukey test (p > 0.05).
Disclaimer/Publisher’s Note: The statements, opinions and data contained in all publications are solely those of the individual author(s) and contributor(s) and not of MDPI and/or the editor(s). MDPI and/or the editor(s) disclaim responsibility for any injury to people or property resulting from any ideas, methods, instructions or products referred to in the content.

