Article

TV-LSTM: Multimodal Deep Learning for Predicting the Progression of Late Age-Related Macular Degeneration Using Longitudinal Fundus Images and Genetic Data

by
Jipeng Zhang
1,†,
Chongyue Zhao
2,†,
Lang Zeng
1,
Heng Huang
3,
Ying Ding
1 and
Wei Chen
1,2,4,*
1
Department of Biostatistics and Health Data Science, School of Public Health, University of Pittsburgh, Pittsburgh, PA 15261, USA
2
Division of Pulmonary Medicine, Department of Pediatrics, UPMC Children’s Hospital of Pittsburgh, University of Pittsburgh, Pittsburgh, PA 15224, USA
3
Department of Computer Science, University of Maryland, College Park, MD 20742, USA
4
Department of Human Genetics, School of Public Health, University of Pittsburgh, Pittsburgh, PA 15261, USA
*
Author to whom correspondence should be addressed.
These authors contributed equally to this work.
AI Sens. 2025, 1(1), 6; https://doi.org/10.3390/aisens1010006
Submission received: 8 April 2025 / Revised: 11 June 2025 / Accepted: 23 July 2025 / Published: 4 August 2025

Abstract

Age-related macular degeneration (AMD) is the leading cause of blindness in developed countries. Predicting its progression is crucial for preventing late-stage AMD, as it is an irreversible retinal disease. Both genetic factors and retinal images are instrumental in diagnosing and predicting AMD progression. Previous studies have explored automated diagnosis using single fundus images and genetic variants, but they often fail to utilize the valuable longitudinal data from multiple visits. Longitudinal retinal images offer a dynamic view of disease progression, yet standard Long Short-Term Memory (LSTM) models assume consistent time intervals between training and testing, limiting their effectiveness in real-world settings. To address this limitation, we propose time-varied Long Short-Term Memory (TV-LSTM), which accommodates irregular time intervals in longitudinal data. Our innovative approach enables the integration of both longitudinal fundus images and AMD-associated genetic variants for more precise progression prediction. Our TV-LSTM model achieved an AUC-ROC of 0.9479 and an AUC-PR of 0.8591 for predicting late AMD within two years, using data from four visits with varying time intervals.

1. Introduction

Age-related macular degeneration (AMD) is a spectrum of retinal diseases that pose the threat of irreversible vision loss in older adults, especially among Caucasians [1]. In late AMD, which includes advanced forms of geographic atrophy (also known as dry AMD) and/or neovascular types (wet AMD), there is significant damage to the retina, particularly the macula. This damage leads to a loss of central vision, which is crucial for tasks such as reading, driving, and recognizing faces. In geographic atrophy, there is a progressive loss of retinal pigment epithelium and photoreceptors, leading to blind spots in central vision. In neovascular AMD, abnormal blood vessels grow under the retina and leak fluid or blood, causing scarring and rapid vision loss.
While treatments exist to slow the progression of neovascular AMD, such as anti-VEGF (vascular endothelial growth factor) injections [2], these treatments cannot reverse the damage that has already occurred. Similarly, there are no effective treatments for reversing vision loss in geographic atrophy. Therefore, early diagnosis, accurate prognosis, and preventive therapies can accordingly slow the progression of vision loss and minimize patient cost. Both retinal images and genetic variants serve as key factors in clinical diagnosis and prognosis of advanced AMD. The increasing number of AMD patients has outpaced the capacity for manual diagnosis and prognosis. Consequently, automated approaches are needed to help slow disease progression to late-stage AMD.
On the one side, deep learning algorithms have developed rapidly to successfully address numerous machine learning tasks, including image classification. In the past decade, based on deep CNN models such as Inception-V3, ResNet, etc., researchers diagnosed different stages of AMD [3,4,5,6] and detected more specific AMD-related endophenotypes [7,8] from color fundus photographs (CFPs). Besides diagnosis of AMD-related characteristics, researchers also investigated prediction of AMD progression using longitudinal CFPs in the Inception-V3 framework [9]. A time-dependent Cox survival neural network was also proposed to predict survival probability beyond a given time point using longitudinal fundus images [10]. Meanwhile, with the rapid advancements in self-supervised learning techniques in computer vision over the past two years, such as the development of masked autoencoders [11], foundation models have emerged across various fields. These models offer promising image representation vectors for downstream task-specific analyses. In the domain of retinal diseases, a notable foundation model pretrained on 1.6 million retinal images was introduced in 2023, facilitating more advanced downstream retinal disease analysis [12].
On the other side, AMD is one of the diseases that genetic factors serve as an essential role. A total of 52 SNPs from 34 loci were found to be independently associated with late AMD from a large genome-wide association study (GWAS) with 16,144 patients and 17,832 controls [13]. Based on those 34 loci, researchers modeled genetic risk of advanced AMD as a quantitative score to predict time-to-late AMD in survival analysis [14]. It has also been shown that marginally weak SNPs in GWAS can facilitate prediction of late AMD appearance [15]. Moreover, multimodal deep neural networks of genotypes and phenotypes have been investigated to enhance prediction of AMD progression [16,17]. In 2020, a CNN model was proposed for the first time to predict future AMD risk utilizing both fundus images from a single visit and AMD-associated genetic variants [18], marking a significant advancement in the predictive modeling of AMD progression.
In this work, we extend AMD prognosis prediction using both longitudinal fundus images and genetic variants associated with late AMD in an LSTM architecture [19]. Furthermore, we introduce a novel variation of the LSTM model, time-varied LSTM, which allows an uneven length of time intervals between adjacent input visits so that more data can be utilized for training and the model can be more generalizable. Recent multimodal works relevant to our study include those by Ganjdanesh et al. [16,17] and Yan et al. [18], who employed multimodal genotype and fundus image data integration for AMD prediction, albeit using single fundus images rather than longitudinal sequences. While these approaches effectively integrated imaging and genetic data, our model is the first specifically designed to leverage both longitudinal fundus images and SNP data with irregular time intervals, enhancing predictive precision for AMD progression. Other recent multimodal approaches, such as those by Venugopalan et al. [20], Cao and Long [21], and Li et al. [22], have demonstrated potential in combining imaging and genetic data in other diseases like Alzheimer’s and Parkinson’s; however, these models are not specifically tailored for AMD, and adapting them would require extensive tuning. Comparative analyses with existing methods demonstrate that our proposed TV-LSTM model provides superior or comparable performance, emphasizing its methodological novelty and clinical applicability.
The key contributions of this study include (1) introducing a novel time-varied LSTM (TV-LSTM) method tailored for longitudinal fundus imaging data with irregular time intervals; (2) integrating transformer-based retinal image embeddings and genetic variants for improved AMD progression prediction; and (3) demonstrating the clinical relevance and efficacy of our approach through comprehensive experiments and rigorous validation using a large-scale dataset.

2. Methods and Materials

In this section, we describe the methodology for predicting late AMD progression using both longitudinal fundus images and genetic variants. We first outline the approach under the regular LSTM setting and then introduce our proposed time-varied LSTM (TV-LSTM) setting, which accounts for irregular time intervals in longitudinal data. Additionally, we provide detailed information on the model training and evaluation settings, including loss functions and performance metrics. We also describe the dataset used in this study and the steps taken for data preprocessing and partitioning.

2.1. Regular LSTM

The Long Short-Term Memory (LSTM) network is a type of recurrent neural network (RNN) designed to overcome the limitations of traditional RNNs, particularly in learning long-term dependencies. In principle, LSTM models do not inherently require equal time intervals between observations. However, they do assume consistent time differences between training and testing to effectively learn temporal patterns and generalize them to new data. In practice, researchers often use equal time intervals to simplify the modeling process and enhance prediction accuracy. Equal intervals provide a uniform temporal structure, making it easier for the LSTM to capture sequential dependencies.
In the regular LSTM model, which assumes equal time intervals, the input consists of longitudinal data X 1 ,   X 2 ,   ,   X T for each observation, where X T is a vector containing the subject’s information at time t . This information can include image embeddings and SNP data. Each image embedding is derived from the output of the retinal foundation model, RetFound, introduced by Zhou et al. [12] and has the dimension of 1024. RetFound was pretrained on 1.6 million unlabeled retinal images through self-supervised learning, in which the model learned how to reconstruct partially masked images and gained the ability of extracting image global and local information. Downstream analysis using image representations from the retinal foundation model has been demonstrated to outperform most task-specific models. Hence, using the output of the foundation model is reasonable for further analysis in this work. The 52 selected genetic variants for each observation are from the largest GWAS of AMD to date [13] and are represented in an additive manner based on the minor allele.
The core component of the LSTM network is the memory cell, which can maintain its state over time and is denoted as C t . As shown in 
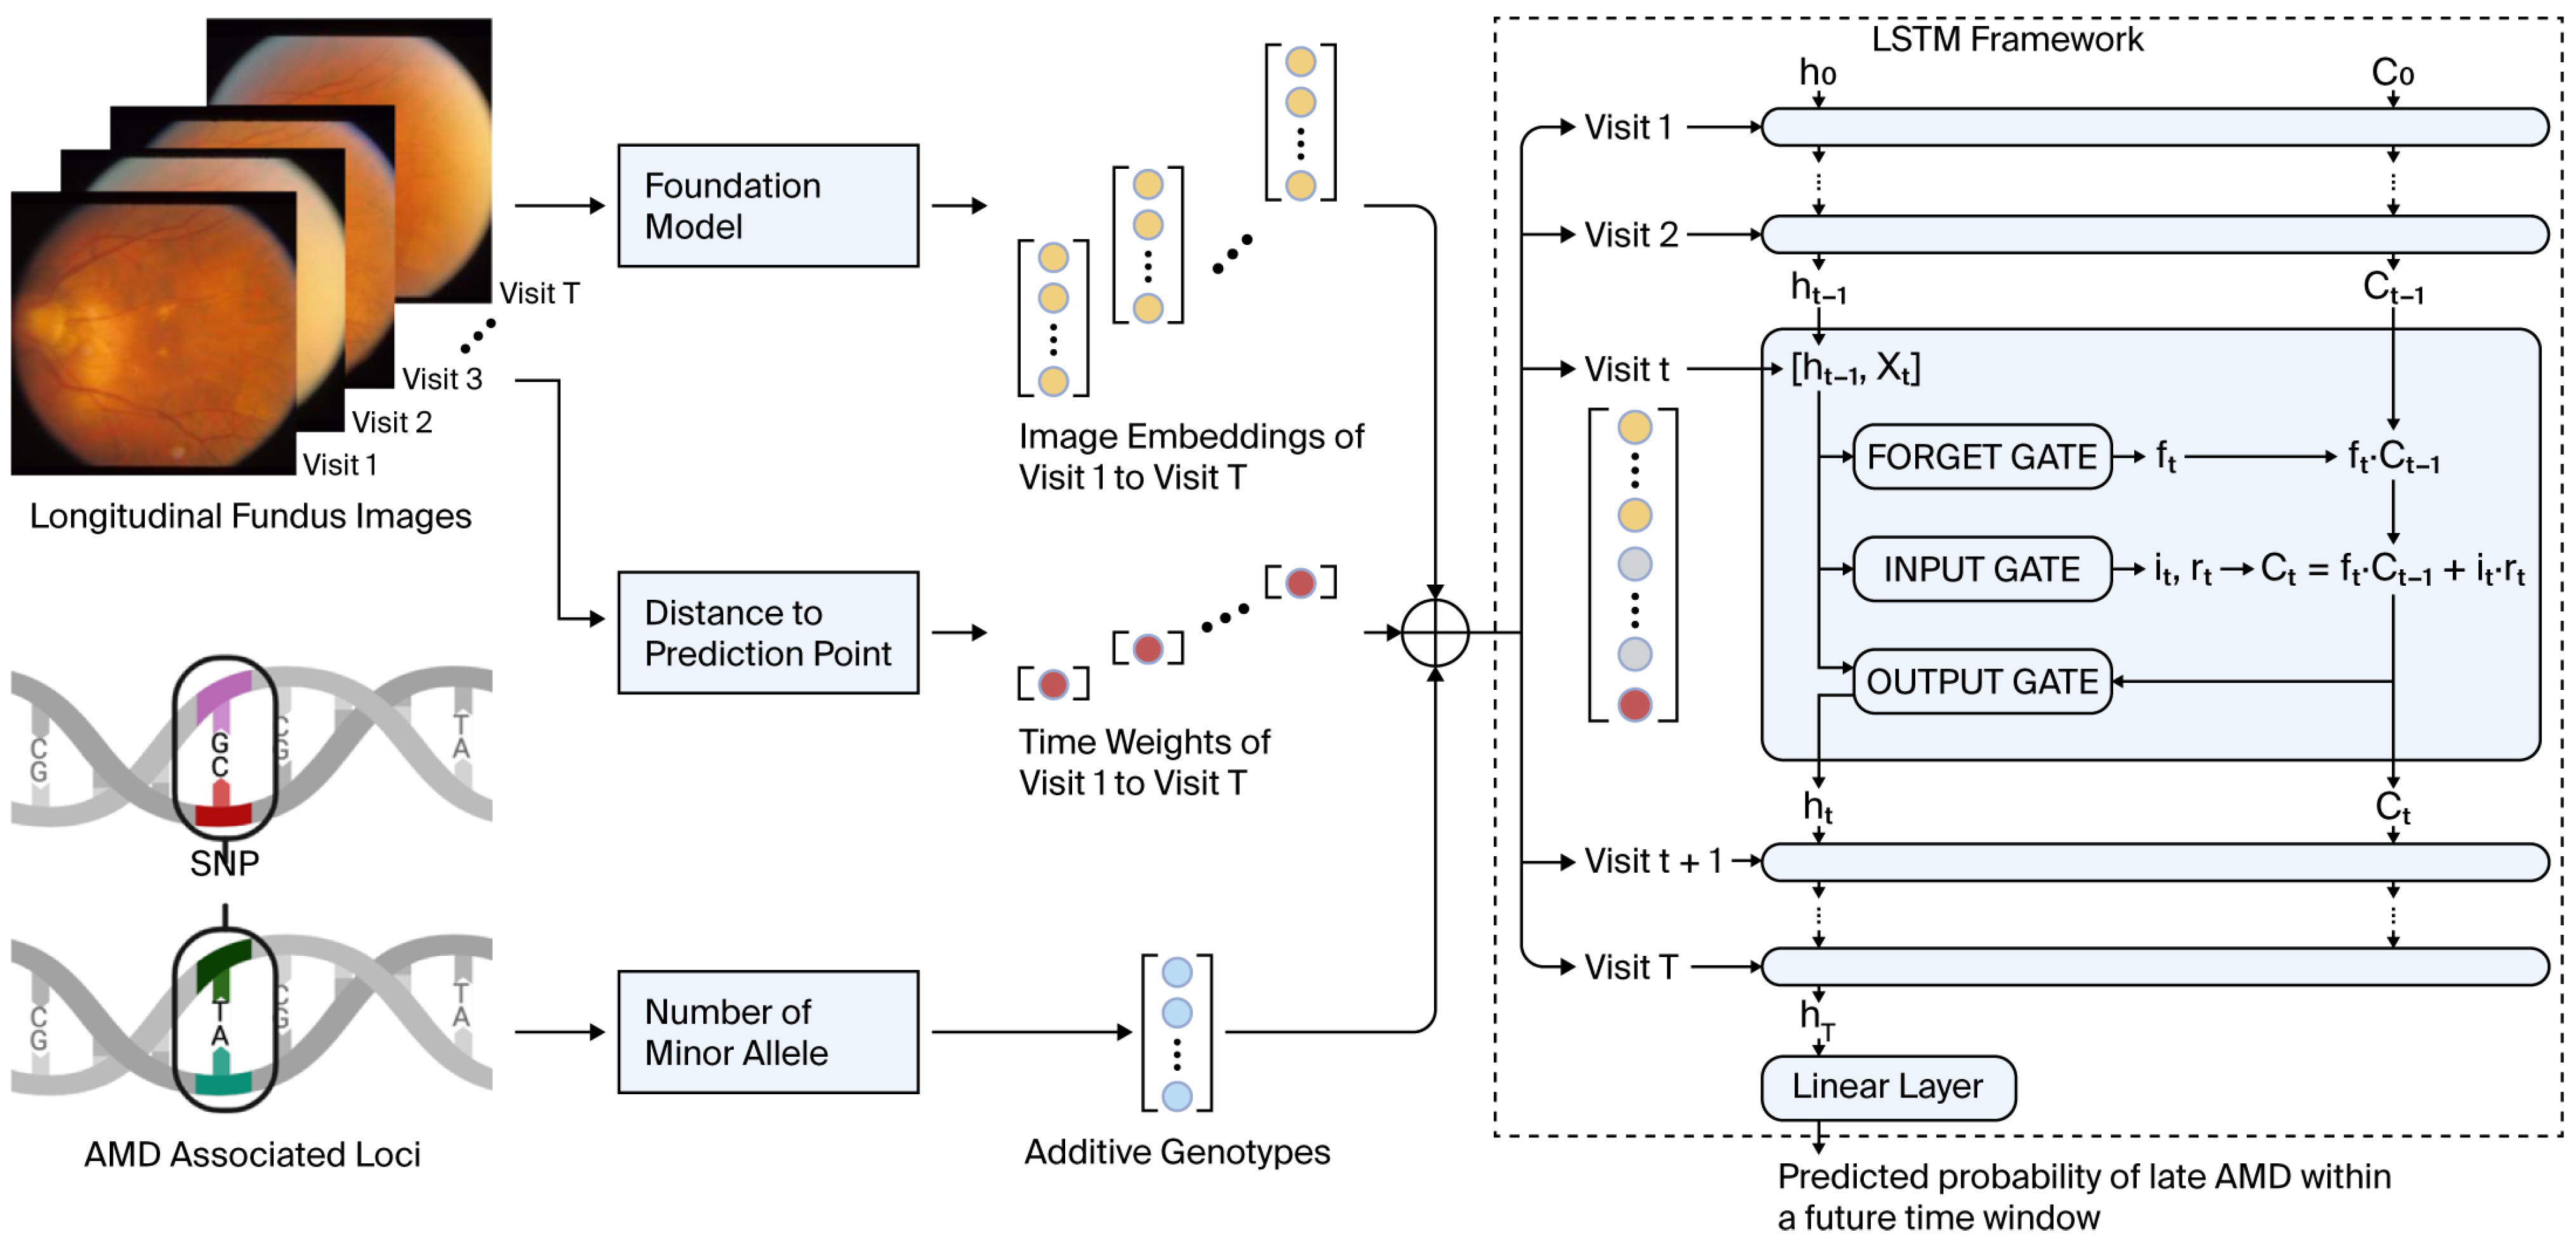
Figure 1, an LSTM contains sequential blocks with similar structure. Each block comprises three gates: the forget gate, the input gate, and the output gate. These gates regulate the flow of information into, out of, and within the block.
Forget Gate: The forget gate controls the extent to which the information from the previous cell state C t 1 should be retained or forgotten. It uses a sigmoid activation function to produce a gating signal, f t , in range of ( 0 ,   1 ) , which modulates the previous cell state.
f t = σ ( W f h t 1 , X t + b f )
where h t 1 is the hidden state from the previous block, W f is the weights that needs to be trained in the forget gate, and b f is a bias term.
Input Gate: The input gate determines how much of the new information from the current input and the previous hidden state should be added to the cell state. It consists of a hyperbolic tangent function that outputs candidate cell state r t 1 ,   1 ,   representing the new memory update vector. In the meantime, a sigmoid activation function outputs i t 0 ,   1 as a filter that determines to what extent the new update is worth retaining. After that, the new memory cell state C t is derived as below.
i t = σ ( W i h t 1 , X t + b i )
r t = t a n h ( W C h t 1 , X t + b C )
C t = f t C t 1 + i t r t
Output Gate: The output gate decides how much of the cell state C t should be exposed to the next hidden state, h t . This gate uses a combination of the cell state and a sigmoid activation function to produce the next hidden state as follows:
o t = σ ( W o h t 1 , X t + b o )
h t = o t t a n h ( C t )
where i t , f t , and o t are the input, forget, and output gates, respectively. r t is the candidate cell state, C t is the cell state, and h t is the hidden state.
The final hidden state h t is the output after the last block and serves as a summary of the entire sequence. The hidden state h t is passed through one fully connected layer, which helps to map the information from the LSTM’s output to the desired probabilities of 2 classes (late AMD or no late AMD in our study).
P r e d i c t e d   P r o b a b i l i t y = σ ( W h h t + b h )

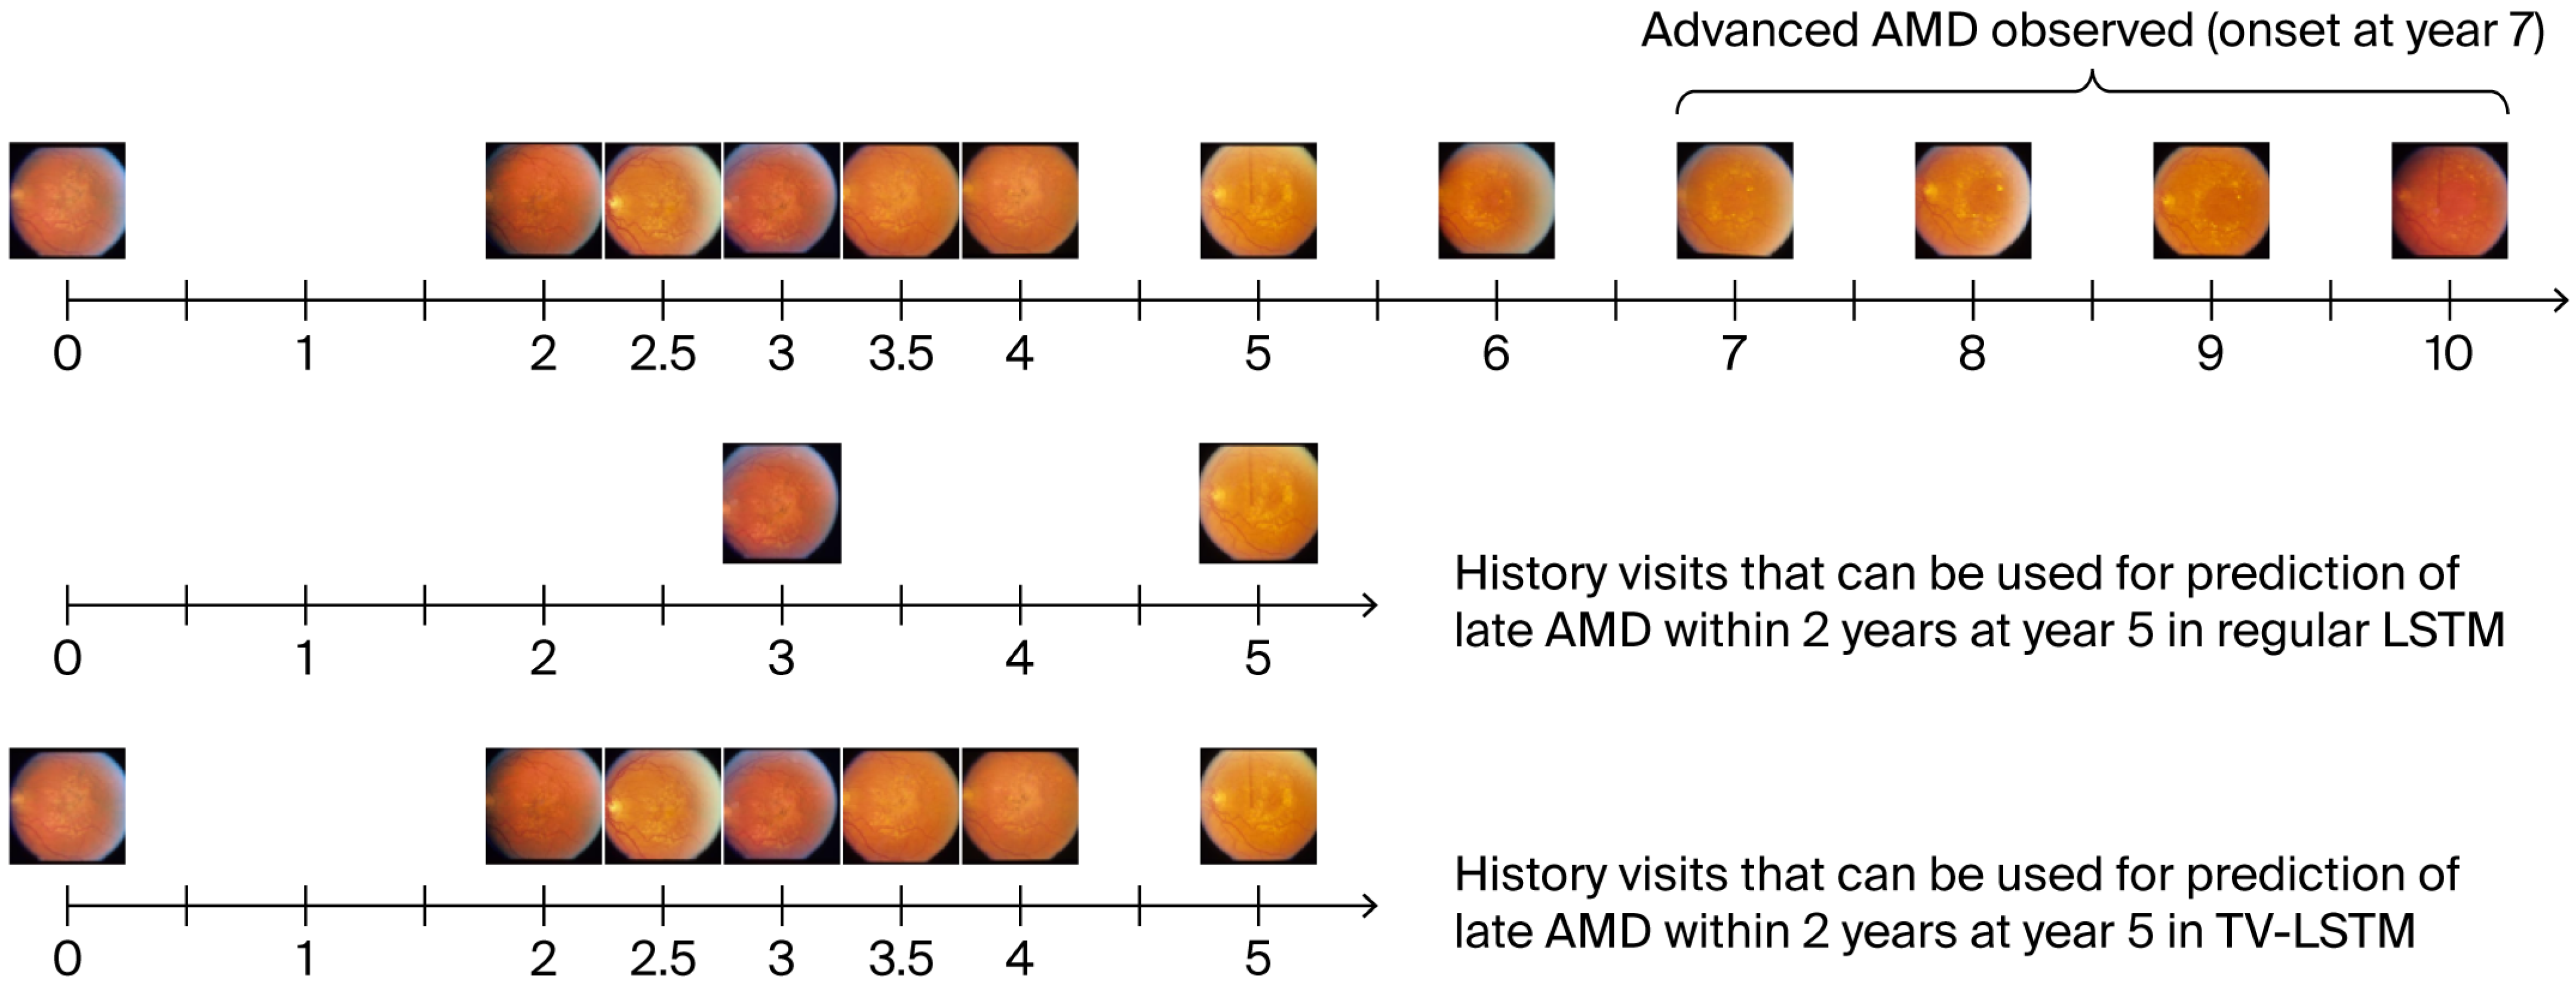
2.2. Time-Varied LSTM

Traditional Long Short-Term Memory (LSTM) models are well-suited for handling sequential data but typically assume that time intervals between data points are consistent. This assumption, however, is rarely valid in real-world clinical settings, where patient visits occur at irregular intervals. As a result, traditional LSTM models may struggle to fully leverage the timing and sequence of clinical data, restricting the sample size and limiting the model’s generalizability. To address this limitation, we propose a novel variation, time-varied Long Short-Term Memory (TV-LSTM), which accommodates varying lengths of time intervals between longitudinal fundus images. In TV-LSTM, the interval between each visit and the prediction time point is normalized as a time weight, w i t , and incorporated into the input data X 1 , X 2 , , X T . The time weight takes a value between 0 and 1, indicating how close the current time point is to the predicted time point.
w i t = t L i U i L i
where w i t is the time weight for subject i at time t , L i is the time of the earliest visit used for prediction for subject i , and U i is the prediction time point for subject i . Data points closer to the prediction point are assigned a heavier time weight.
To clarify, the proposed time weight method fundamentally differs from interpolation, which involves estimating additional data points between observed intervals. Instead, our approach reweights existing observations based on their temporal proximity to the prediction point without creating new, artificial data points. By normalizing observed intervals to a [0, 1] range, we emphasize more recent observations, thus effectively utilizing the available data without interpolation.
Apart from the incorporation of the time weight into the input, all other components and mechanisms of TV-LSTM remain the same as those in a regular LSTM model, including the architecture of the forget gate, input gate, and output gate. Architecture and Workflow of time-varied LSTM are shown in Figure 1. This design preserves the well-established strengths of LSTM in capturing sequential dependencies while enhancing its flexibility in handling irregular time intervals.
This approach not only increases the available sample size for training but also allows the inclusion of more temporally relevant visits, thereby improving the model’s adaptability and robustness in real-world analysis, as shown in Figure 2.

2.3. Model Training and Evaluation

Training the LSTM and TV-LSTM models involves minimizing a cross-entropy loss function L to quantify the difference between predicted and actual AMD progression risk.
L = 1 N i = 1 N ( y i log y ^ i + 1 y i log 1 y ^ i )
where L is the loss, N is the number of samples, y i is the actual label, and y ^ i is the predicted probability.
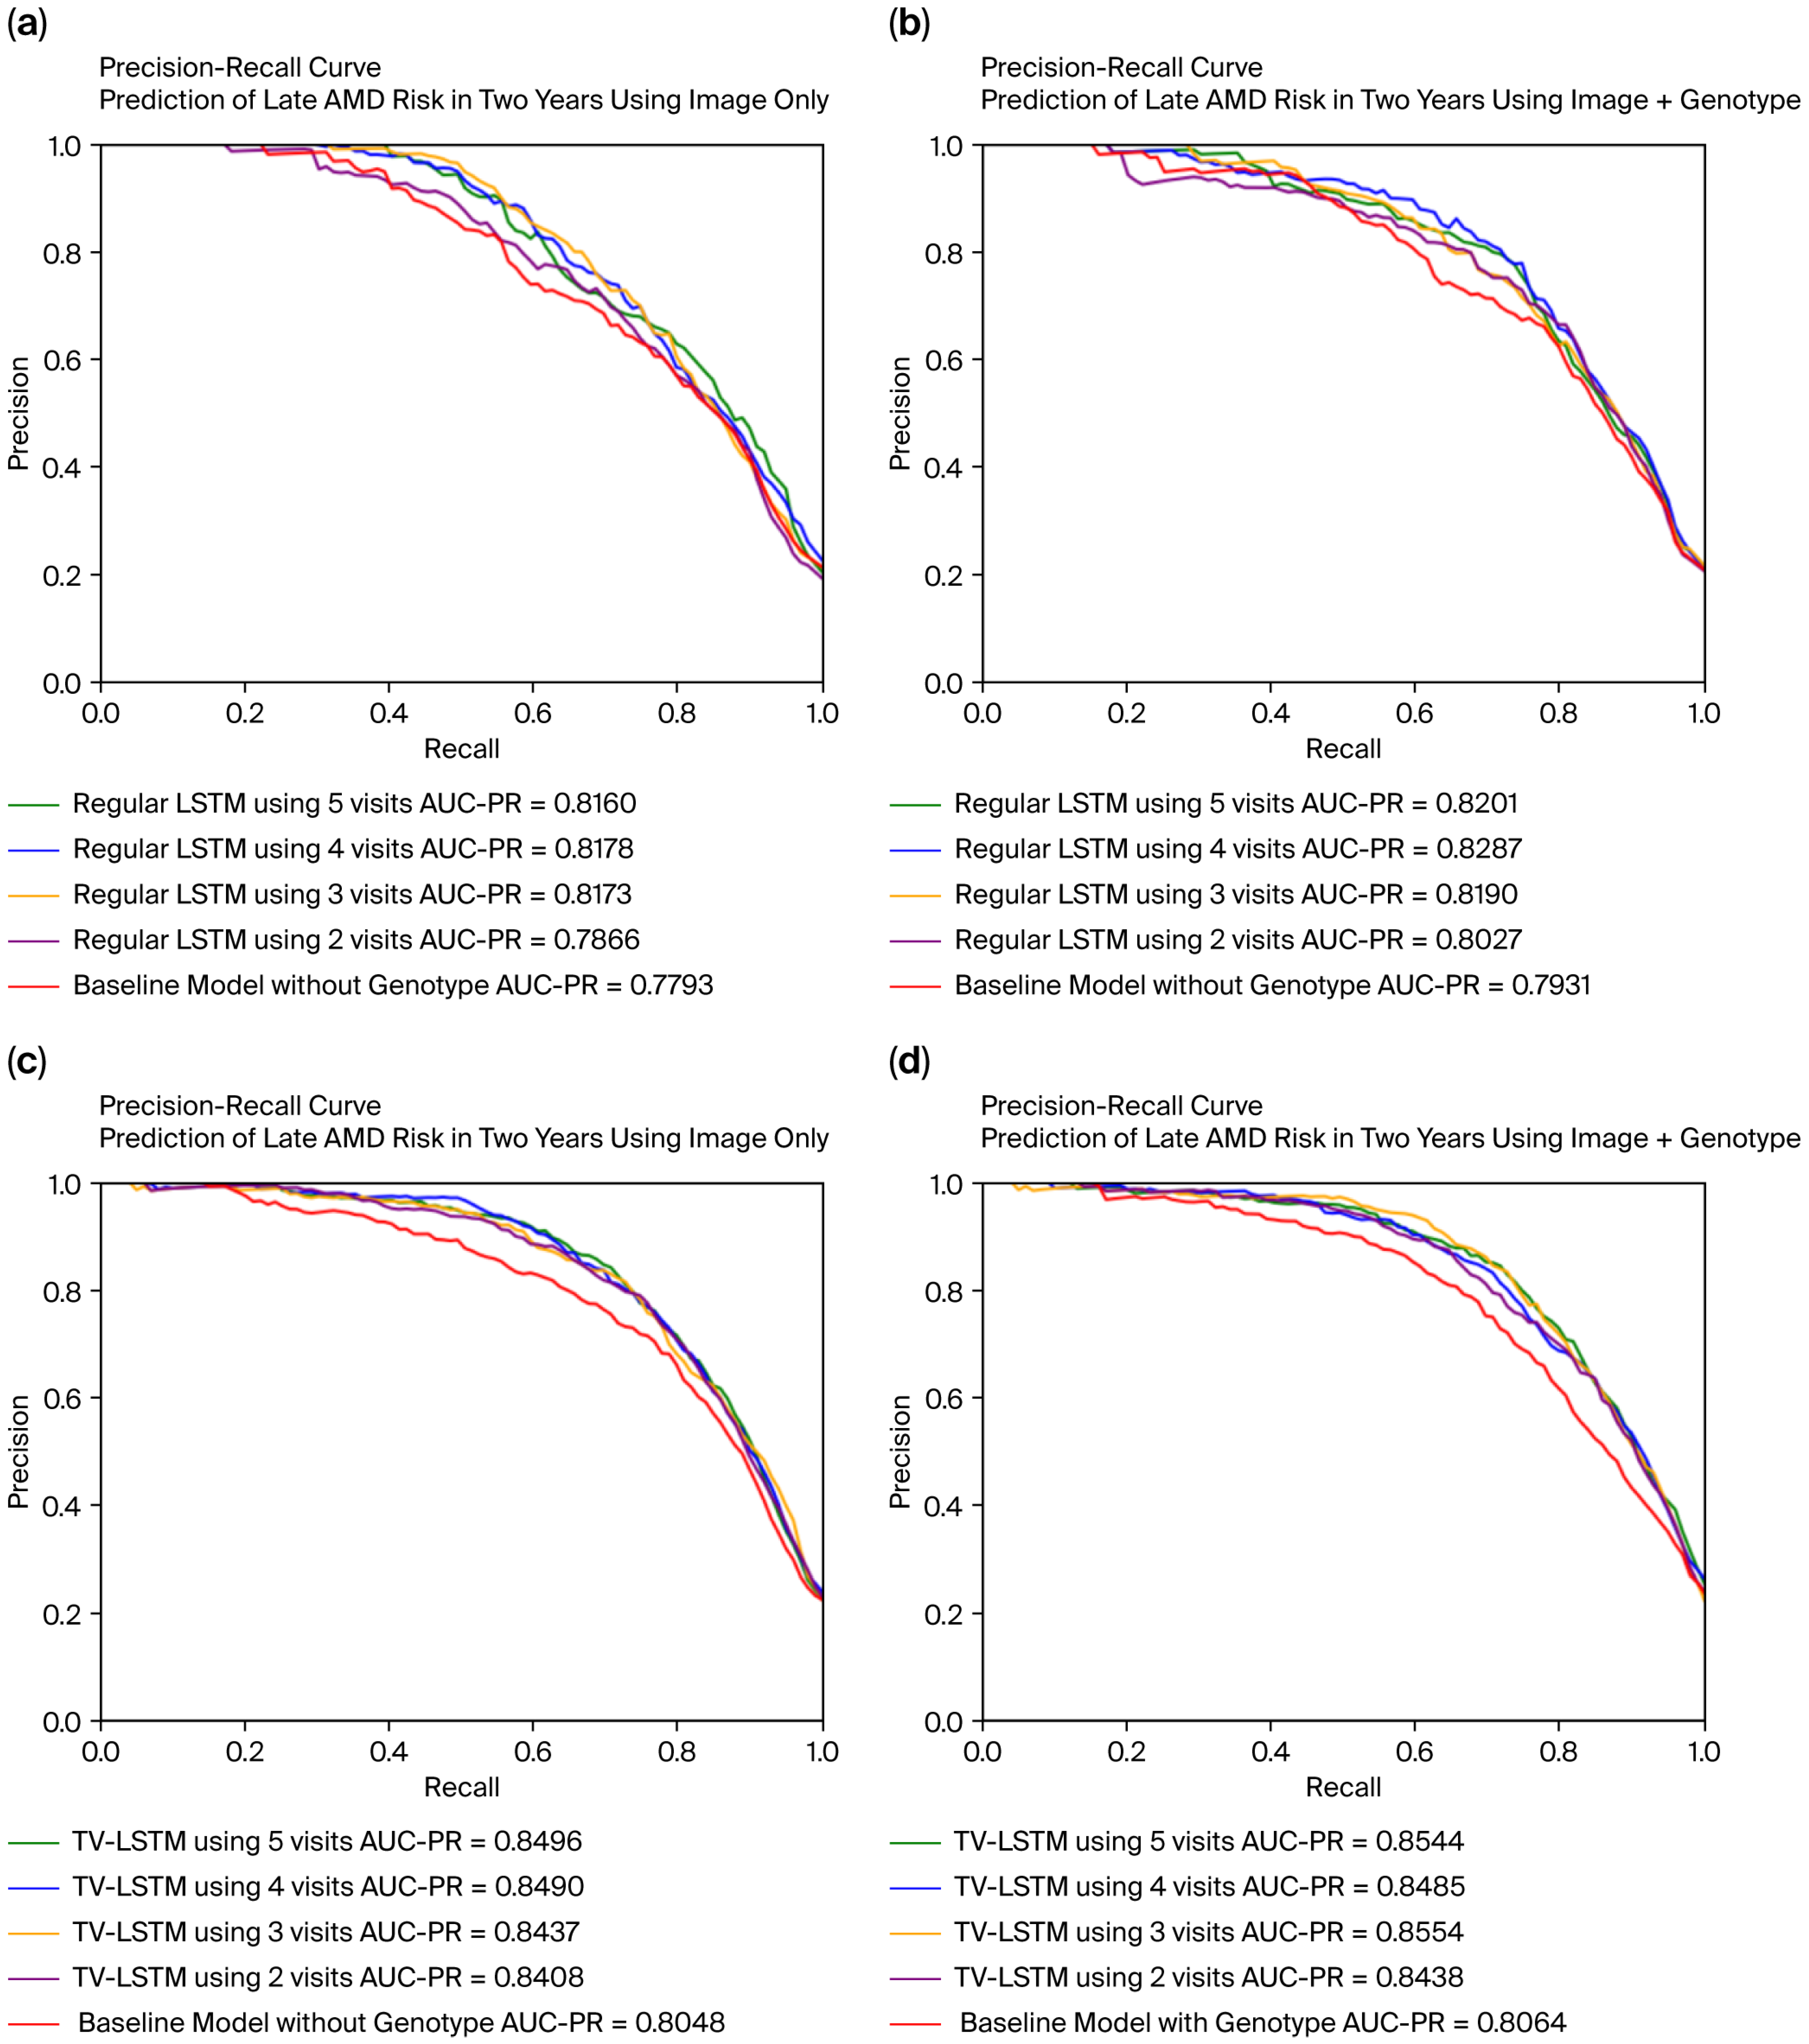
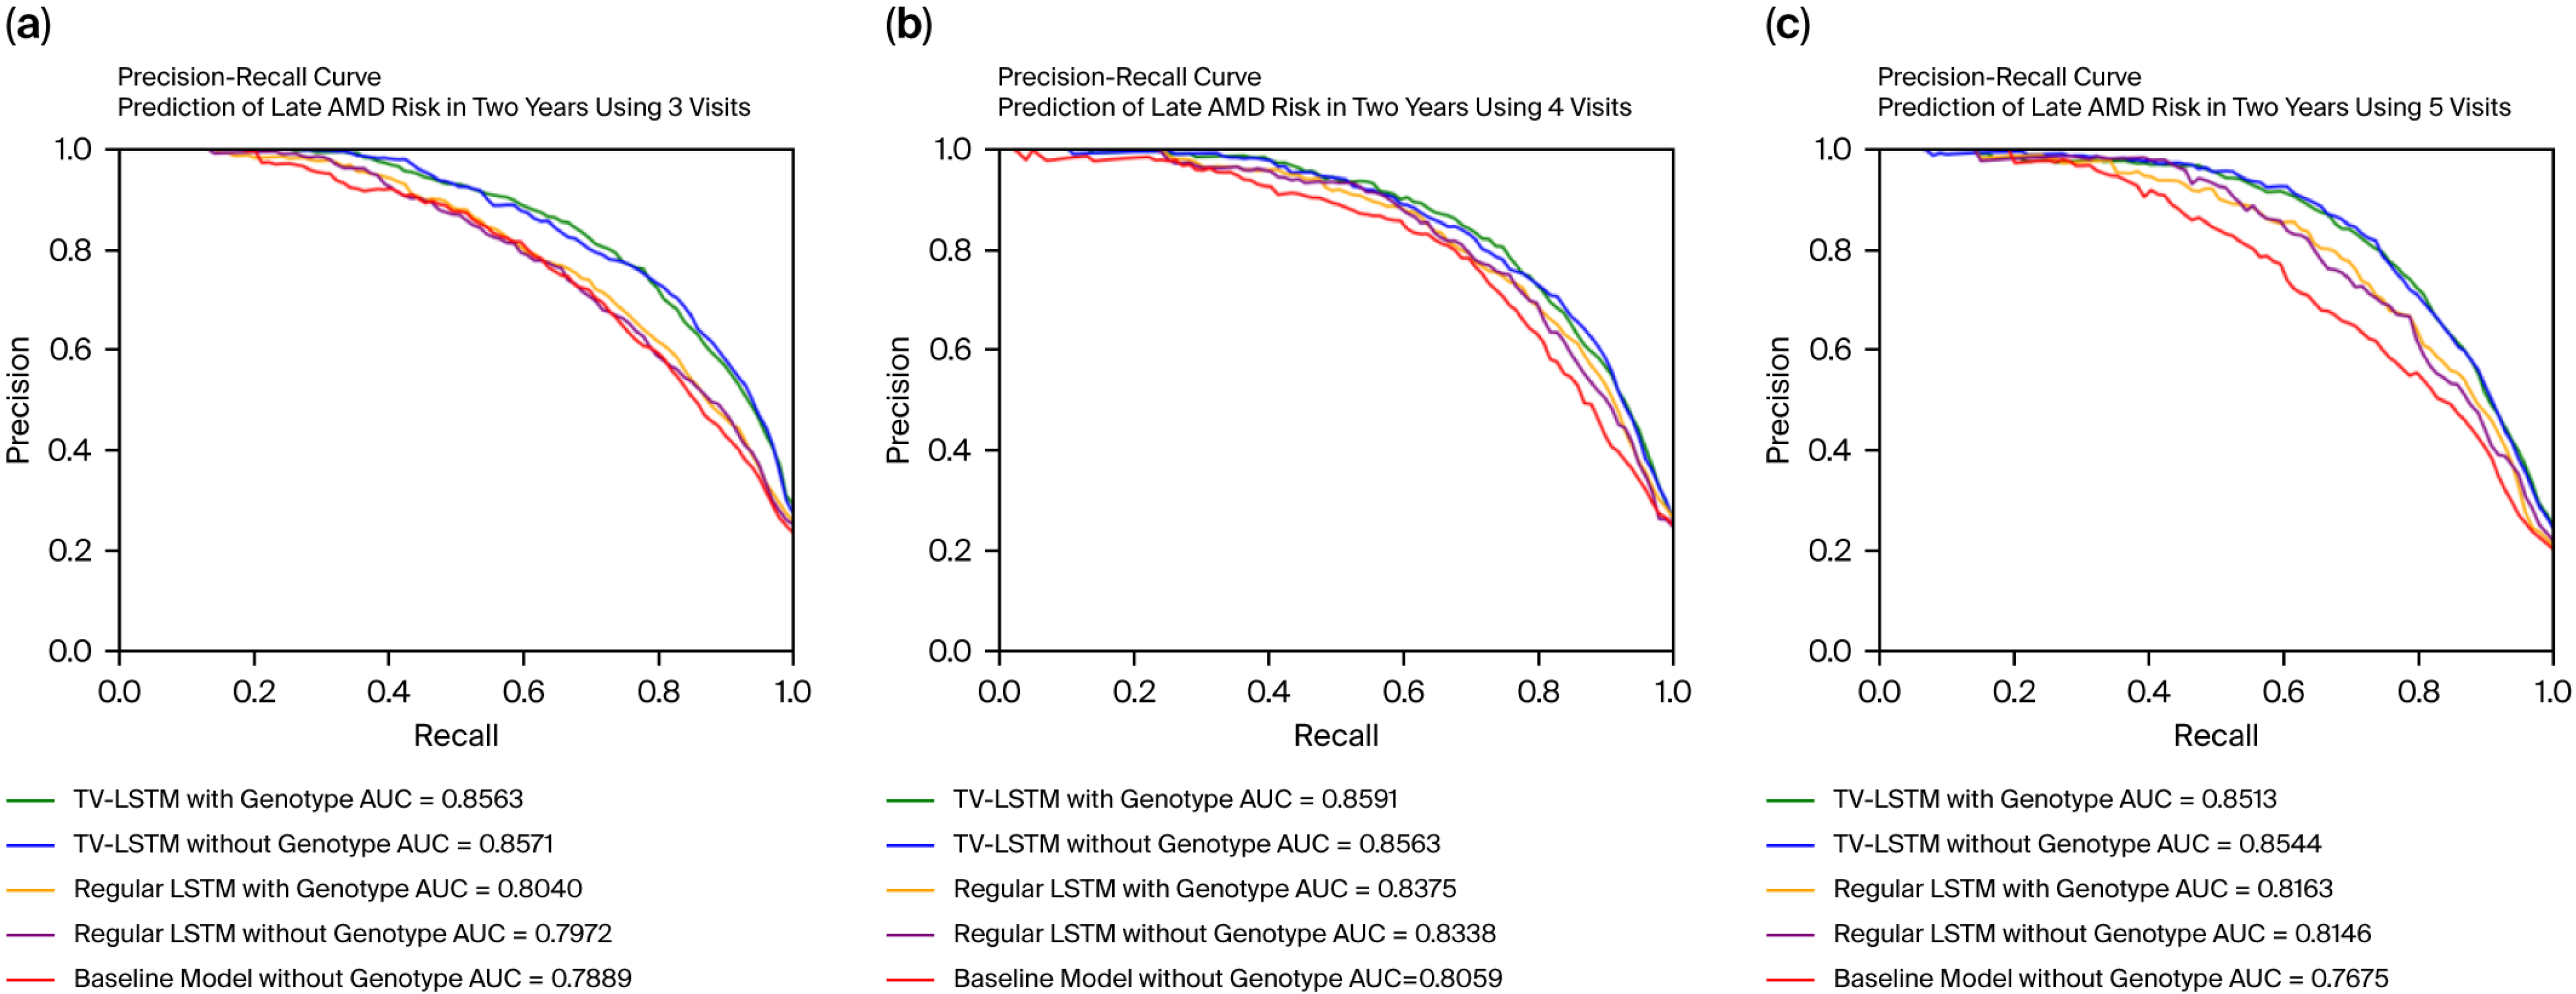
The model parameters are optimized using the Adam optimizer, which dynamically adjusts the learning rate during training. For model evaluation, we used the AUC-PR (Area Under the Precision–Recall Curve) metric, which is particularly suitable for our imbalanced dataset where fewer individuals progress to late AMD. The AUC-PR emphasizes precision and recall, providing a clearer reflection of how well the model identifies true positives, whereas AUC-ROC was not prioritized since it may remain high due to the large number of negative cases, masking poor performance in predicting the minority positive class.
Hyperparameters, including learning rates and batch sizes, were optimized via grid search using the validation set. The optimal learning rate identified was 1 × 10⁻⁴, with a batch size of 32, selected based on minimal validation loss. All experiments were performed using one NVIDIA A100 GPU with PyTorch 1.8.1, scikit-learn 0.24.2, NumPy 1.19.5, and pandas 0.25.3 (more details of package versions can be found on GitHub, see section Data Availability Statement).

2.4. Dataset Preprocessing, Partitioning, and Instrument Setup

The National Eye Institute (NEI) Age-Related Eye Disease Study (AREDS) (phs000001.v3.p1 in dbGaP) is a large-scale, long-term prospective clinical trial of age-related macular degeneration (AMD) and age-related cataract. A total of 187,996 color fundus images of 4628 subjects and corresponding eye-level phenotypes are covered in AREDS. Additionally, 2521 out of 4628 subjects have genotypes available. One subject could have up to 13 years of follow-up visits since the baseline.
All stereoscopic fundus images in the AREDS were captured using Zeiss FF450 Plus fundus cameras with a 30-degree field of view. These images were acquired under standardized imaging protocols across all participating sites, as detailed in AREDS Report No. 6 [23]. In this study, we focused on Field 2 (centered slightly above the fovea), which targets the macula—an essential region for assessing AMD progression. Although individual imaging parameters such as flash intensity and exposure time are not available in the dataset, uniform imaging standards and centralized manual grading ensured high image consistency and quality across sites.
We selected Field 2 since this angle focuses on the most important region related to AMD (macula) and holds the largest sample size in the AREDS. Meanwhile, for most eyes given any visit, both left-side and right-side fundus of the stereoscopic pair images are available for each eye. We randomly picked all left-side images of the stereoscopic pair of all eyes to avoid redundant information and boost training speed. The overall image quality of fundus images in AREDS is acceptable for the following grading and research. Only 0.6% of images of 48,998 eyes were ungradable through the first 10 years of the AREDS.
We cropped each color fundus photograph (CFP) to a square region encompassing the macula and resized it to a resolution of 224 × 224 pixels. We first discarded all ungradable images. Subsequently, we reclassified the manually graded labels in the AREDS. All questionable classes in the AREDS were treated as absent. For the AMD status label at each visit, we recategorized the 9-step AMD severity scale into two classes: steps 1–8 were categorized as no/early/intermediate AMD, while steps 9–12 were categorized as late AMD.
The total number of participants varies in different tasks. The greater the number of visits included in the model, the smaller the number of participants we are able to include in the task, as shown in Table 1. For each task, we randomly divide the AREDS dataset into three parts for each task: the training set plus validation set include 90% of participants, of which 90% belongs to the training set and 10% belongs to the validation set; the testing set includes 10% of participants. Participants in the training, validation, and testing sets were randomly picked from the AREDS and mutually exclusive.
The architecture of our approach, as shown in Figure 1, demonstrates how longitudinal fundus images and genotype data can be integrated into a single processing pipeline to predict the risk of future late AMD. This framework could be adapted in a clinical setting where newly captured images from instruments like the Zeiss FF450 Plus are immediately processed and analyzed. Figure 1 conceptually outlines the measurement and computation flow, from raw imaging input through embedding generation and genotype integration, to prediction output via the TV-LSTM model.

3. Results

3.1. Prediction of Late AMD Within Two Years Using Regular LSTM and TV-LSTM: Impact of Varying Number of Visits as Predictors

We evaluated the performance of an LSTM model in predicting late AMD progression over two years, using different numbers of visits as predictors, and compared it to a baseline multilayer perceptron (MLP) model that used only a single fundus image embedding. The LSTM analysis was based on 2044 eyes from 1057 participants in the AREDS, while the TV-LSTM was evaluated using 3790 eyes from 1943 participants. Figure 3 presents the averaged ROC and PR curves from 10 random repetitions, showing that more visits improved the AUC-PR, indicating that increased longitudinal data enhances prediction accuracy. However, the performance gains diminished with more visits, likely due to older, less relevant information adding noise. The diminishing returns observed in prediction accuracy beyond four visits indicate an optimal threshold for longitudinal data use in predicting AMD progression. Clinically, recent visits typically carry more predictive value since they represent the most relevant state of disease progression. Additional older visits may introduce noise due to variability in disease state or unrelated health changes, reducing their predictive utility. Notably, the baseline model, using a single embedding from RetFound, outperformed state-of-the-art models (as shown in Table 2), highlighting the value of foundation model embeddings. The LSTM performed best with four visits, after which additional visits introduced noise. In contrast, TV-LSTM continued improving with more visits, likely due to its ability to better utilize recent information. Including genotype data also marginally improved performance across the model.

3.2. Prediction of Late AMD Within Two Years by Varying Number of Visits as Predictors: A Comparison of LSTM and TV-LSTM

We compared the performance of regular LSTM, TV-LSTM, and the baseline model (an MLP using a single fundus image embedding) in predicting late AMD progression over two years, using different numbers of visits. TV-LSTM can handle uneven time intervals, allowing it to use a larger dataset compared to the regular LSTM. For three, four, and five visits, TV-LSTM consistently used larger samples than the regular LSTM, with results averaged across 10 random repetitions. Figure 4 shows that TV-LSTM outperformed the regular LSTM, which in turn surpassed the baseline model in AUC-PR, likely due to TV-LSTM’s larger sample size and inclusion of more recent visits. Reducing the number of visits while increasing sample size resulted in a performance trade-off: TV-LSTM with four visits outperformed the five-visit model due to a larger sample size. Genotype data did not always improve performance, but it never reduced model accuracy, suggesting that genotype inclusion is neutral when not beneficial. Our TV-LSTM model achieved an AUC-ROC of 0.9479 (shown in Supplementary Figure S1) and an AUC-PR of 0.8591 (shown in Figure 4) for predicting late AMD within two years, using data from four visits with varying time intervals.

3.3. Analysis of TV-LSTM Training Dynamics

To further investigate the training dynamics of our proposed TV-LSTM model, we analyzed its performance metrics over successive training epochs. Figure 5 illustrates the training and validation loss, along with the test performance measured by the AUC-PR and AUC-ROC curves across 50 training epochs.
As demonstrated in Figure 5a, both training and validation losses decreased steadily during the initial epochs, reflecting effective learning by the model from the available training data. Notably, the training loss continued to decrease substantially and eventually plateaued after approximately 20 epochs, while the validation loss reached its minimum at around epoch 4–10 and slightly increased thereafter. This divergence after epoch 20 indicates the onset of mild overfitting, suggesting that early stopping or regularization techniques might further enhance model generalization.
Figure 5b,c provide insights into how the predictive accuracy evolved during training, as measured by the AUC-PR and AUC-ROC, respectively. The test AUC-PR score initially improved significantly, reaching a peak value close to epoch 5, and subsequently exhibited slight fluctuations, stabilizing afterward. Similarly, the test AUC-ROC showed an early improvement, achieving the highest value around epochs 4 to 10, followed by minor fluctuations without significant improvement thereafter. These trends highlight the importance of carefully selecting an appropriate epoch for model deployment to balance training complexity and predictive generalization.
Collectively, this detailed analysis confirms that the TV-LSTM architecture effectively captures relevant temporal dynamics from longitudinal AMD progression data. It also emphasizes the importance of implementing early stopping or additional regularization methods in practical applications to prevent overfitting and achieve optimal predictive performance.

4. Discussion

Our architecture incorporates the encoder part of a transformer-based autoencoder (RetFound) to extract embeddings from retinal images, leveraging the transformer’s powerful representation capabilities. Subsequently, we use LSTM networks for sequence modeling due to their inherent suitability for capturing temporal dependencies, particularly with irregularly spaced clinical data. Unlike transformers alone, LSTM networks efficiently handle datasets with irregular temporal intervals and require fewer computational resources, making them ideal for clinical retinal imaging scenarios characterized by irregular follow-up intervals and limited observations. This hybrid approach combines the strengths of transformers in image embedding extraction with LSTM networks’ robustness against irregular temporal spacing.
In clinical scenarios involving prediction of late AMD progression, misdiagnoses primarily occur as false positives or false negatives. False-positive predictions, in which the model incorrectly anticipates disease progression in patients who remain stable, can lead to unnecessary psychological distress, heightened healthcare costs due to unwarranted interventions, and exposure to potential adverse treatment effects. Conversely, false-negative predictions, where the model fails to identify patients who later progress to late AMD, have more severe implications, including delayed interventions, irreversible retinal damage, and permanent vision loss. Consequently, the accurate distinction between progressing and stable cases is paramount for clinical efficacy. To rigorously evaluate our model’s predictive performance, we utilized both the Area Under the Receiver Operating Characteristic Curve (AUC-ROC) and the Area Under the Precision–Recall Curve (AUC-PR). While the AUC-ROC measures overall discriminatory ability independent of class prevalence, it can sometimes provide overly optimistic results in highly imbalanced datasets like ours due to the abundance of true negatives. This could mask critical performance issues in correctly identifying the minority group at genuine risk of disease progression. On the other hand, the AUC-PR metric is specifically designed for imbalanced datasets, directly assessing the balance between precision (correct positive predictions out of all positive predictions) and recall (accurately identifying most true progression cases). A high AUC-PR value indicates robust model performance in reliably identifying actual cases of AMD progression, thereby substantially increasing clinical trust in model outputs. Our proposed TV-LSTM model achieved an impressive AUC-PR of 0.8591, underscoring its reliability and potential clinical utility. Given these considerations, emphasizing AUC-PR alongside AUC-ROC provides a clearer and clinically more meaningful evaluation of our model, ensuring accurate identification of AMD progression cases essential for timely and effective patient care.
A major challenge for the time-varied LSTM model proposed in this paper is the lack of independent cohorts that can be used to validate our model. It is difficult to find suitable datasets that provide phenotypes, genotypes, and longitudinal fundus images available for at least three visits at the same time. For example, the UK Biobank (UKB) [26] is another large-scale cohort that includes 85,728 subjects and 175,546 fundus images across three visits. Genotypic data is also available in UKB. However, the image quality in the UKB dataset is significantly lower than that in AREDS, and phenotypes were collected through questionnaires, which contain a large amount of missing data, unlike the manual grading process used in AREDS. Only 1695 images with definite AMD diagnoses from questionnaires are available, of which only 6 images are readable, have corresponding genotypes, and show progression to late AMD at the last visit from a non-late AMD status.
In this study, longitudinal fundus photographs were utilized to predict the progression of age-related macular degeneration (AMD). Emerging imaging techniques such as Optical Coherence Tomography (OCT) [27] and Adaptive Optics (AO) [28] offer significant potential for advancing retinal disease analysis. OCT captures high-resolution, cross-sectional images of the retina, enabling precise tracking of structural changes such as retinal thickness or fluid accumulation, which are critical in diseases like AMD and diabetic retinopathy. AO provides cellular-level imaging, offering detailed insights into photoreceptor integrity and other cellular dynamics, which are essential for understanding retinal health and pathology. The integration of Long Short-Term Memory (LSTM) networks with OCT and AO datasets could revolutionize the prediction and monitoring of retinal diseases. LSTM models excel at capturing temporal patterns, making them well-suited for analyzing sequential imaging data to detect subtle, progressive changes in retinal structures or cellular features. By leveraging OCT and AO data, LSTM models could provide early detection of disease progression, predict treatment outcomes, and enhance personalized treatment strategies. The combination of these advanced imaging modalities within a deep learning framework represents a promising step forward in retinal disease modeling, with the potential to improve clinical decision-making and patient care significantly. Future research should address challenges like data heterogeneity and the need for extensive annotated datasets to maximize the clinical impact of these technologies.

Supplementary Materials

The following supporting information can be downloaded at: https://docs.google.com/document/d/1rLhF1IMWxCgbZHZlSsJUPJskaN5Gn8n4Wj2tn8iI4Kc/edit?usp=sharing (accessed on 24 July 2025). Figure S1: Receiver operating characteristic curves of the prediction of late AMD progression time in two years for LSTM and TV-LSTM by different number of visits as predictors.

Author Contributions

Conceptualization, J.Z., C.Z. and W.C.; methodology, J.Z., C.Z. and W.C.; software, J.Z.; validation, J.Z.; formal analysis, J.Z.; investigation, J.Z.; resources, W.C.; data curation, J.Z. and W.C.; writing—original draft preparation, J.Z.; writing—review and editing, J.Z., C.Z., L.Z. and W.C.; visualization, J.Z., C.Z., L.Z. and W.C.; supervision, H.H., Y.D. and W.C.; project administration, W.C.; funding acquisition, W.C. All authors have read and agreed to the published version of the manuscript.

Funding

This research was funded by National Institutes of Health, grant number R01GM141076 and R01EB034116.

Institutional Review Board Statement

Ethical review and approval were waived for this study because the AREDS data used in this analysis are publicly available and fully de-identified, ensuring the privacy and confidentiality of the participants. No direct interaction with human subjects or access to identifiable personal information was involved. As this study utilizes secondary data analysis of previously collected data, it does not meet the criteria for human subject research as defined by institutional review boards (IRB) and ethical guidelines.

Informed Consent Statement

Informed consent was obtained from all subjects involved in the study. Written informed consent has been obtained from the patient(s) to publish this paper.

Data Availability Statement

The AREDS dataset is available at Database of Genotypes and Phenotypes (dbGaP, accession phs000001.v3.p1). The genotype data for AREDS subjects have been previously reported [13] and can be accessed from dbGap (accession number phs001039.v1.p1). Our implementations and trained checkpoint models can be found in our GitHub repository https://github.com/jzhan211/TV-LSTM (accessed on 24 July 2025).

Conflicts of Interest

The authors declare no conflicts of interest. The funders had no role in the design of the study; in the collection, analyses, or interpretation of data; in the writing of the manuscript; or in the decision to publish the results.

References

  1. Bressler, S.B.; Munoz, B.; Solomon, S.D.; West, S.K.; Salisbury Eye Evaluation (SEE) Study Team. Racial differences in the prevalence of age-related macular degeneration: The Salisbury Eye Evaluation (SEE) Project. Arch. Ophthalmol. 2008, 126, 241–245. [Google Scholar] [CrossRef]
  2. Ng, E.W.; Shima, D.T.; Calias, P.; Cunningham, E.T., Jr.; Guyer, D.R.; Adamis, A.P. Pegaptanib, a targeted anti-VEGF aptamer for ocular vascular disease. Nat. Rev. Drug Discov. 2006, 5, 123–132. [Google Scholar] [CrossRef]
  3. Burlina, P.M.; Joshi, N.; Pacheco, K.D.; Freund, D.E.; Kong, J.; Bressler, N.M. Use of deep learning for detailed severity characterization and estimation of 5-year risk among patients with age-related macular degeneration. JAMA Ophthalmol. 2018, 136, 1359–1366. [Google Scholar] [CrossRef]
  4. Grassmann, F.; Mengelkamp, J.; Brandl, C.; Harsch, S.; Zimmermann, M.E.; Linkohr, B.; Peters, A.; Heid, I.M.; Palm, C.; Weber, B.H.F. A Deep Learning Algorithm for Prediction of Age-Related Eye Disease Study Severity Scale for Age-Related Macular Degeneration from Color Fundus Photography. Ophthalmology 2018, 125, 1410–1420. [Google Scholar] [CrossRef]
  5. Peng, Y.; Dharssi, S.; Chen, Q.; Keenan, T.D.; Agron, E.; Wong, W.T.; Chew, E.Y.; Lu, Z. DeepSeeNet: A Deep Learning Model for Automated Classification of Patient-based Age-related Macular Degeneration Severity from Color Fundus Photographs. Ophthalmology 2019, 126, 565–575. [Google Scholar] [CrossRef]
  6. Ganjdanesh, A.; Zhang, J.; Chew, E.Y.; Ding, Y.; Huang, H.; Chen, W. LONGL-Net: Temporal correlation structure guided deep learning model to predict longitudinal age-related macular degeneration severity. Proc. Natl. Acad. Sci. Nexus 2022, 1, pgab003. [Google Scholar] [CrossRef]
  7. Keenan, T.D.L.; Chen, Q.; Peng, Y.; Domalpally, A.; Agron, E.; Hwang, C.K.; Thavikulwat, A.T.; Lee, D.H.; Li, D.; Wong, W.T.; et al. Deep Learning Automated Detection of Reticular Pseudodrusen from Fundus Autofluorescence Images or Color Fundus Photographs in AREDS2. Ophthalmology 2020, 127, 1674–1687. [Google Scholar] [CrossRef]
  8. Keenan, T.D.; Dharssi, S.; Peng, Y.; Chen, Q.; Agron, E.; Wong, W.T.; Lu, Z.; Chew, E.Y. A Deep Learning Approach for Automated Detection of Geographic Atrophy from Color Fundus Photographs. Ophthalmology 2019, 126, 1533–1540. [Google Scholar] [CrossRef]
  9. Bridge, J.; Harding, S.; Zheng, Y. Development and validation of a novel prognostic model for predicting AMD progression using longitudinal fundus images. BMJ Open Ophthalmol. 2020, 5, e000569. [Google Scholar] [CrossRef]
  10. Zeng, L.; Zhang, J.; Chen, W.; Ding, Y. Dynamic Prediction using Time-Dependent Cox Survival Neural Network. arXiv 2023, arXiv:2307.05881. [Google Scholar]
  11. He, K.; Chen, X.; Xie, S.; Li, Y.; Dollár, P.; Girshick, R. Masked autoencoders are scalable vision learners. In Proceedings of the IEEE/CVF Conference on Computer Vision and Pattern Recognition, New Orleans, LA, USA, 18–24 June 2022; pp. 16000–16009. [Google Scholar]
  12. Zhou, Y.; Chia, M.A.; Wagner, S.K.; Ayhan, M.S.; Williamson, D.J.; Struyven, R.R.; Liu, T.; Xu, M.; Lozano, M.G.; Woodward-Court, P.; et al. A foundation model for generalizable disease detection from retinal images. Nature 2023, 622, 156–163. [Google Scholar] [CrossRef] [PubMed]
  13. Fritsche, L.G.; Igl, W.; Bailey, J.N.; Grassmann, F.; Sengupta, S.; Bragg-Gresham, J.L.; Burdon, K.P.; Hebbring, S.J.; Wen, C.; Gorski, M.; et al. A large genome-wide association study of age-related macular degeneration highlights contributions of rare and common variants. Nat. Genet. 2016, 48, 134–143. [Google Scholar] [CrossRef]
  14. Ding, Y.; Liu, Y.; Yan, Q.; Fritsche, L.G.; Cook, R.J.; Clemons, T.; Ratnapriya, R.; Klein, M.L.; Abecasis, G.R.; Swaroop, A.; et al. Bivariate Analysis of Age-Related Macular Degeneration Progression Using Genetic Risk Scores. Genetics 2017, 206, 119–133. [Google Scholar] [CrossRef]
  15. Zhou, X.; Zhang, J.; Ding, Y.; Huang, H.; Li, Y.; Chen, W. Predicting late-stage age-related macular degeneration by integrating marginally weak SNPs in GWA studies. Front. Genet. 2023, 14, 1075824. [Google Scholar] [CrossRef]
  16. Ganjdanesh, A.; Zhang, J.; Chen, W.; Huang, H. Multi-modal genotype and phenotype mutual learning to enhance single-modal input based longitudinal outcome prediction. In Research in Computational Molecular Biology, Proceedings of the 26th International Conference, San Diego, CA, USA, 22–25 May 2022; Springer: Berlin/Heidelberg, Germany, 2022; pp. 209–229. [Google Scholar]
  17. Ganjdanesh, A.; Zhang, J.; Yan, S.; Chen, W.; Huang, H. Multimodal genotype and phenotype data integration to improve partial data-based longitudinal prediction. J. Comput. Biol. 2022, 29, 1324–1345. [Google Scholar] [CrossRef]
  18. Yan, Q.; Weeks, D.E.; Xin, H.; Swaroop, A.; Chew, E.Y.; Huang, H.; Ding, Y.; Chen, W. Deep-learning-based Prediction of Late Age-Related Macular Degeneration Progression. Nat. Mach. Intell. 2020, 2, 141–150. [Google Scholar] [CrossRef]
  19. Hochreiter, S.; Schmidhuber, J. Long short-term memory. Neural Comput. 1997, 9, 1735–1780. [Google Scholar] [CrossRef]
  20. Venugopalan, J.; Tong, L.; Hassanzadeh, H.R.; Wang, M.D. Multimodal deep learning models for early detection of Alzheimer’s disease stage. Sci. Rep. 2021, 11, 3254. [Google Scholar] [CrossRef]
  21. Cao, J.; Long, X. RACF: A Multimodal Deep Learning Framework for Parkinson’s Disease Diagnosis Using SNP and MRI Data. Appl. Sci. 2025, 15, 4513. [Google Scholar] [CrossRef]
  22. Li, Y.; Niu, D.; Qi, K.; Liang, D.; Long, X. An imaging and genetic-based deep learning network for Alzheimer’s disease diagnosis. Front. Aging Neurosci. 2025, 17, 1532470. [Google Scholar] [CrossRef] [PubMed]
  23. Age-Related Eye Disease Study Research Group. The Age-Related Eye Disease Study system for classifying age-related macular degeneration from stereoscopic color fundus photographs: The Age-Related Eye Disease Study Report Number 6. Am. J. Ophthalmol. 2001, 132, 668–681. [Google Scholar] [CrossRef]
  24. Lee, J.; Wanyan, T.; Chen, Q.; Keenan, T.D.; Glicksberg, B.S.; Chew, E.Y.; Lu, Z.; Wang, F.; Peng, Y. Predicting age-related macular degeneration progression with longitudinal fundus images using deep learning. In Machine Learning in Medical Imaging, Proceedings of the 13th International Workshop, Singapore, 18 September 2022; Springer: Berlin/Heidelberg, Germany, 2022; pp. 11–20. [Google Scholar]
  25. Ghahramani, G.; Brendel, M.; Lin, M.; Chen, Q.; Keenan, T.; Chen, K.; Chew, E.; Lu, Z.; Peng, Y.; Wang, F. Multi-task deep learning-based survival analysis on the prognosis of late AMD using the longitudinal data in AREDS. In AMIA Annual Symposium Proceedings; American Medical Informatics Association: Washington, DC, USA, 2021; p. 506. [Google Scholar]
  26. Sudlow, C.; Gallacher, J.; Allen, N.; Beral, V.; Burton, P.; Danesh, J.; Downey, P.; Elliott, P.; Green, J.; Landray, M.; et al. UK biobank: An open access resource for identifying the causes of a wide range of complex diseases of middle and old age. PLoS Med. 2015, 12, e1001779. [Google Scholar] [CrossRef] [PubMed]
  27. Huang, D.; Swanson, E.A.; Lin, C.P.; Schuman, J.S.; Stinson, W.G.; Chang, W.; Hee, M.R.; Flotte, T.; Gregory, K.; Puliafito, C.A. Optical coherence tomography. Science 1991, 254, 1178–1181. [Google Scholar] [CrossRef]
  28. Roorda, A.; Romero-Borja, F.; Donnelly III, W.J.; Queener, H.; Hebert, T.J.; Campbell, M.C. Adaptive optics scanning laser ophthalmoscopy. Opt. Express 2002, 10, 405–412. [Google Scholar] [CrossRef]
Figure 1. Architecture and workflow of time-varied LSTM for predicting late AMD progression using longitudinal fundus images and genotype data.
Aisens 01 00006 g001
Figure 2. Illustration of enhanced sample size utilization by TV-LSTM compared to regular LSTM in predicting future advanced AMD risk. Note that while uneven intervals can be used in regular LSTM, the intervals are typically fixed and must remain consistent across training and testing. In contrast, our model allows for flexible intervals, accommodating variability in time gaps.
Aisens 01 00006 g002
Figure 3. Precision recall curves of the prediction of late AMD progression time in two years with different number of visits as predictors. (a) shows the results from the regular LSTM model using images only. (b) presents the results from the regular LSTM model using both images and genotypes. (c) illustrates the results from the TV-LSTM model using images only. (d) displays the results from the TV-LSTM model using both images and genotypes.
Aisens 01 00006 g003
Figure 4. Precision recall curves of the prediction of late AMD progression time in two years across five models: baseline MLP model using images only, regular LSTM using images only, regular LSTM using both images and genotypes, TV-LSTM using images only, and TV-LSTM using both images and genotypes. (a) shows the results using 3 historical visits as predictors. (b) presents the results using 4 historical visits as predictors. (c) displays the results using 5 historical visits as predictors.
Aisens 01 00006 g004
Figure 5. Training dynamics of the TV-LSTM model (4 visits as predictors) across epochs. (a) Training and validation loss curves illustrating the learning progression and potential overfitting beyond epoch 20. (b) Test AUC-PR scores, highlighting an early peak and subsequent stabilization. (c) Test AUC-ROC scores demonstrating initial improvement followed by fluctuations.
Aisens 01 00006 g005
Table 1. Summary of sample size in different settings.
PredictorsNumber of Participants (Number of Eyes)
TotalTrainingValidationTesting
Single visit2521 (30,653)2041 (24,896)227 (2676)253 (3081)
Regular LSTM with Even Interval2 visits2458 (4787)1990 (3872)222 (433)246 (482)
3 visits2217 (4266)1795 (3462)200 (378)222 (426)
4 visits1558 (3002)1261 (2427)141 (274)156 (301)
5 visits1057 (2044)855 (1651)96 (186)106 (207)
TV-LSTM with Uneven Interval2 visits2523 (4936)2043 (4003)227 (440)253 (493)
3 visits2424 (4705)1962 (3809)219 (431)243 (465)
4 visits 2185 (4244)1769 (3440)197 (383)219 (421)
5 visits1943 (3790)1573 (3068)175 (342)195 (380)
Table 2. Comparison of AUC in predicting 2-year late AMD risk between models.
AUC-ROCAUC-PR *
Yan et al. [18]0.85-
Lee et al. [24]0.883-
Ganjdanesh [17]0.896-
Ghahramani et al. [25]0.9460.248
Baseline model in this paper (MLP using RetFound embeddings)0.92850.8059
TV-LSTM with genotype in this paper0.94790.8591
* AUC-PR is not available in Yan, Lee, and Ganjdanesh’s work.
Disclaimer/Publisher’s Note: The statements, opinions and data contained in all publications are solely those of the individual author(s) and contributor(s) and not of MDPI and/or the editor(s). MDPI and/or the editor(s) disclaim responsibility for any injury to people or property resulting from any ideas, methods, instructions or products referred to in the content.

