
Proceeding Paper

Urban Geo-Thermodynamics Mechanism of Surface Warming for Thermal Risk Assessment in the Haldia Urban-Industrial Region: A Mathematical Integrated Approach for Sustainable Urban Heat Resilience †

Department of Geography, Faculty of Earth Science, Indira Gandhi National Tribal University, Amarkantak 48487, Madhya Pradesh, India
*
Author to whom correspondence should be addressed.
Presented at the 1st International Online Conference on Urban Sciences (IOCUS 2026), 20–22 May 2026; Available online: https://sciforum.net/event/IOCUS2026.
Environ. Earth Sci. Proc. 2026, 45(1), 5; https://doi.org/10.3390/eesp2026045005
Published: 3 August 2026

Abstract

Rapid urban-industrial development has intensified surface warming in global cities, including India, posing critical challenges for sustainable urban environments. While advanced AI and remote sensing methods have mapped urban heat patterns, a fundamental thermodynamic understanding of how cities generate, absorb, store, and dissipate heat with the urban land transformation remains underexplored. This study conceptualizes the urban geo-thermodynamics mechanism as a comprehensive framework to quantify urban surface energy exchanges, heat flux dynamics, and thermal responses in the Haldia urban-industrial region (103.84 km2) of eastern India. The analysis employs Landsat-derived impervious surface expansion, land surface temperature (LST), and normalized difference vegetation index (NDVI), NASA POWER radiation fluxes, world settlement footprint 3D structural (2023) and material stock (2024) data, and census-based population records (1991–2021). The integrated mathematical formulations were developed after the remote sensing-GIS-based statistical analysis for the urban energy balance through the Urban Thermodynamic Index (UTI), Urban Heat Retention Efficiency (UHRE), and Urban Cooling Potential (UCP) indices, which were developed from energy balance equations linking net radiation (Q*), anthropogenic flux ( Q F ), sensible and ground heat ( Q H , Q G ), and latent heat flux ( Q E ). The results reveal a 36% increase in UTI and a 28% rise in UHRE between 1991 and 2021, indicating enhanced surface heat accumulation and anthropogenic energy input associated with built-up area and population growth (22.87–53.37 km2) and (1452–2375 person/km2). In contrast, UCP declined by 22%, reflecting reduced evaporative cooling due to vegetation loss, with the regression-based calibration (R2 = 0.89; RMSE = 0.74 °C) validating strong correspondence with observed LST. These findings demonstrate a quantifiable link between thermodynamic processes and the transformation of the urban morphological landscape. The proposed mathematical-thermodynamic structure provides a scientific, GIS-based statistical method for urban heat risk assessment, energy-efficient planning, and geo-thermal environmental management, supporting global initiatives toward climate-resilient and sustainable urban development.

1. Introduction

Urbanization has transformed the Earth’s surface into complex thermodynamic systems where impervious surfaces, anthropogenic heat, and altered energy exchanges reshape local and regional climates. Globally, cities account for over 70% of energy-related emissions and are principal hotspots of surface and atmospheric warming due to dense built-up materials with high heat capacity and low albedo. These urban-induced energy imbalances give rise to the Urban Heat Island (UHI) and Urban Heat Anomaly (UHA) phenomena, in which impervious surfaces experience elevated surface and air temperatures relative to their pervious-surface surroundings. In India, rapid urban-industrial expansion across coastal regions has intensified surface heat accumulation, particularly in emerging industrial towns such as Haldia, where massive land transformation, port-industrial activities, and energy-intensive infrastructure have redefined the geo-thermodynamic equilibrium of the urban environment. Existing research on urban thermal environments has primarily focused on correlating land surface temperature (LST) with normalized difference vegetation index (NDVI) or impervious surface fraction using geospatial analysis, without adequately addressing the underlying thermodynamic mechanisms that govern heat generation, absorption, storage, and dissipation. Moreover, most studies rely on statistical or remote sensing correlations that lack physical realism in quantifying urban thermal fluxes, thereby ignoring key parameters such as albedo modification, material heat capacity, and the imbalance between latent and sensible heat fluxes, as well as their spatiotemporal evolution. Consequently, the sustainability dimension of urban heat resilience remains underexplored in the recent literature [1,2,3].
This study bridges these precarious gaps by developing an integrated mathematical equation-based geo-thermodynamic framework that combines remote sensing, energy balance modeling, and statistical validation to evaluate surface heat dynamics in the Haldia urban-industrial region. Multi-temporal Landsat-derived built-up maps (1991–2021), World Settlement Footprint 3D (WSF-2023) and Material Stock (WSF-2024) datasets, NASA POWER thermal-solar flux data, and Indian Census population records were synergized to quantify the evolution of urban heat conditions. The model incorporates LST, NDVI, albedo, shortwave irradiance, temperature, and dew point within a unified thermodynamic equation system that reveals how built-up area, volume, height, fraction, and material composition, such as biomass, fissile fuel, minerals, and metals, regulate urban heat retention and dissipation in the growing urban-industrial system. Validation was achieved using statistical performance metrics, coefficient of determination (R2), root mean square error (RMSE), and mean square error (MSE), ensuring physical credibility and robustness of the modeled relationships, with the demonstration of how the impervious surface expansion and vertical material stock significantly enhance radiative forcing and surface warming, while vegetation and high-albedo zones provide compensatory cooling effects. The methodological integration of the remote sensing GIS-based geospatial analysis lies in its mathematically grounded approach that transcends conventional LST-NDVI correlation analyses by explicitly linking physical heat flux processes with spatial urban morphology and material thermodynamics. This approach not only quantifies but also explains the cause-and-effect mechanism of surface warming driven by urbanization and industrialization, offering a replicable, quantitative analytical framework for developing regions worldwide, especially in the Global South. The findings provide scientific evidence and practical tools for urban planners and climate researchers to integrate energy-balance-based thermal diagnostics into sustainable land-use, infrastructure, and environmental policy design, and contribute to a transformative understanding of how cities thermodynamically evolve under anthropogenic stress and how future urban systems can be strategically managed to achieve resilient, sustainable urban heat mitigation [2,3,4,5,6].

2. Materials and Methods

2.1. Study Area

The study area, Haldia urban-industrial region, lies between 22°01′00″–22°08′43″ N and 88°01′21″–88°11′43″ E, with a coverage of 110 km2, positioned at the confluence of the Hooghly and Haldi rivers. It is an alluvial coastal deltaic floodplain region, with an average elevation of 8–10 m above the mean sea level (MSL). The built-up area increased (22.87–53.37 km2) with population growth (100,347–261,000) (1991–2021). The emerging petrochemical industries include Indian Oil Corporation (IOC), Tata Chemicals, Mitsubishi Chemical Corporation (MCC-PTA), Haldia Petrochemical Ltd. (HPL), Reliance Industries, and Haldia Industrial Park (334 acres). The increasing imperviousness of the built-up area plays a significant role in regulating local temperature variation at diurnal, seasonal, and annual scales. The annual average temperature is 20–25 °C with 1580 mm annual precipitation. The annual air temperature range is 18–30 °C, the summer range is 30–40 °C, and the winter range is 15–28 °C, while the minimum temperature range is 8–27 °C, and the maximum is 26–40 °C; the land surface temperature range is 18–31 °C, and the Earth’s skin temperature range is 18.5–32 °C, which comprises 25–28 °C isotherm, extended to the Bay of Bengal [1,3].

2.2. Data Sources

The built-up impervious surface was estimated using angular and Euclidean similarity distances from Landsat imagery with the Spectral Angle Mapper (SAM) machine learning algorithm. The radiative heat fluxes and albedo were calculated from NASA-POWER-DAV using inverse distance weighting (IDW) interpolation. The building characteristics and structural properties were computed from the WSF 3D data series of the German Aerospace Research Center (DLR) processed in Google Earth Engine (GEE), ArcGIS 10.8.2, and QGIS 3.28 LTR (Table 1) (Supplementary Materials).
Q*, QF, QH, QG and QE are used within an integrated diagnostic framework, not interpreted as independently measured fluxes at every spatial and temporal scale. Q* is characterized using NASA POWER radiation and albedo information, while anthropogenic forcing is represented using population and industrial-growth indicators. LST and thermal conditions provide information on sensible-heating response, vegetation characteristics represent latent-cooling potential, and WSF-3D structural and material-stock information indicates the potential for heat storage and retention only for the recent year (2023 and 2024); they were used only to characterize contemporary urban morphology and material composition and were not back-cast or used as direct substitutes for historical conditions.

2.3. Built-Up Pixel Extraction

The built-up area was estimated, classified, and extracted after atmospheric and radiometric pre-correction. Built-up pixels were extracted using optimal thresholds from the histogram of index-based built-up index (IBI) values (empirically verified by visual interpretation and reference maps). Post-classification refinement was performed using the SAM machine learning algorithm and validated against the ground truth and high-resolution Google Earth data [5].

2.4. LST Retrieval

LST measures the skin temperature of the Earth’s surface by capturing thermal infrared radiation and helps identify hotspots. By correlating LST with impervious surfaces and vegetation loss, urban planners can develop effective mitigation strategies to enhance urban environmental resilience. LST was retrieved by applying the Mono-Window Algorithm (MWA) for Landsat 5–7 (TM/ETM+) and the Split-Window Algorithm (SWA) for Landsat 5–7 (OLI/TIRS) with the help of the radiative transfer equations. The preferred thermal bands were selected using Landsat-5 band 6 and Landsat-8 band 10. After the band selection, the DN were converted into spectral radiance (SR), applied (Equation (1)) for Landsat-5 and (Equation (2)) for Landsat-8. LST and its spectral properties were retrieved through Tian et al. (2023) [7], Vohra et al. (2024) [8], and Duan et al. (2025) [4].
L λ = ( L M a x L M i n ) ( Q C a l m a x Q C a l m i n ) × Q C a l Q C a l m i n + L M i n
L λ = M L × Q C a l + A L
where L λ is the spectral radiance ( W · m 2 · s r 1 · μ m 1 ) ; Q C a l refers to the DN value; L M a x and L M i n are radiance rescaling factors; and ML and AL are radiance multiplicative and additive scaling factors, respectively.
Then, spectral radiance is converted to at-sensor brightness temperature ( T B )   applied in (Equation (3))
T B = K 2 ln k 1 L λ + 1
where T B is the brightness temperature (Kelvin), and K 1 and K 2   are thermal calibration constants. For Landsat-5, K 1 = 607.76   and   K 2 = 1260.56, for Landsat-7, K 1 = 666.09   and   K 2 = 1282.7 , and Landsat-8, K 1 = 774.89   and   K 2 = 1321.08 .
Estimation of surface albedo (α) and NDVI from optical bands is required to determine energy absorption and evapotranspiration potential. The normalized difference vegetation index (NDVI) computed by Equation (4) is required to estimate emissivity as a mandatory step because emissivity depends on vegetation proportion.
N D V I = B N I R B R e d B N I R + B R e d
where B N I R is the Band-4 Near Infrared (NIR), and B R e d is the Band-3 Red.
After calculating the NDVI, the study tries to find out the proportion of vegetation ( P v ) applied (Equation (5)).
P v = N D V I N D V I M i n N D V I M a x N D V I M i n 2
where N D V I M a x a n d N D V I M i n are extracted from the NDVI raster statistics.
Then, the Land Surface Emissivity (LSE) was computed from ( P v ) using (Equation (6)).
ε = 0.004 × P v + 0.986
After computation of LSE, the T B   was converted into LST (Equation (7)). Mean ( L S T ¯ ) and standard deviation ( L S T σ ) of LST were derived for the better spectral analysis of statistical properties and variation, applied in (Equations (8) and (9)), respectively, and the Kelvin LST was converted to Celsius using (Equation (10)).
L S T = T B 1 + λ T B ρ l n ε
L S T ¯ = i = 1 N x N
L S T σ = i = 1 n | x x | ¯ n
L S T ° C = L S T k 273.15
where λ is the wavelength of the thermal band (TM/ETM+: 11.45   μ m , and TIRS Band-10: 10.895 μ m ), ρ = h c σ = 1.438 × 10 2   m K , L S T k   refers to the LST in Kelvin, and ε is the emissivity.

2.5. Theoretical Formulation of Urban Geo-Thermodynamic

UTI, UHRE, and UCP are formulated as dimensionless, thermodynamically informed diagnostic indicators derived from the surface-energy-balance framework. Myrup (1969) [9], Hartmann et al. (1992) [6], Oke (2017) [10], Mills et al. (2022) [11], and Saha et al. (2024) [12] directly support those urban geo-thermodynamic concepts, which essentially indicate that UTI describes the energy imbalance, that is, how much heat stays trapped and dissipated, UHRE defines the thermal storage capacity of the urban surface, and UCP refers to the cooling efficiency through moisture and vegetation.
The proposed framework is derived from the partitioning of available urban energy among sensible heating, latent cooling, and storage-related components. Accordingly, the indices represent different diagnostic aspects of urban energy partitioning rather than independent fundamental thermodynamic laws. Those parameters collectively represent the primary thermodynamic behavior of cities in generating, absorbing, storing, and dissipating heat. As built-up expansion increases, impervious surfaces enhance net radiation (Q*), anthropogenic flux ( Q F ), and sensible and ground heat ( Q H ,   Q G ), while reducing latent heat flux ( Q E ). Consequently, UTI and UHRE increase, indicating greater heat storage and retention, whereas UCP decreases, reflecting diminished evaporative cooling. The theoretical derivation of the surface energy balance, based on Equation (11) (Table 2), quantifies the urban energy imbalance, revealing how land transformation drives thermal accumulation and reduces urban heat resilience [6,9,10,11,12,13].
Q + Q F = Q H + Q E + Q G
UTI expresses a composite diagnostic ratio of total absorbed and anthropogenic energy (Q* + Q F ) to the dissipated energy (latent + sensible heat flux, Q E + Q H ) (Equation (12)) and quantifies the urban energy disequilibrium, i.e., how much incoming energy remains trapped versus dissipated, the fundamental driver of UHI formation with relative energy imbalance or accumulation-to-dissipation condition [7,8,9,10,12,13,14].
U T I = Q + Q F Q E + Q H
High UTI indicates greater energy storage or retention in the urban system, suggesting strong heat accumulation and a positive energy imbalance, while low UTI indicates efficient energy dissipation through evapotranspiration and convection, implying better thermal regulation.
UHRE measures the proportion of Q* converted into QH and QG, the two forms of heat storage and re-emission (Equation (13)), and tries to define the thermal inertia of the urban surface system, how effectively the city stores daytime heat and releases it later, influencing nighttime UHI intensity and thermal comfort [7,12,13].
U H R E = Q H + Q G Q
High UHRE denotes strong thermal retention in built-up impervious surfaces, and low UHRE indicates rapid heat dissipation and lesser nighttime heat storage.
UCP states the fraction of total available energy dissipated through QE, i.e., via evapotranspiration from vegetation and water (Equation (14)), and computes the biophysical cooling pathway, showing how efficiently the urban surface transforms absorbed energy into latent cooling, thereby directly counteracting excess heat storage.
U C P = Q E Q + Q F
High UCP indicates strong surface cooling capacity and urban climate resilience, while low UCP indicates limited evaporative cooling, common in densely built-up or impervious areas. Together, UTI, UHRE, and UCP characterize the three essential thermodynamic dimensions of urban systems: Energy absorption and accumulation related to UTI, heat storage and re-emission related to UHRE, and evaporative dissipation and cooling related to UCP, which combine to overcome the limitation of only using LST or albedo to infer urban heat. Instead, it provides a quantitative, process-based understanding of how urban form and land use regulate energy fluxes, helping assess urban heat sustainability. An equation-based relationship established energy-partitioning indicators. The Bowen ratio measures the ratio of sensible to latent heat ( β = Q H / Q E ); The evaporative fraction measures the proportion of available turbulent energy allocated to latent heat ( E F = Q F / Q H + Q E ). Surface UHI (SUHI) represents the thermal outcome, whereas UTI, UHRE, and UCP diagnose different energy-partitioning conditions that may contribute to that outcome ( S U H I = L S T u r b a n L S T r u r a l ) [7,8,12,13].
The proposed UTI, UHRE, and UCP formulations were examined for dimensional consistency, as each index is expressed as a ratio of energy-flux terms in equivalent units (W m−2), yielding dimensionless diagnostic measures. A one-at-a-time perturbation analysis was performed by varying each constituent energy-balance term by 20% while keeping the remaining terms constant. This assessment evaluates the mathematical responsiveness and robustness of the indices to variations in their constituent fluxes. The sensitivity structure indicates that UTI increases with Q* and Q F but decreases with Q E and Q H ; UHRE increases with Q H   and Q E ; and UCP increases with Q E but decreases with Q* and Q F [7,8].

2.6. Statistical Corroboration and Robustness Assessment

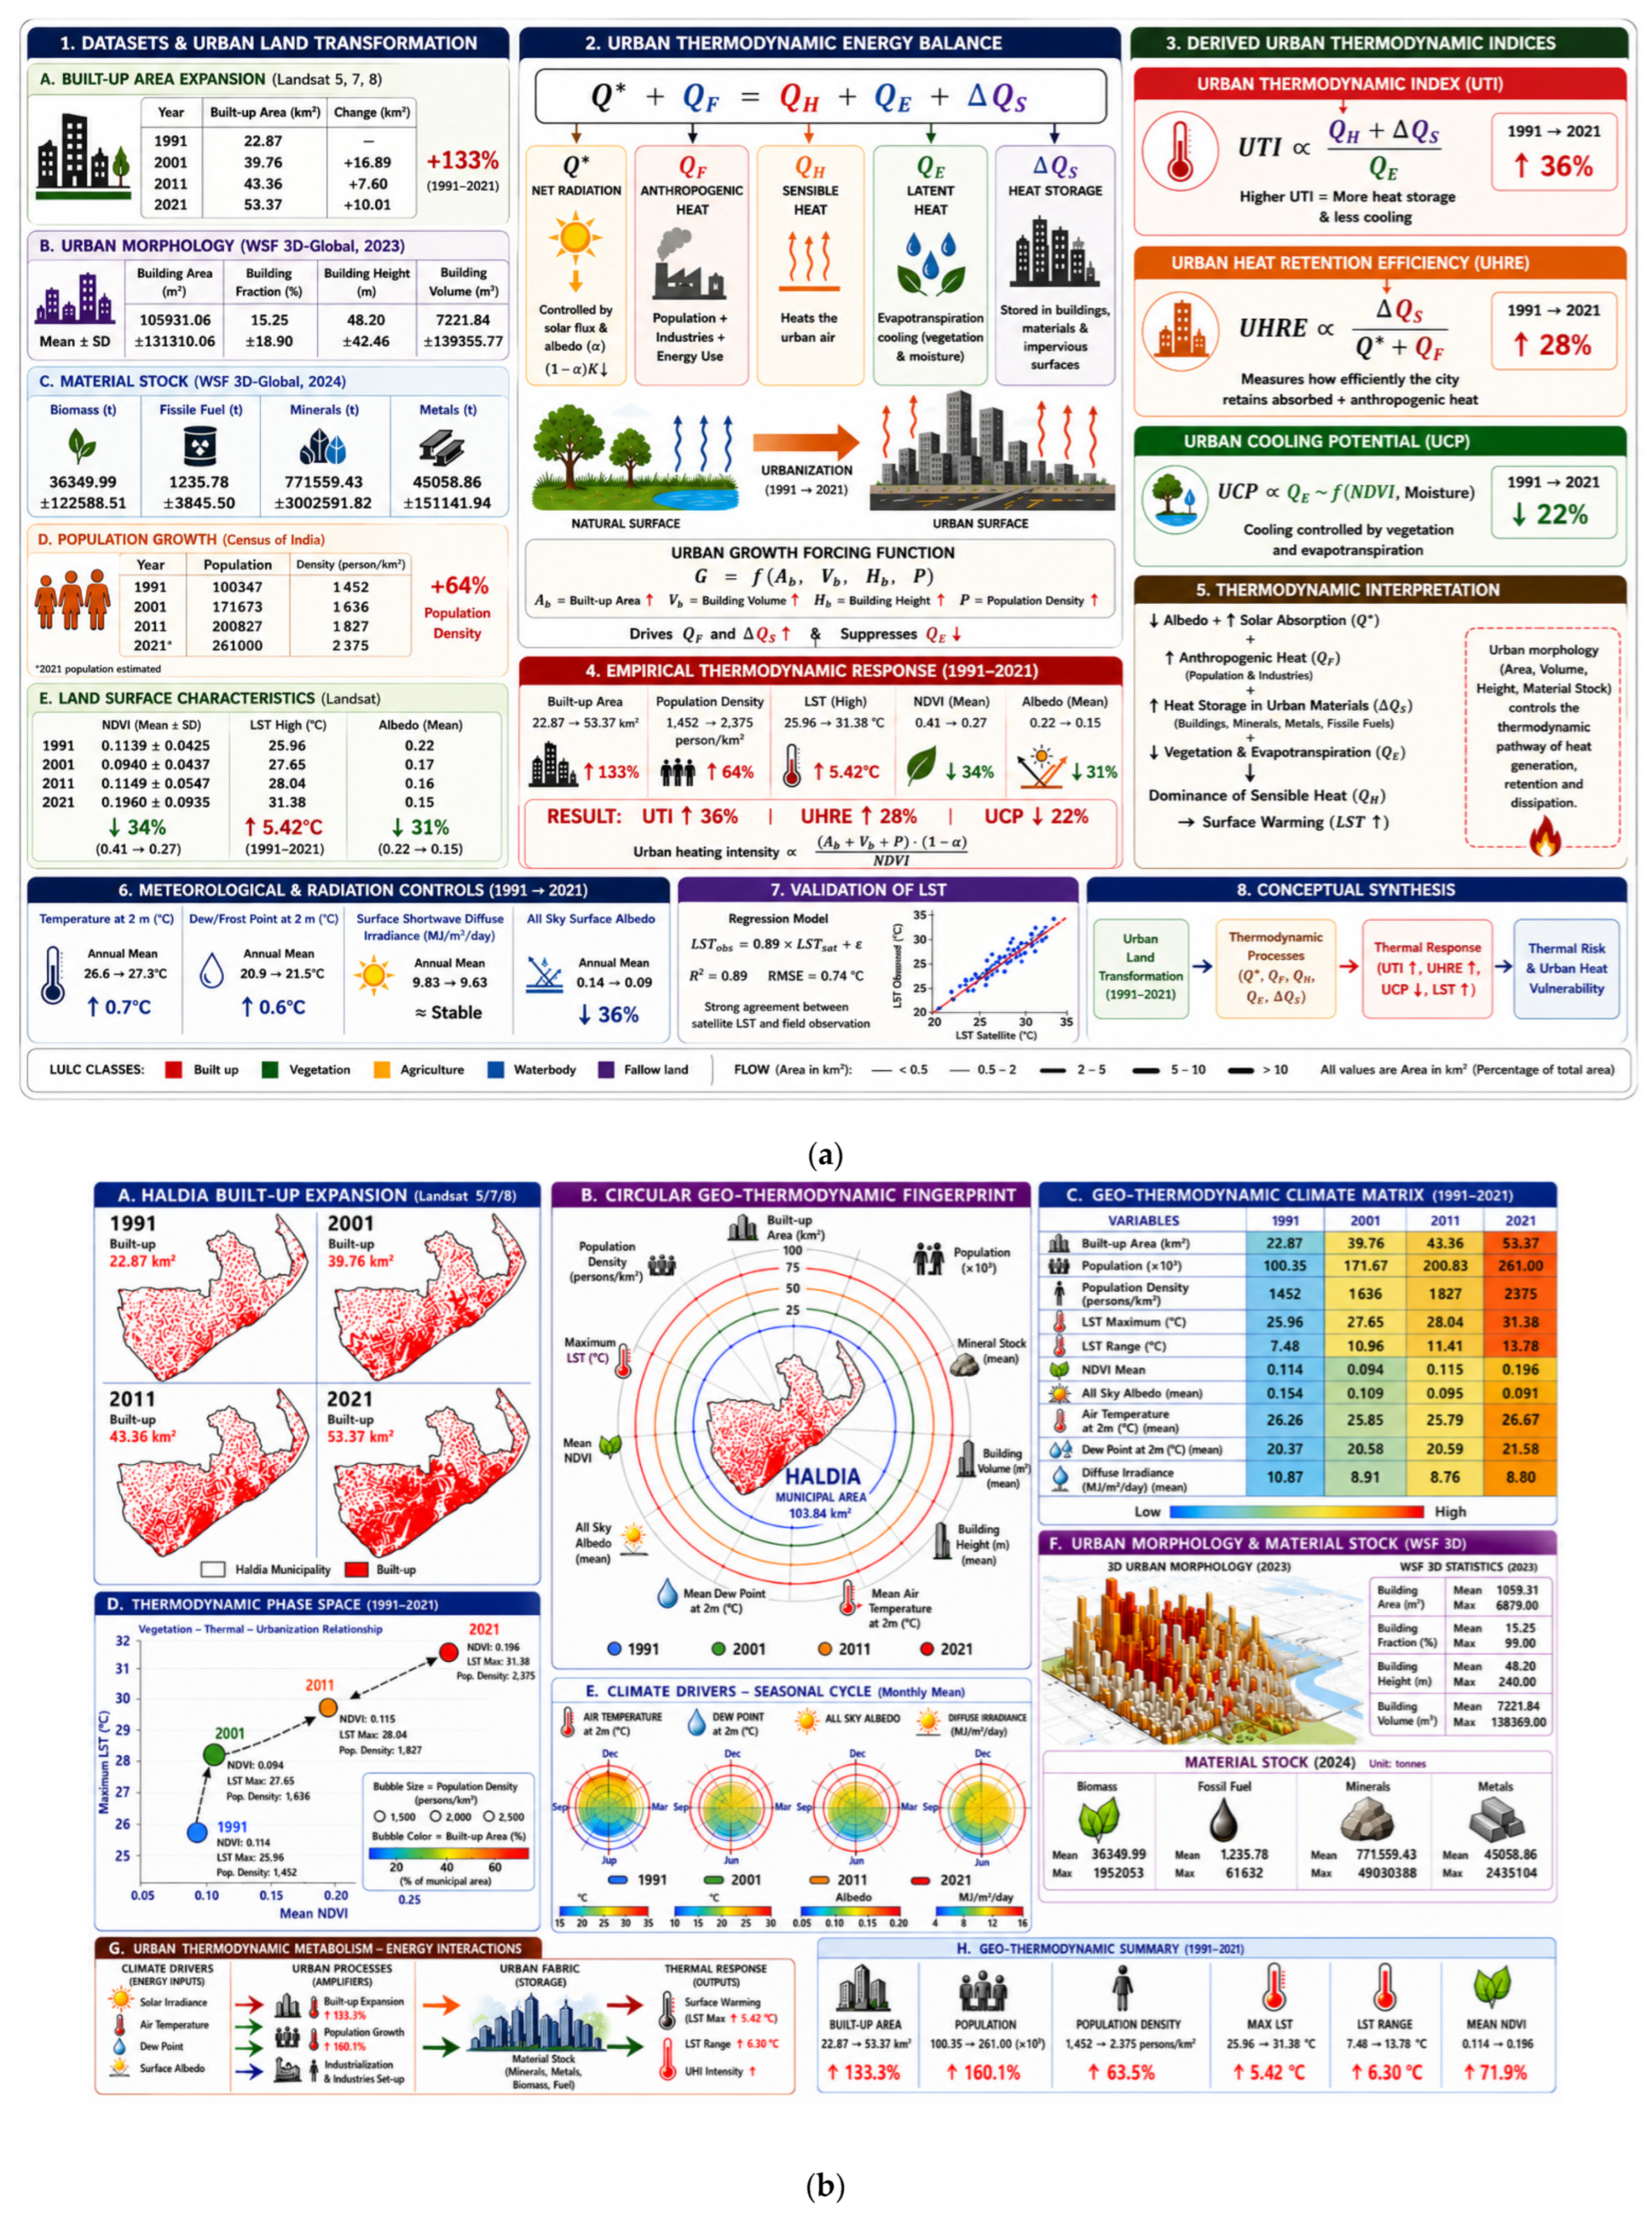
Regression analysis was used to evaluate the statistical correspondence between observed LST variability and selected urban, environmental, and energy-related predictors, including built-up fraction, NDVI, albedo, population density, heat-storage capacity (HSC) proxy, and incoming shortwave radiation. The model explained 89% of the observed LST variance (R2 = 0.89), with an RMSE of 0.74 °C and MSE of 0.55 °C, indicating strong statistical correspondence between surface thermal variability and the selected predictor set (Figure 1a). However, because several predictors are conceptually related to the formulation and interpretation of UTI, UHRE, and UCP, the regression results are interpreted as statistical corroboration rather than independent validation of the proposed indices or their underlying energy-flux estimates. The potential for partial circularity is therefore acknowledged. Accordingly, the results support the consistency of the proposed thermodynamic interpretation with observed LST patterns but do not replace independent validation based on direct flux observations, eddy-covariance measurements, or other independent energy-balance observations. Independent physical validation remains an important direction for future research.

3. Results and Discussion

3.1. Urban Expansion and Surface Heat Modification

Haldia’s built-up surface expanded 22.87–53.37 km2 (1991–2021), converting over half the municipal area into impervious cover and intensifying the local urban energy imbalance. WSF-3D reveals an average building height of 48 m and a mean pixel volume of 7200 m3, indicating increased thermal mass and vertical material stocks that enhance sensible and ground-heat retention. These observations provide contemporary evidence of the structural and material conditions that may contribute to heat retention in the present-day urban system. High mineral and metal densities further elevate urban heat capacity. Concurrently, mean LST rose by 5.4 °C, while albedo declined (0.15–0.07), reflecting diminished radiative loss and stronger shortwave absorption. NDVI fluctuations and vegetation loss reduced latent cooling efficiency. Strong correlations (r = 0.93 for built-up-LST; r = −0.75 for albedo-LST) confirm that morphological densification and material intensification amplify heat storage, weaken dissipation, and reinforce the geo-thermodynamic feedback driving persistent surface warming (Figure 1b) [14,15].

3.2. Thermodynamics Variations

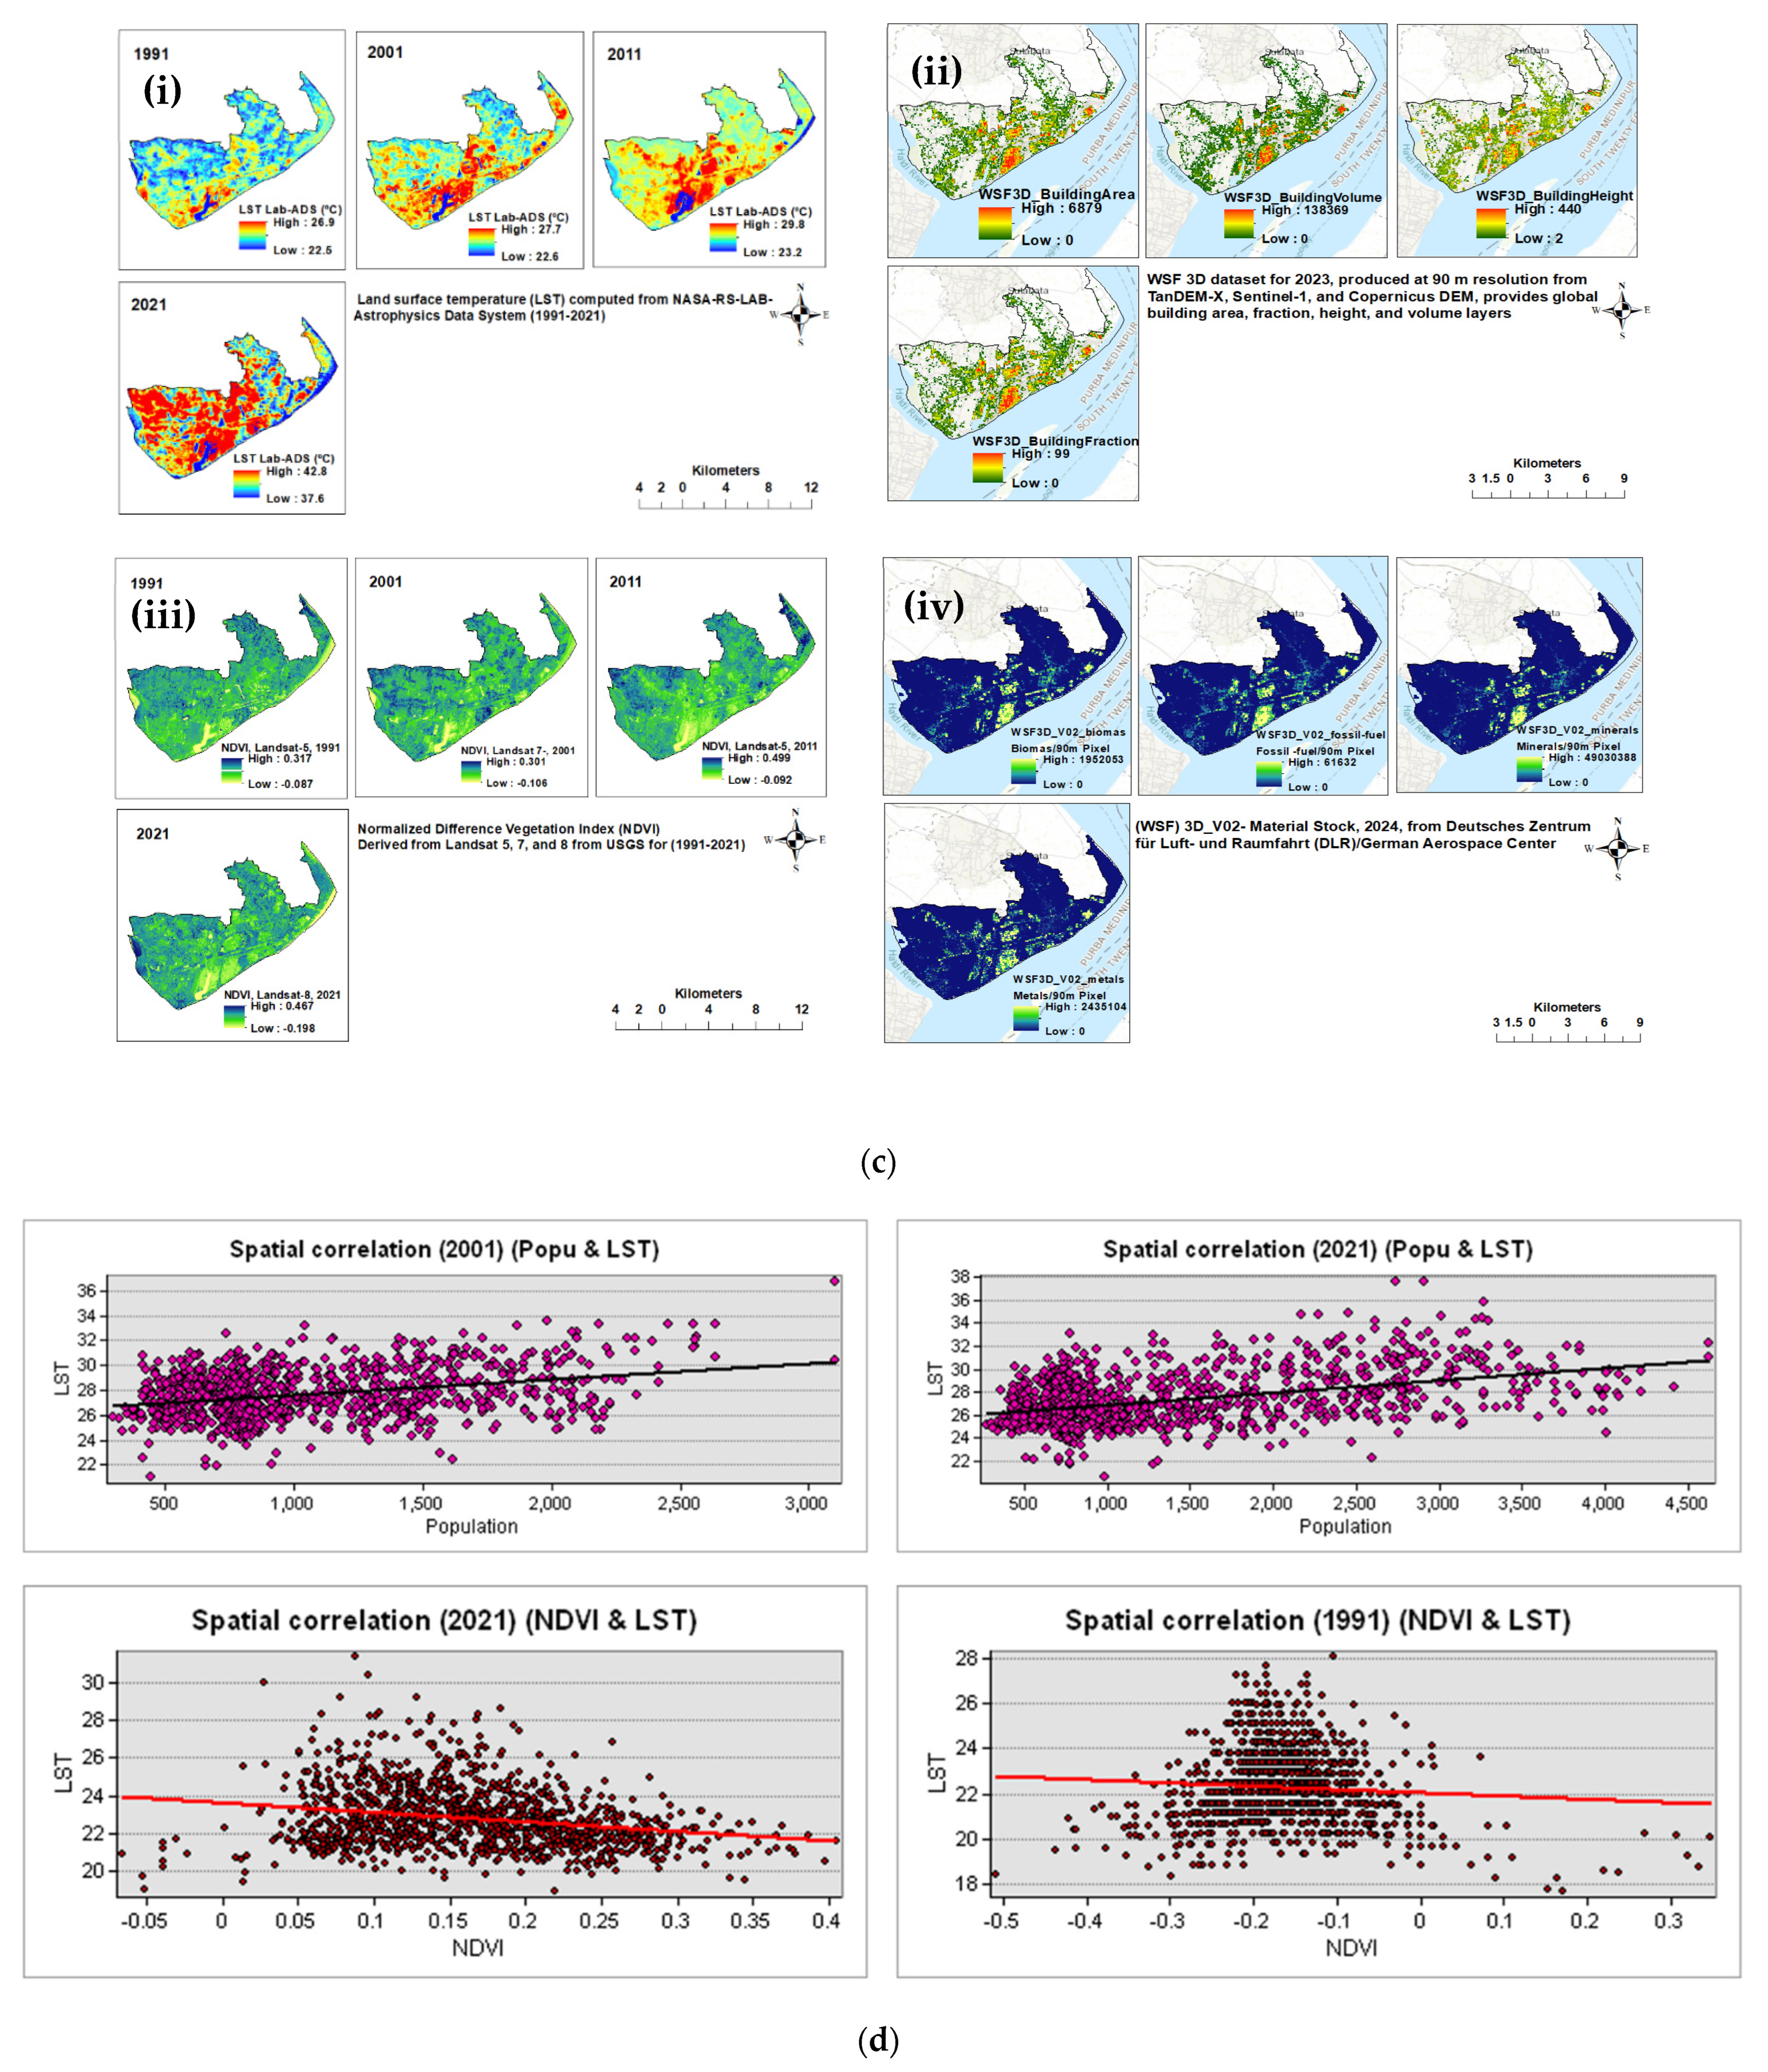
The urban geo-thermodynamics mechanism clarifies how the urban system sequentially generates, absorbs, stores, and dissipates heat under rapid land transformation. QF rose sharply as population density nearly doubled (1452 to 2375 persons/km2), intensifying sensible heat release and correlating strongly with LST (r = 0.99). Declining albedo (0.15 to 0.09) enhanced shortwave absorption by 20–30 W/m2, directly increasing surface heating. Structural intensification (mean height: 48.2 m; material density: 2000 kg/m3) increased urban heat storage capacity (HSC = 104 J · m−2 · K−1), thereby sustaining nocturnal warmth. Vegetation-related lower NDVI latent-cooling potential was inferred to decline with increasing urban imperviousness, thereby reducing QE and weakening cooling efficiency. Consequently, UTI (+36%) and UHRE (+28%) increased, while UCP (−22%) declined, indicating that greater radiative absorption, anthropogenic forcing, and material storage collectively drive amplified and persistent surface warming (Figure 1b,c) [7,12,13].

3.3. Surface Energy Variation and Risk Assessment

The spatial heterogeneity of surface energy fluxes across the urban-industrial region reveals distinct thermal risk zones emerging from land transformation and material intensification. The shift in net radiation balance due to declining albedo and vegetation cover elevated the sensible heat flux by nearly 35–45 W/m2, while the latent heat flux diminished proportionally, indicating a weakened evapotranspiration regime. This imbalance heightened surface heat storage, particularly in high-density built-up and industrial clusters where anthropogenic heat flux is most concentrated. The cumulative effect manifests as elevated urban heat risk index (UHRI) values, especially around port-industrial and transport corridors, where nocturnal heat release remains limited [7,8,14].
Thermal risk mapping indicates that over 40% of the municipal area now experiences moderate to high heat stress, posing critical implications for urban livability, energy demand, and public health. The persistence of high surface enthalpy and low radiative efficiency signifies a transition from a balanced to an energy-saturated urban system, increasing vulnerability to heat extremes. The coupling of increased anthropogenic forcing with reduced UCP underscores an urgent need for adaptive planning, including reflective roofing, vegetated buffers, and low-emissivity materials to mitigate rising thermal risks and restore local surface energy equilibrium (Figure 1b–d) [8,14,15].

3.4. Implications for Urban Heat Resilience

In the urban-industrial region, the integrated thermodynamic indices provide a quantitative framework for identifying urban heat vulnerability and guiding climate-resilient planning. The delineation of thermal zones distinguishes high-intensity heat islands from residual cooling pockets, offering spatial insights for targeted interventions. Built-up densification and industrial concentration exacerbate anthropogenic heat flux and nocturnal heat retention, underscoring the need for reflective materials, green corridors, and water-sensitive urban design to restore surface energy balance. By operationalizing these indices within urban policy and master planning, Haldia can transition toward a thermally adaptive city model, enhancing human comfort, reducing energy demand, and mitigating long-term risks associated with climate-induced urban heat amplification [7,8,12,13,14,15].

4. Conclusions

This study establishes a comprehensive urban geo-thermodynamic framework to decode the physical mechanisms underlying surface warming in the Haldia urban-industrial region by integrating satellite-derived built-up data, thermal flux parameters, and mathematically formulated energy-balance equations. Findings indicate that rapid built-up expansion and increased material stock have substantially intensified land surface temperatures, reduced albedo, and weakened evaporative cooling, producing a strong positive correlation between urban growth and thermal energy accumulation (R2 > 0.90) and quantifying the dynamic interactions among built-up volume, vegetation loss, and radiative flux imbalance. The study extends conventional empirical thermal limitations by introducing a physically consistent, equation-driven approach that links surface morphology, material thermodynamics, and atmospheric heat fluxes. It thus changes the assessment of urban heat problems from a correlation-based observational approach to a scientifically applicable field interpretation. The observed thermal changes may also reflect meteorological variability, atmospheric conditions, coastal influences, industrial activity, and sensor/acquisition differences; therefore, the proposed framework identifies thermodynamically plausible urban-surface energy pathways rather than claiming exclusive causal attribution to urbanization. The findings provide a reproducible analytical pathway for assessing thermal risk and heat resilience, enabling urban researchers and planners to integrate thermodynamic diagnostics into sustainable urban design and policy. The present approach offers a scalable blueprint for evaluating and mitigating urban heat vulnerability in rapidly industrializing and climate-sensitive regions, subject to local data availability and independent validation.

Supplementary Materials

The following supporting information can be downloaded at: https://www.mdpi.com/article/10.3390/eesp2026045005/s1. Supplementary Tables S1–S10.

Author Contributions

B.D.: conceptualization, data acquisition, methodology, formal analysis, advanced software and tools handling, visualization, and draft writing; J.P.: supervision and draft review and editing. All authors have read and agreed to the published version of the manuscript.

Funding

This research received no external funding.

Institutional Review Board Statement

Not applicable.

Informed Consent Statement

Not applicable.

Data Availability Statement

Experimental data are available from the US Geological Survey (USGS), NASA-POWER-DAV, WSF-3D-DLR, and Indian remote sensing, and analytical metadata are available from the corresponding author upon request.

Acknowledgments

The authors would like to thank the Chairman and CEO of the Haldia Municipal Council (HMC) and the Haldia Development Authority (HDA) for providing the datasets for the study area. The authors also thank the GIS Lab of the Department of Geography, Faculty of Earth Science, IGNTU, M.P., India, for their great support. The authors are grateful to the USGS, POWER-DAV from NASA, WSF-3D structural and material stock from DLR, the Census of India, and the Indian Remote Sensing Agency for their freely available geospatial satellite datasets and information. The authors would also like to express sincere gratitude to the entire editorial board and reviewers for their insightful comments and suggestions, which have enlightened this study.

Conflicts of Interest

The authors declare no competing interests.

References

  1. Bhattacharya, B.K.; Mallick, K.; Desai, D.; Bhat, G.S.; Morrison, R.; Clevery, J.R.; Baldocchi, D. A coupled ground heat flux–surface energy balance model of evaporation using thermal remote sensing observations. Biogeosciences 2022, 19, 5521–5551. [Google Scholar] [CrossRef]
  2. Chen, C.; Wang, J.; Zhang, H.; Xu, X.; Hinkle, L.E.; Chao, X.; Shi, Q. Dual impacts of solar-reflective façades in high-density urban areas on building energy use and outdoor thermal environments. Energy Build. 2024, 324, 114926. [Google Scholar] [CrossRef]
  3. Das, B.; Prasad, J. Cellular Automata (CA) and AI-based Recurrent Neural Networks (RNNs) Approaches in Land Use Land Cover (LULC) Change Dynamics Using Multi-spectral and Multi-decadal Landsat Data in Haldia, India. Remote Sens. Earth Syst. Sci. 2025, 8, 1223–1243. [Google Scholar] [CrossRef]
  4. Duan, X.; Haseeb, M.; Tahir, Z.; Mahmood, S.A.; Tariq, A.; Jamil, A.; Ullah, S.; Abdullah-Al-Wadud, M. A geospatial and statistical analysis of land surface temperature in response to land use land cover changes and urban heat island dynamics. Sci. Rep. 2025, 15, 4943. [Google Scholar] [CrossRef] [PubMed]
  5. Deng, Y.; Chen, R.; Xie, Y.; Xu, J.; Yang, J.; Liao, W. Exploring the impacts and temporal variations of different building roof types on surface urban heat island. Remote Sens. 2021, 13, 2840. [Google Scholar] [CrossRef]
  6. Hartmann, D.L.; Ockert-Bell, M.E.; Michelsen, M.L. The effect of cloud type on Earth’s energy balance: Global analysis. J. Clim. 1992, 5, 1281–1304. [Google Scholar] [CrossRef]
  7. Tian, L.; Tao, Y.; Li, M.; Qian, C.; Li, T.; Wu, Y.; Ren, F. Prediction of land surface temperature considering future land use change effects under climate change scenarios in Nanjing City, China. Remote Sens. 2023, 15, 2914. [Google Scholar] [CrossRef]
  8. Vohra, R.; Kumar, A.; Jain, R.; Hemanth, D.J. Analysis and prediction of land surface temperature with increasing urbanization using satellite imagery. Heliyon 2024, 10, e40378. [Google Scholar] [CrossRef] [PubMed]
  9. Myrup, L.O. A numerical model of the urban heat island. J. Appl. Meteorol. Climatol. 1969, 8, 908–918. [Google Scholar] [CrossRef]
  10. Oke, T.R.; Mills, G.; Christen, A.; Voogt, J.A. Urban Climates; Cambridge University Press: Cambridge, UK, 2017. [Google Scholar]
  11. Mills, G.; Stewart, I.D.; Niyogi, D. The origins of modern urban climate science: Reflections on ‘A numerical model of the urban heat island’. Prog. Phys. Geogr. Earth Environ. 2022, 46, 649–656. [Google Scholar] [CrossRef]
  12. Saha, S.; Verma, T.; Oliveira, D.A.B. Evolution of urban areas and land surface temperature. In 2024 IEEE International Conference on Computer Vision and Machine Intelligence (CVMI); IEEE: New York, NY, USA, 2024; pp. 1–6. [Google Scholar] [CrossRef]
  13. Patel, M.; Desai, D.; Shah, Z. Decadal Assessment of Urbanization Impacts on Surface Energy Balance and Thermal Dynamics using Remote Sensing data: A Case Study of Ahmedabad, India. Indian J. Sci. Technol. 2025, 18, 2608–2619. [Google Scholar] [CrossRef]
  14. Wang, L.; Gao, Z.; Miao, S.; Guo, X.; Sun, T.; Liu, M.; Li, D. Contrasting characteristics of the surface energy balance between the urban and rural areas of Beijing. Adv. Atmos. Sci. 2015, 32, 505–514. [Google Scholar] [CrossRef]
  15. Xu, J.; Liang, S.; He, T.; Ma, H.; Zhang, Y.; Zhang, G.; Liang, H. Variability and trends in land surface longwave radiation fluxes from six satellite and reanalysis products. Int. J. Digit. Earth 2023, 16, 2912–2940. [Google Scholar] [CrossRef]
Figure 1. Spatiotemporal variation of the urban geo-thermodynamic mechanisms: (a) mathematical computation and methodology; (b) results and impact; (c) geospatial variation; (d) geospatial correlation among the thermodynamics variables.
Eesp 45 00005 g001aEesp 45 00005 g001b
Table 1. Remotely accessed satellite data properties.
Data Set TypeSourcesYearPurpose
Landsat 5 TM/7ETM+/8OLIUSGS-NASA1991–2021Built-up extraction, LST, NDVI
NASA-POWER-DAVNOAA-NASA1991–2021Thermal radiation, heat fluxes, atmospheric variables
WSF 3D structureDLR2023Building area, fraction, height, volume
WSF 3D material stockDLR2024Biomass, fissile fuel, minerals, metals
Table 2. The formulation framework.
ParametersFormulationDimensional BasisInterpretation
UTI(Q* + Q F )/( Q E + Q H ) W m 2 / W m 2 /= dimensionlessRelative energy accumulation/dissipation
UHRE ( Q H + Q G ) / Q Relative storage/retention component
UCP Q E = ( Q + Q F ) Relative latent cooling allocation
Disclaimer/Publisher’s Note: The statements, opinions and data contained in all publications are solely those of the individual author(s) and contributor(s) and not of MDPI and/or the editor(s). MDPI and/or the editor(s) disclaim responsibility for any injury to people or property resulting from any ideas, methods, instructions or products referred to in the content.