
Proceeding Paper

Air Pollution Correlation and Seasonal Variability in Chattogram’s Urban Ecosystem †

by
Md. Nurjaman Ridoy
1,
Sk. Tanjim Jaman Supto
2,*,
Yeaj Uddin
3 and
Md. Kaium Hossain
4
1
Department of Environmental Research, Nano Research Centre, Sylhet 3114, Bangladesh
2
Department of Geography and Environment, Shahjalal University of Science and Technology, Sylhet 3114, Bangladesh
3
Department of Statistics, Shahjalal University of Science and Technology, Sylhet 3114, Bangladesh
4
Department of GIScience and Geoenvironment, Western Illinois University, Macomb, IL 61455, USA
*
Author to whom correspondence should be addressed.
Presented at the 1st International Online Conference on Environment (IOCE 2026), 2–4 March 2026; Available online: https://sciforum.net/event/IOCE2026.
Environ. Earth Sci. Proc. 2026, 42(1), 19; https://doi.org/10.3390/eesp2026042019
Published: 30 July 2026
(This article belongs to the Proceedings of The 1st International Online Conference on Environments)

Abstract

Rapid urban growth and industrial activity have significantly increased air pollution in Chattogram, Bangladesh. Among various pollutants, particulate matter (PM2.5 and PM10) has emerged as a major concern due to its severe effects on public health and the environment. This study investigates seasonal and temporal variations in air quality and identifies periods of high risk. Data were collected from the Department of Environment, including PM2.5 and PM10 measurements from 2013 to April 2025 and AQI data from 2022 to April 2025. The analysis focuses on seasonal trends, monthly fluctuations, extreme pollution events, and correlations among pollutants. The study examines which seasons are most polluted and how PM2.5, PM10, and AQI change over the year. Results indicate that winter experiences the highest pollution levels, while monsoon shows the lowest. Pre-monsoon and post-monsoon show moderate pollution, representing transitional periods with variable air quality. Monthly trends reveal that pollution peaks in January and reaches its lowest point in July, demonstrating clear temporal patterns. Extreme pollution events are most frequent in winter and the pre-monsoon period, emphasizing periods of highest health risk. Correlation analysis shows strong positive associations between PM2.5, PM10, and AQI (r > 0.80). Machine-learning models demonstrated moderate predictive skill for PM10 forecasting (R2 up to 0.65), while PM2.5 models at Agrabad produced negative R2 values, indicating performance worse than a mean-value benchmark; accordingly, long-term PM2.5 projections at Agrabad are not reported. Exploratory PM10 projections suggest that concentrations may remain above WHO guideline levels through 2030, although these projections should be interpreted cautiously because meteorological drivers were not included in the modelling framework. The findings highlight the need for seasonal interventions to control particulate matter, particularly in winter and pre-monsoon. Measures such as stricter emission regulations, industrial controls, and public awareness campaigns are essential for mitigating health risks. This study provides a comprehensive understanding of air-quality dynamics in Chattogram and offers a framework for targeted pollution-control strategies. Implementing these strategies can improve air quality, protect public health, and support sustainable urban development.

1. Introduction

Chattogram, the second-largest city of Bangladesh, has undergone rapid urbanization, industrial expansion, and a substantial increase in vehicular emissions over recent decades. These developments have contributed significantly to the deterioration of air quality, particularly through the accumulation of particulate matter (PM2.5 and PM10), which represent major environmental and public health concerns [1]. Exposure to particulate matter has been consistently associated with adverse health outcomes, including respiratory and cardiovascular diseases, impaired lung function, and increased mortality risk. In addition to human health impacts, elevated particulate concentrations affect ecosystems and contribute to atmospheric pollution. Understanding the dynamics of urban air pollution is therefore essential for safeguarding public health and informing effective environmental management strategies [2]. A complex interplay between anthropogenic emissions and seasonal meteorological conditions governs air quality. In Chattogram, the annual climatic cycle can be broadly divided into four principal seasons: monsoon, post-monsoon, pre-monsoon, and winter. Each season exerts a distinct influence on pollutant behaviour and dispersion [1]. Elevated concentrations of PM2.5 and PM10 are associated with increased hospital admissions, premature mortality, and reduced workforce efficiency, while also affecting vegetation health, water systems, and regional climate processes. Consequently, identifying high-risk periods enables policymakers to implement targeted mitigation strategies, including stricter emission controls, enhanced industrial regulation, and public awareness initiatives aimed at reducing exposure [3]. Existing research on air pollution in Bangladesh has predominantly focused on individual pollutants, short-term datasets, or generalized assessments across multiple cities, resulting in a limited understanding of localized air quality dynamics. In particular, there remains a lack of comprehensive studies on Chattogram that integrate long-term observations with multi-scale temporal analysis of PM2.5, PM10, and AQI [1]. This gap is critical, as Chattogram’s rapidly expanding urban and industrial environment creates unique pollution patterns driven by interactions between emission sources and seasonal meteorological conditions [1,4]. The present study aims to address this limitation by developing a comprehensive multi-scale temporal framework to understand the dynamics of air pollution in urban Chattogram. Using long-term datasets, the study systematically examines seasonal variability, monthly fluctuations, extreme pollution events, and interrelationships among key pollutants. By doing so, it moves beyond fragmented statistical descriptions and provides an integrated understanding of how air quality evolves over time. The findings reveal that pollution in Chattogram follows a predictable annual cycle and is strongly driven by particulate matter interactions. This approach offers actionable insights for identifying high-risk periods and supports the development of targeted, season-specific mitigation strategies, thereby contributing to a more context-specific and policy-relevant understanding of urban air pollution dynamics in Bangladesh. To address this gap, this study combines long-term statistical and seasonal analyses to understand air pollution dynamics in Chattogram.

2. Methodology

2.1. Data Pre-Processing

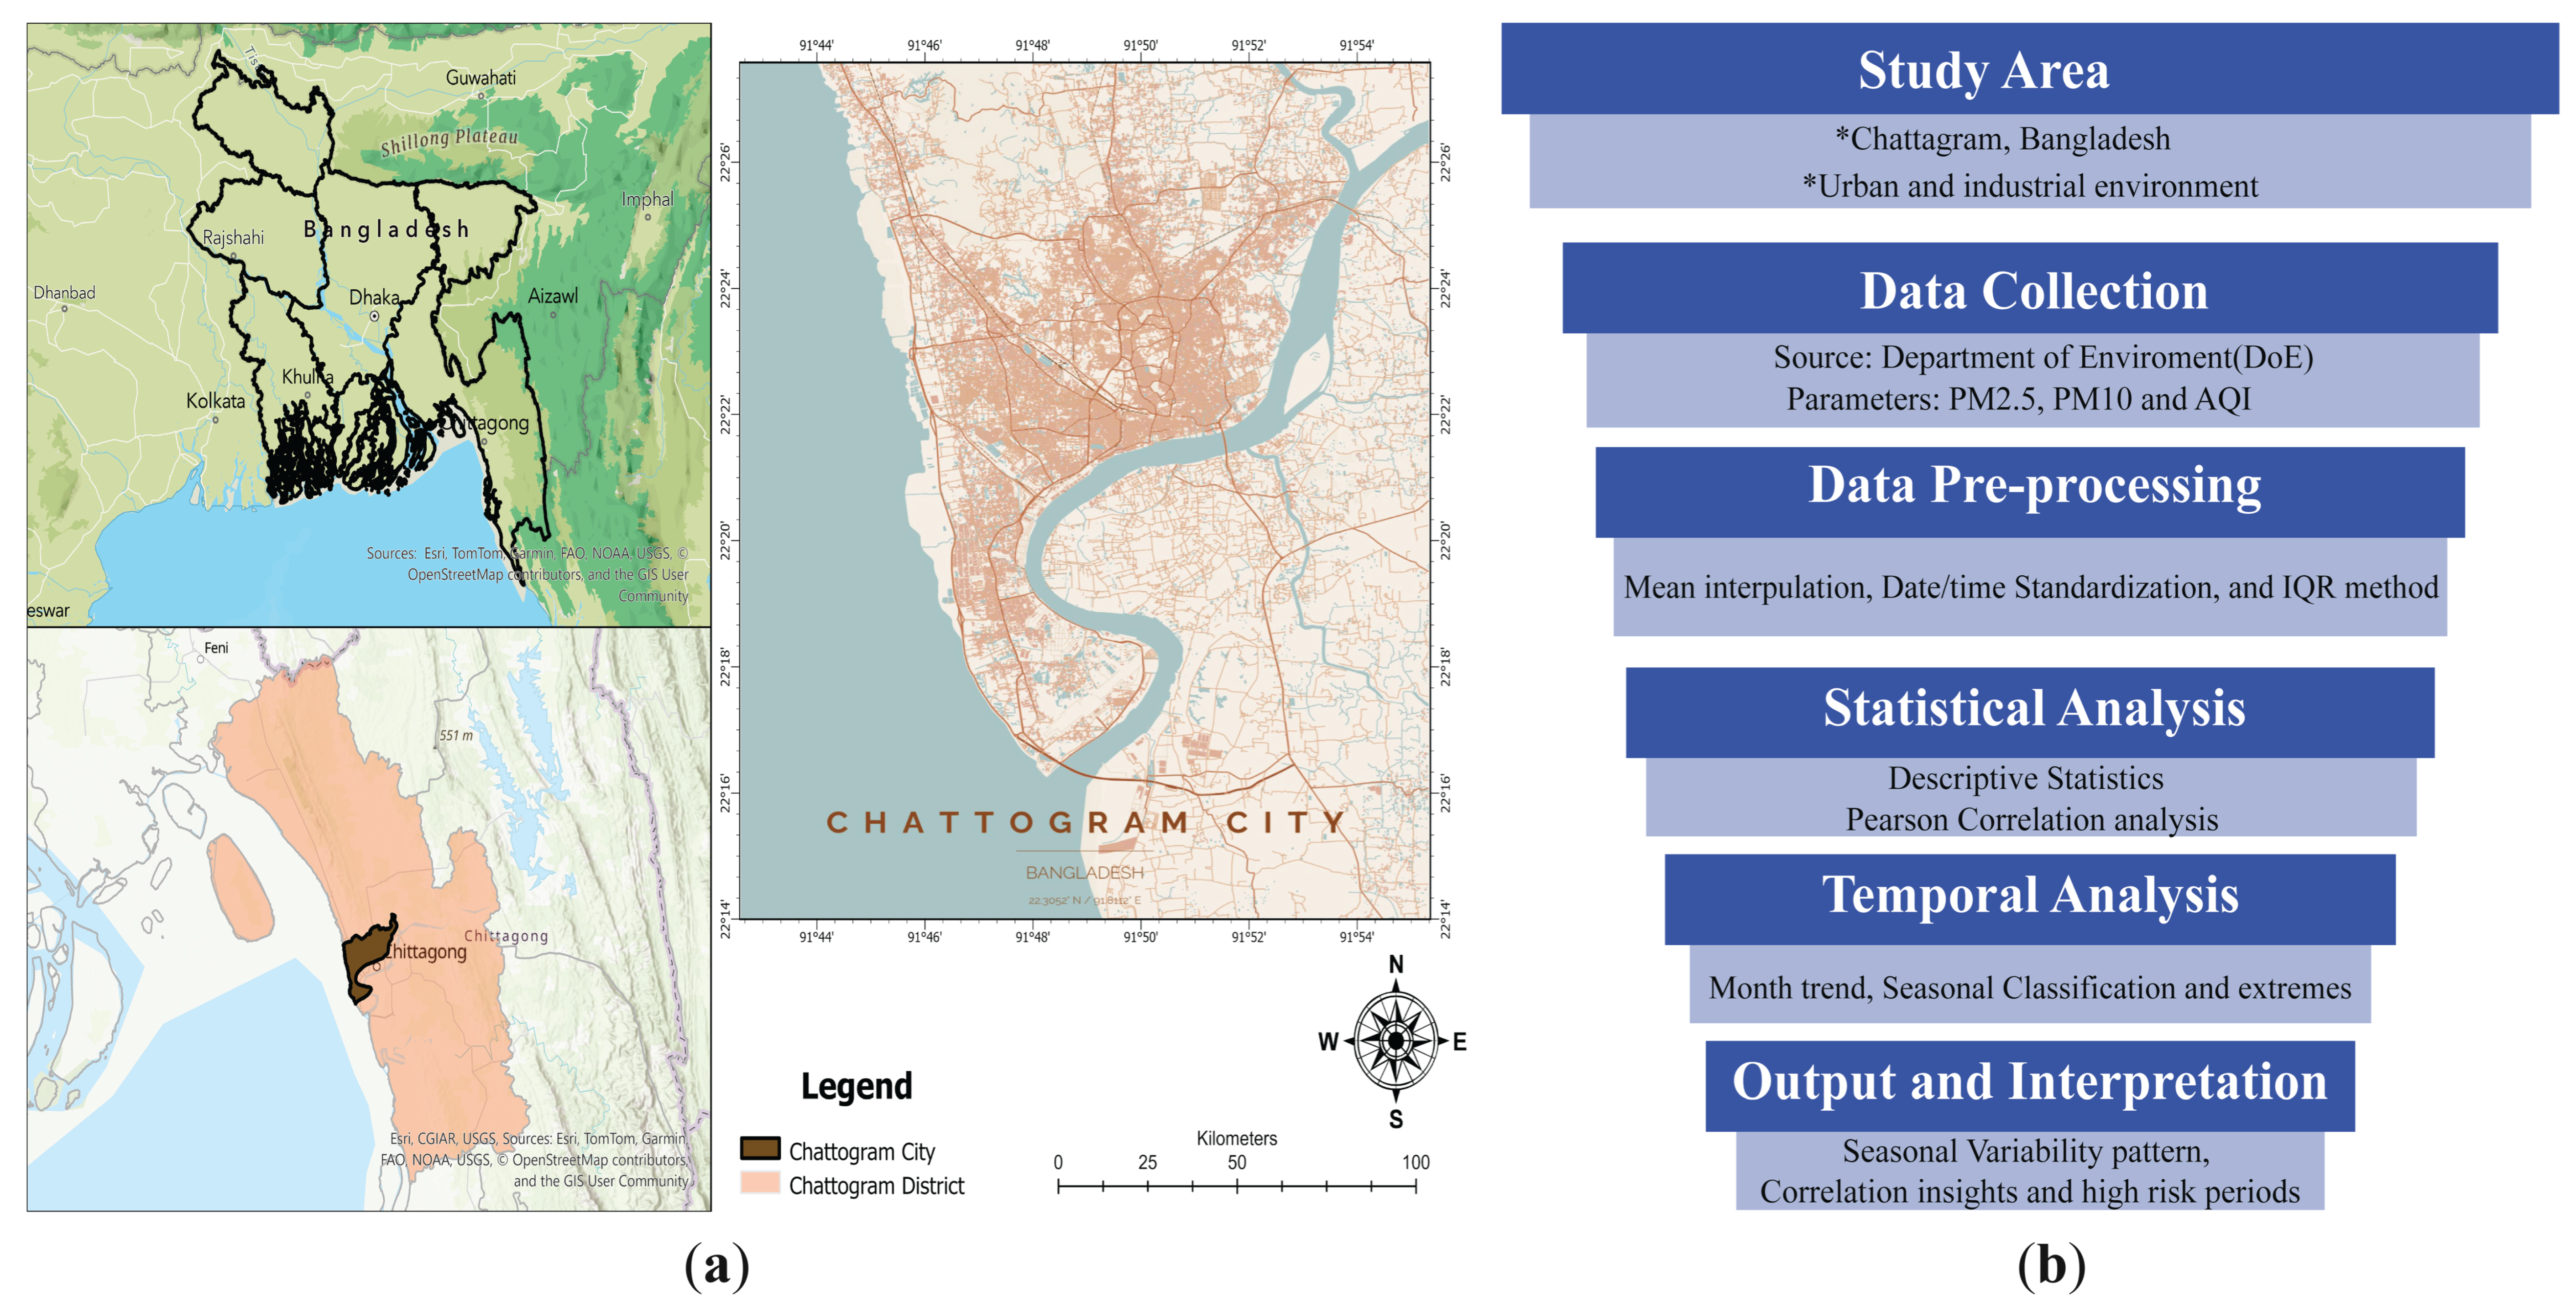
Chattogram, the second-largest city of Bangladesh, is a major economic and industrial hub. It is located in the southeast between 22°14′–22°24′ N latitude and 91°46′–91°53′ E longitude (Figure 1a). Air quality in the city is affected by rapid urbanization, industrial activities, and increasing vehicle emissions. The city’s proximity to the Karnaphuli River and the Bay of Bengal also influences pollutant dispersion and local atmospheric conditions. Air quality data were obtained from the Department of Environment (DoE) of Bangladesh. The dataset includes PM2.5 and PM10 measurements from 2013 to April 2025 and AQI data from 2022 to April 2025. Data was collected from two monitoring stations, TV Station and Agrabad Station, which cover the main urban and industrial areas. The dataset contains monthly measurements, allowing detailed analysis of seasonal and temporal variations, extreme pollution events, and correlations among pollutants. This data provides a strong foundation for understanding air quality dynamics in Chattogram.
The dataset was processed to ensure consistency and reliability. Missing values were handled using group-wise mean imputation, a standard approach in environmental data analysis [5]. In particular, missing observations for April 2020 (during the COVID-19 disruption period) were imputed using group-wise monthly means. To assess the potential impact of this imputation, pollutant distributions before and after imputation were compared using descriptive statistics and visual inspection of monthly box plots; no substantial distributional shift was observed, suggesting that the imputed values are consistent with the surrounding seasonal pattern. However, it is acknowledged that real emission reductions associated with the COVID-19 lockdown may have been partially masked by this approach, and findings for this period should be interpreted with caution. Outliers were detected using boxplot-based interquartile range (IQR) methods and treated to reduce statistical bias. All temporal records were standardized into a consistent date format (YYYY-MM-DD), enabling alignment for time-series and seasonal analyses.

2.2. Statistical Analysis

To understand the distribution and variability of air quality, descriptive statistics were calculated for PM2.5, PM10, and AQI. These include mean, median, minimum, maximum, standard deviation (SD), variance, skewness, kurtosis, and coefficient of variation (CV). These measures help describe the central tendency, dispersion, and shape of the pollutant distributions across seasons.
S k e w n e s s = n ( n 1 ) ( n 2 ) i = 1 n ( x i x ¯ s ) 3
K u r t o s i s = n ( n + 1 ) ( n 1 ) ( n 2 ) ( n 3 ) ( n 1 ) 2 i = 1 n ( x i x ¯ s ) 4 3
C o e f f i c i e n t   o f   V a r i a t i o n = s x ¯ × 100
where x i is each observation, x ¯ is the mean, s is the standard deviation, and n is the number of observations [6].
Additionally, Pearson Correlation was used to evaluate the linear relationship between PM2.5, PM10, and AQI. The formula is:
i = 1 n ( x i x   ¯ ) ( y i y ¯ ) i = 1 n ( x i x ¯ ) 2 i = 1 n ( y i y ¯ ) 2
Values close to +1 indicate a strong positive correlation, while values near 0 indicate little or no correlation. This comprehensive methodology allows analysis of seasonal and temporal trends, extreme events, and pollutant interactions, providing a framework for understanding air quality dynamics and guiding targeted pollution management and policy interventions [7].

2.3. Comparative Assessment of Machine Learning Models

To complement the seasonal and statistical analyses, this study evaluated the predictive performance of several machine learning and deep learning models for monthly PM2.5 and PM10 concentrations (µg m−3) measured at two monitoring stations in Chattogram, Bangladesh. The objective was to assess the extent to which particulate matter concentrations could be predicted from historical observations rather than to generate long-term projections. Historical observations spanning the period from 2013 to 2025 were used for model development, with missing values for April 2020 during the COVID-19 disruption period imputed to maintain temporal continuity within the dataset. To prevent look-ahead bias, data were split chronologically, with approximately 85% of observations (2013–2022) used for training and the remaining 15% (2023–2024) reserved as an independent test set. This approach ensured robust out-of-sample evaluation and is consistent with recommended practices in environmental time-series forecasting [8,9,10,11]. Five predictive approaches were implemented and compared [9,10]. Random Forest (RF), a tree-based ensemble learning algorithm, was selected because of its ability to capture nonlinear relationships and its robustness when applied to environmental datasets [11]. Long Short-Term Memory (LSTM) networks, a class of recurrent neural networks, were utilized to model long-range temporal dependencies inherent in air quality time series [9]. The Gated Recurrent Unit (GRU), a computationally efficient variant of LSTM with fewer trainable parameters, was included to provide comparable temporal learning capability with reduced complexity. In addition, an ensemble model integrating predictions from all individual models was constructed to enhance predictive stability and reduce variance [8]. For model implementation, Random Forest was configured with 100 estimators and no maximum depth constraint. XGBoost was implemented with a learning rate of 0.1, maximum tree depth of 6, and 100 boosting rounds. LSTM and GRU models consisted of a single recurrent layer with 64 hidden units, a dropout rate of 0.2, and were trained for 100 epochs using a batch size of 16 and the Adam optimiser. These settings provided stable and reproducible performance across the study dataset. Because predictive skill varied substantially among pollutants and monitoring stations, model outputs were interpreted only when supported by acceptable validation statistics. In particular, PM2.5 models at the Agrabad station produced negative R2 values, indicating performance worse than a mean-value baseline predictor. Consequently, these models were considered unsuitable for forecasting purposes, and no long-term PM2.5 projections were generated or interpreted.

2.4. Model Evaluation Metrics

Model performance was assessed using three standard regression metrics:
Mean Absolute Error (MAE):
M A E =   1 n i = 1 n | y i y i ^ |
Root Mean Square Error (RMSE):
R M S E = 1 n i = 1 n ( y i y i ^ ) 2
Coefficient of Determination (R2):
R 2   = 1     i = 1 n ( y i y i ^ ) 2 i = 1 n ( y i y i ¯ ) 2
Lower MAE and RMSE values indicate better predictive accuracy, while higher R2 values represent stronger explanatory performance [11].

3. Result

3.1. Comparative Air Quality Assessment Across Major Bangladeshi Cities

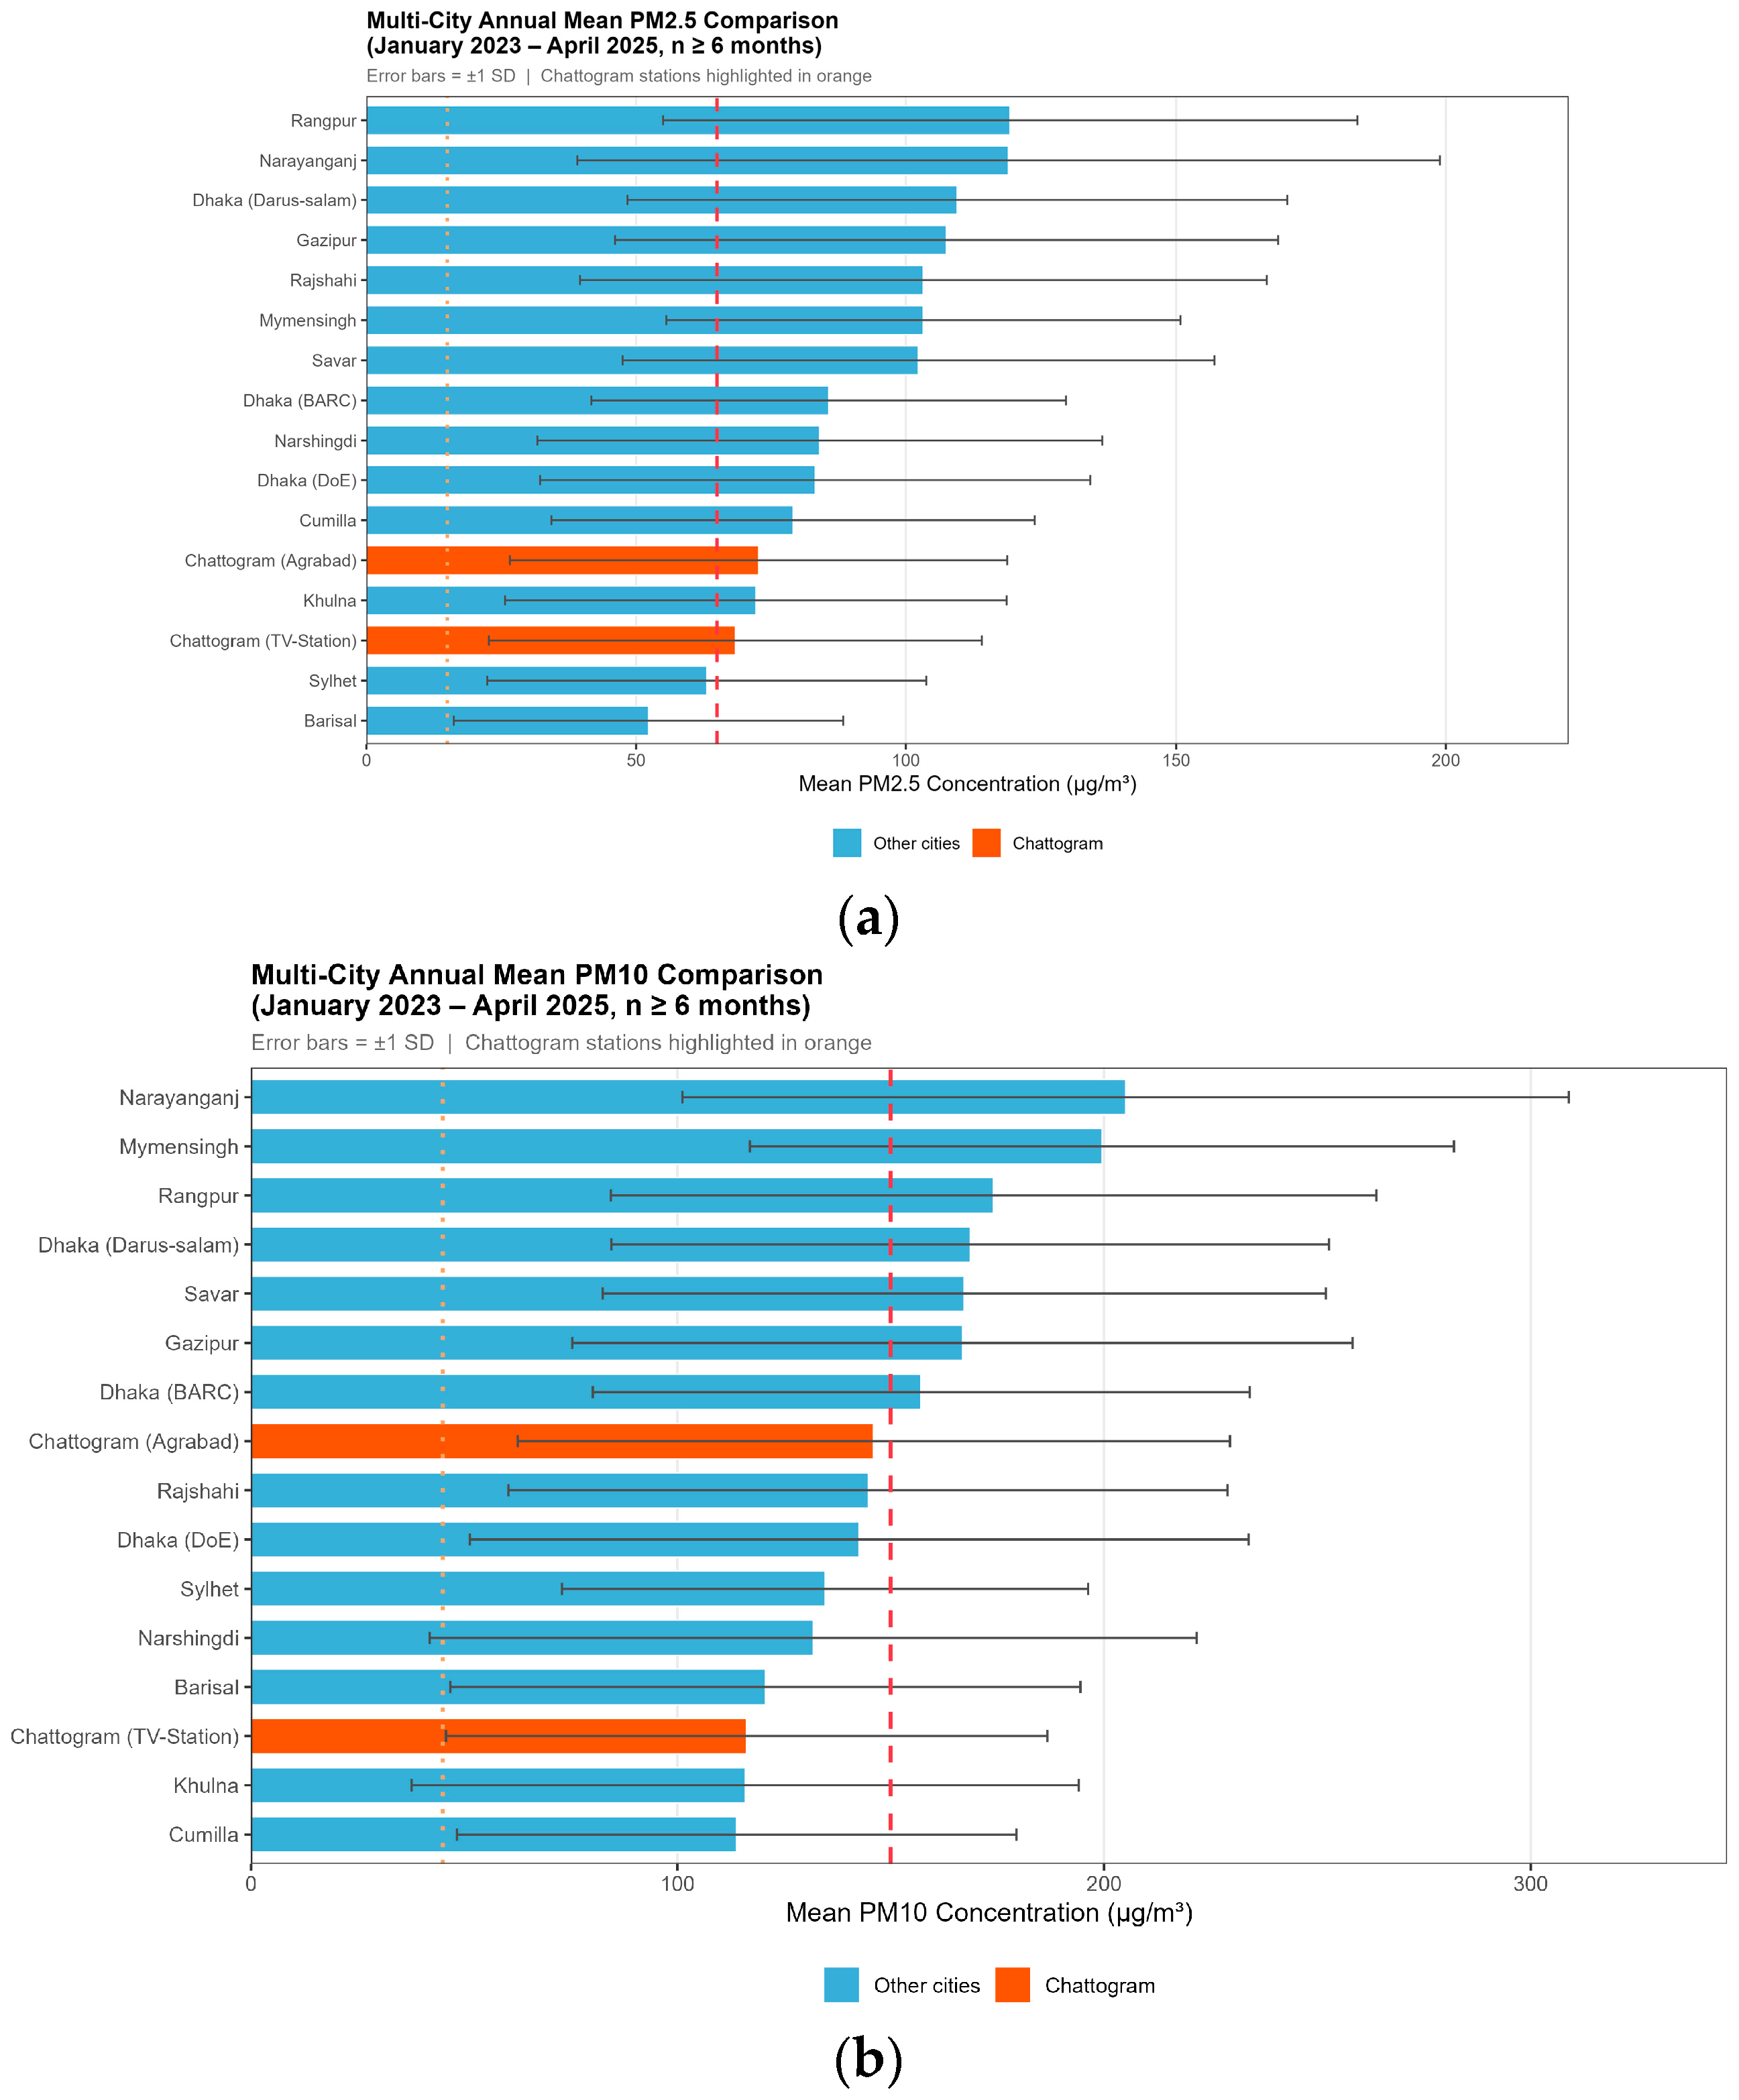
To place Chattogram’s air quality within a broader national context, annual mean PM2.5 and PM10 concentrations recorded at major Continuous Air Monitoring Stations (CAMS) across Bangladesh were compared using observations from January 2023 to April 2025 (Figure 2). The comparison indicates substantial spatial variability in particulate matter concentrations among urban centres. Several cities located within the Dhaka metropolitan influence zone, including Narayanganj, Gazipur, and Dhaka monitoring stations, exhibited among the highest PM2.5 and PM10 concentrations. Chattogram monitoring stations (Agrabad and TV Station) showed moderate particulate matter levels relative to the national distribution, although concentrations remained considerably above both World Health Organization (WHO) guideline values and Bangladesh Department of Environment (DoE) standards. For PM2.5, annual mean concentrations at Agrabad and TV Station were approximately 73 and 69 µg m−3, respectively, exceeding the WHO annual guideline value of 15 µg m−3 by more than fourfold, as shown in Figure 2. Similarly, PM10 concentrations at the two stations remained substantially above the WHO guideline value of 45 µg m−3 and approached or exceeded the Bangladesh DoE annual standard of 150 µg m−3. Although Chattogram was not the most polluted urban area in the dataset, the observed particulate matter burden indicates persistent air-quality challenges and highlights the need for continued mitigation efforts. These findings provide a national benchmark for interpreting the temporal and seasonal patterns observed within Chattogram.
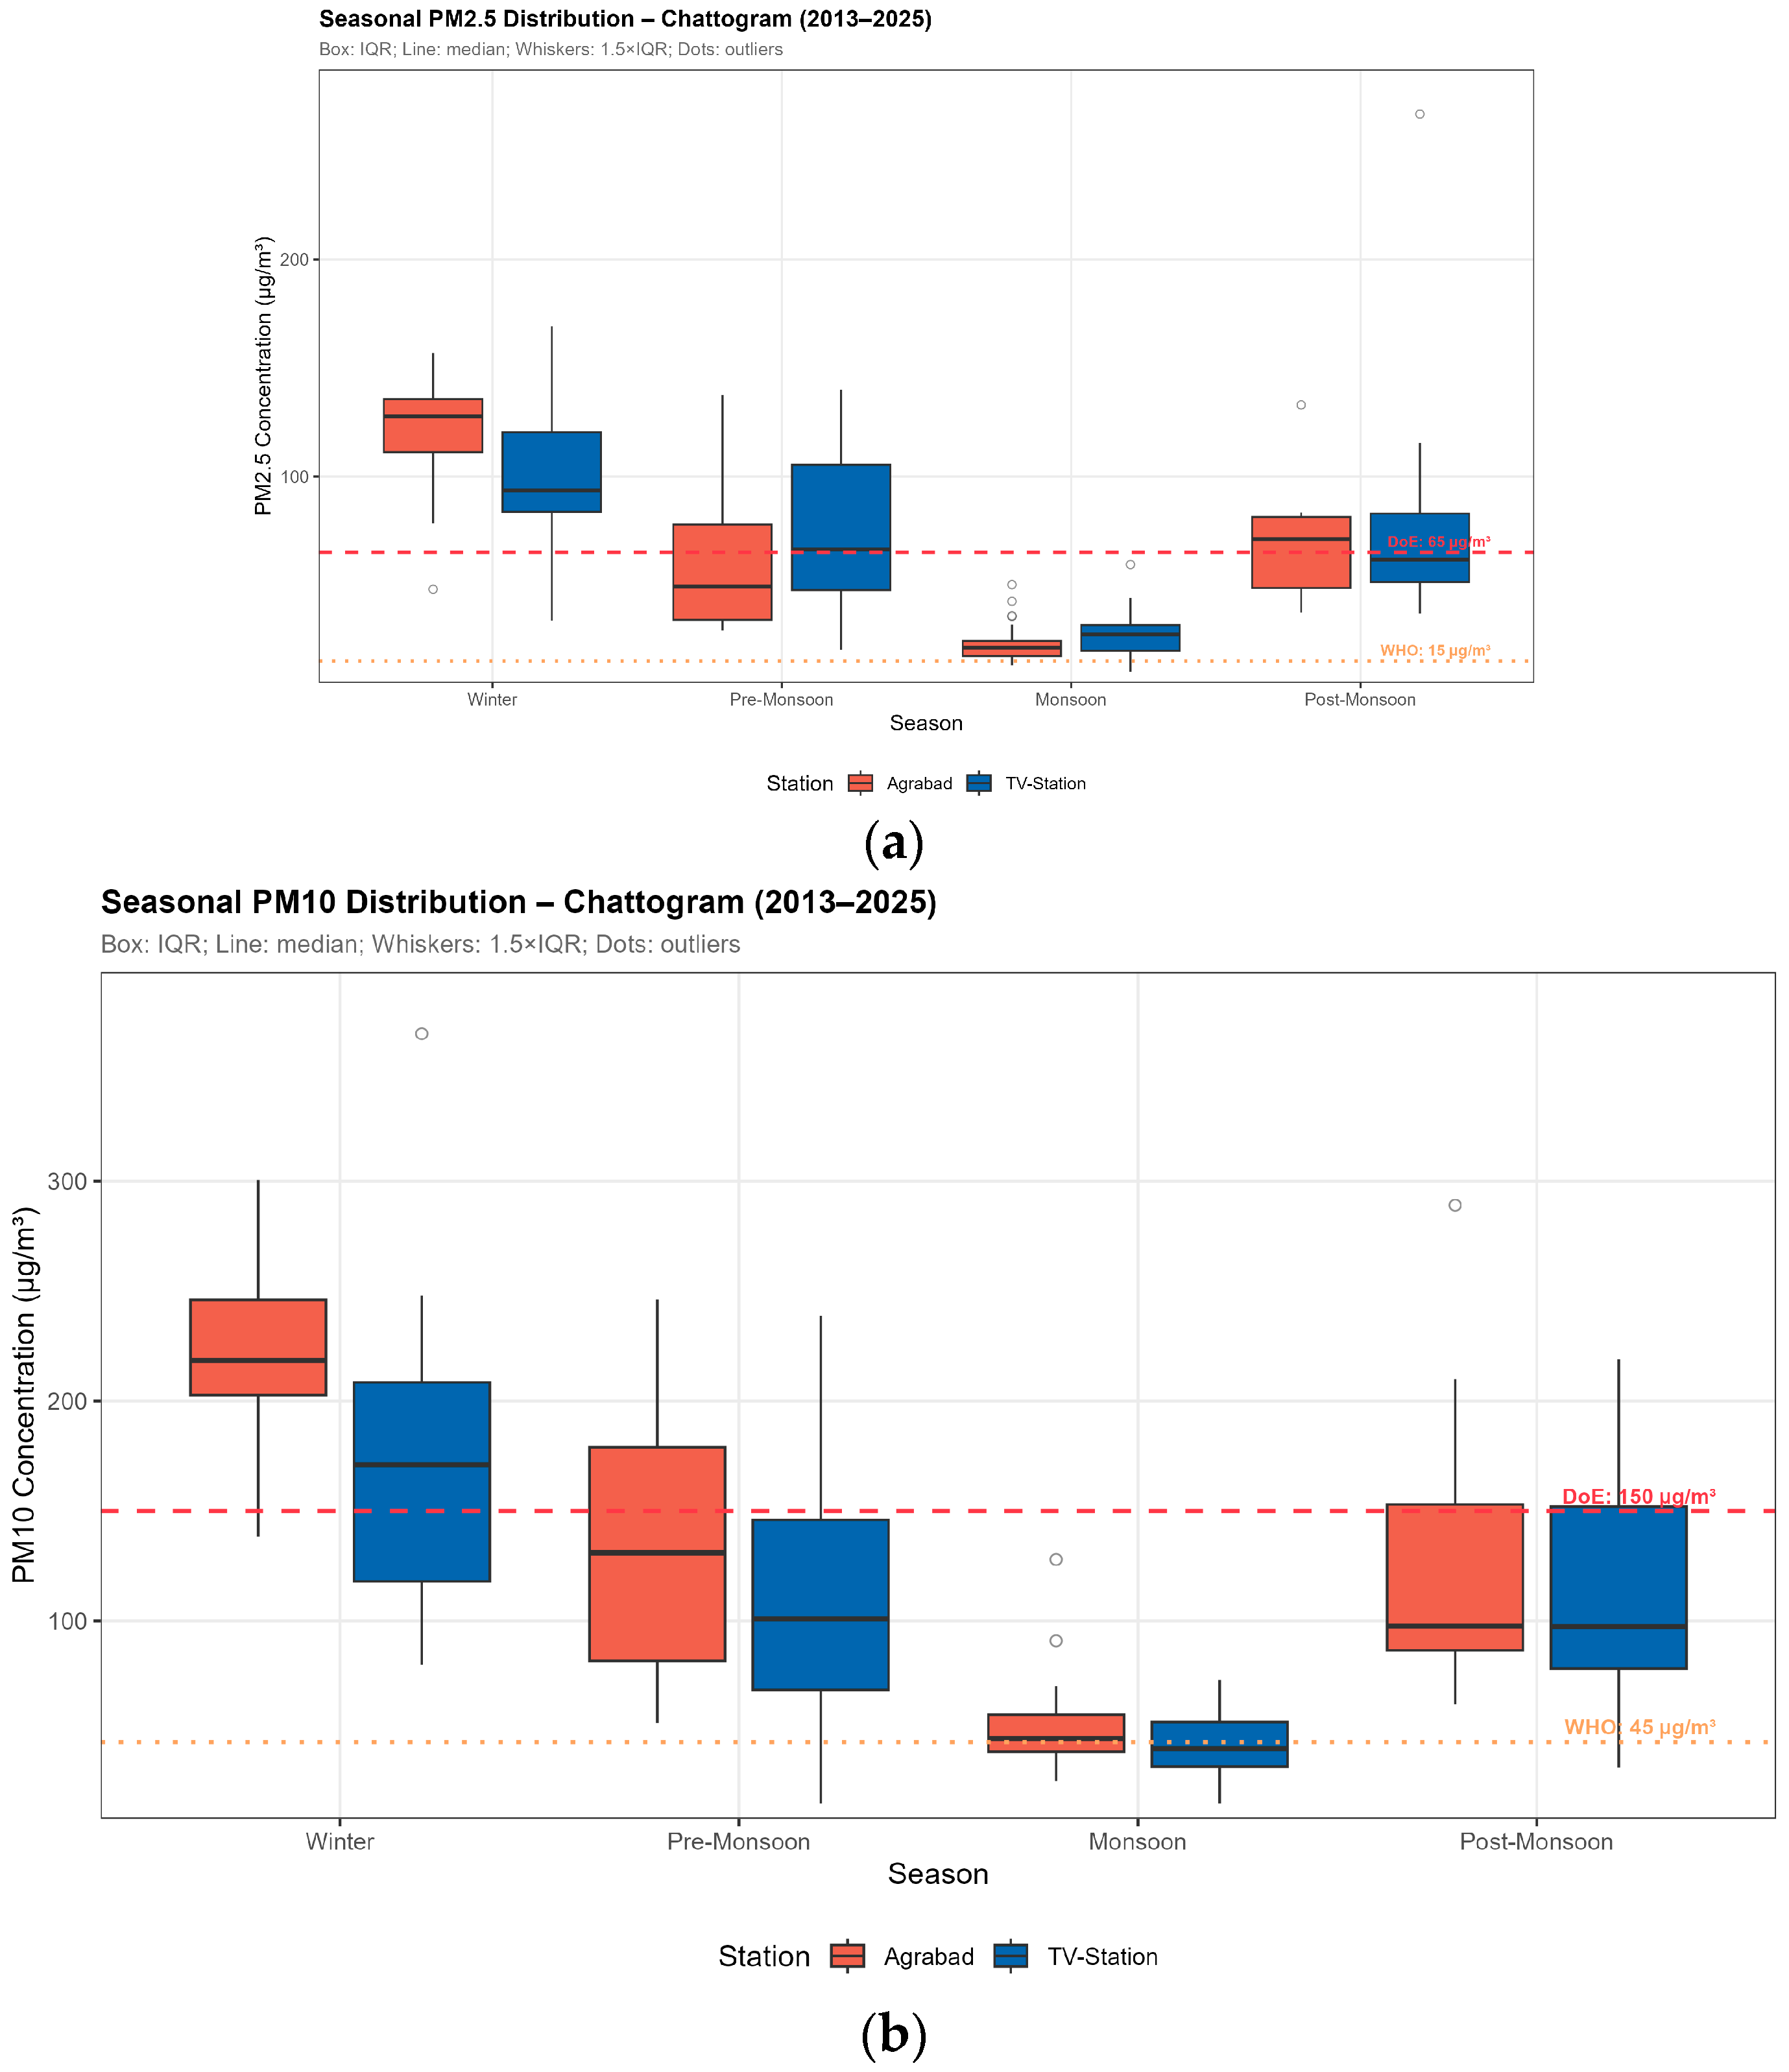
Seasonal boxplot analysis of PM2.5 and PM10 concentrations at the Agrabad and TV Station monitoring sites revealed pronounced temporal variability in particulate matter levels across Chattogram, as shown in Figure 3. For both pollutants, winter exhibited the highest median concentrations and the widest interquartile ranges, indicating persistent pollution accumulation and increased variability during the dry season. In contrast, monsoon concentrations were substantially lower and showed narrower distributions, reflecting the effective removal of airborne particles through precipitation and enhanced atmospheric dispersion. Pre-monsoon and post-monsoon seasons displayed intermediate concentration levels, although several high-value outliers were observed, indicating the occurrence of episodic pollution events. PM2.5 concentrations exceeded the Bangladesh Department of Environment (DoE) annual standard of 65 µg m−3 during winter and, in some cases, during post-monsoon periods. Similarly, PM10 concentrations frequently exceeded both the WHO guideline value (45 µg m−3) and the Bangladesh DoE standard (150 µg m−3), particularly during winter. Overall, the seasonal distributions demonstrate that particulate pollution in Chattogram is strongly influenced by seasonal meteorological conditions, with winter representing the period of greatest air-quality deterioration and associated public health risk.

3.2. Observed Temporal and Seasonal Patterns

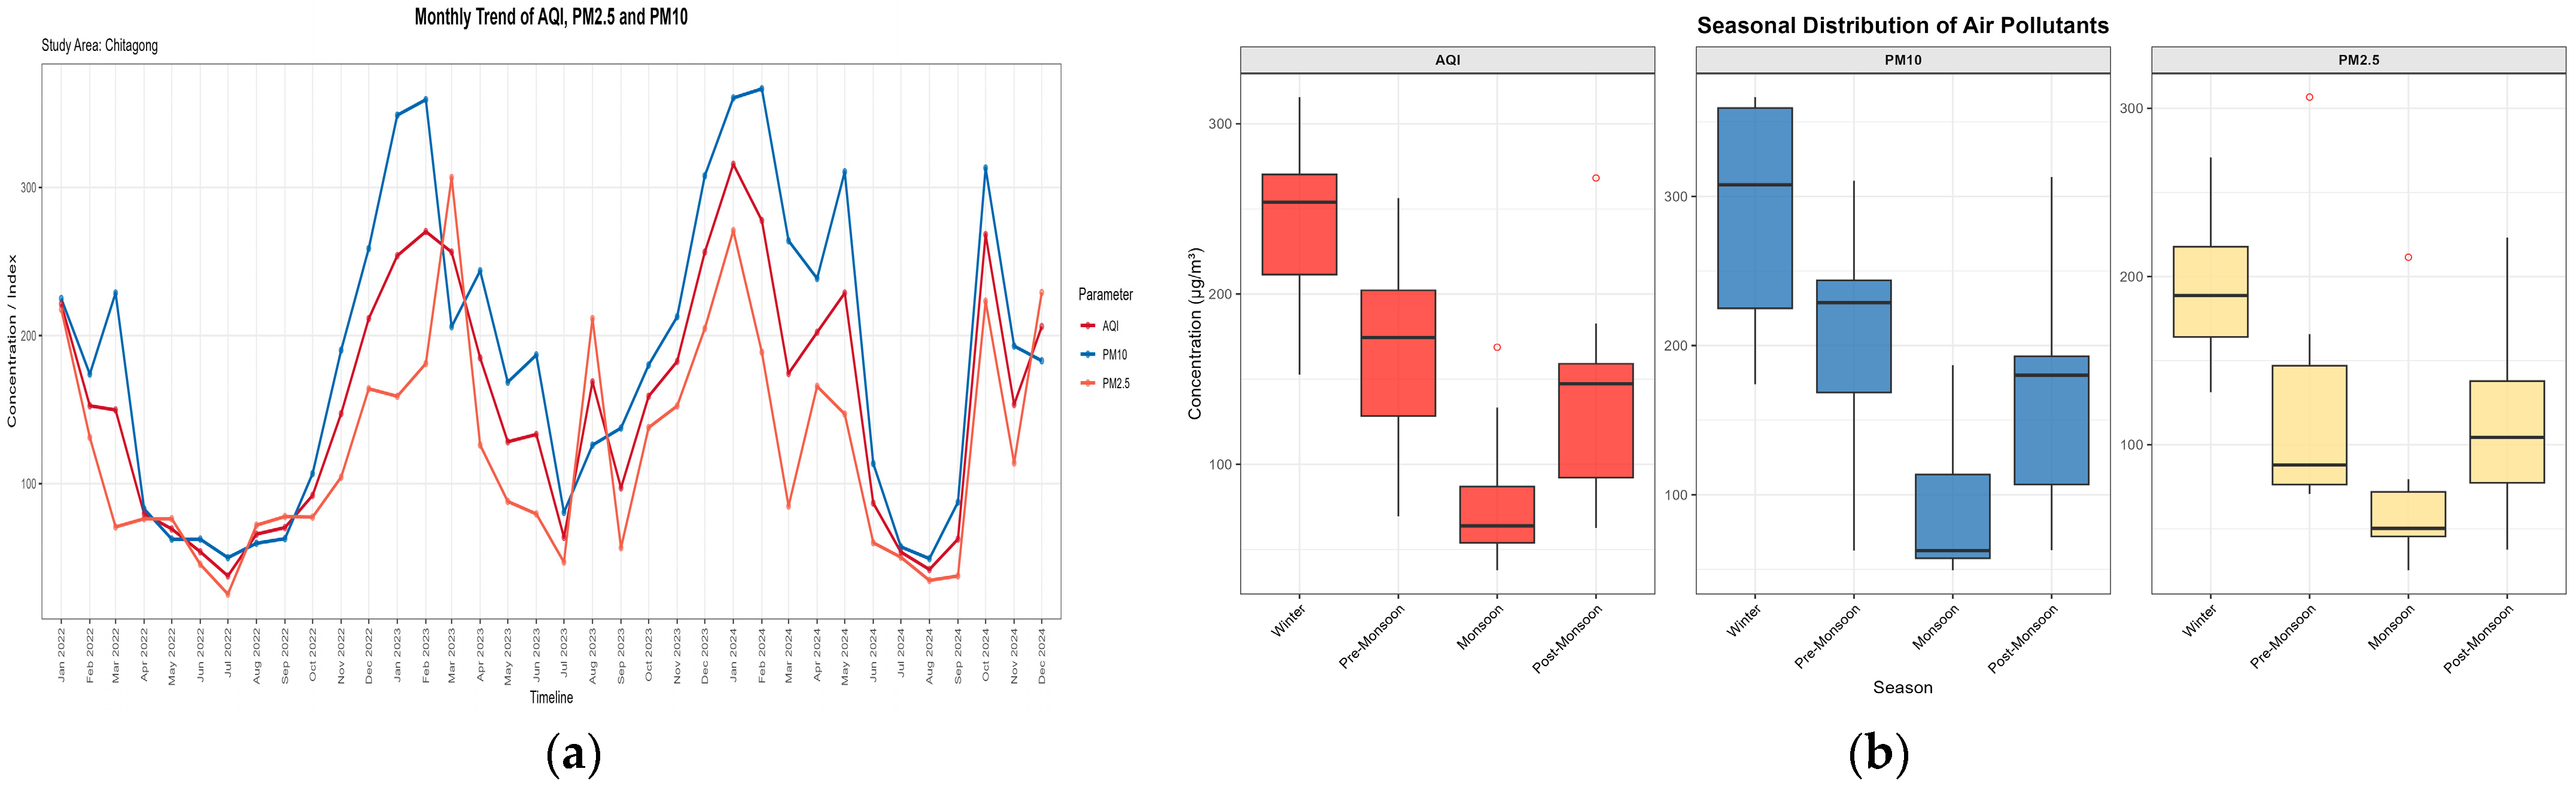
Air quality in Chattogram exhibits significant temporal and seasonal variation. Analysis of monthly trends indicates that winter months consistently have the highest levels of PM2.5, PM10, and AQI, while monsoon months show the lowest concentrations. The pre-monsoon and post-monsoon periods exhibit intermediate values, reflecting transitional pollution phases. Monthly data reveal that January is the most polluted month, whereas July shows the lowest levels, highlighting periods of elevated health risk shown in Figure 4a. Seasonal distribution assessed through boxplots highlights winter as the season with the widest range of pollutant concentrations, capturing both high averages and extreme events. In contrast, monsoon exhibits the narrowest range, indicating cleaner air. Pre-monsoon and post-monsoon periods display moderate variability, as shown in Figure 3b.
Monthly analysis of pollutant concentrations reveals distinct temporal fluctuations across the study period. AQI, PM2.5, and PM10 peak during the winter months, particularly in January, and reach their minimum values in July, corresponding to the monsoon season. Pre-monsoon and post-monsoon months exhibit intermediate levels, reflecting transitional changes in emissions and meteorological conditions. These monthly averages highlight short-term variability and identify periods of elevated health risk within each year as described in Table 1.
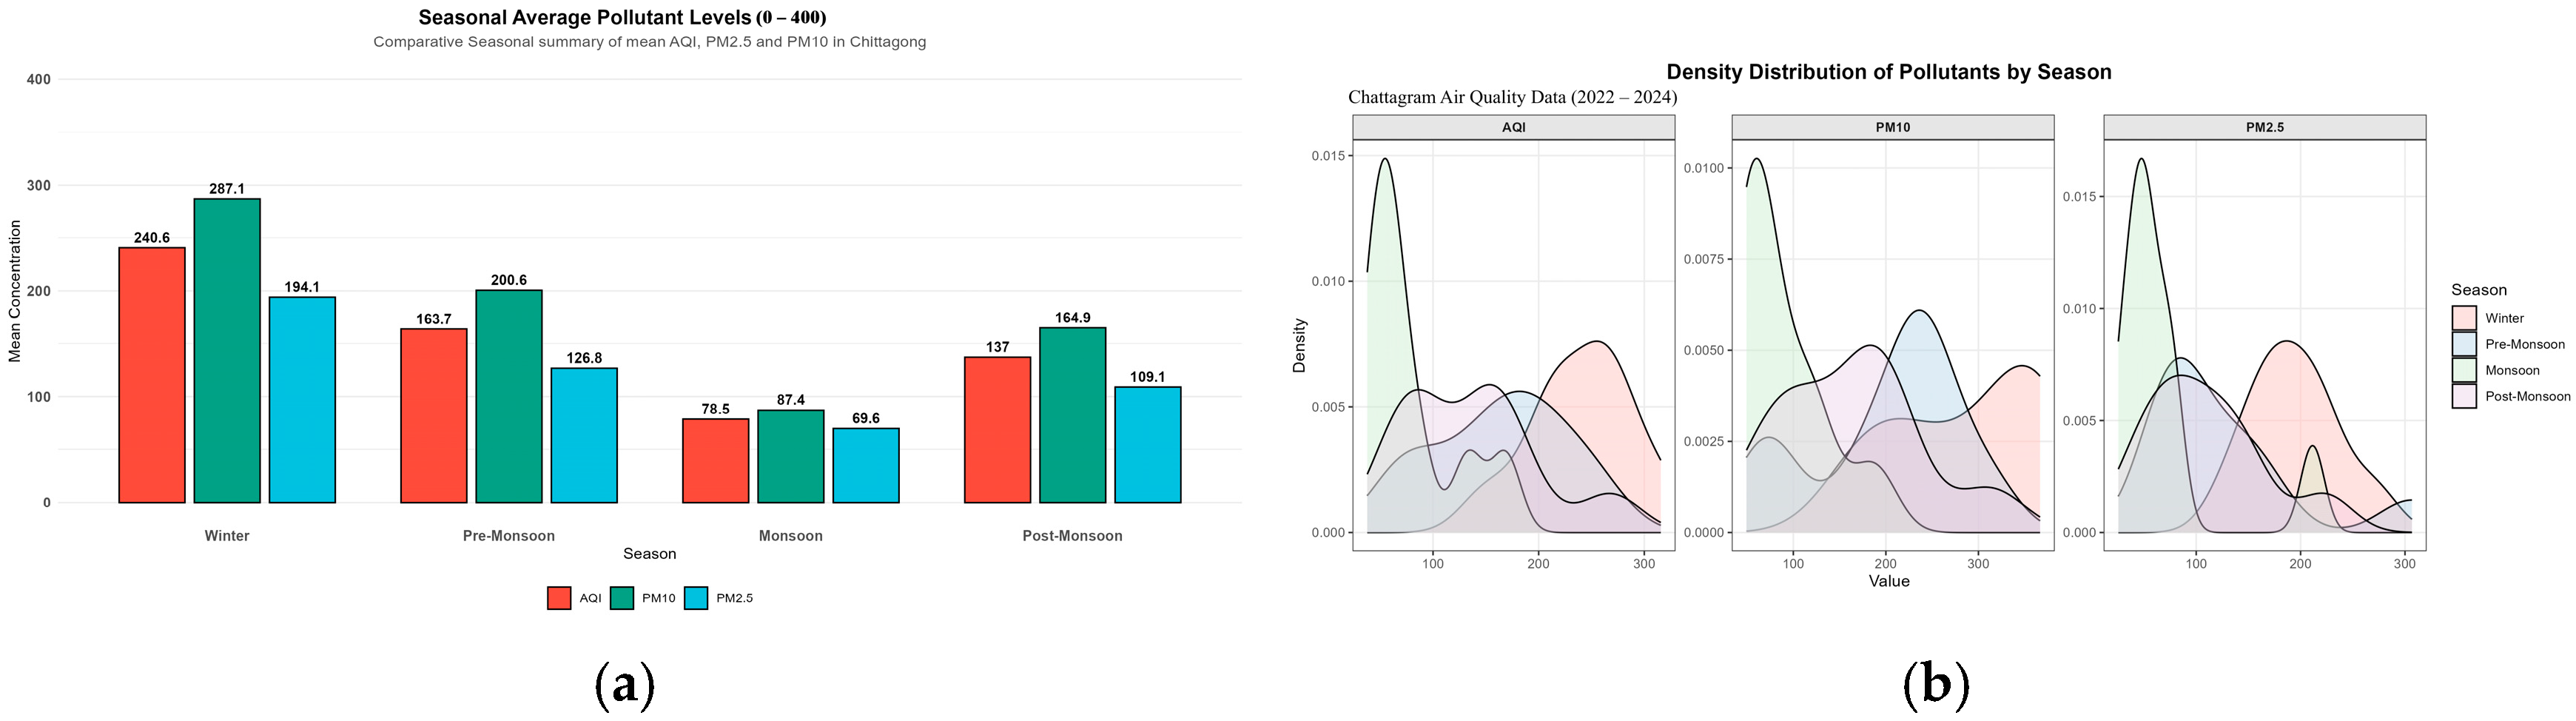
The seasonal averages of pollutants further confirm these patterns. winter records the highest mean concentrations (AQI 240.6, PM2.5 194.1 µg/m3, PM10 287.1 µg/m3), while monsoon has the lowest (AQI 78.5, PM2.5 69.6 µg/m3, PM10 87.4 µg/m3). Pre-monsoon and post-monsoon remain intermediate, consistent with the boxplot results. Comparative seasonal averages presented as bar charts emphasize Winter as the most polluted season, monsoon as the least polluted, and intermediate levels for pre-monsoon and post-monsoon (Figure 4a). Density plots illustrate the frequency distribution of pollutant concentrations by season. Winter has the highest density of elevated values, confirming its status as the most polluted season. Monsoon shows density concentrated at lower values, while pre-monsoon and post-monsoon have moderate distributions shown in Figure 5b.
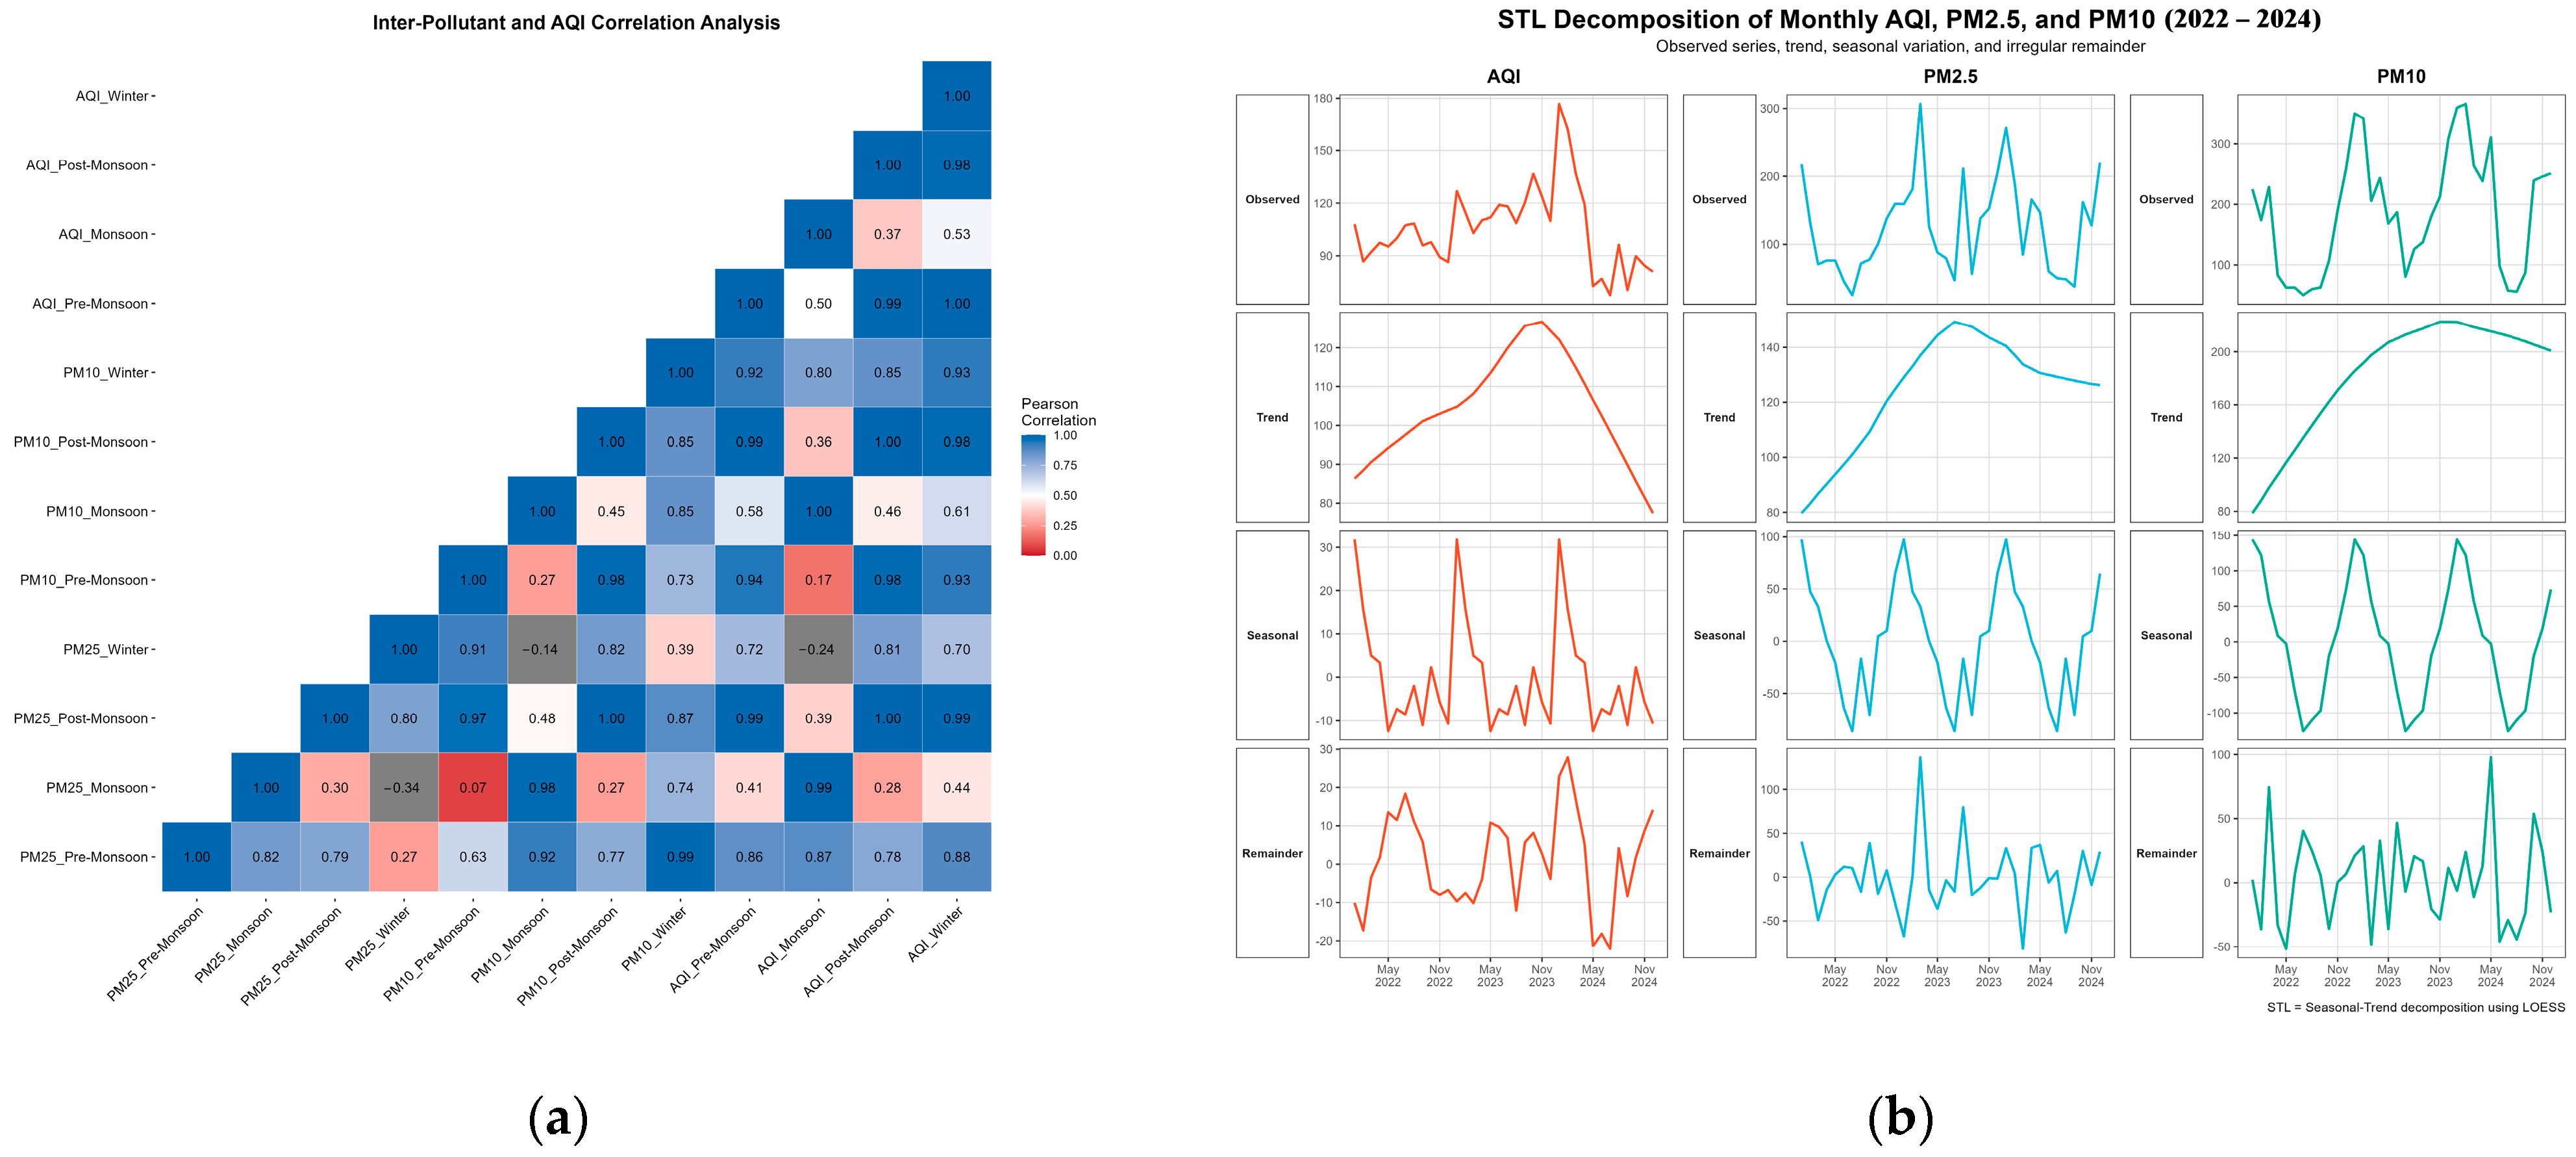
Pearson Correlation analysis demonstrates strong positive relationships between PM2.5, PM10, and AQI, particularly during winter and pre-monsoon, indicating that particulate matter is the primary driver of poor air quality. Correlation values above 0.80 confirm the robust association among pollutants shown in Figure 6a.
Figure 5b shows the STL decomposition showed clear temporal patterns in AQI, PM2.5, and PM10 during 2022–2024. The trend component indicated a general rise from 2022 to late 2023, followed by a decline in 2024. The seasonal component showed repeated monthly variation, which was stronger for PM2.5 and PM10 than for AQI. The remainder component suggested some short-term irregular changes beyond the main trend and seasonal pattern.

3.3. Comparative Model Assessment

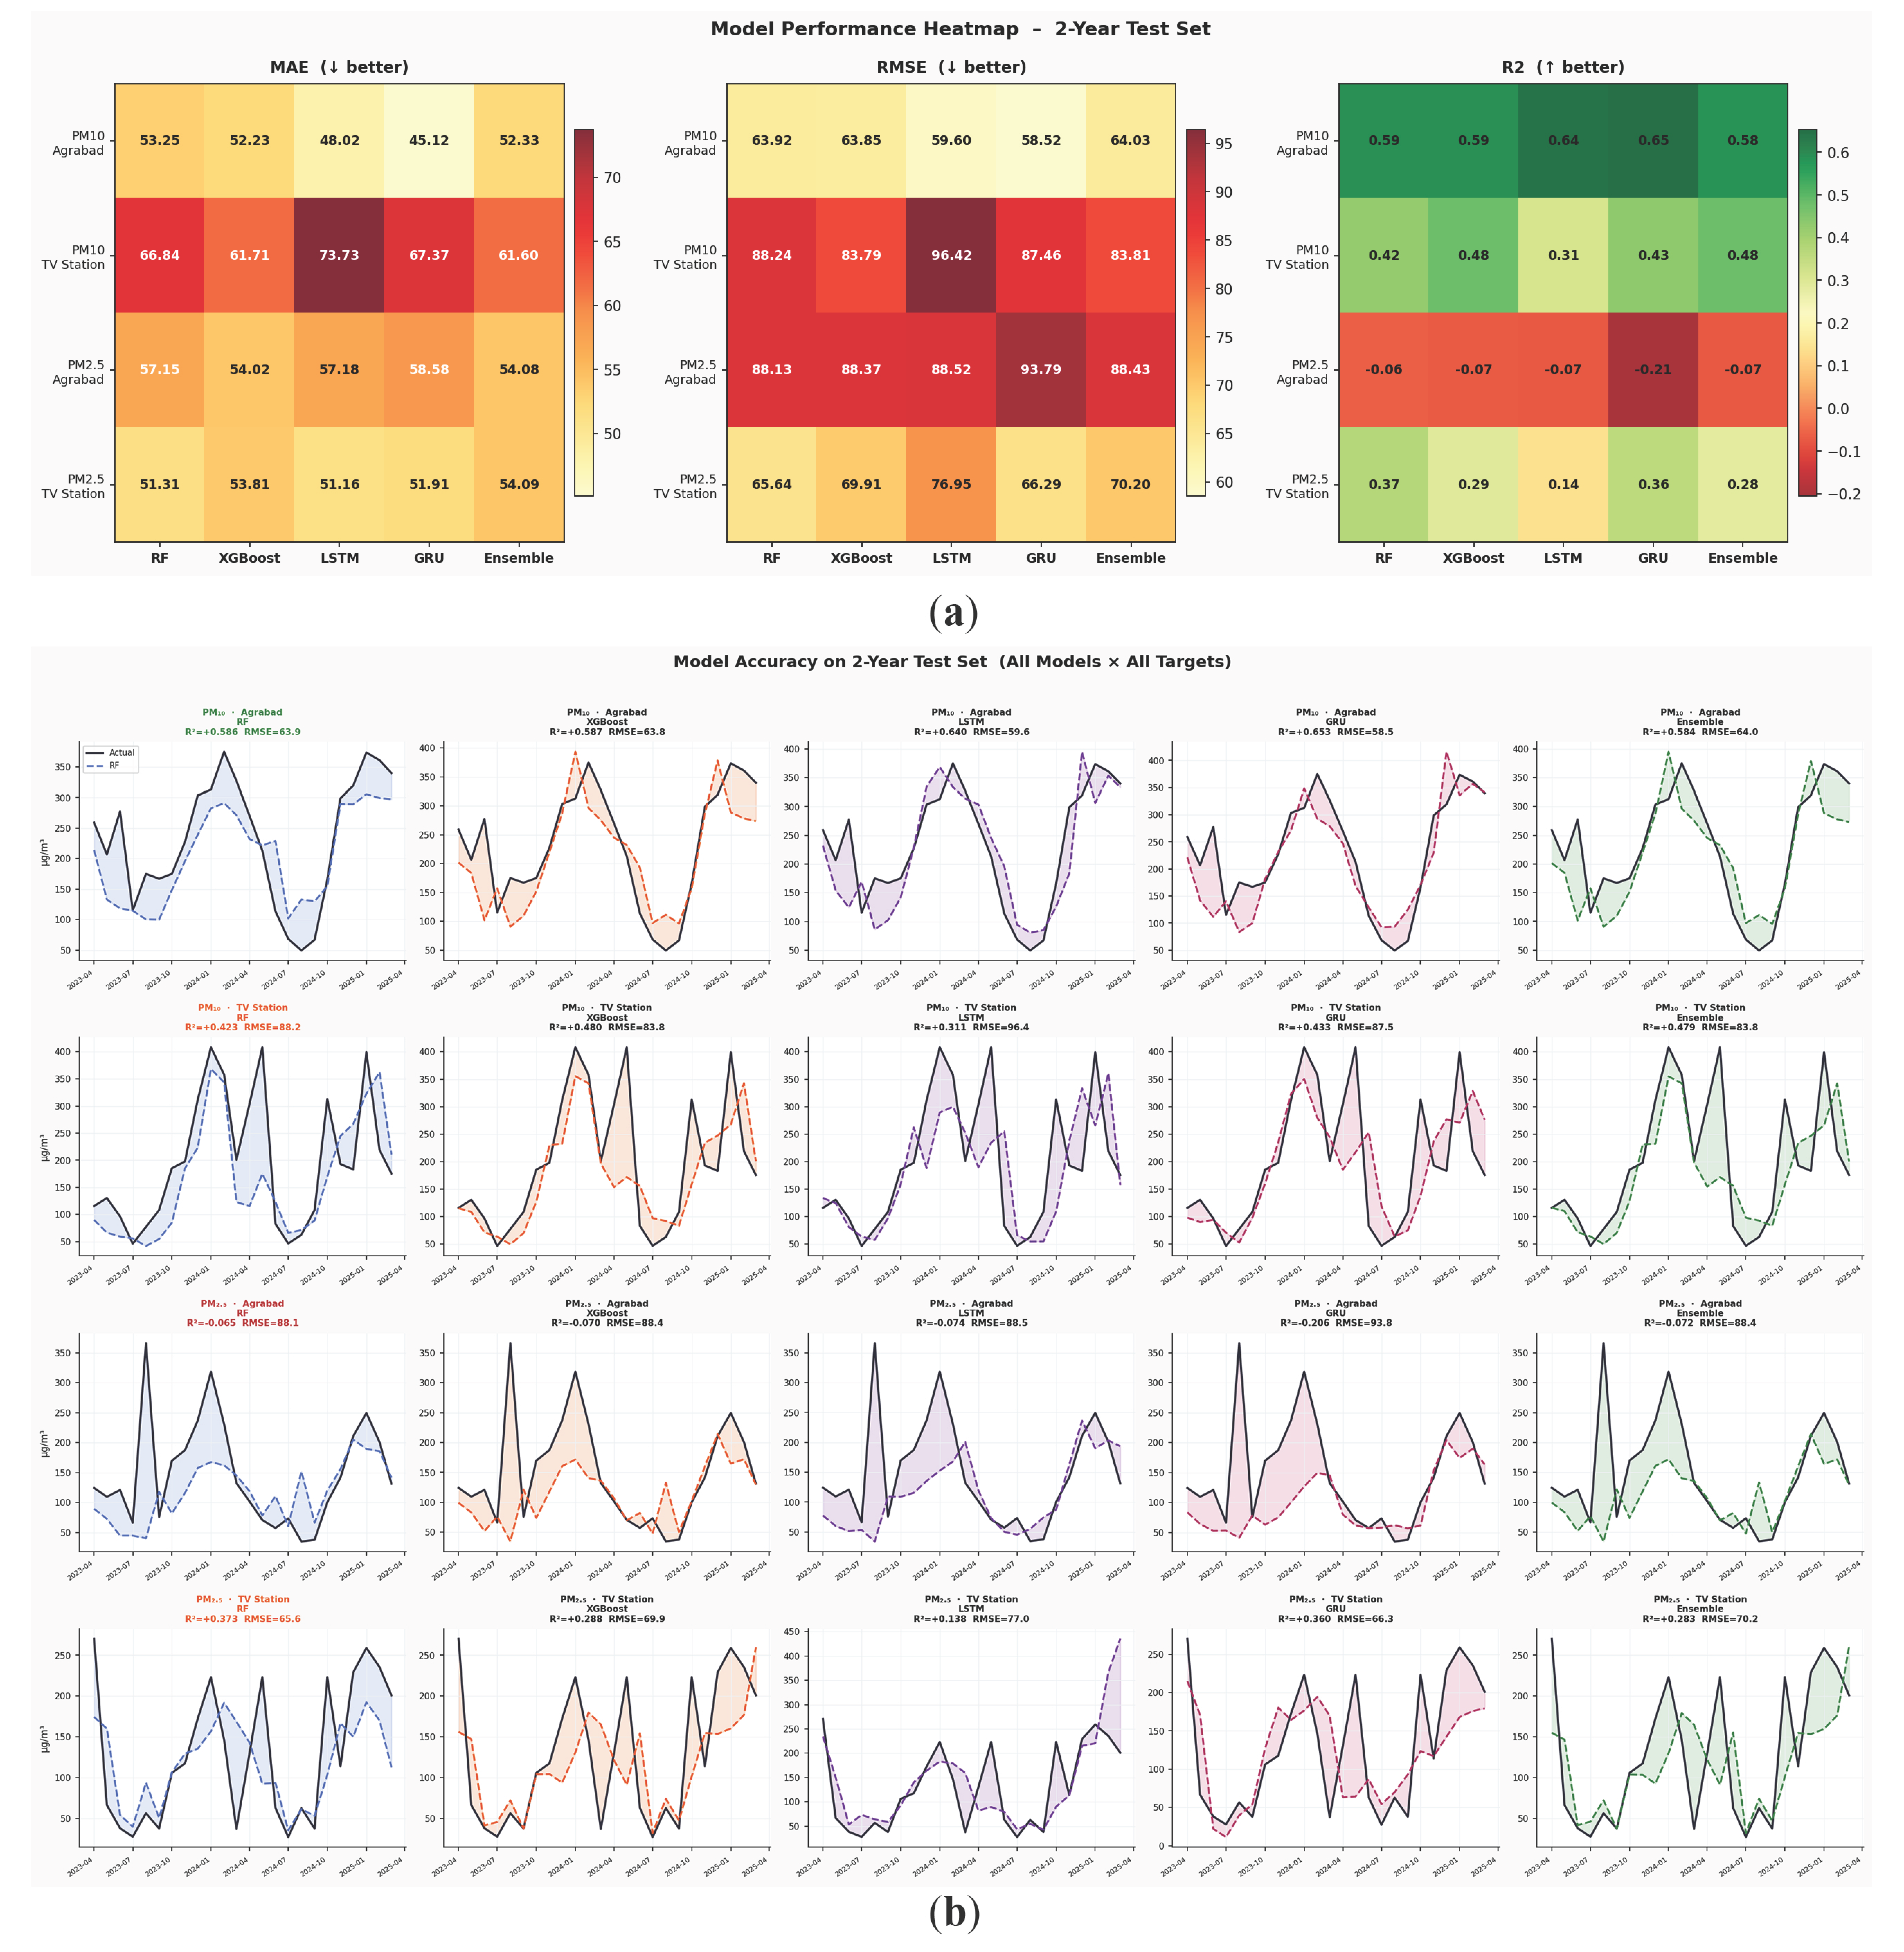
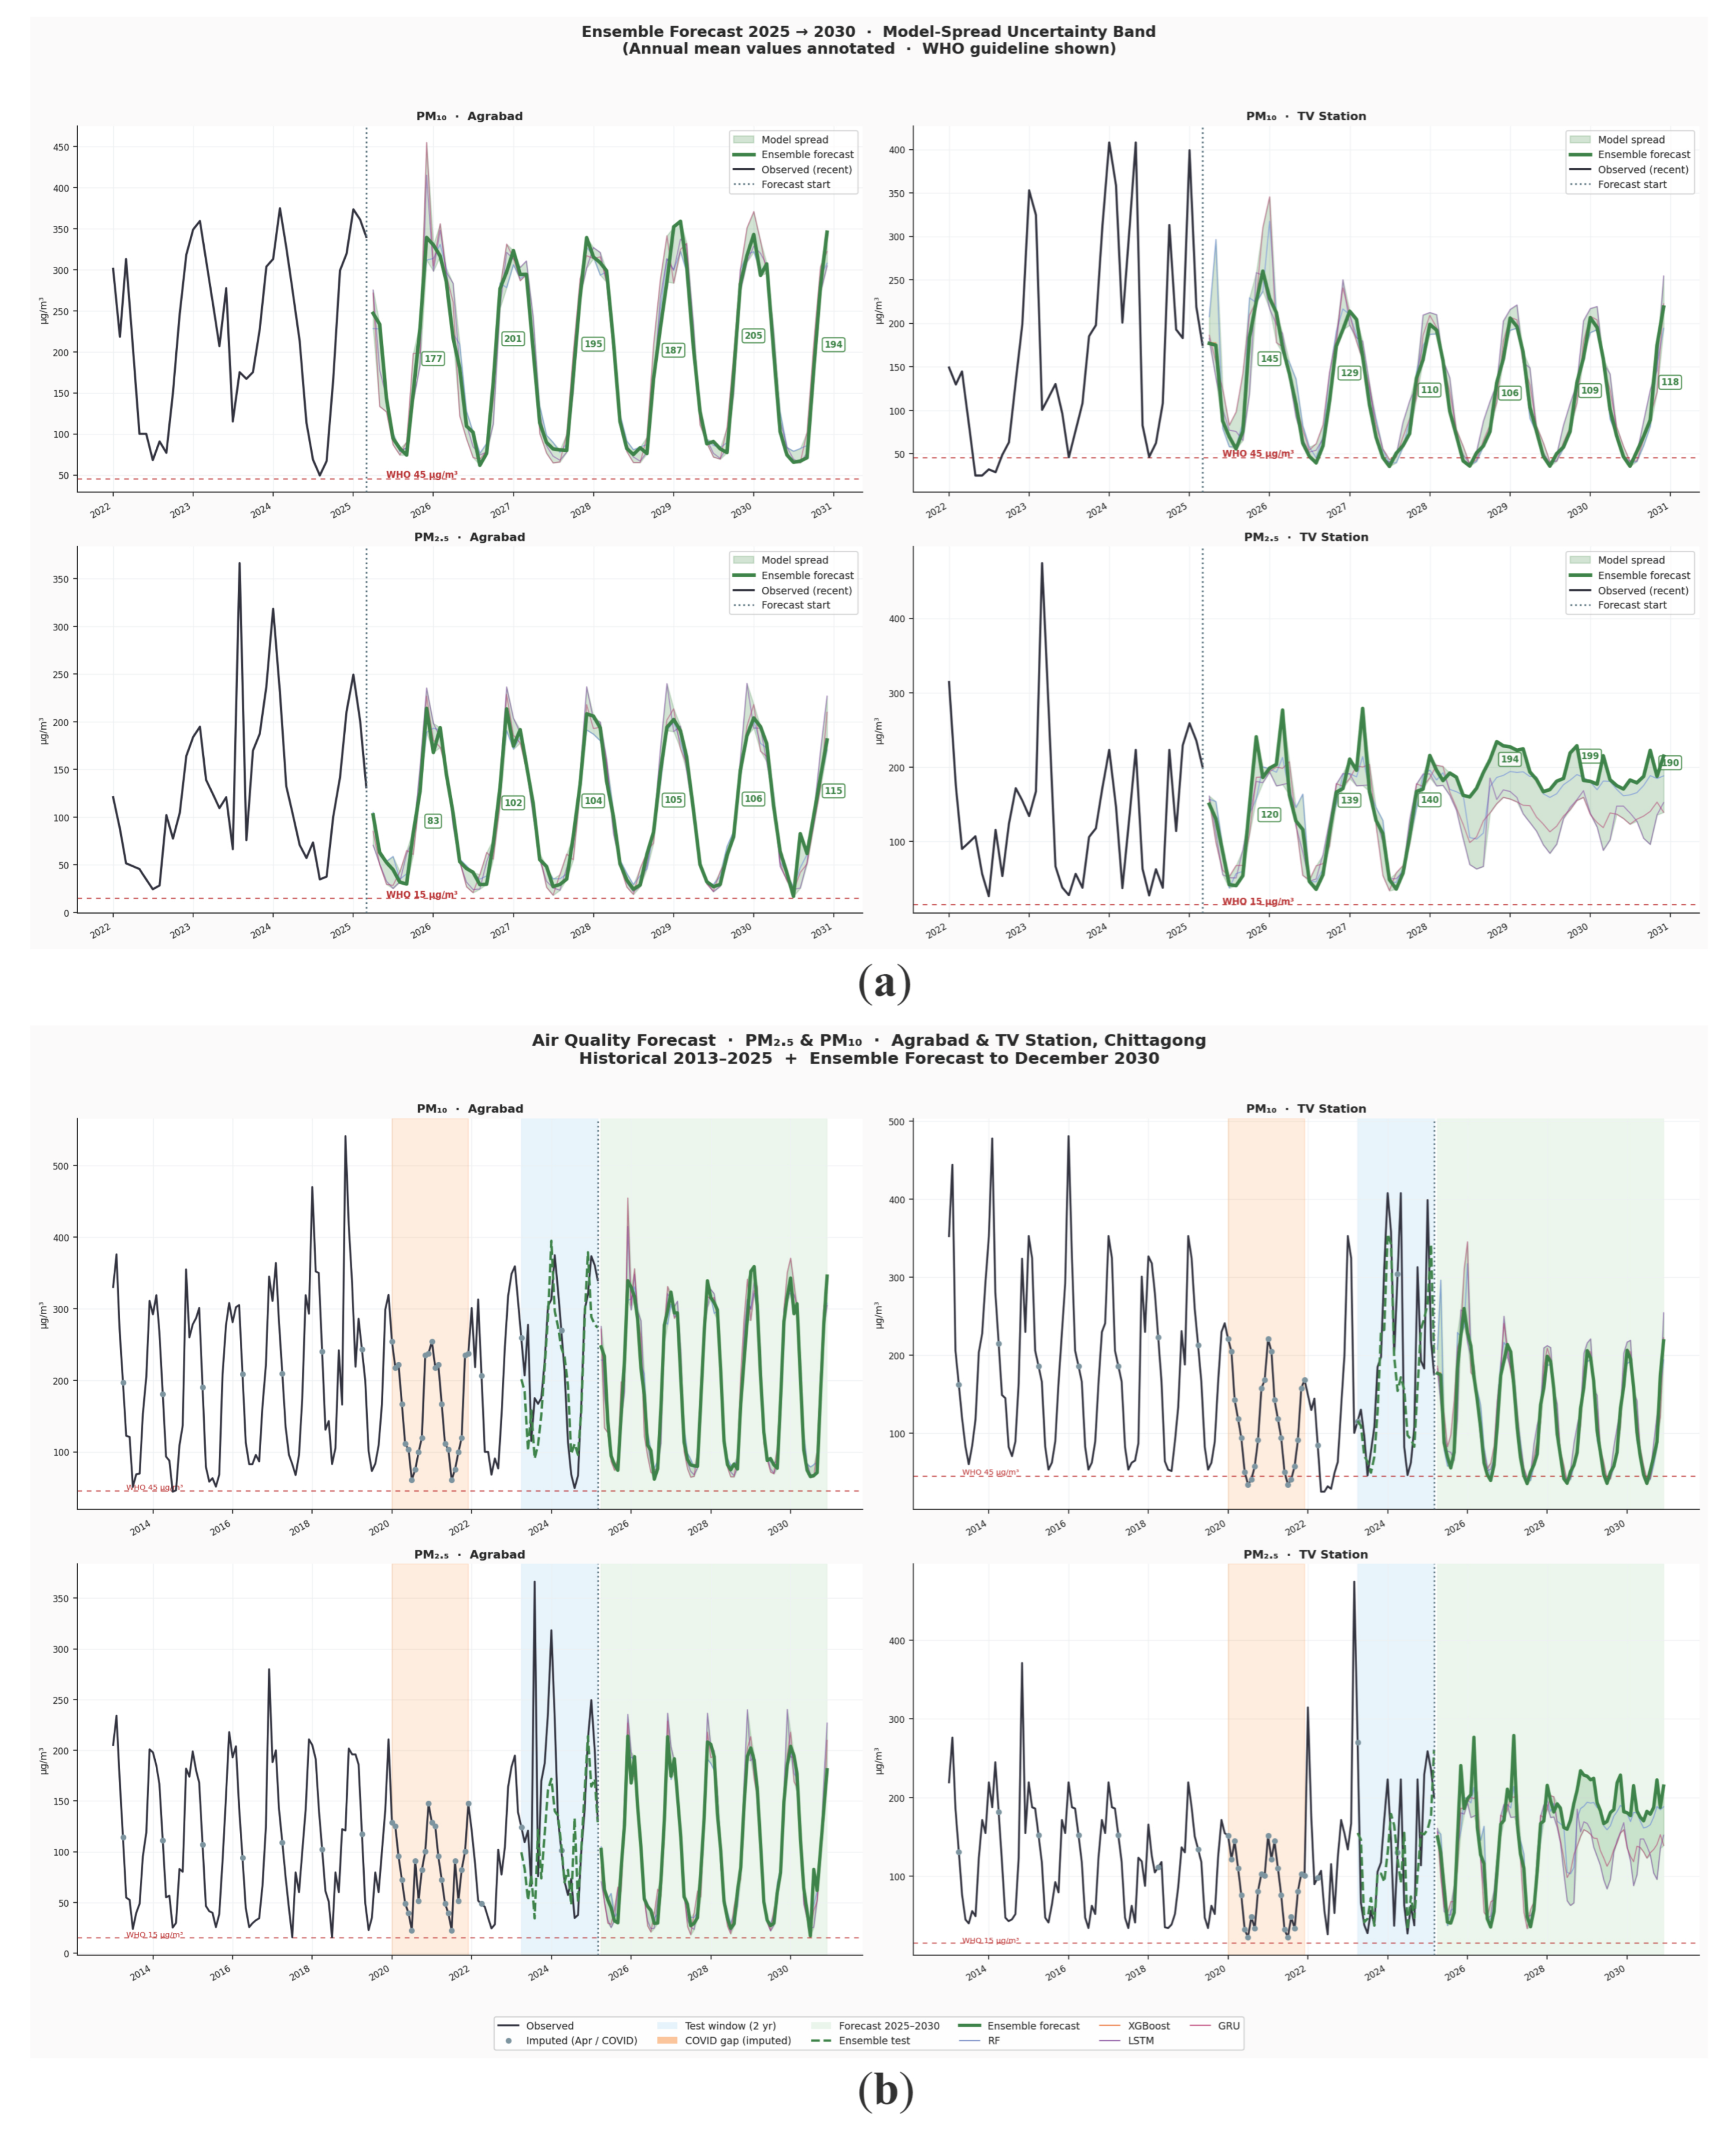
The predictive performance of five models Random Forest, XGBoost, LSTM, GRU, and Ensemble was evaluated using a two-year hold-out test dataset, as illustrated in Figure 5. Model performance varied substantially across pollutants and monitoring stations. For PM10, the models demonstrated moderate predictive skill, particularly at the Agrabad station. GRU achieved the strongest performance, with the lowest MAE of 45.12, lowest RMSE of 58.52, and highest R2 of 0.65, followed closely by LSTM with MAE of 48.02 and R2 of 0.64. At the TV Station, model performance was comparatively weaker, with R2 values ranging from 0.31 to 0.48, indicating moderate predictive capability. These results suggest that PM10 exhibits relatively stable temporal patterns that can be partially captured by machine learning approaches. In contrast, PM2.5 prediction proved considerably more challenging. At the Agrabad station, all models produced negative R2 values at −0.06 to −0.21, indicating performance worse than a baseline prediction using the observed mean concentration. Consequently, these models were considered unsuitable for forecasting purposes, and no future PM2.5 projections were generated or interpreted. At the TV Station, model performance improved slightly, with an R2 of 0.14–0.37, but predictive skill remained weak and insufficient for reliable long-term forecasting. Figure 5 further demonstrates that model performance was consistently stronger for PM10 than for PM2.5 across all algorithms. For PM10, R2 values ranged from 0.58 to 0.65 at Agrabad and from 0.31 to 0.48 at the TV Station. In contrast, PM2.5 models showed poor predictive performance, particularly at Agrabad, where all models failed to outperform a simple mean-value benchmark. These findings indicate that PM10 follows more predictable temporal patterns than PM2.5 within the study area. The comparatively poor performance of PM2.5 models suggests that fine particulate matter is influenced by additional factors not captured by the available dataset, including meteorological variability, heterogeneous emission sources, and secondary atmospheric processes. Therefore, the predictive modelling results are interpreted primarily as an assessment of model capability rather than as a basis for long-term PM2.5 forecasting shown in Figure 7. Comparison of historical and projected seasonal PM10 concentrations shown in Figure 8.

4. Discussion

The seasonal variability and correlation of air pollution in Chattogram’s urban ecosystem are consistent with previous studies demonstrating that particulate matter PM2.5 and PM10 concentrations reach their highest levels during winter and decline to minima during the monsoon season, primarily due to the cleansing effect of precipitation. Monthly trends further indicate that pollution levels typically peak in January and decrease to their lowest values around July, reflecting well-defined temporal patterns governed by meteorological conditions [1]. Correspondingly, the Air Quality Index (AQI) exhibits pronounced seasonal fluctuations, frequently reaching cautionary or unhealthy levels during winter and pre-monsoon periods, when extreme pollution events are most prevalent [12]. The present analysis confirms that air quality in Chattogram is strongly modulated by seasonal variability, with winter consistently associated with elevated concentrations of PM2.5, PM10, and AQI, and monsoon periods exhibiting substantially lower levels. This behaviour suggests that pollutant accumulation is enhanced under dry atmospheric conditions and suppressed during rainfall events, most likely through wet deposition processes. Such observations reinforce the dominant influence of meteorology in regulating particulate pollution dynamics in tropical urban environments. The monthly cycle, characterized by increasing pollution following the monsoon, a peak in January, and a gradual decline towards July, indicates that air pollution in Chattogram follows a predictable annual trajectory rather than irregular variability. Pre-monsoon and post-monsoon periods function as transitional phases with moderate pollution levels; however, the pre-monsoon season remains a critical risk period due to relatively elevated concentrations. This finding extends existing knowledge by identifying not only primary peak pollution periods but also secondary high-risk intervals. From a public health perspective, the persistence of elevated pollution during winter is particularly significant. Unlike transient pollution episodes, sustained high concentrations of PM2.5 and PM10 imply prolonged exposure, which may increase cumulative health risks. Moreover, the clustering of extreme pollution events during winter and pre-monsoon periods highlights these seasons as critical windows for exposure management and mitigation strategies. A key outcome of this study is the strong positive correlation of r > 0.80 between PM2.5, PM10, and AQI, indicating that particulate matter is the principal driver of air quality deterioration in Chattogram. This relationship provides a clear direction for intervention, suggesting that mitigation strategies targeting particulate emissions are likely to produce the most substantial improvements in overall air quality. In addition, this study establishes a framework for systematic seasonal analysis of urban air pollution, enabling evaluation of how temporal and environmental factors influence pollutant dynamics. By identifying consistent seasonal and monthly patterns, the approach supports more targeted monitoring and policy development, particularly in rapidly urbanizing regions. As urban air quality research increasingly shifts towards data-driven and season-specific management strategies, integrating long-term monitoring with targeted interventions becomes essential. The findings support the implementation of season-focused control measures such as stricter emission regulations, industrial controls, and dust management, particularly during winter and pre-monsoon periods. Overall, effective control of particulate matter will be critical for reducing exposure, safeguarding public health, and promoting sustainable urban development in Chattogram.
The findings support the implementation of season-focused control measures such as stricter emission regulations, industrial controls, and dust management, particularly during winter and pre-monsoon periods. Overall, effective control of particulate matter will be critical for reducing exposure, safeguarding public health, and promoting sustainable urban development in Chattogram. A comparative assessment of machine learning models showed substantial variation in predictive performance between pollutants and monitoring stations. PM10 demonstrated moderate predictive skill, particularly at the Agrabad station, where model performance reached R2 values of up to 0.65. In contrast, PM2.5 models performed poorly, including negative R2 values at Agrabad, indicating that these models did not provide reliable predictive capability. Consequently, PM2.5 forecasting results were not considered suitable for long-term projection or interpretation. These findings suggest that fine particulate matter is influenced by additional factors not captured in the present dataset, including meteorological variability, heterogeneous emission sources, and secondary atmospheric processes. Future studies should incorporate meteorological variables, source-specific emission data, and hybrid modelling approaches to improve predictive performance and better understand the drivers of particulate pollution in Chattogram.

5. Policy Recommendations

Policies to reduce particulate matter pollution in Chattogram’s urban ecosystem should focus on targeted seasonal and sectoral interventions, as supported by global evidence. Implementing stricter emission controls during winter and pre-monsoon periods, when pollution peaks, can be effective; this includes regulating industrial emissions, promoting cleaner fuels, and enforcing dust control measures [13]. Transportation policies such as vehicle emission standards, promotion of electric vehicles, congestion pricing, and improved public transit can significantly reduce traffic-related particulate pollution [14]. Urban planning strategies incorporating increased green spaces and urban vegetation help filter particulate matter and improve air quality sustainably [15]. Strengthening air quality monitoring networks and issuing timely public health advisories during high-risk seasons enable better community protection [16]. Finally, coordinated regional governance and precision pollution control targeting major polluting enterprises can enhance policy effectiveness while minimizing unintended spillover effects to neighbouring areas [17].

6. Limitations and Future Work

While this study provides a comprehensive assessment of air pollution dynamics in urban Chattogram using the maximum available dataset, several limitations should be acknowledged. The analysis relies on data from only two monitoring stations, which may not fully capture fine-scale spatial variability across the entire metropolitan area. However, this limitation arises from the restricted availability of monitoring infrastructure and publicly accessible data in Chattogram, rather than from the study design itself. At present, no additional long-term, continuous datasets are available for this region, and therefore, this study represents the most extensive temporal coverage currently attainable. Furthermore, the analysis primarily focuses on particulate matter and AQI, without incorporating detailed meteorological parameters or source apportionment data, which could further refine causal interpretations. The absence of these variables is also linked to data unavailability at consistent temporal scales. While this study provides a comprehensive assessment of air pollution dynamics in urban Chattogram using the maximum available dataset, several limitations should be acknowledged. The analysis relies on data from only two monitoring stations, which may not fully capture fine-scale spatial variability across the entire metropolitan area. However, this limitation arises from the restricted availability of monitoring infrastructure and publicly accessible data in Chattogram rather than from the study design itself. At present, no additional long-term continuous datasets are available for this region, and therefore this study represents the most extensive temporal coverage currently attainable. Furthermore, the analysis primarily focuses on particulate matter and AQI without incorporating detailed meteorological parameters or source-apportionment data, which could further refine causal interpretations. The absence of these variables is linked to data unavailability at consistent temporal scales. In addition, the machine-learning models evaluated in this study exhibited substantially different levels of predictive performance across pollutants and monitoring stations. While PM10 demonstrated moderate predictive skill, PM2.5 models particularly at the Agrabad station produced negative R2 values and were therefore unsuitable for reliable forecasting. Future research should integrate high-resolution meteorological data, expand spatial monitoring networks, and incorporate source-apportionment approaches to better understand the drivers of particulate pollution. Additional explanatory variables and hybrid modelling frameworks may also improve predictive performance, particularly for PM2.5. Despite these constraints, the present study establishes a robust baseline framework for understanding seasonal air-pollution dynamics and highlights the critical need for improved environmental monitoring infrastructure in Chattogram.

7. Conclusions

This study examined the correlation and seasonal variability of air pollution in Chattogram’s urban ecosystem, focusing on particulate matter (PM2.5 and PM10) and their influence on overall air quality. The objective was to identify temporal patterns, high-risk periods, and the relationships among key pollutants to better understand air quality dynamics in a rapidly urbanizing environment. The findings demonstrate clear and consistent seasonal and monthly patterns. Winter emerges as the most polluted season, with the highest concentrations of PM2.5, PM10, and AQI, while the monsoon season shows the lowest levels due to the natural cleansing effects of rainfall. Pre- and post-monsoon periods represent transitional phases with moderate pollution levels. Monthly analysis further confirms that pollution peaks in January and reaches its minimum in July, indicating a predictable annual cycle. In addition, strong positive correlations (r > 0.80) among PM2.5, PM10, and AQI confirm that particulate matter is the primary driver of air quality degradation in Chattogram. These results highlight significant implications for environmental management and public health. The concentration of extreme pollution events during winter and pre-monsoon identifies critical periods requiring targeted intervention. Since particulate matter is the dominant contributor to poor air quality, strategies focusing on emission control, industrial regulation, and dust management are likely to yield the most effective improvements. However, this study has several limitations. The analysis relies on data from only two monitoring stations and does not explicitly incorporate detailed meteorological variables or source-apportionment information, which may further improve understanding of pollution drivers. Future research should expand spatial monitoring coverage and integrate meteorological and emission-related datasets to provide a more comprehensive assessment of urban air quality dynamics. Overall, this study provides a robust framework for understanding seasonal air pollution behaviour in Chattogram and demonstrates that particulate matter remains the dominant driver of air-quality degradation. The results highlight the importance of seasonally targeted interventions, particularly during winter and pre-monsoon periods, and provide evidence to support air-quality management strategies aimed at reducing exposure, protecting public health, and promoting sustainable urban development.

Author Contributions

Conceptualization, S.T.J.S.; methodology, S.T.J.S. and Y.U.; validation, S.T.J.S., M.N.R. and Y.U.; formal analysis, S.T.J.S. and Y.U.; investigation, S.T.J.S. and Y.U.; data curation, M.N.R. and Y.U.; writing—original draft preparation, S.T.J.S., Y.U. and M.K.H.; writing—review and editing, S.T.J.S., M.N.R. and Y.U.; visualization, S.T.J.S., M.N.R. and Y.U.; supervision, S.T.J.S. and M.N.R. All authors have read and agreed to the published version of the manuscript.

Funding

This research received no external funding.

Data Availability Statement

The data supporting the findings of this study are available from the Department of Environment (DoE), Bangladesh. The datasets used and analyzed during the current study can be accessed through the Department of Environment website (http://doe.gov.bd/).

Conflicts of Interest

The authors declare no conflicts of interest.

References

  1. Majumder, A.K.; Nayeem, A.A.; Patoary, M.N.A.; Carter, W.S. Temporal Variation of Ambient Particulate Matter in Chattogram City, Bangladesh. J. Air Pollut. Health 2020, 5, 33–42. [Google Scholar] [CrossRef]
  2. Lim, E.Y.; Kim, G.-D. Particulate Matter-Induced Emerging Health Effects Associated with Oxidative Stress and Inflammation. Antioxidants 2024, 13, 1256. [Google Scholar] [CrossRef] [PubMed]
  3. Zhen, S.; Luo, M.; Xin, F.; Ma, L.; Xu, D.; Cheng, X.; Shao, Y. Chemical Composition, Source Distribution and Health Risk Assessment of PM2.5 and PM10 in Beijing. Atmos. Pollut. Res. 2025, 16, 102448. [Google Scholar] [CrossRef]
  4. Hossen, A.; Masum, M.H.; Salauddin, M.; Pal, S.K. Trend Analysis of Ambient Air Quality of Chattogram City. AIP Conf. Proc. 2023, 2713, 060009. [Google Scholar] [CrossRef]
  5. Hadeed, S.J.; O’Rourke, M.K.; Burgess, J.L.; Harris, R.B.; Canales, R.A. Imputation Methods for Addressing Missing Data in Short-Term Monitoring of Air Pollutants. Sci. Total Environ. 2020, 730, 139140. [Google Scholar] [CrossRef] [PubMed]
  6. Tomy, L.; Chesneau, C.; Madhav, A.K. Statistical Techniques for Environmental Sciences: A Review. Math. Comput. Appl. 2021, 26, 74. [Google Scholar] [CrossRef]
  7. Sampaio, N.A.S.; Mazza, F.C.; de Siqueira, S.S.S.; Junior, J.E.M.; de Souza Moutinho, J.V.; de Oliveira Pacífico, L. Applications of Correlation Analysis in Environmental Problems. Rev. Gest. Soc. Ambient.-RGSA 2024, 18, e04925. [Google Scholar] [CrossRef]
  8. Tırınk, S. Machine Learning-Based Forecasting of Air Quality Index under Long-Term Environmental Patterns: A Comparative Approach with XGBoost, LightGBM, and SVM. PLoS ONE 2025, 20, e0334252. [Google Scholar] [CrossRef] [PubMed]
  9. Jarif, M.I.A.; Siam, M.A.H.; Rahin, T.A. Machine Learning Approaches for PM2.5 Prediction: A Comparative Study. Int. J. Latest Technol. Eng. Manag. Appl. Sci. 2025, 14, 845–854. [Google Scholar] [CrossRef]
  10. Makhdoomi, A.; Sarkhosh, M.; Ziaei, S. PM2.5 Concentration Prediction Using Machine Learning Algorithms: An Approach to Virtual Monitoring Stations. Sci. Rep. 2025, 15, 8076. [Google Scholar] [CrossRef] [PubMed]
  11. Wei, C.; Zhao, C.; Hu, Y.; Tian, Y. Predicting the Concentration Levels of PM2.5 and O3 for Highly Urbanized Areas Based on Machine Learning Models. Sustainability 2025, 17, 9211. [Google Scholar] [CrossRef]
  12. Behera, R.R.; Satapathy, D.R.; Majhi, A.; Panda, C.R. Spatiotemporal Variation of Atmospheric Pollution and Its Plausible Sources in an Industrial Populated City, Bay of Bengal, Paradip, India. Urban Clim. 2021, 37, 100860. [Google Scholar] [CrossRef]
  13. Jonidi Jafari, A.; Charkhloo, E.; Pasalari, H. Urban Air Pollution Control Policies and Strategies: A Systematic Review. J. Environ. Health Sci. Eng. 2021, 19, 1911–1940. [Google Scholar] [CrossRef] [PubMed]
  14. Khreis, H.; Sanchez, K.A.; Foster, M.; Burns, J.; Nieuwenhuijsen, M.J.; Jaikumar, R.; Ramani, T.; Zietsman, J. Urban Policy Interventions to Reduce Traffic-Related Emissions and Air Pollution: A Systematic Evidence Map. Environ. Int. 2023, 172, 107805. [Google Scholar] [CrossRef] [PubMed]
  15. Vashist, M.; Kumar, T.V.; Singh, S.K. A Comprehensive Review of Urban Vegetation as a Nature-Based Solution for Sustainable Management of Particulate Matter in Ambient Air. Environ. Sci. Pollut. Res. 2024, 31, 26480–26496. [Google Scholar] [CrossRef] [PubMed]
  16. Feng, T.; Sun, Y.; Shi, Y.; Ma, J.; Feng, C.; Chen, Z. Air Pollution Control Policies and Impacts: A Review. Renew. Sustain. Energy Rev. 2024, 191, 114071. [Google Scholar] [CrossRef]
  17. Gopikrishnan, G.S.; Kuttippurath, J. Impact of the National Clean Air Programme (NCAP) on the Particulate Matter Pollution and Associated Reduction in Human Mortalities in Indian Cities. Sci. Total Environ. 2025, 968, 178787. [Google Scholar] [CrossRef] [PubMed]
Figure 1. Schemes: (a) sLocation of the study area in Chattogram City, Bangladesh, showing its national and district-level position, city boundary; (b) Methodological framework of the study, illustrating the steps from study-area selection and air-quality data collection to preprocessing, statistical and temporal analyses, and interpretation of seasonal variability, correlations, and high-risk periods.
Eesp 42 00019 g001
Figure 2. (a) Multi-city comparison of annual mean PM2.5 concentrations across Bangladesh (January 2023–April 2025). Error bars represent ±1 standard deviation. Dashed lines indicate WHO annual guideline values. Chattogram monitoring stations are highlighted; (b) multi-city comparison of annual mean PM10 concentrations across Bangladesh (January 2023–April 2025). Error bars represent ±1 standard deviation. Dashed lines indicate WHO and Bangladesh DoE annual standards. Chattogram monitoring stations are highlighted. The yellow dotted line marks the WHO PM10 guideline of 45 µg/m3, while the red dashed line marks the Bangladesh DoE standard of 150 µg/m3.
Eesp 42 00019 g002
Figure 3. Seasonal distribution of (a) PM2.5; (b) PM10 concentrations at the Agrabad and TV Station monitoring sites in Chattogram during 2013–2025. Boxes represent the interquartile range (IQR), central lines indicate medians, whiskers extend to 1.5× IQR, and circles denote outliers. Horizontal dashed lines indicate the World Health Organization (WHO) guideline values and Bangladesh Department of Environment (DoE) annual standards. The yellow dotted line represents the WHO PM10 guideline of 45 µg/m3, while the red dashed line represents the Bangladesh DoE standard of 150 µg/m3.
Eesp 42 00019 g003
Figure 4. Illustrates: (a) monthly trend of AQI, PM2.5, and PM10 in Chattogram; (b) seasonal boxplots of AQI, PM10, and PM2.5 concentrations showing medians, interquartile ranges, and outliers across monsoon, pre-monsoon, post-monsoon, and winter.
Eesp 42 00019 g004
Figure 5. Illustrates: (a) seasonal mean pollutant concentrations (AQI, PM2.5, PM10) on a 0–400 scale; (b) density distribution of AQI, PM10, and PM2.5 across seasons. Peaks indicate the frequency of elevated pollutant concentrations, with winter showing the largest peak.
Eesp 42 00019 g005
Figure 6. Illustrates: (a) heatmap showing seasonal Pearson Correlations between PM2.5, PM10, and AQI.; (b) STL decomposition of monthly AQI, PM2.5, and PM10 in Chattogram (2022–2024).
Eesp 42 00019 g006
Figure 7. (a) Heatmap of MAE, RMSE, and R2 metrics for Random Forest, XGBoost, LSTM, GRU, and Ensemble models; (b) comparison between observed and predicted concentrations during the test period. Results indicate moderate predictive capability for PM10, while PM2.5 models at Agrabad failed to achieve acceptable predictive skill with negative R2 values and were not used for forecasting interpretation.
Eesp 42 00019 g007
Figure 8. (a) Comparison of historical and projected seasonal PM10 concentrations at Agrabad and TV Station. PM2.5 projections are not presented because model validation indicated insufficient predictive skill for long-term forecasting; (b) historical observations and ensemble projections of PM10 concentrations at Agrabad and TV Station (2025–2030). PM2.5 projections are not applicable because model validation indicated insufficient predictive skill for reliable long-term forecasting.
Eesp 42 00019 g008
Table 1. Monthly average pollutant concentrations in Chattogram.
MonthPM2.5PM10AQI
January215.85311.42263.63
February167.02299.97233.49
March154.08232.92193.5
April122.72188.42155.57
May103.75180.55142.15
June61.75121.0291.39
July40.9362.6751.8
August106.0378.492.22
September57.4295.9876.7
October146.15200.03173.09
November123.63198.57161.1
December199.32249.87224.59
Disclaimer/Publisher’s Note: The statements, opinions and data contained in all publications are solely those of the individual author(s) and contributor(s) and not of MDPI and/or the editor(s). MDPI and/or the editor(s) disclaim responsibility for any injury to people or property resulting from any ideas, methods, instructions or products referred to in the content.