Abstract
Climate change is disrupting nature, human lives, and infrastructure worldwide. Its effects are becoming more evident in every region, with IPCC reports warning of a warming world and an increase in extreme weather events. The scale and severity of climate change’s impacts exceed earlier estimates, leading to widespread disruption of ecosystems and societies. It threatens food production, clean water availability, and ultimately, the health and well-being of billions. The primary driver of these changes is rising global temperatures, which significantly influence climate patterns and hydrological conditions. This study analyzes time series of summer air temperature (at 500 hPa and 850 hPa) and total precipitation from NOAA records across ten major administrative regions of Greece over a 35-year period (1989–2024). Using a machine learning approach, the analysis identifies climate trends and extreme weather patterns while providing climate forecasts to support water management improvements and public health initiatives.
1. Introduction
Extreme precipitation, catastrophic typhoons, prolonged droughts, rising temperatures, and off-season weather phenomena have become a common denominator in recent decades. But despite this remarkable increase in significant weather events, the question of if and to what extent the climate has changed remains a topic of debate. Scientific articles and studies about regional and global climate changes are part of global news alongside counterarguments from individuals or groups of people due to personal weather experiences and personal forecasts and observations. This endless debate can only be answered by in-depth analysis of climate and meteorological data.
In this study, we will analyze climate data from the ten major administrative regions of Greece over a period of 35 years (1990–2024) during summer months, with a focus on the temperature and precipitation trends at the regional and country levels.
2. Methodology
The methodology employed in this study applies time series analysis [1] of temperature data at the 500 hPa [2] atmospheric layer, 850 hPa [3] atmospheric layer, and surface total precipitation [4]. The selection of the 500 hPa and 850 hPa atmospheric layers is driven by their relative disconnection to surface-level influences, such as the Foehn effect [5], temperature inversions [6], and the urban heat island effect [7,8], which can distort surface climate data. For the scope of this study, ten large administrative regions of Greece (Thrace, Central Macedonia, Epirus, Thessaly, Ionian Islands/Western Greece, Central Greece/Attica/Euboea, Peloponnese, North Aegean, Crete, and South Aegean) were selected (Figure 1).
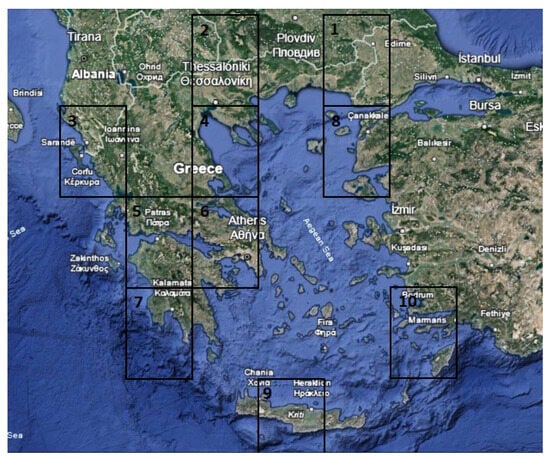
Figure 1.
NOAA grids, corresponding to the administrative regions of the study.
These regions correspond to a grid resolution of 2.5 × 2.5 degrees with respect to a spatial analysis. Daily datasets of temperature values at the 500 hPa and 850 hPa pressure layers, as well as mean precipitation rates, are sourced from NOAA’s Physical Sciences Laboratory and subsequently stored in a structured database for further analysis. This data-driven approach provides a robust framework through a machine learning algorithm that integrates climatic and astronomical cycles—specifically El Niño, La Niña, and solar activity—by leveraging statistical weighting, probabilistic inference, and aggregated pattern recognition [9] for investigating regional climate trends across Greece over the specified period [10].
Database and Datasets
Upon completion of the data registration process, three distinct databases are created for each of ten regions, corresponding to the summer months of June, July, and August. These databases will include average values for each summer season over the 35-year period at the 850 hPa, 500 hPa, and total precipitation levels, serving as the primary input for the climate analysis. The analysis will focus on the following key areas:
- Trends in temperature and precipitation fluctuations (both monthly and seasonal).
- Trends in average temperature and precipitation (both monthly and seasonal).
- Comparative analysis of grid-based values across regions.
- Visual representation through diagrams and charts.
These analytical results will enable a comprehensive understanding of long-term climatic trends, as the seasonal and average data are juxtaposed with annual variations. The comparative approach allows for a deeper assessment of both inter-annual variability and potential shifts in climate patterns across the studied regions.
3. Results
3.1. Country Analysis
3.1.1. 500 hPa
The results of data analysis for 500 hPa (Figure 2) show a clear trend of increase with a rate of 0.045 degrees Celsius per year and a total increase of +1.5 degrees Celsius from 1990 to 2024. The diagram shows incidents of lower temperatures in a periodicity of ~9 years (1996, 2006, 2014, 2021) and incidents of higher temperatures in a periodicity of ~10 years (1998, 2012, 2024). Highest temperature in 2024 and lower temperature in 1992.
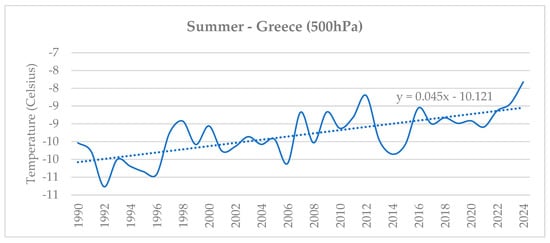
Figure 2.
Temperature trend in 500 hPa (Greece).
3.1.2. 850 hPa
The results of data analysis for 850 hPa (Figure 3) show a clear trend of increase with a rate of 0.0642 degrees Celsius per year and a total increase of +2.2 degrees Celsius from 1990 to 2024. The diagram shows incidents of lower temperatures in a periodicity of ~9 years (1996, 2004, 2013, and 2020) and incidents of higher temperatures in a periodicity of ~10 years (1998, 2007, 2012, and 2024). Highest temperature in 2024 and lowest temperature in 1991.
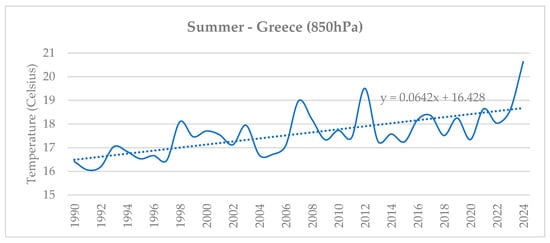
Figure 3.
Temperature trend in 850 hPa (Greece).
3.1.3. Total Precipitation
The results of data analysis for total precipitation (Figure 4) show a clear trend of increase with a rate of 1.6239 mm per year and a total increase of +57 mm from 1990 to 2024. The diagram discloses a serious increase in summer precipitation after 2017. From 1990 to 2016, the average precipitation was ~40 mm per year, while from 2017 to 2024, the average precipitation reached an amount of ~88 mm per year.
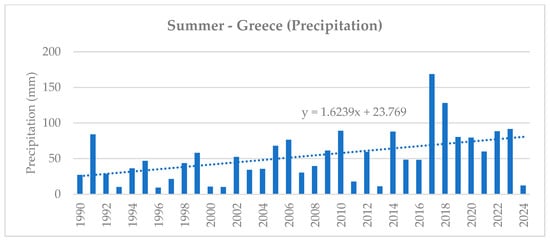
Figure 4.
Precipitation trend (Greece).
3.2. Region Analysis
3.2.1. Rate of Change per Year
The results of data analysis show a clear trend of temperature and precipitation increase in all examined regions (Table 1).

Table 1.
Rate of change per year (summer).
3.2.2. Total Temperature Deviation at 500 hPa and 850 hPa
The results of data analysis show a clear trend of temperature increase in all examined regions (Figure 5).
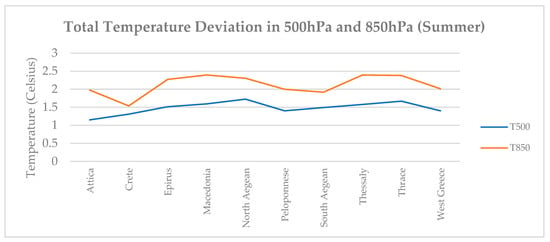
Figure 5.
Total temperature deviation at 500 hPa and 850 hPa (Summer).
3.2.3. Total Precipitation Deviation
The results of data analysis show a clear trend of precipitation increase in the west and north regions and a slight precipitation increase in the east and south (no change in Crete) (Figure 6).
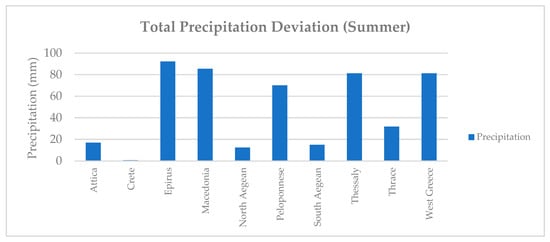
Figure 6.
Total precipitation deviation (summer).
4. Conclusions
- Temperature at 500 hPa: Projected increase ranging from 1.2 °C to 1.7 °C.
- Temperature at 850 hPa: Projected increase ranging from 1.5 °C to 2.4 °C.
- Total Precipitation: Projected increase ranging from 1 mm to 92 mm.
The analysis reveals a consistent upward trend in both mid- and lower-tropospheric temperatures of 500 hPa and 850 hPa layers, as well as in total precipitation [11]. Although these changes are not uniformly distributed across all regions, the overall pattern of increase is evident [12]. It is particularly noteworthy that the variation in total precipitation among the regions of Attica, North Aegean, South Aegean, and Crete is relatively small, indicating a similar response in precipitation trends across the east and south areas of Greece. Additionally, the overall increase in summer precipitation is substantiated mainly by the notable enhancement in precipitation during June (Figure 7).
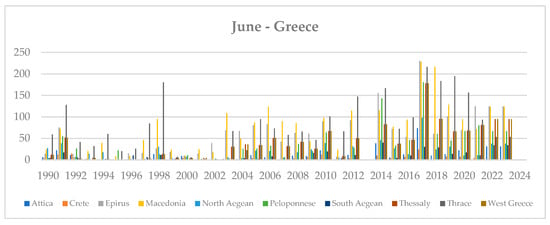
Figure 7.
Precipitation trend June (Greece).
This shift suggests a significant alteration in atmospheric circulation dynamics [13], urging further investigation in subsequent climate studies along with new perceptions in climate templates [14]. The observed increase in precipitation is beneficial for national water reservoirs [15] and terrestrial vegetation, as it contributes to a reduction in the duration and intensity of summer dry periods.
Author Contributions
Conceptualization, D.K. and P.N.; methodology, D.K. and P.N.; software, D.K. and P.N.; validation, D.K. and P.N.; formal analysis, D.K. and P.N.; investigation, D.K. and P.N.; resources, D.K. and P.N.; data curation, D.K. and P.N.; writing—original draft preparation, D.K. and P.N.; writing—review and editing, D.K. and P.N.; visualization, D.K. and P.N.; supervision, D.K. and P.N.; project administration, D.K. and P.N.; funding acquisition, D.K. and P.N. All authors have read and agreed to the published version of the manuscript.
Funding
This research received no external funding.
Institutional Review Board Statement
Not applicable.
Informed Consent Statement
Not applicable.
Data Availability Statement
Data unavailable due to privacy restrictions.
Conflicts of Interest
The authors declare no conflict of interest.
References
- Diebold, F.X.; Kilian, L.; Nerlove, M. Time series analysis. In Macroeconometrics and Time Series Analysis; Springer: Berlin/Heidelberg, Germany, 2010; pp. 317–342. [Google Scholar] [CrossRef]
- forecast.weather.gov. NOAA’s National Weather Service-Glossary. Available online: https://forecast.weather.gov/glossary.php?word=hpa (accessed on 8 August 2025).
- Noaa.gov. Constant Pressure Charts: 850 mb. 2023. Available online: https://www.noaa.gov/jetstream/upper-air-charts/constant-pressure-charts-850-mb (accessed on 8 August 2025).
- Noaa.gov. Precipitation. 2024. Available online: https://www.noaa.gov/jetstream/atmosphere/precipitation (accessed on 8 August 2025).
- Met Office. Foehn Effect. Met Office. 2018. Available online: https://weather.metoffice.gov.uk/learn-about/weather/types-of-weather/wind/foehn-effect (accessed on 8 August 2025).
- National Weather Service. What Is an Inversion? National Weather Service Little Rock, Arkansas. Available online: https://www.weather.gov/media/lzk/inversion101.pdf (accessed on 8 August 2025).
- United States Environmental Protection Agency. What Are Heat Islands? USEPA. 2024. Available online: https://www.epa.gov/heatislands/what-are-heat-islands (accessed on 8 August 2025).
- Philandras, C.M.; Metaxas, D.A.; Nastos, P.T. Climate Variability and Urbanization in Athens. Theor. Appl. Climatol. 1999, 63, 65–72. [Google Scholar] [CrossRef]
- Kampolis, D. Statistical Analysis for Long-Term Weather Forecast. Environ. Sci. Proc. 2023, 26, 30. [Google Scholar] [CrossRef]
- Kambezidis, H.D.; Larissi, I.K.; Nastos, P.T.; Paliatsos, A.G. Spatial variability and trends of the rain intensity over Greece. Adv. Geosci. 2010, 26, 65–69. [Google Scholar] [CrossRef][Green Version]
- Kampolis, D. Winters in Greece–Climate Analysis. E3S Web Conf. 2024, 585, 02002. [Google Scholar] [CrossRef]
- Available online: http://www.hellenjgeosci.geol.uoa.gr/45/Nastos%20&%20Zerefos.pdf (accessed on 8 August 2025).
- Fonseca, R.; Francis, D.; Nelli, N.; Cherif, C. Regional atmospheric circulation patterns driving consecutive fog events in the United Arab Emirates. Atmos. Res. 2023, 282, 106506. [Google Scholar] [CrossRef]
- Dimitrios, K. Magnetic declination and climate change. IOP Conf. Ser. Earth Environ. Sci. 2022, 1123, 012012. [Google Scholar] [CrossRef]
- Eydapgr. ΕΥΔΑΠ-Water Supply Resources. 2024. Available online: https://www.eydap.gr/en/thecompany/water/watersources (accessed on 24 May 2025).
Disclaimer/Publisher’s Note: The statements, opinions and data contained in all publications are solely those of the individual author(s) and contributor(s) and not of MDPI and/or the editor(s). MDPI and/or the editor(s) disclaim responsibility for any injury to people or property resulting from any ideas, methods, instructions or products referred to in the content. |
© 2025 by the authors. Licensee MDPI, Basel, Switzerland. This article is an open access article distributed under the terms and conditions of the Creative Commons Attribution (CC BY) license (https://creativecommons.org/licenses/by/4.0/).