Proceeding Paper

A Spatiotemporal Analysis of Droughts in Greece (1960–2022): Severity, Duration and Frequency Based on the SPI and SPEI †

1
Laboratory of Atmospheric Physics, University of Patras, University Campus, GR-265 00 Patras, Greece
2
Hellenic National Meteorological Service, GR-167 77 Hellenikon, Greece
*
Author to whom correspondence should be addressed.
Presented at the 17th International Conference on Meteorology, Climatology, and Atmospheric Physics—COMECAP 2025, Nicosia, Cyprus, 29 September–1 October 2025.
Environ. Earth Sci. Proc. 2025, 35(1), 61; https://doi.org/10.3390/eesp2025035061
Published: 1 October 2025

Abstract

This study focuses on Greece, providing a comprehensive climatological analysis of drought conditions from 1960 to 2022. The Standardized Precipitation Index (SPI) and the Standardized Precipitation Evapotranspiration Index (SPEI) were employed on a 1-month timescale to assess meteorological drying conditions over the study period. The Drought Occurrence Probability (DOP), Total Drought Duration (TDD) and drought severity were analyzed spatially, while temporal trends were examined using rolling time windows and the Mann–Kendall test. The findings reveal regional differences in drought characteristics and indicate more intense drought conditions under the SPEI compared to the SPI, underscoring the increasing role of temperature in drought intensification.

1. Introduction

Drought is a complex natural hazard characterized by prolonged periods of below-average precipitation and increased evaporative demand which further intensifies drought conditions [1]. Among the various types of droughts, meteorological drought represents the earliest phase in drought development, manifested by a precipitation deficit. This deficit can cascade into other sectors, leading to other types of droughts, like agricultural (e.g., crop yield reduction due to soil moisture depletion), ecological (e.g., plant water stress leading to tree mortality) and hydrological drought (e.g., water shortage in storages such as reservoirs, lakes and groundwater) [2].
Greece has experienced increasingly frequent and intense drought events over recent decades. The multiyear drought from 1989 to 1993 caused significant losses in agricultural production and major water scarcity issues [3,4]. Other studies have identified significant drought severity trends in regions such as the Aegean islands and western Peloponnese [5].
Future climate projections suggest a substantial increase in the occurrence of drought events across the Mediterranean and in Greece, with simulations projecting reduced precipitation and increased temperatures, particularly during the warm half of the year [6]. These trends are expected to exacerbate evapotranspiration rates, leading to more frequent drought events and an overall increase in their frequency and duration [7,8].
This study aims to perform a climatological assessment of short-term droughts during the period of 1960–2022. It focuses on quantifying drought event frequency, duration and severity to identify spatiotemporal variability and long-term trends in order to better understand the drought dynamics in the region.

2. Materials and Methods

2.1. Data

This study, stemming from the Interreg Euro-Med Germ of Life project, used homogenized daily precipitation and mean, minimum and maximum temperature records from 67 meteorological stations from 1960 to 2022. The stations belong to the Hellenic National Meteorological Service (HNMS) and are illustrated in Figure 1.

2.2. Drought Indices and Classification

Drought conditions were assessed using the SPI [9] and SPEI [10], calculated on a 1-month timescale (SPI-1 and SPEI-1). The analysis was conducted based on monthly aggregates (precipitation for SPI and precipitation minus potential evapotranspiration for SPEI) derived from the daily data. The Gamma probability distribution was used for the SPI and the log-logistic distribution for the SPEI. The baseline period of 1961–1990 was used to fit the distribution and obtain the parameters which were used to calculate the indices. The Kolmogorov–Smirnov (K-S) test was employed to verify the goodness of fit and ensure the distribution’s suitability.
The estimation of potential evapotranspiration (PET) was performed using a modified version of the Hargreaves equation [11]:
ET0 = 0.0013 × 0.408Ra × (Tavg + 17.0) × (T D − 0.0123P)0.76
where Ra is the extraterrestrial radiation (MJ m−2 d−1), Tavg is the average daily temperature (°C), TD (°C) is the diurnal temperature range and P is the daily total precipitation (mm).
Drought episodes were classified into 3 categories, based on the respective value of the index (SPI or SPEI). Values in the range [−1, −1.5) were classified as ‘Moderate Droughts’, values in the range [−1.5, −2) as ‘Severe Droughts’ and values lower than −2.0 as the ‘Extreme Droughts’ [12].

2.3. Drought Metrics

Drought episodes were identified based on periods during which SPI or SPEI values remained below −1.0. These events were considered to extend as long as the index values remained ≤−1.0, and deemed to end once the index exceeded this threshold. To further characterize drought conditions, two key metrics were calculated [13]:
Total Drought Duration (TDD): This represents the proportion of time a location experienced drought conditions over the full study period. It is the percentage of months with an SPI or SPEI ≤ −1.0. This metric provides insight into the persistence and frequency of droughts at each station.
TDD   ( % ) = n i N i × 100 %
where n i is the sum of months encompassing drought episodes, and Ni is the total number of months.
Drought Severity (DS): The absolute sum of SPI or SPEI values during a specific drought event.
DS = | i = 1 D D S P I i ( S P E I i ) |
where DD is the drought duration (in months) of each drought event. By dividing DS by the number of months (duration) for which the event occurred, the average drought severity of each event was calculated, and then final Mean Severity of the events throughout the study period was obtained. This metric provides insight into the average intensity of the events that occurred in each station.

2.4. Trend Analysis

To investigate the temporal evolution of drought occurrence, a rolling-window analysis was applied. We studied the occurrence probability (%) of ‘Extreme Droughts’ (SPEI/SPI < −2.0), defined as the total count of events divided by the total number of months in the period. We used a 10-year window, shifted forward in 1-year steps to track how extreme drought events have evolved. For each 10-year subperiod (1960–1969, 1961–1970, 1962–1971, etc.) the Drought Occurrence Percentage (DOP) was recalculated, and the resulting time-series were used to assess temporal trends. To quantify these trends, the Mann–Kendall test was applied to each station’s rolling DOP time-series and the Theil-Sen’s slope estimator was computed.

3. Results

3.1. Drought Occurrence Probability

This study first examines the Drought Occurrence Percentage (DOP) of each drought category during the period of 1960–2022, across the 67 meteorological stations. The results are shown in Figure 2:
SPEI-1 identifies a higher percentage of drought months, with all stations exceeding a total DOP of 15%, while the results from the SPI indicate that more than half of the stations fall below this value. This difference is largely explained by the contrast in the identification of extreme droughts, since the inclusion of temperature and evaporative demand in the SPEI allows it to capture drought events exacerbated by high temperatures. In contrast, the SPI relies solely on precipitation, and thus underrepresents drought intensity in hot, dry periods. Spatial interpretation is further elaborated in the following section. To assess the drought characteristics, and given the broader sensitivity of the SPEI to drought conditions, the remainder of this analysis focuses exclusively on results derived from the SPEI-1 index.

3.2. Duration and Intensity

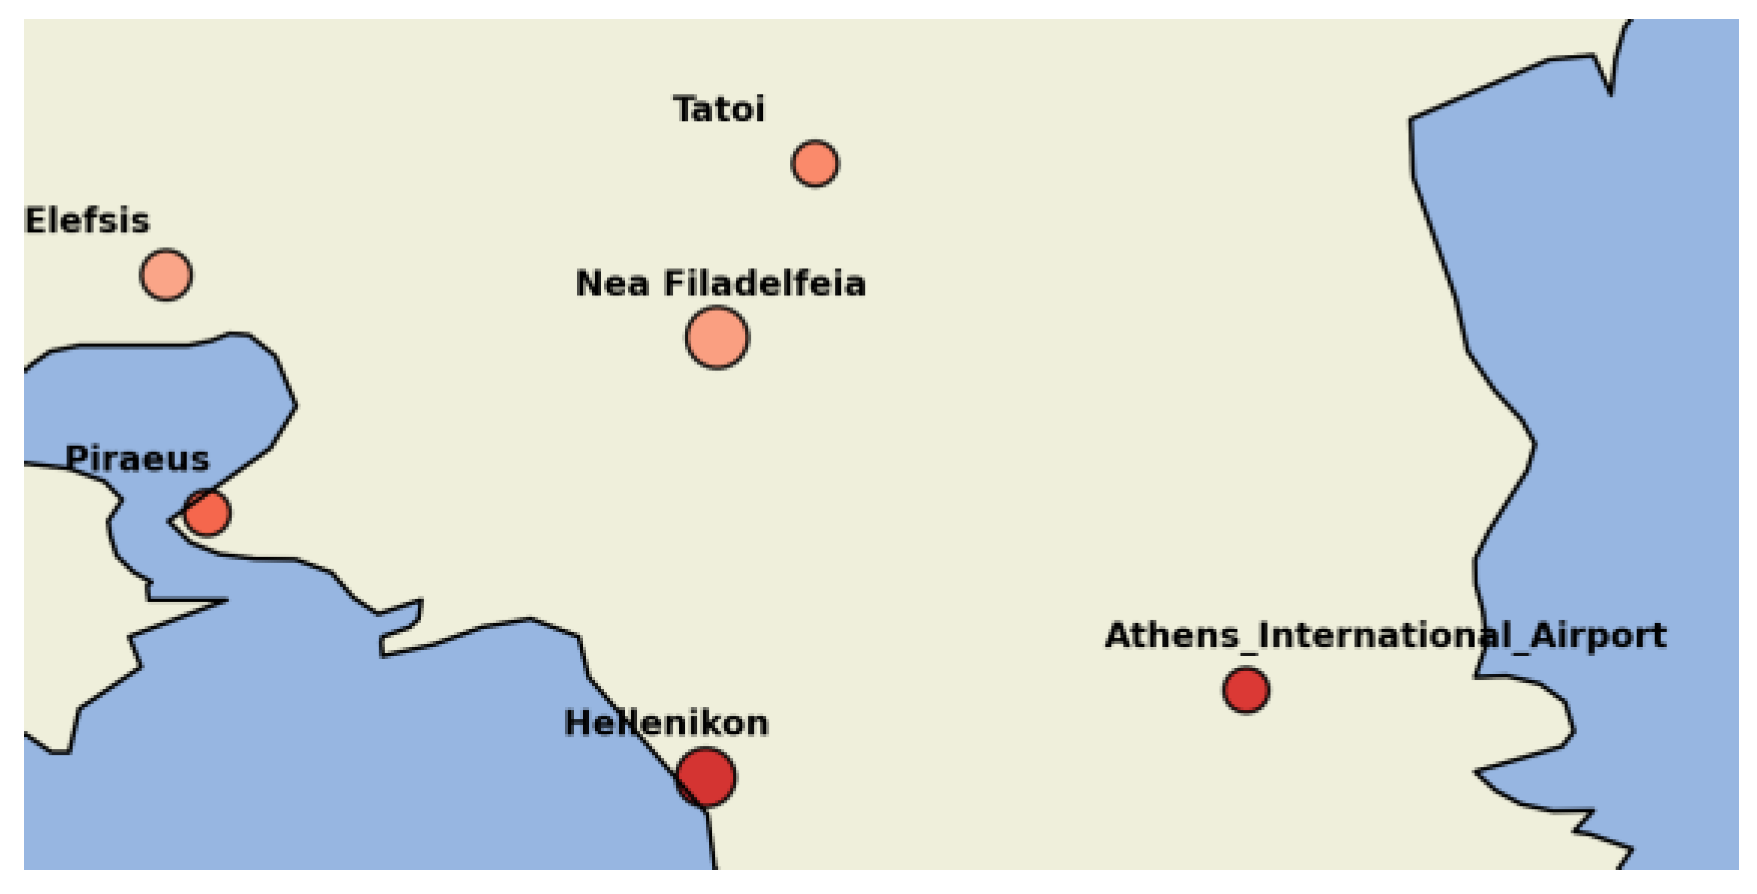
The overall behavior of drought events in terms of duration and intensity is presented in Figure 3. The Total Drought Duration (TDD) is reflected by the size of the station marker, and the Mean Drought Severity is reflected by the color gradient. A supplementary zoomed view of Athens stations is provided in the Appendix A (Figure A1).
This simultaneous visualization helps to better capture the complexity of drought behavior across regions. It represents how frequently droughts occurred at a given station (TDD) and how intense those events tended to be (Mean Severity). For example, some stations may experience fewer but more severe drought episodes (e.g., Athens International Airport), while others may face prolonged but milder drought conditions (e.g., Kos).
The large and dark red dots indicate the stations with the highest risk throughout the study period, as they experienced harsh and frequent droughts. The most pronounced examples include Methoni and Argos in Southern Peloponnese and Lamia in central Greece. These stations not only experienced a significant duration (>25% TDD) under drought conditions, but also drought conditions of high average intensity (>1.70). Some stations spent fewer months under drought conditions (no more than ~20–22% TDD), but when they did, the events were particularly intense (>1.75). These are indicated by small but dark red dots (e.g., Athens International Airport). On the other hand, we can observe stations that remained under drought conditions, yet of lower average intensity, for a substantial amount of time (Kos, Doxato). The lower-risk stations are highlighted with small, light-colored dots. These stations experienced comparatively rarer droughts (<20% TDD) of milder intensity (<1.50). Skyros, Skiathos and Kozani are the most pronounced stations that faced the lower drought risk through the study period.

3.3. Temporal Trends in Extreme Drought Occurrence

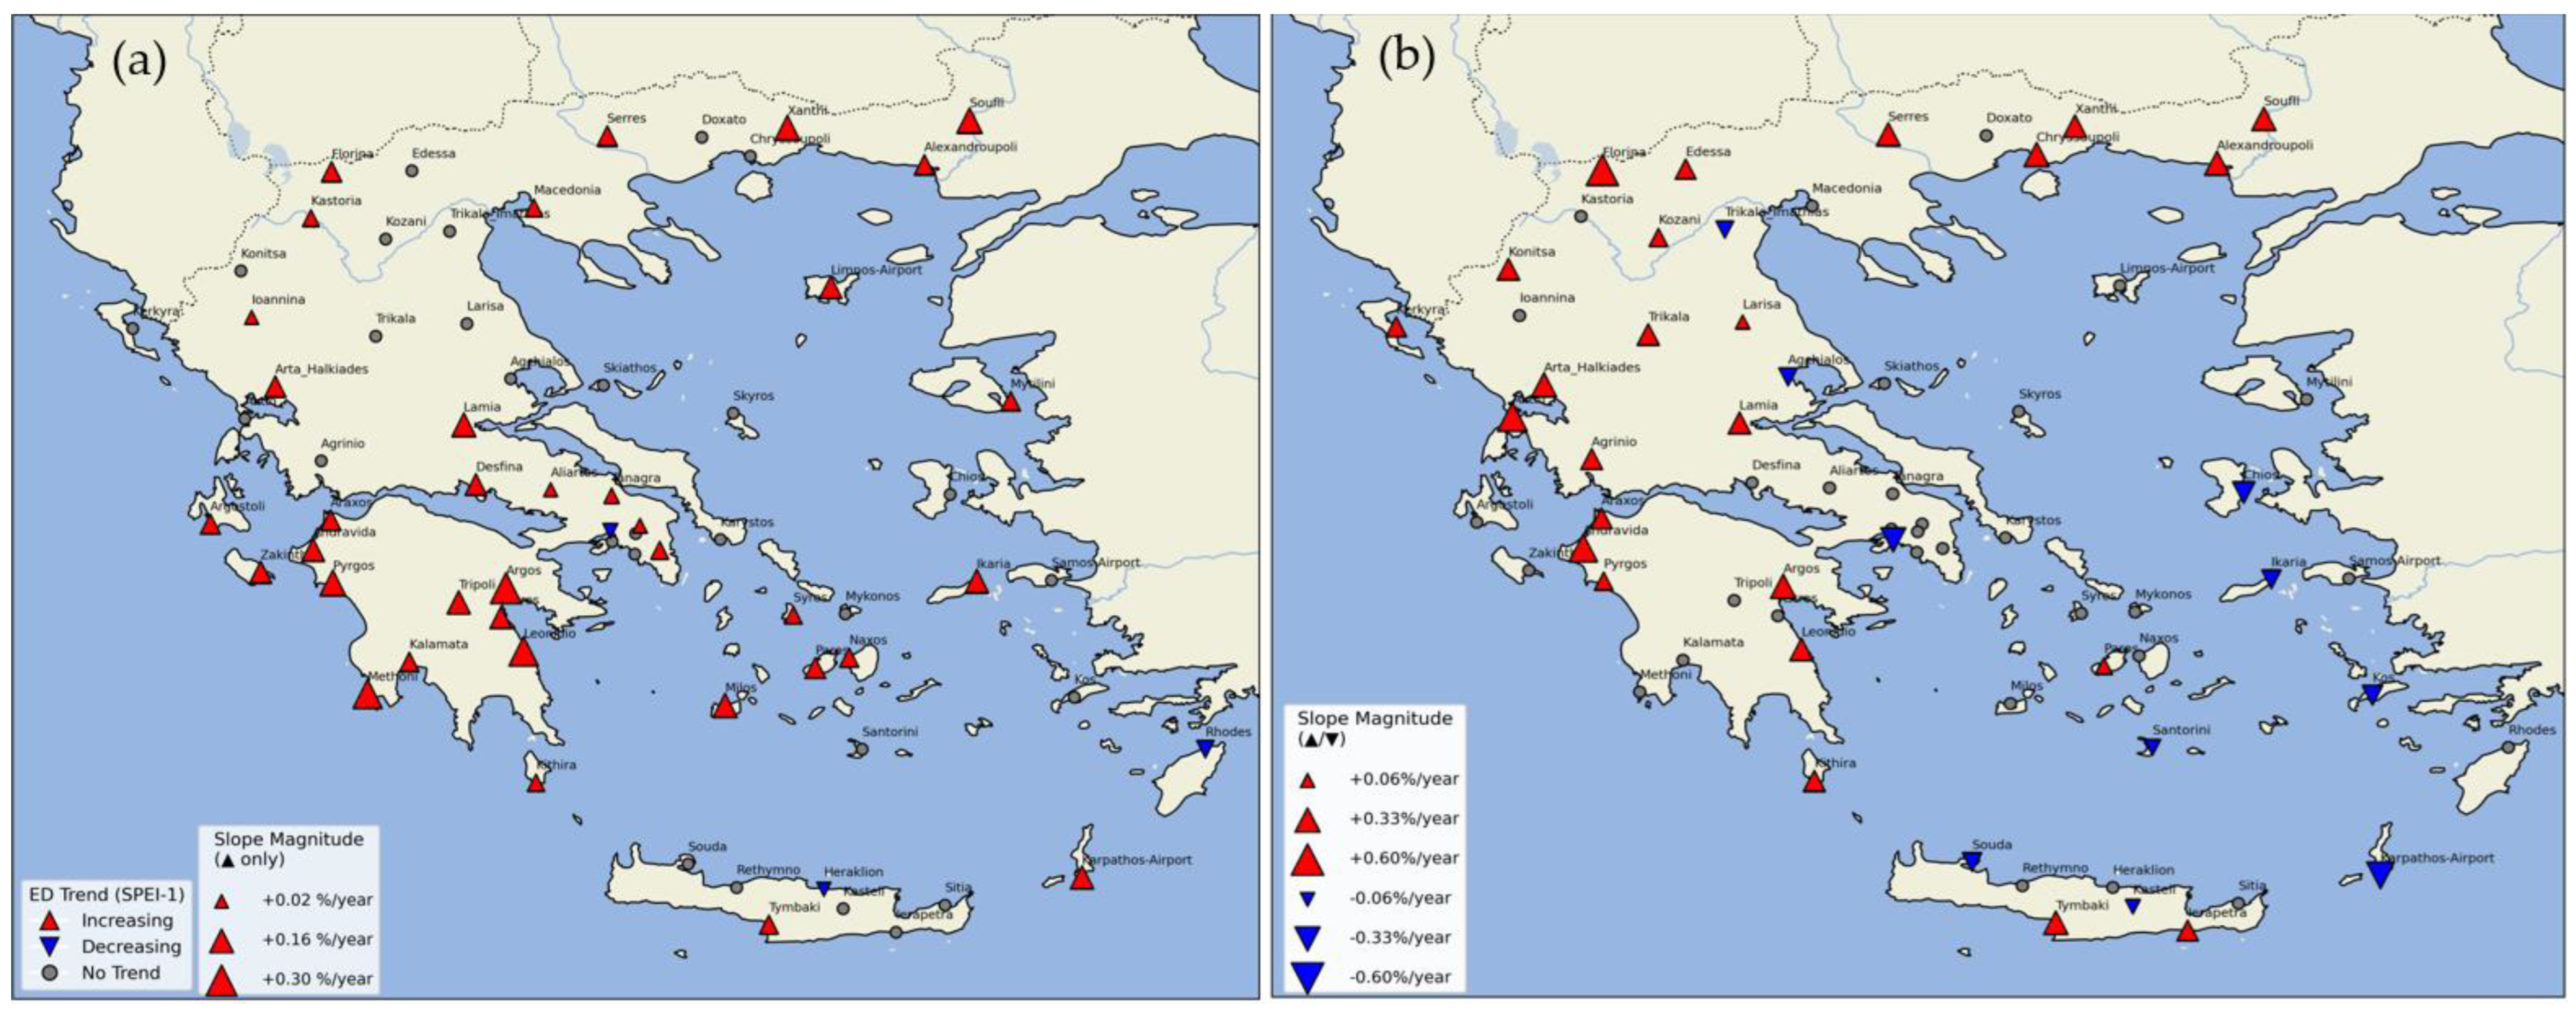
The temporal evolution of extreme droughts, as identified by SPEI-1, was assessed. This analysis aimed to determine whether such events have become rather frequent over time by searching for statistically significant trends on Extreme-Drought Occurrence Probabilities over successive 10-year periods, as explained in Section 2.4. Figure 4 illustrates the trends throughout the periods of 1960–2022 and 1990–2022, too. For the full study period (1960–2022), the results indicate a widespread upward trend: 36 out of 67 stations exhibit statistically significant increasing trends in Extreme-Drought Occurrence Probabilities, while only three stations display a decreasing trend and 28 stations show no trend. The upward slopes range between +0.02%/year (+0.2%/decade) and +0.30%/year (+3.0%/decade), suggesting a consistent rise in the occurrence of extreme drought events across most of the country. In contrast, when focusing on the most recent period (1990–2022), a shift in the spatial pattern emerges. Although increasing trends are still prevalent at 25 stations, there is a rise in the number of stations exhibiting decreasing trends, 10 in total, concentrated in the southeastern parts of Greece, including several islands. Thirty-one stations indicate no clear trend, with several of them clustered around Athens and the islands of Cyclades. Notably, the magnitude of the trends is more pronounced in the recent period, with slopes reaching up to +0.59%/year (5.9%/decade) for increasing trends and −0.41%/year (−4.1%/decade) for decreasing trends. These results are summarized in Table 1.

4. Conclusions

SPEI-1, which incorporates temperature effects, identifies a greater frequency and intensity of drought events compared to SPI-1, highlighting the influence of evapotranspiration in drought formation. Based on this index, the spatial analysis shows variation in the Total Drought Duration across regions, but a higher Mean Drought Severity is observed in the southeastern part of the country compared to the northwestern regions. Stations in the southern Peloponnese face the highest risk in terms of both duration and severity. Temporal analysis indicates that most stations exhibit increasing trends in the occurrence probability of extreme droughts across most of the country. When the analysis is restricted to the period 1990–2022, a sharp spatial shift in the trends becomes evident, as several southeastern islands display negative trends. Conversely, the Peloponnese and Central and Western Greece continue to exhibit positive trends that are stronger in magnitude compared to the trends observed over the full period.

Author Contributions

Conceptualization, M.S. and A.A.; methodology, M.S. and A.A.; software, M.S. and V.A.; data curation, A.M.; writing—original draft preparation, M.S.; writing—review and editing, M.S. and A.A.; visualization, M.S.; supervision, M.S., A.M. and A.A. All authors have read and agreed to the published version of the manuscript.

Funding

This research is partly funded by the Interreg Euro-Med “Germ of Life” project (Contract # Euro-MED0200878).

Institutional Review Board Statement

Not applicable.

Informed Consent Statement

Not applicable.

Data Availability Statement

The data used in this study remain property and can be obtained by the HNMS.

Conflicts of Interest

The authors declare no conflicts of interest.

Appendix A

Figure A1. Zoomed view of Total Drought Duration and Mean Drought Severity for Athens stations.
Eesp 35 00061 g0a1

References

  1. Vicente-Serrano, S.M.; McVicar, T.R.; Miralles, D.G.; Yang, Y.; Tomas-Burguera, M. Unraveling the influence of atmospheric evaporative demand on drought and its response to climate change. WIREs Clim. Change 2020, 11, e632. [Google Scholar] [CrossRef]
  2. Ndayiragije, J.M.; Li, F. Effectiveness of Drought Indices in the Assessment of Different Types of Droughts, Managing and Mitigating Their Effects. Climate 2022, 10, 125. [Google Scholar] [CrossRef]
  3. Nalbantis, I. Evaluation of a Hydrological Drought Index. Eur. Water 2008, 23, 67–77. [Google Scholar]
  4. Tigkas, D. Drought Characterisation and Monitoring in Regions of Greece. Eur. Water 2008, 23, 29–39. [Google Scholar]
  5. Kourtis, I.M.; Vangelis, H.; Tigkas, D.; Mamara, A.; Nalbantis, I.; Tsakiris, G.; Tsihrintzis, V.A. Drought Assessment in Greece using SPI and ERA5 Climate Reanalysis Data. Sustainability 2023, 15, 15999. [Google Scholar] [CrossRef]
  6. Lionello, P.; Scarascia, L. The relation between climate change in the Mediterranean region and global warming. Reg. Environ. Change 2018, 18, 1481–1493. [Google Scholar] [CrossRef]
  7. Anagnostopoulou, C. Future Drought Projection for the Greek Region. Bull. Geol. Soc. Greece 2016, 50, 1038–1045. [Google Scholar] [CrossRef]
  8. Politi, N.; Vlachogiannis, D.; Sfetsos, A.; Nastos, P.T.; Dalezios, N.R. High Resolution Future Projections of Drought Characteristics in Greece Based on SPI and SPEI Indices. Atmosphere 2022, 13, 1468. [Google Scholar] [CrossRef]
  9. McKee, T.B.; Doesken, N.J.; Kleist, J. The relationship of drought frequency and duration to time scales. In Proceedings of the Eighth Conference on Applied Climatology, Anaheim, CA, USA, 17–22 January 1993; American Meteorological Society: Boston, MA, USA, 1993; pp. 179–184. [Google Scholar]
  10. Vicente-Serrano, S.M.; Beguería, S.; López-Moreno, J.I. A multi-scalar drought index sensitive to global warning: The standardized precipitation evapotranspiration index-SPEI. J. Clim. 2010, 23, 1696–1718. [Google Scholar] [CrossRef]
  11. Droogers, P.; Allen, R.G. Estimating reference evapotranspiration under inaccurate data conditions. Irrig. Drain. Syst. 2002, 16, 33–35. [Google Scholar] [CrossRef]
  12. Wang, Q.; Zeng, J.; Qi, J.; Zhang, X.; Zeng, Y.; Shui, W.; Xu, Z.; Zhang, R.; Wu, X.; Cong, J. A multi-scale daily SPEI dataset for drought characterization at observation stations over mainland China from 1961 to 2018. Earth Syst. Sci. Data 2021, 13, 331–341. [Google Scholar] [CrossRef]
  13. Mokhtar, A.; Jalali, M.; He, H.; Al-Ansari, N.; Elbeltagi, A.; Alsafadi, K.; Abdo, H.G.; Sammen, S.S.; Gyasi-Agyei, Y.; Rodrigo-Comino, J. Estimation of SPEI Meteorological Drought Using Machine Learning Algorithms. IEEE Access 2021, 9, 65505–65523. [Google Scholar] [CrossRef]
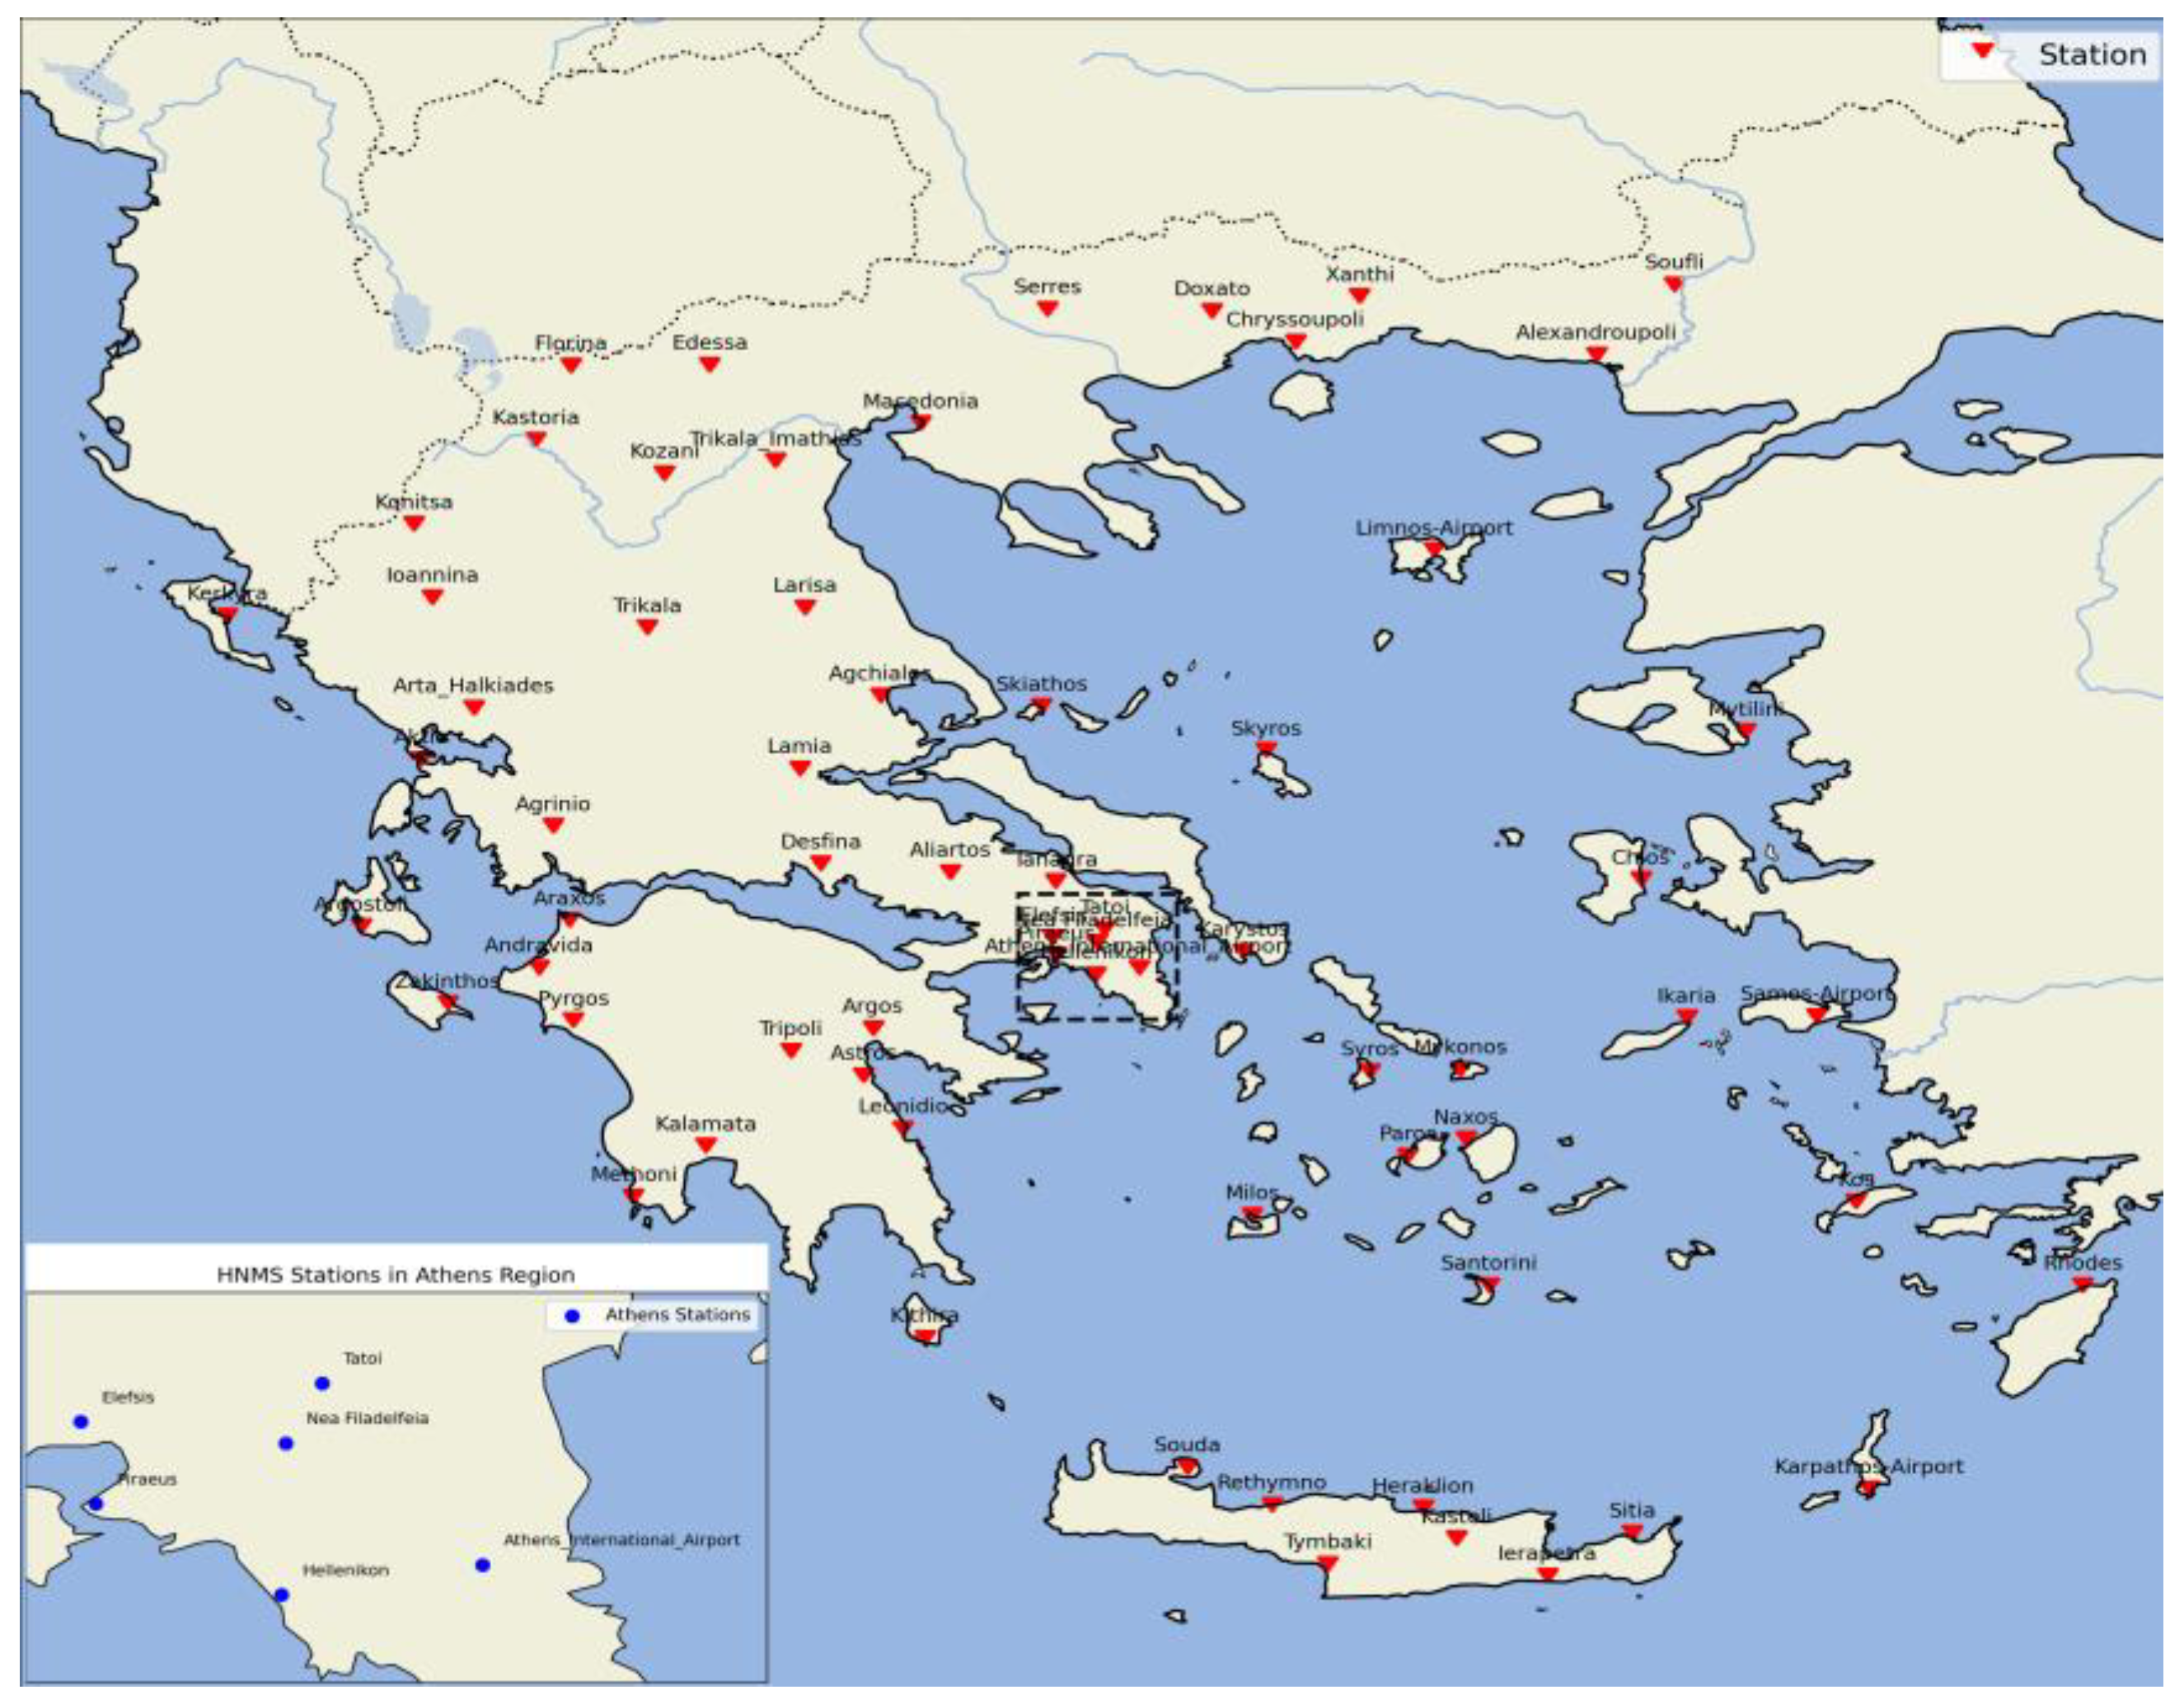
Figure 1. The spatial distribution of the 67 HNMS meteorological stations in Greece.
Eesp 35 00061 g001
Figure 2. Drought Occurrence Percentage of each drought category based on (a) SPEI-1 values and (b) SPI-1 values.
Eesp 35 00061 g002
Figure 3. Total Drought Duration and Mean Drought Severity based on SPEI-1.
Eesp 35 00061 g003
Figure 4. Trends in the occurrence probability of extreme-drought events over 10-year subperiods, shifted forward in 1-year steps, for (a) 1960–2022 (the first DOP percent is calculated through 1960–1969, the next through 1961–1970 and the last one for 2013–2022), and (b) for 1990–2022 (the first DOP percent is calculated through 1990–1999, the next through 1991–2000 and the last one for 2013–2022).
Eesp 35 00061 g004
Table 1. The number of stations with the corresponding trend (increasing, decreasing or no trend) and the respective slope range of the trends among the stations.
PeriodIncreasing TrendNo TrendDecreasing TrendSlope Range (%/Decade)
1960–2022362830.3–0.6 ↓, 0.2–3.0 ↑ 1
1990–20222531100.7–4.1 ↓ 2, 0.6–5.9 ↑
1 Increasing trend. 2 Decreasing trend.
Disclaimer/Publisher’s Note: The statements, opinions and data contained in all publications are solely those of the individual author(s) and contributor(s) and not of MDPI and/or the editor(s). MDPI and/or the editor(s) disclaim responsibility for any injury to people or property resulting from any ideas, methods, instructions or products referred to in the content.