Variation in Discomfort Indices in Athens, Greece, for the Period from 1901 to 2024 †
Abstract
1. Introduction
2. Data and Methodology
2.1. Data Sources
2.2. Thermal Discomfort Indices
3. Analysis and Results
4. Conclusions
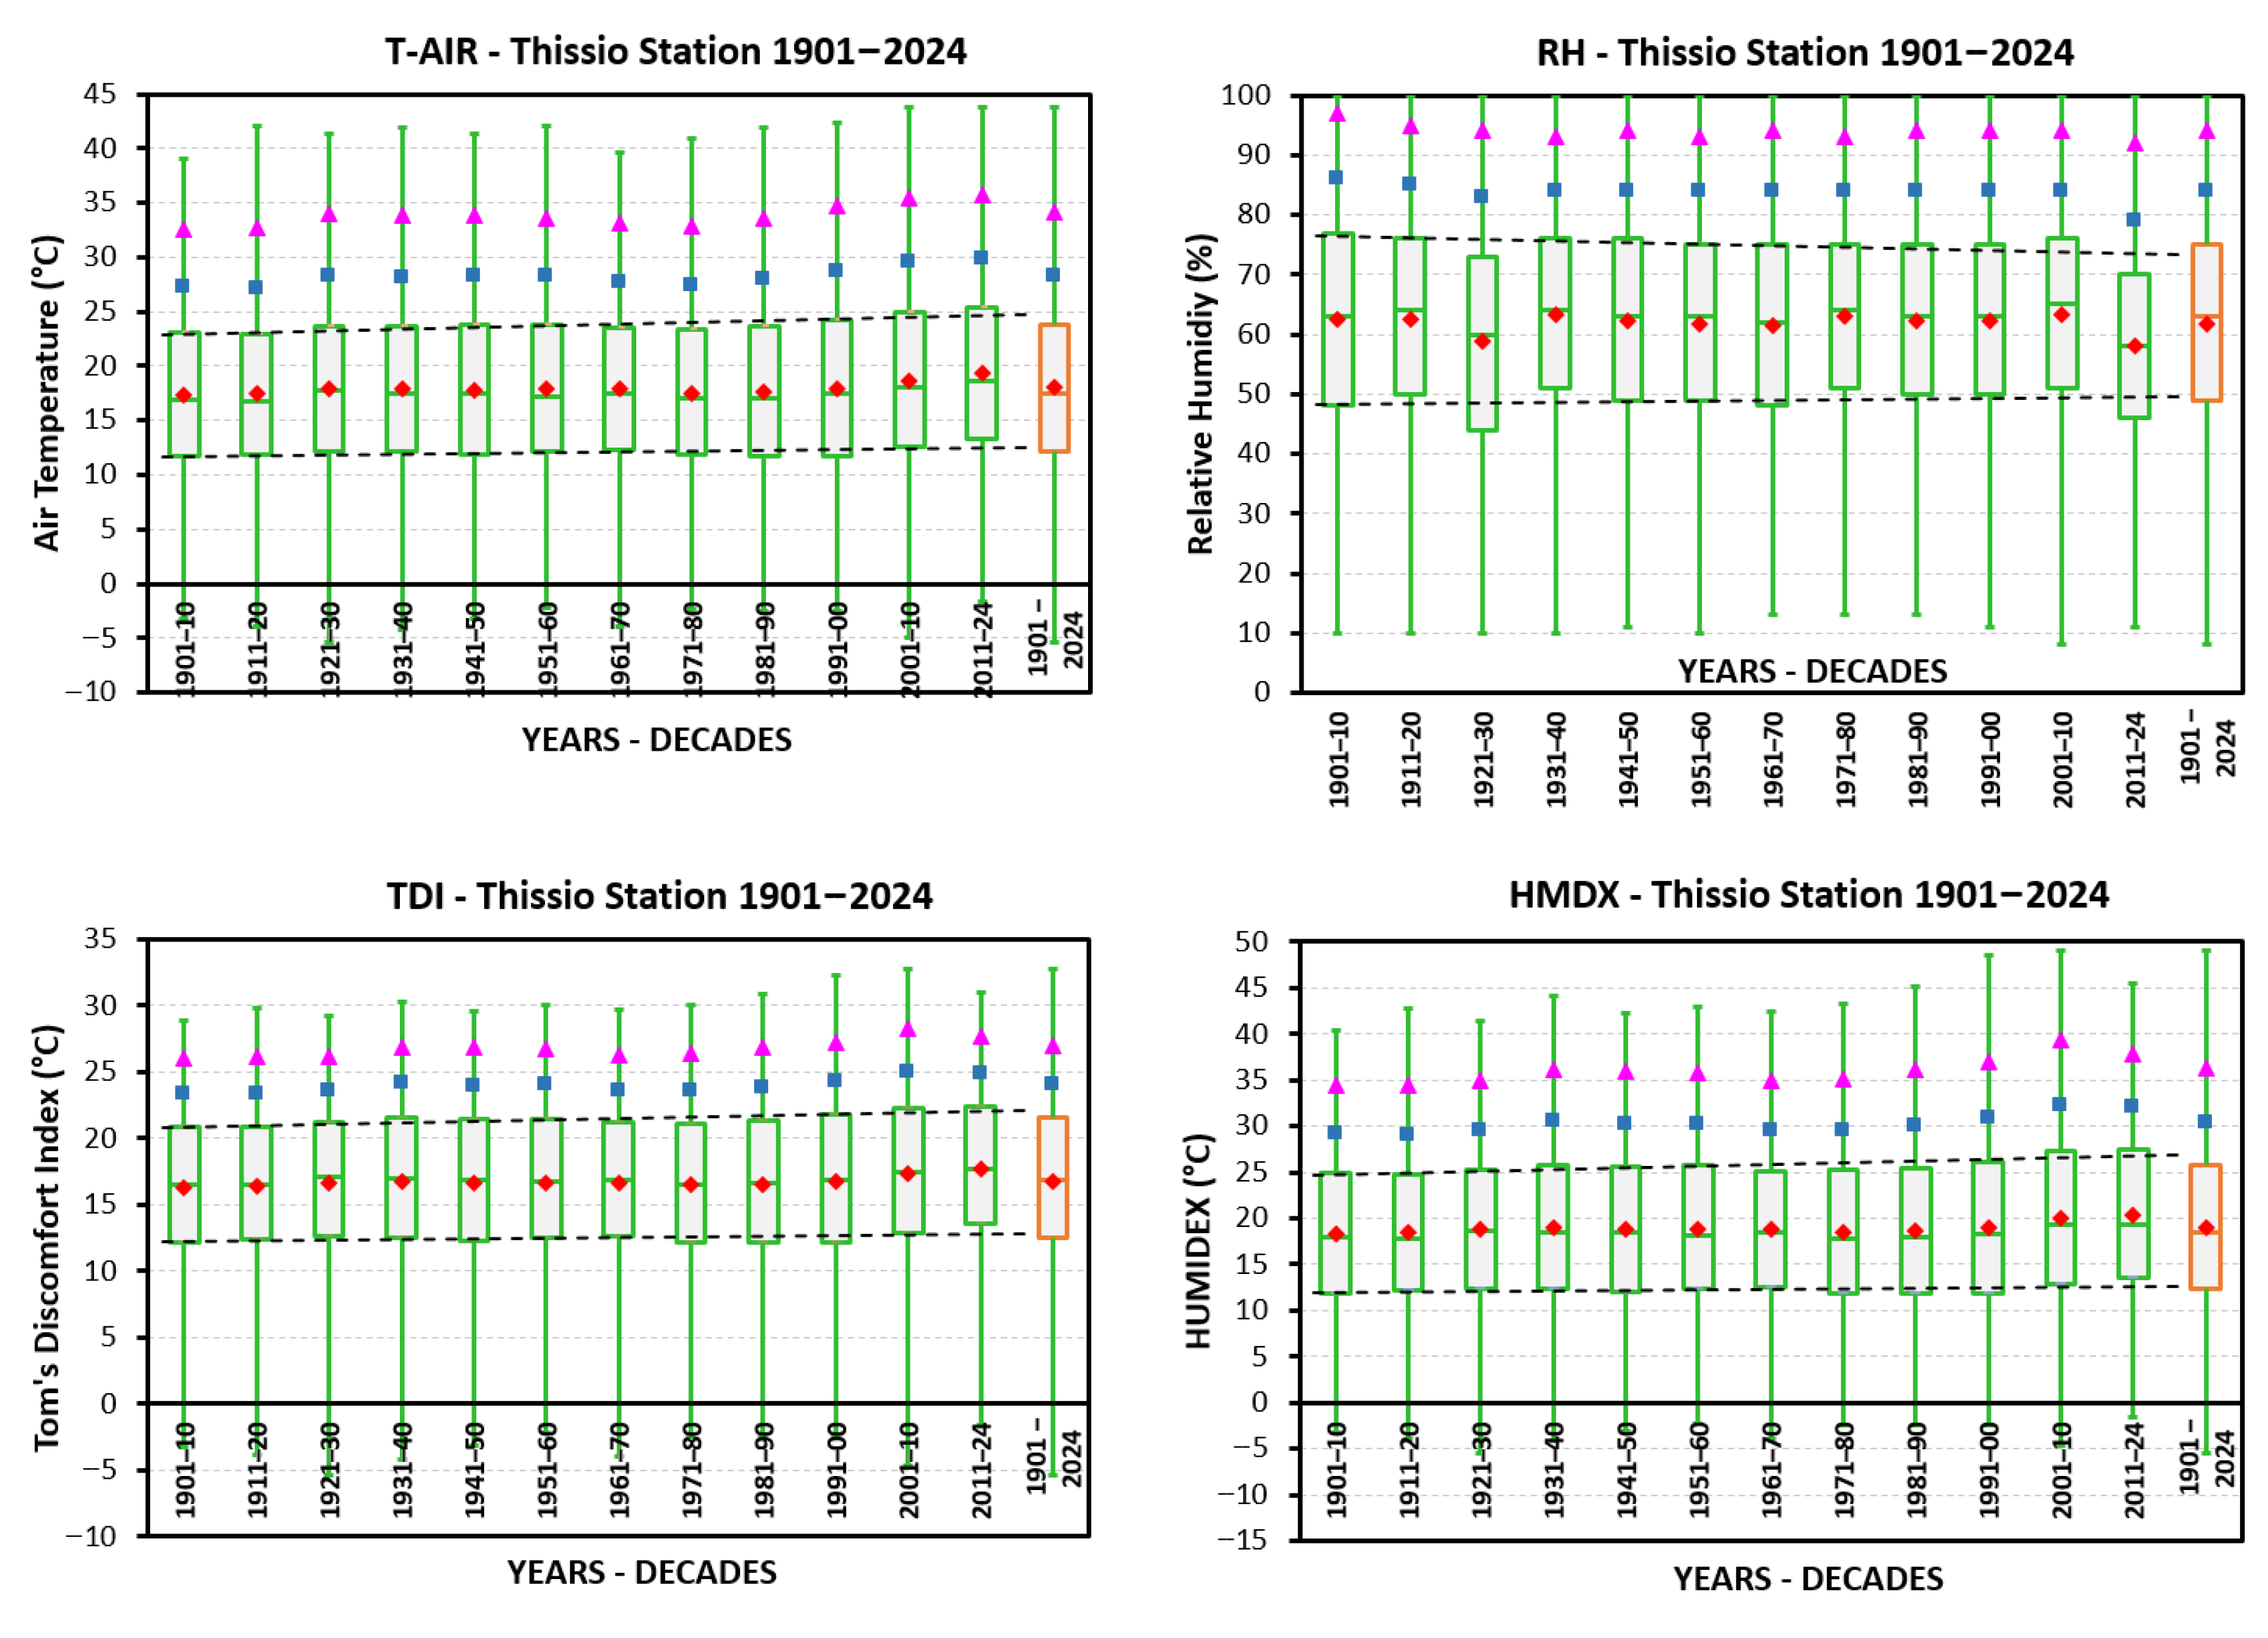
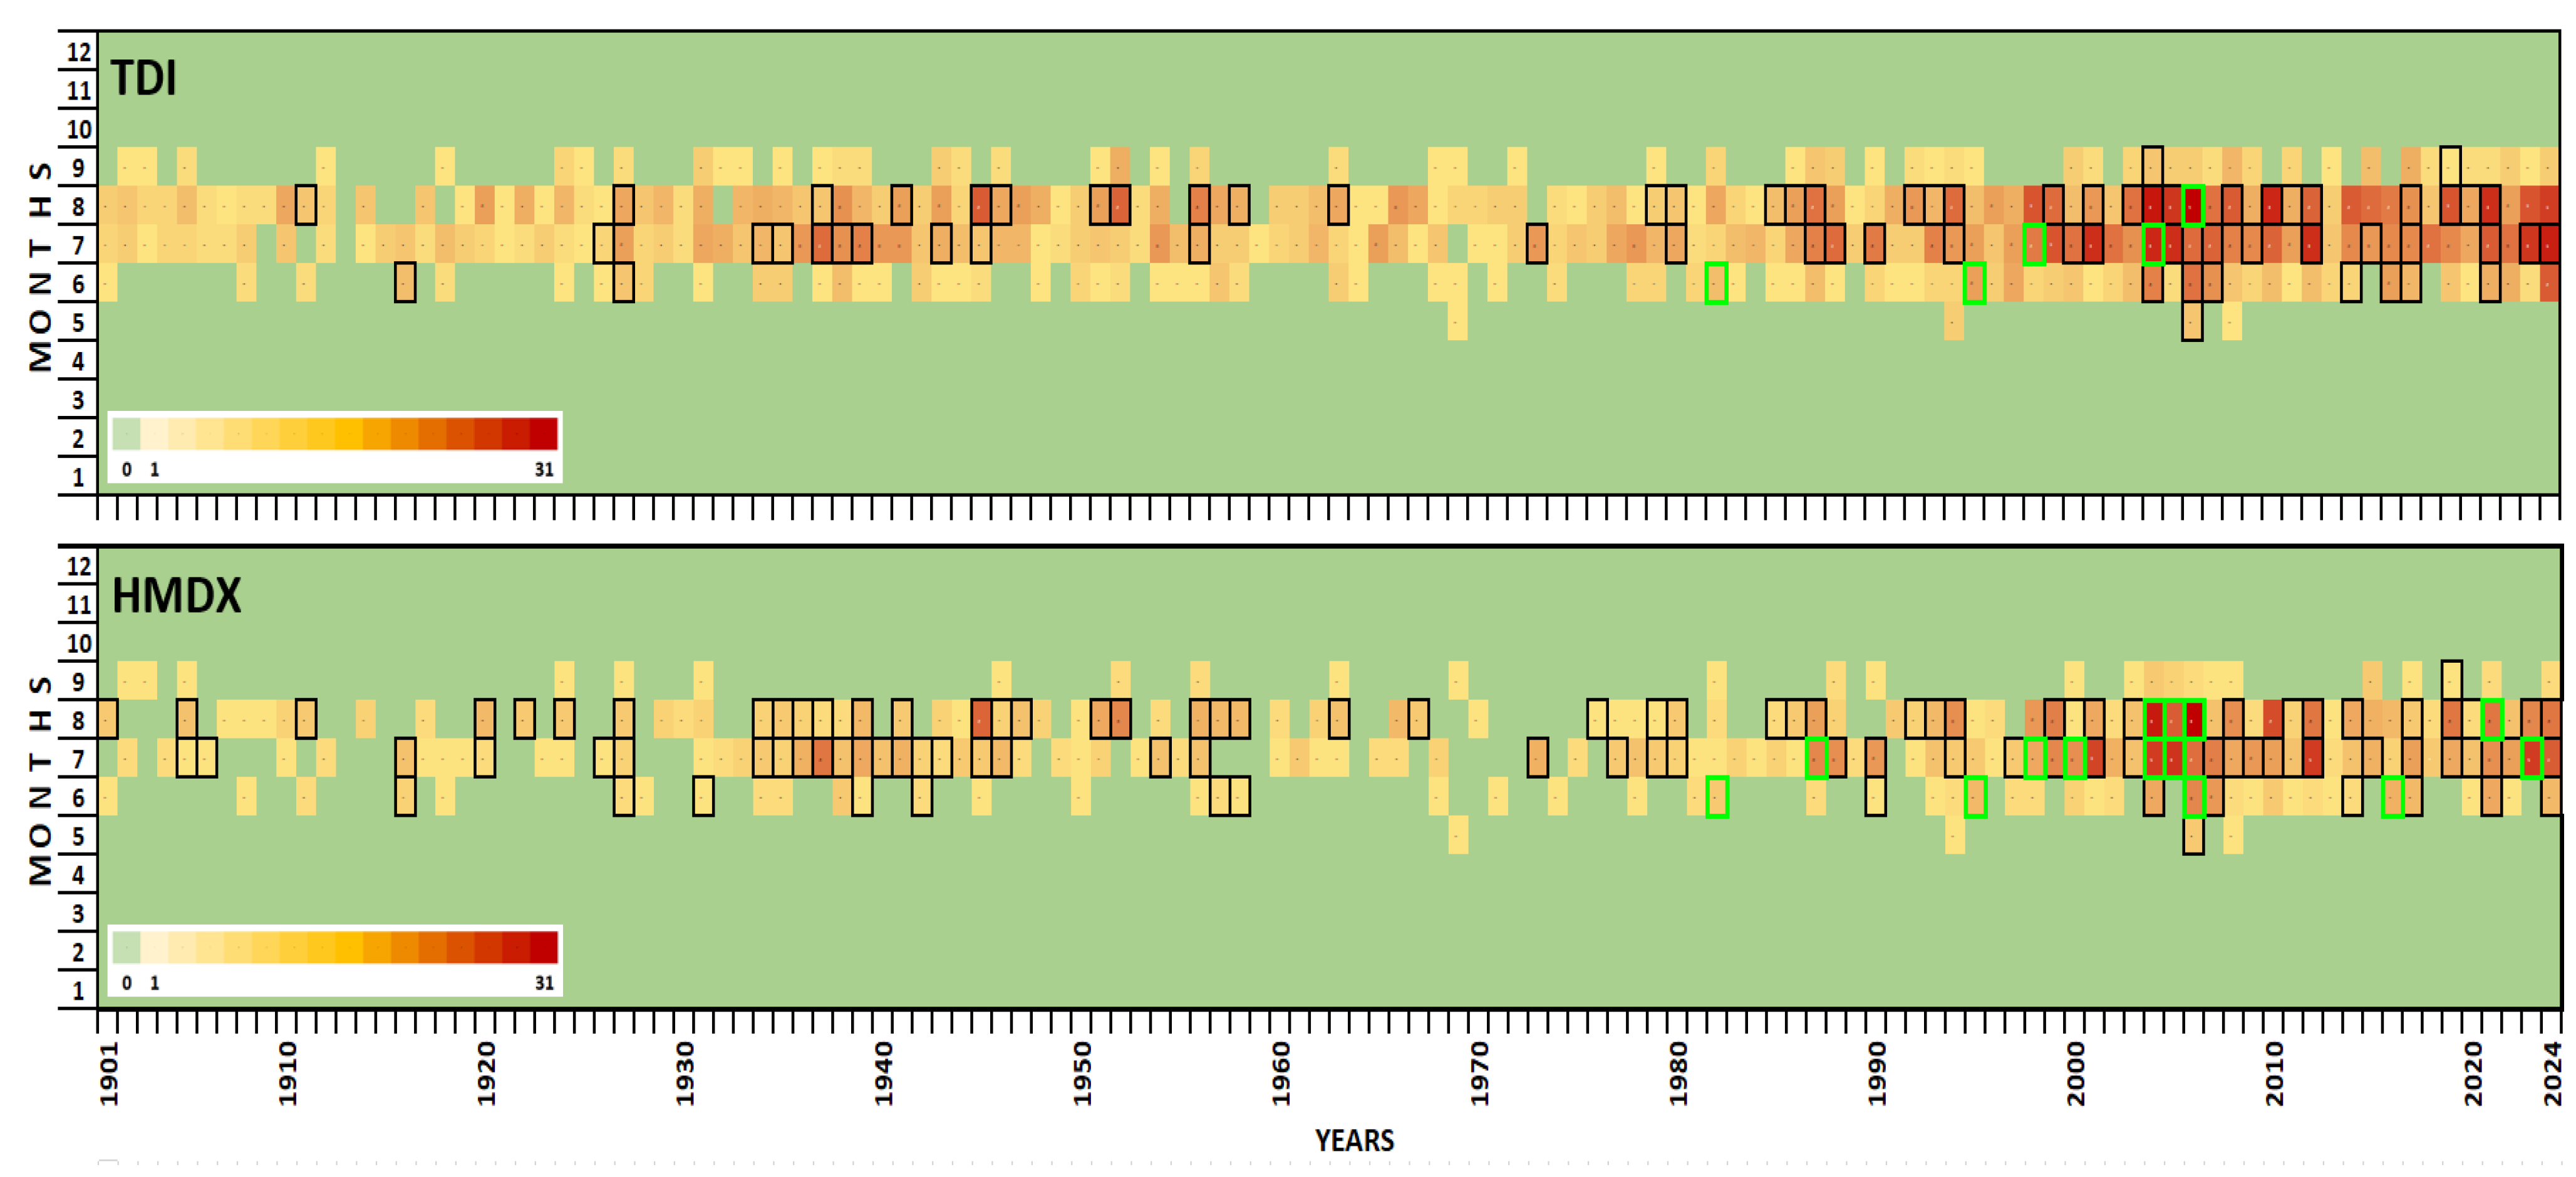
- Both indices, TDI and HMDX, indicate a long-term increasing trend in thermal discomfort and its variability in Athens, with a prominent rise from the 1980s onwards, especially during the two most recent decades.
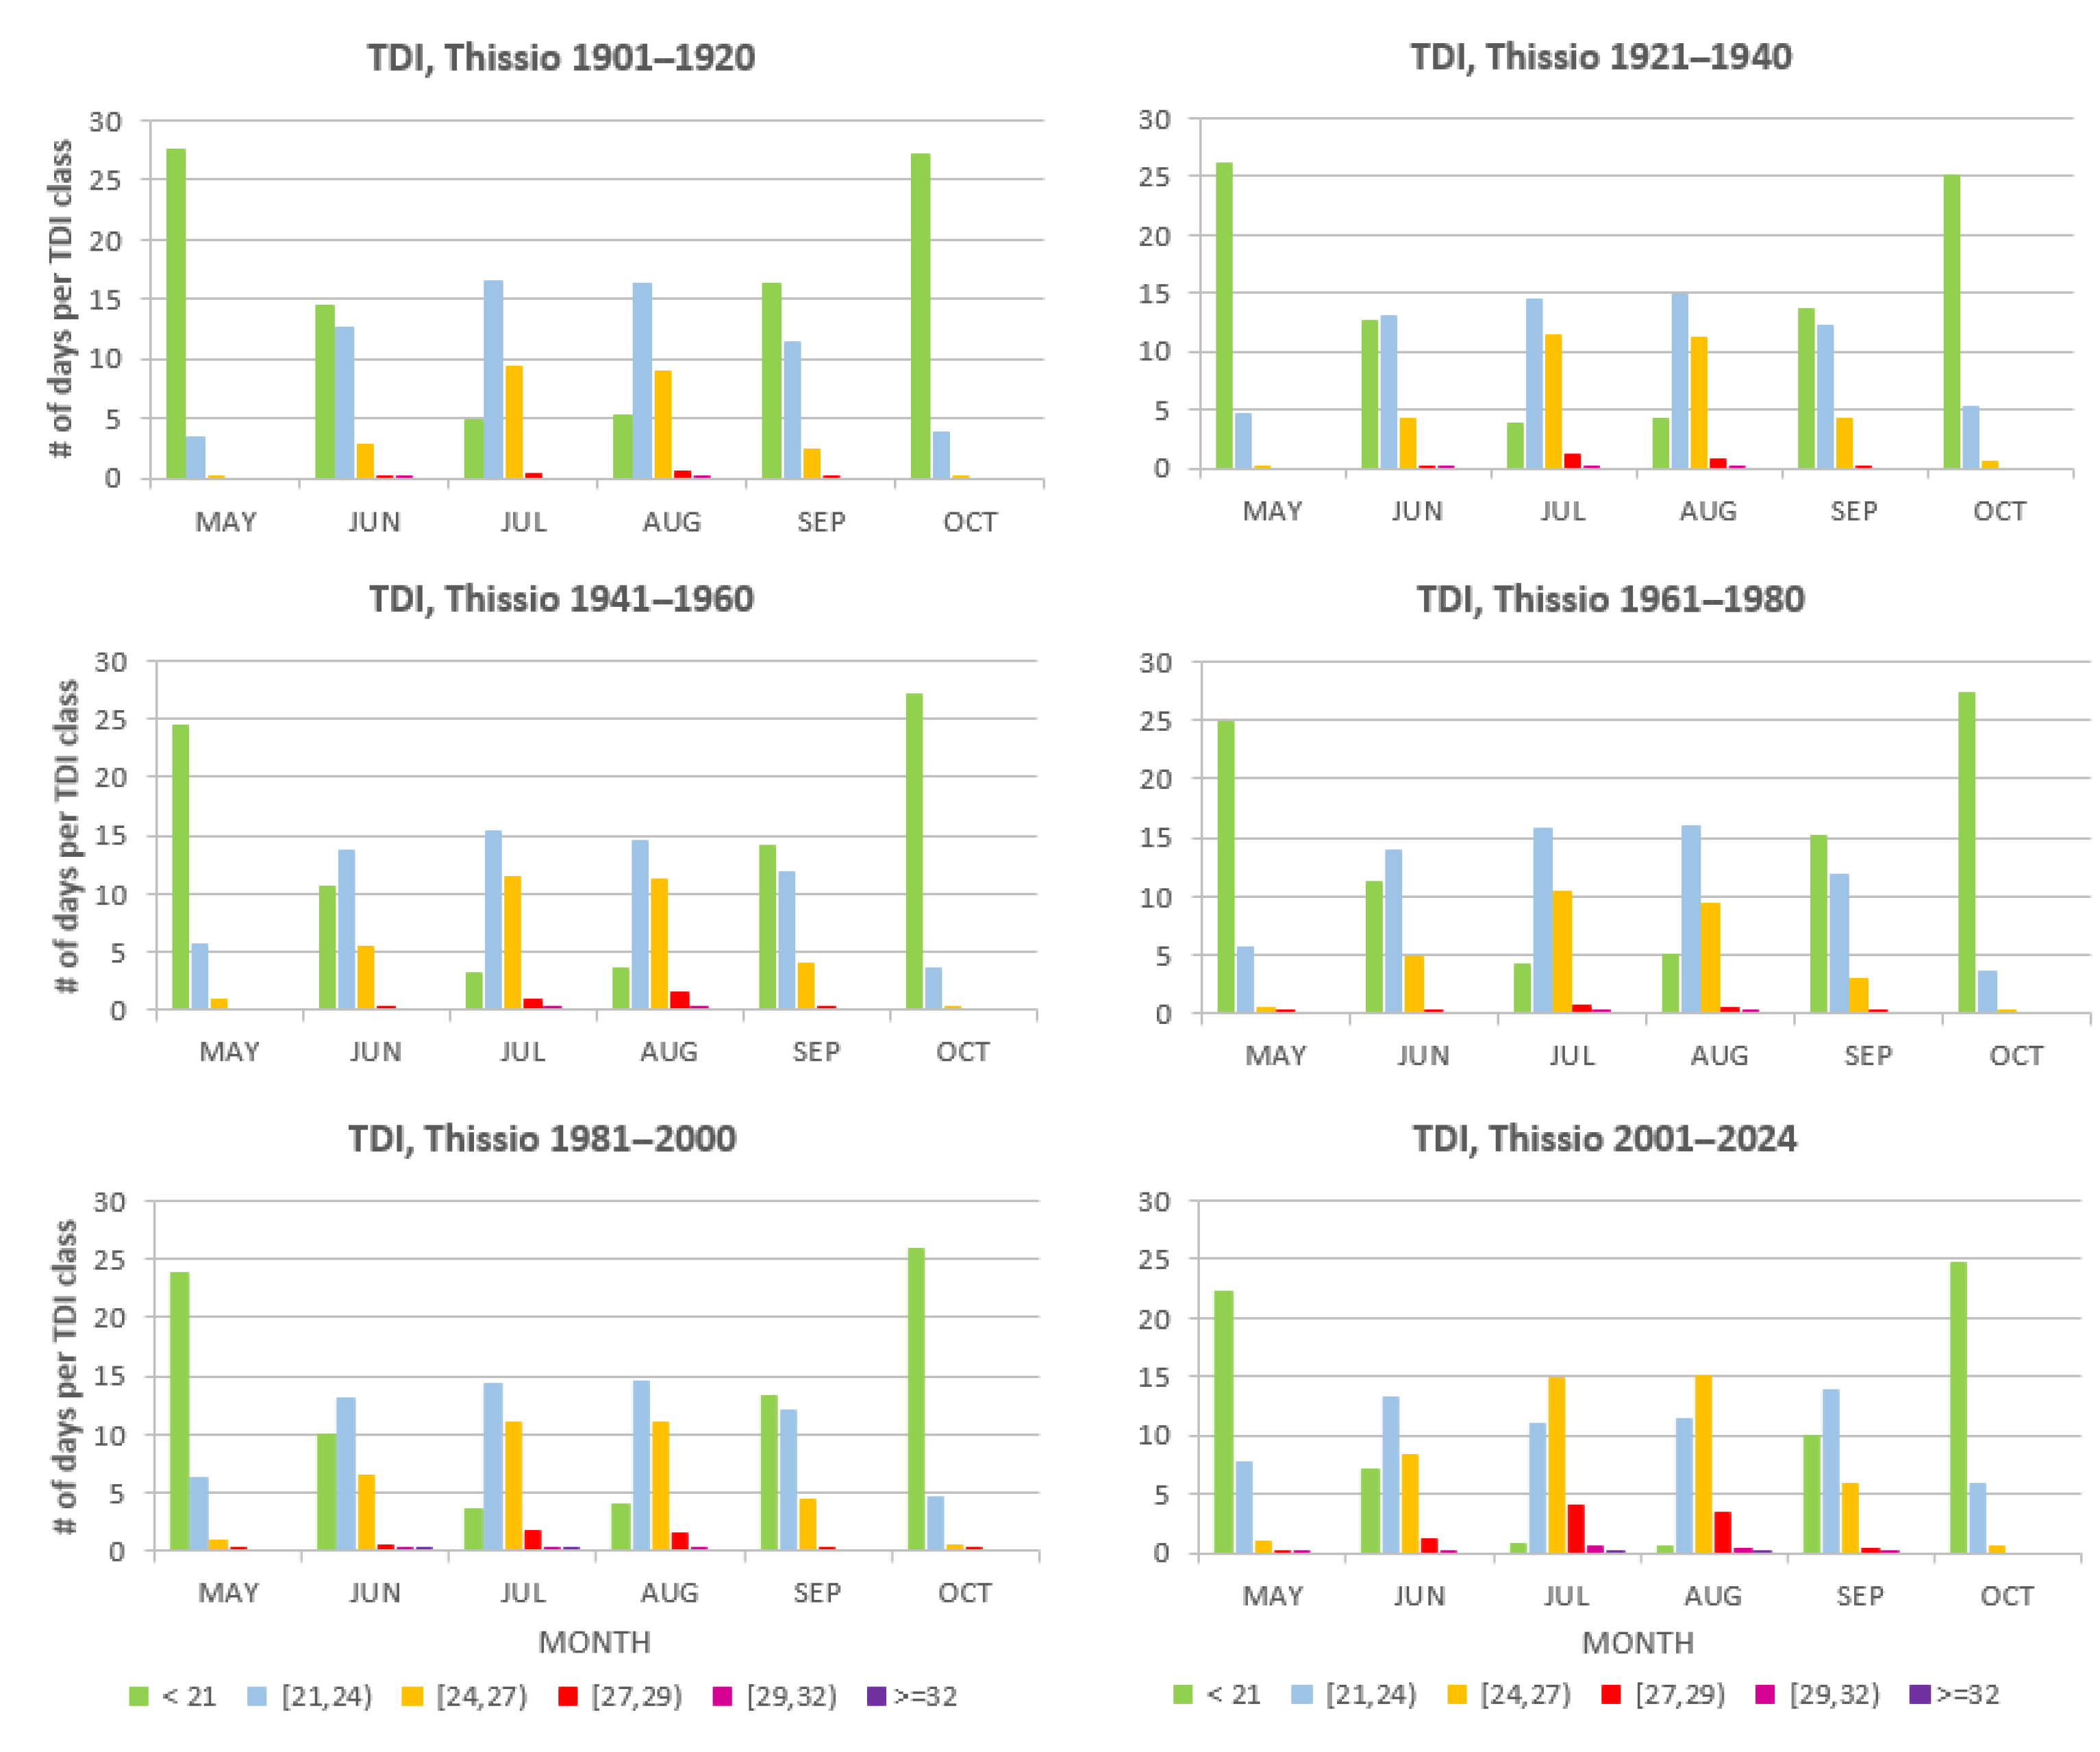
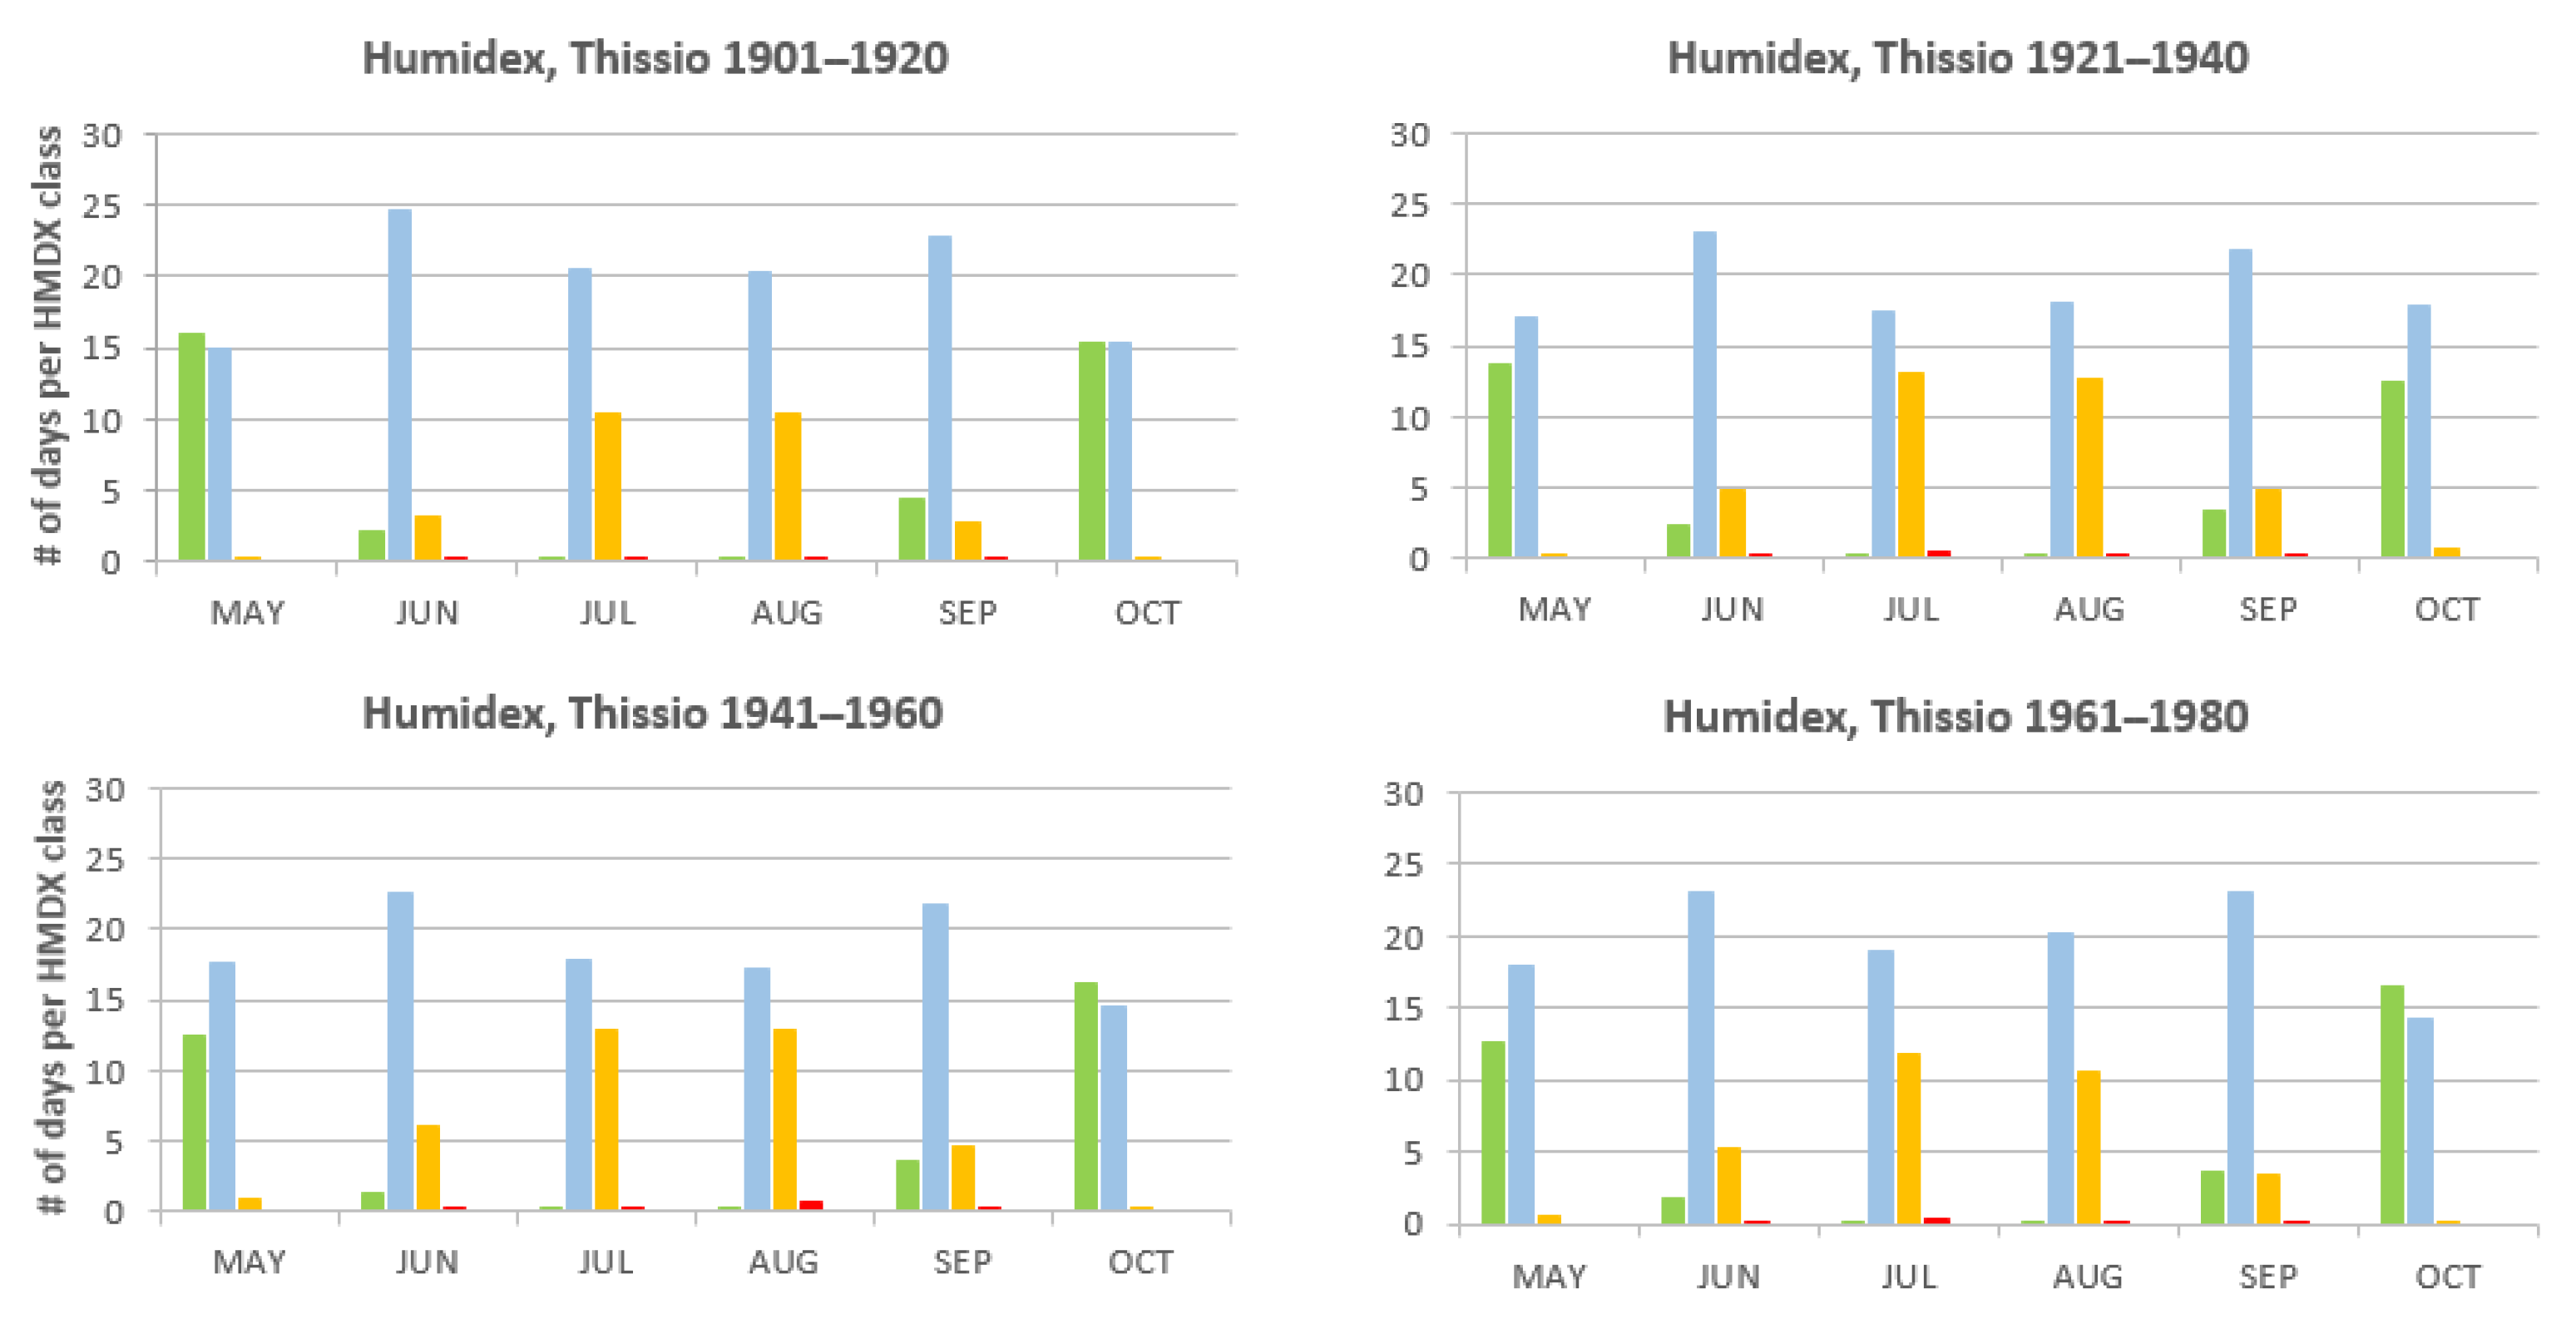
- From 2001 to 2024, the number of uncomfortable days during the peak of summer increased by more than 200% compared to the first half of the 20th century and by more than 150% compared to the 40-year period from 1941 to 1980. This number also rose in comparison to the 20-year period from 1981 to 2000.
- During this time, more than 20 days per month fall into the category of discomfort, while there were also months where every day was risky, showing a transition to heat-alert conditions.
- The median values and interquartile ranges of both indices have increased over time in Athens, indicating both rising central tendencies and greater variability in thermal discomfort.
- High-stress days often cluster during consecutive hot months, identifying heatwave impacts.
- Moreover, thermal discomfort has tended to extend to May and September during the two most recent decades.
Author Contributions
Funding
Institutional Review Board Statement
Informed Consent Statement
Data Availability Statement
Conflicts of Interest
References
- de Freitas, C.R.; Grigorieva, E.A. A comparison and appraisal of a comprehensive range of human thermal climate indices. Int. J. Biometeorol. 2016, 61, 487–512. [Google Scholar] [CrossRef] [PubMed]
- Australia Government Bureau of Meteorology. Thermal Comfort Observations. Available online: http://www.bom.gov.au/info/thermal_stress/ (accessed on 5 February 2010).
- Thom, E.C. The Discomfort Index. Weatherwise 1959, 12, 57–61. [Google Scholar] [CrossRef]
- Masterton, J.M.; Richardson, F.A. Humidex: A Method of Quantifying Human Discomfort Due to Excessive Heat and Humidity; Atmospheric Environment Service: Toronto, ON, Canada; Available online: https://publications.gc.ca/collections/collection_2018/eccc/En57-23-1-79-eng.pdf (accessed on 5 February 2010).
- Angouridakis, V.E.; Makrogiannis, T.J. The Discomfort-Index in Thessaloniki, Greece. Int. J. Biometeorol. 1982, 26, 53–59. [Google Scholar] [CrossRef]
- Giles, B.D.; Balafoutis, C.; Maheras, P. Too Hot for Comfort: The Heatwaves in Greece in 1987 and 1988. Int. J. Biometeorol. 1990, 34, 98–104. [Google Scholar] [CrossRef] [PubMed]
- Paliatsos, A.G.; Nastos, P.T. Relation between air pollution episodes and discomfort index in the greater Athens area, Greece. Glob. Nest J. 1999, 1, 91–97. [Google Scholar]
- Tselepidaki, I.; Santamouris, M.; Moustris, C.; Poulopoulou, G. Analysis of the Summer Discomfort Index in Athens, Greece, for Cooling Purposes. Energy Build. 1992, 18, 51–56. [Google Scholar] [CrossRef]
- Stathopoulou, M.I.; Cartalis, C.; Keramitsoglou, I.; Santamouris, M. Thermal remote sensing of Thom’s discomfort index (DI): Comparison with in-situ measurements. Remote Sens. 2005, 5983, 59830. [Google Scholar]
- Kambezidis, H.D.; Psiloglou, B.E.; Varotsos, K.V.; Giannakopoulos, C. Climate Change and Thermal Comfort in Greece. Climate 2021, 9, 10. [Google Scholar] [CrossRef]
- Pantavou, K.; Santamouris, M.; Asimakopoulos, D.; Theoharatos, G. Empirical calibration of thermal indices in an urban outdoor Mediterranean environment. Build. Environ. 2014, 80, 283–292. [Google Scholar] [CrossRef]
- Katavoutas, G.; Founda, D. Intensification of thermal risk in Mediterranean climates: Evidence from the comparison of rational and simple indices. Int. J. Biometeorol. 2019, 63, 1251–1264. [Google Scholar] [CrossRef] [PubMed]
- Kassomenos, P.; Kotroni, V.; Kallos, G. Analysis of Climatological and Air Quality Observations from Greater Athens Area. Atmos. Environ. 1995, 29B, 3671–3688. [Google Scholar] [CrossRef]
- Founda, D.; Kambezidis, H.D.; Petrakis, M.; Zanis, P.; Zerefos, C. A correction of the recent air-temperature record at the historical meteorological station of the National Observatory of Athens (NOA) due to instrument change. Theor. Appl. Climatol. 2009, 97, 385–389. [Google Scholar] [CrossRef]
- Giannakopoulos, C.; Kostopoulou, E.; Varotsos, K.V.; Tziotziou, K.; Plitharas, A. An integrated assessment of climate change impacts for Greece in the near future. Reg. Environ. Chang. 2011, 11, 829–843. [Google Scholar] [CrossRef]


| Range (°C) | Discomfort Level |
|---|---|
| TDI < 21 | No discomfort |
| 21 ≤ TDI < 24 | Under 50% of the population feels discomfort |
| 24 ≤ TDI < 27 | Over 50% of the population feels discomfort |
| 27 ≤ TDI < 29 | Most of the population suffers discomfort |
| 29 ≤ TDI < 32 | Everyone feels severe stress |
| TDI ≥ 32 | State of medical emergency |
| Range (°C) | Discomfort Level |
|---|---|
| HMDX < 20 | No discomfort |
| 20 ≤ HMDX < 30 | Little to no discomfort |
| 30 ≤ HMDX < 38 | Some discomfort |
| 38 ≤ HMDX < 45 | Great discomfort, avoid exertion |
| HMDX ≥ 45 | Dangerous, heat stroke quite possible |
| Statistical Parameter | Ta | RH | TDI | HMDX |
|---|---|---|---|---|
| Number of values | 1,083,876 | 1,082,598 | 1,079,938 | 1,079,938 |
| Average | 17.97 | 61.6 | 16.76 | 19.00 |
| Standard deviation | 7.57 | 17.1 | 5.69 | 8.35 |
| Minimum | −5.4 | 8 | −5.4 | −5.4 |
| 1st quartile (25%) | 12.1 | 49 | 12.5 | 12.3 |
| Median (50%) | 17.5 | 63 | 16.9 | 18.4 |
| 3rd quartile (75%) | 23.8 | 75 | 21.5 | 25.7 |
| Maximum | 43.8 | 100 | 32.7 | 49.0 |
| 90th percentile | 28.2 | 84 | 24.0 | 30.3 |
| 99th percentile | 34.1 | 94 | 27.0 | 36.4 |
Disclaimer/Publisher’s Note: The statements, opinions and data contained in all publications are solely those of the individual author(s) and contributor(s) and not of MDPI and/or the editor(s). MDPI and/or the editor(s) disclaim responsibility for any injury to people or property resulting from any ideas, methods, instructions or products referred to in the content. |
© 2025 by the authors. Licensee MDPI, Basel, Switzerland. This article is an open access article distributed under the terms and conditions of the Creative Commons Attribution (CC BY) license (https://creativecommons.org/licenses/by/4.0/).
Share and Cite
Psiloglou, B.E.; Gkinis, N.; Giannakopoulos, C. Variation in Discomfort Indices in Athens, Greece, for the Period from 1901 to 2024. Environ. Earth Sci. Proc. 2025, 35, 48. https://doi.org/10.3390/eesp2025035048
Psiloglou BE, Gkinis N, Giannakopoulos C. Variation in Discomfort Indices in Athens, Greece, for the Period from 1901 to 2024. Environmental and Earth Sciences Proceedings. 2025; 35(1):48. https://doi.org/10.3390/eesp2025035048
Chicago/Turabian StylePsiloglou, Basil E., Nikolas Gkinis, and Christos Giannakopoulos. 2025. "Variation in Discomfort Indices in Athens, Greece, for the Period from 1901 to 2024" Environmental and Earth Sciences Proceedings 35, no. 1: 48. https://doi.org/10.3390/eesp2025035048
APA StylePsiloglou, B. E., Gkinis, N., & Giannakopoulos, C. (2025). Variation in Discomfort Indices in Athens, Greece, for the Period from 1901 to 2024. Environmental and Earth Sciences Proceedings, 35(1), 48. https://doi.org/10.3390/eesp2025035048


