Proceeding Paper

Application of LiDAR Remote Sensing for Aerosol Monitoring: Case Studies in Cyprus and Greece †

1
Department of Environmental Physics and Meteorology, University of Athens, 15784 Athens, Greece
2
Raymetrics S.A., Spartis 32, 14452 Metamorphosis, Greece
*
Author to whom correspondence should be addressed.
Presented at the 17th International Conference on Meteorology, Climatology, and Atmospheric Physics—COMECAP 2025, Nicosia, Cyprus, 29 September–1 October 2025.
Environ. Earth Sci. Proc. 2025, 35(1), 43; https://doi.org/10.3390/eesp2025035043
Published: 22 September 2025

Abstract

Atmospheric aerosols impact environmental quality and health, requiring accurate quantification. This study employed the PMeye scanning LiDAR, a UV system operating at 355 nm by Raymetrics S.A. for continuous, high-resolution monitoring in two campaigns: May 2024 (Vasilikos Power Station, Cyprus) and June 2024 (Port of Piraeus, Greece). Measurement days with dust presence were selected via AERONET-based aerosol classification and validated using a SKIRON model. A novel horizontal scanning method at 355 nm distinguished dust from anthropogenic emissions. Results showed higher pollution in Cyprus (~500 μg/m3) due to dust and chimney emissions, versus ~150 μg/m3 in Piraeus from dust and ship exhausts.

1. Introduction

Atmospheric aerosols—fine solid or liquid particles suspended in the air—play a major role in climate, air quality, and human health [1,2]. Their properties vary depending on their source (natural or anthropogenic) and evolve through interactions and atmospheric processes [3]. Aerosols affect the Earth’s radiative balance directly through scattering and absorption and indirectly by influencing cloud formation and precipitation [4,5].
While satellite and in situ systems provide valuable data, they often lack vertical or spatial resolution. LiDAR systems overcome these limitations by offering high-resolution spatiotemporal profiling of aerosol distribution and optical characteristics [6].
This study utilizes the PMeye Scanning LiDAR developed by Raymetrics S.A. to retrieve horizontal distributions of aerosol mass concentration. Field deployments took place at Vasilikos Power Station (Cyprus) and the Port of Piraeus (Greece) in May and June 2024. Emphasis is placed on the decomposition of backscatter into dust and non-dust contributions, based on optical properties. The methodology is supported by AERONET retrievals and regional-scale models, ensuring robust interpretation of pollution dynamics across both sites [7].

2. Methodology

2.1. Classification of Aerosol Types in the Vertical Column

In this study, we apply the aerosol classification method of Shin et al. [8] using AERONET Version 3 inversion data. Classification is based on the particle linear depolarization ratio (PLDR) and single scattering albedo (SSA) at 1020 nm. The Dust Ratio (Rd), derived from PLDR thresholds, enables separation into pure dust (PD), a dust-dominated mixture (DDM), pollution-dominated mixture (PDM), and pollution aerosols (PA). SSA further differentiates pollution aerosols into non-absorbing (NA), weakly absorbing (WA), moderately absorbing (MA), and strongly absorbing (SA) types [8,9,10,11]. Combined with Rd, it enables precise detection of dust presence and mixing state [12], aiding in aerosol classification during the Cyprus campaign (19–29 May 2024) under Saharan dust influence [13].

2.2. Backscatter Separation and Quantification of Aerosol Mass Concentration

We adapted the LiDAR-based POLIPHON approach of Ansmann et al. [14] to separate fine and coarse mode mass concentrations using horizontally retrieved backscatter coefficients. The core assumption is that desert dust is coarse mode, while non-dust (including anthropogenic) aerosols are fine mode [15,16]. Key steps of the retrieval process include estimating extinction coefficients using lidar ratios S355,nd = 117.3 sr and S355,d = 57.9 sr [17], calculating specific mass extinction coefficients from AERONET-derived volume to AOD ratios (v_f/τ_f = 0.24, v_c/τ_c = 0.64) and assuming particle densities ρ_f = 1.6 g/cm3 and ρ_c = 2.6 g/cm3 [18,19]. The full retrieval methodology is visualized in Figure 1.

3. Results

3.1. Results from AERONET

To distinguish PM concentrations between Saharan dust and non-dust sources (e.g., local emissions), AERONET Level 2 inversion data from the CUT-TEPAK station were used to classify aerosol conditions into four types (PD, DDM, PDM, PA), focusing on dust-dominated periods (Figure 2a). Simultaneously, high coarse mode AOD (Figure 2b) confirmed mineral dust dominance. The Dust Ratio (Rd) peaked at ~0.85, validating the classification as DDM. This multi-parameter analysis confirmed a major Saharan dust intrusion in Cyprus during 17–23 May, followed by a return to pollution-dominated conditions, supporting the interpretation and application of the PMeye retrievals.

3.2. Results from PMeye Measurments

During the Cyprus campaign (17–23 May 2024) at Vassilikos Power Station, we focus on a representative Azimuth Scanning (AS) measurement from 21 May, selected for its overlap of Saharan dust and strong local emissions, enabling detailed analysis of aerosol properties and pollution sources. In the Piraeus campaign, PMeye performed azimuthal scans with a wide zenith angle (~75°) to map maritime aerosols. A key scan on 17 June at 18:19 UTC used conical geometry (~360° sweep, 1500 m range, ~500 m altitude), capturing horizontal and vertical emissions—mainly from ships—highlighting mobile source impacts in this coastal environment.
  • Optical properties
During the Cyprus campaign, the 21 May measurement revealed three distinct aerosol layers (Figure 3a): high backscatter and a low PLDR at 600–800 m (direct emissions), moderate values at 300–500 m (diffusion/secondary chimneys), and low backscatter with PLDR > 30% above 1000 m, indicating Saharan dust transport. Figure 4a shows the spatiotemporal distribution of the backscatter and PLDR during an AS scan (08:55–09:10 UTC) with an 81.5° zenith angle and 78° azimuthal sweep. The near-horizontal configuration allows the range to represent horizontal distance. A strong plume (~14–15 Mm−1 sr−1) appears between 600 and 1000 m range and above 75 m height, aligning with the chimney. The ~10° tilt confirms direct detection, while a PLDR below 10% suggests spherical combustion aerosols.
In Piraeus, most scans showed a low backscatter and PLDR (Figure 3b), indicating combustion-dominated particles. However, the 18:19 scan on 17 June revealed elevated backscatter during peak vessel traffic and occasional PLDR > 20% (Figure 3b and Figure 4b), suggesting Saharan dust presence.
  • Quantification and decomposition of Aerosol Mass Concentration
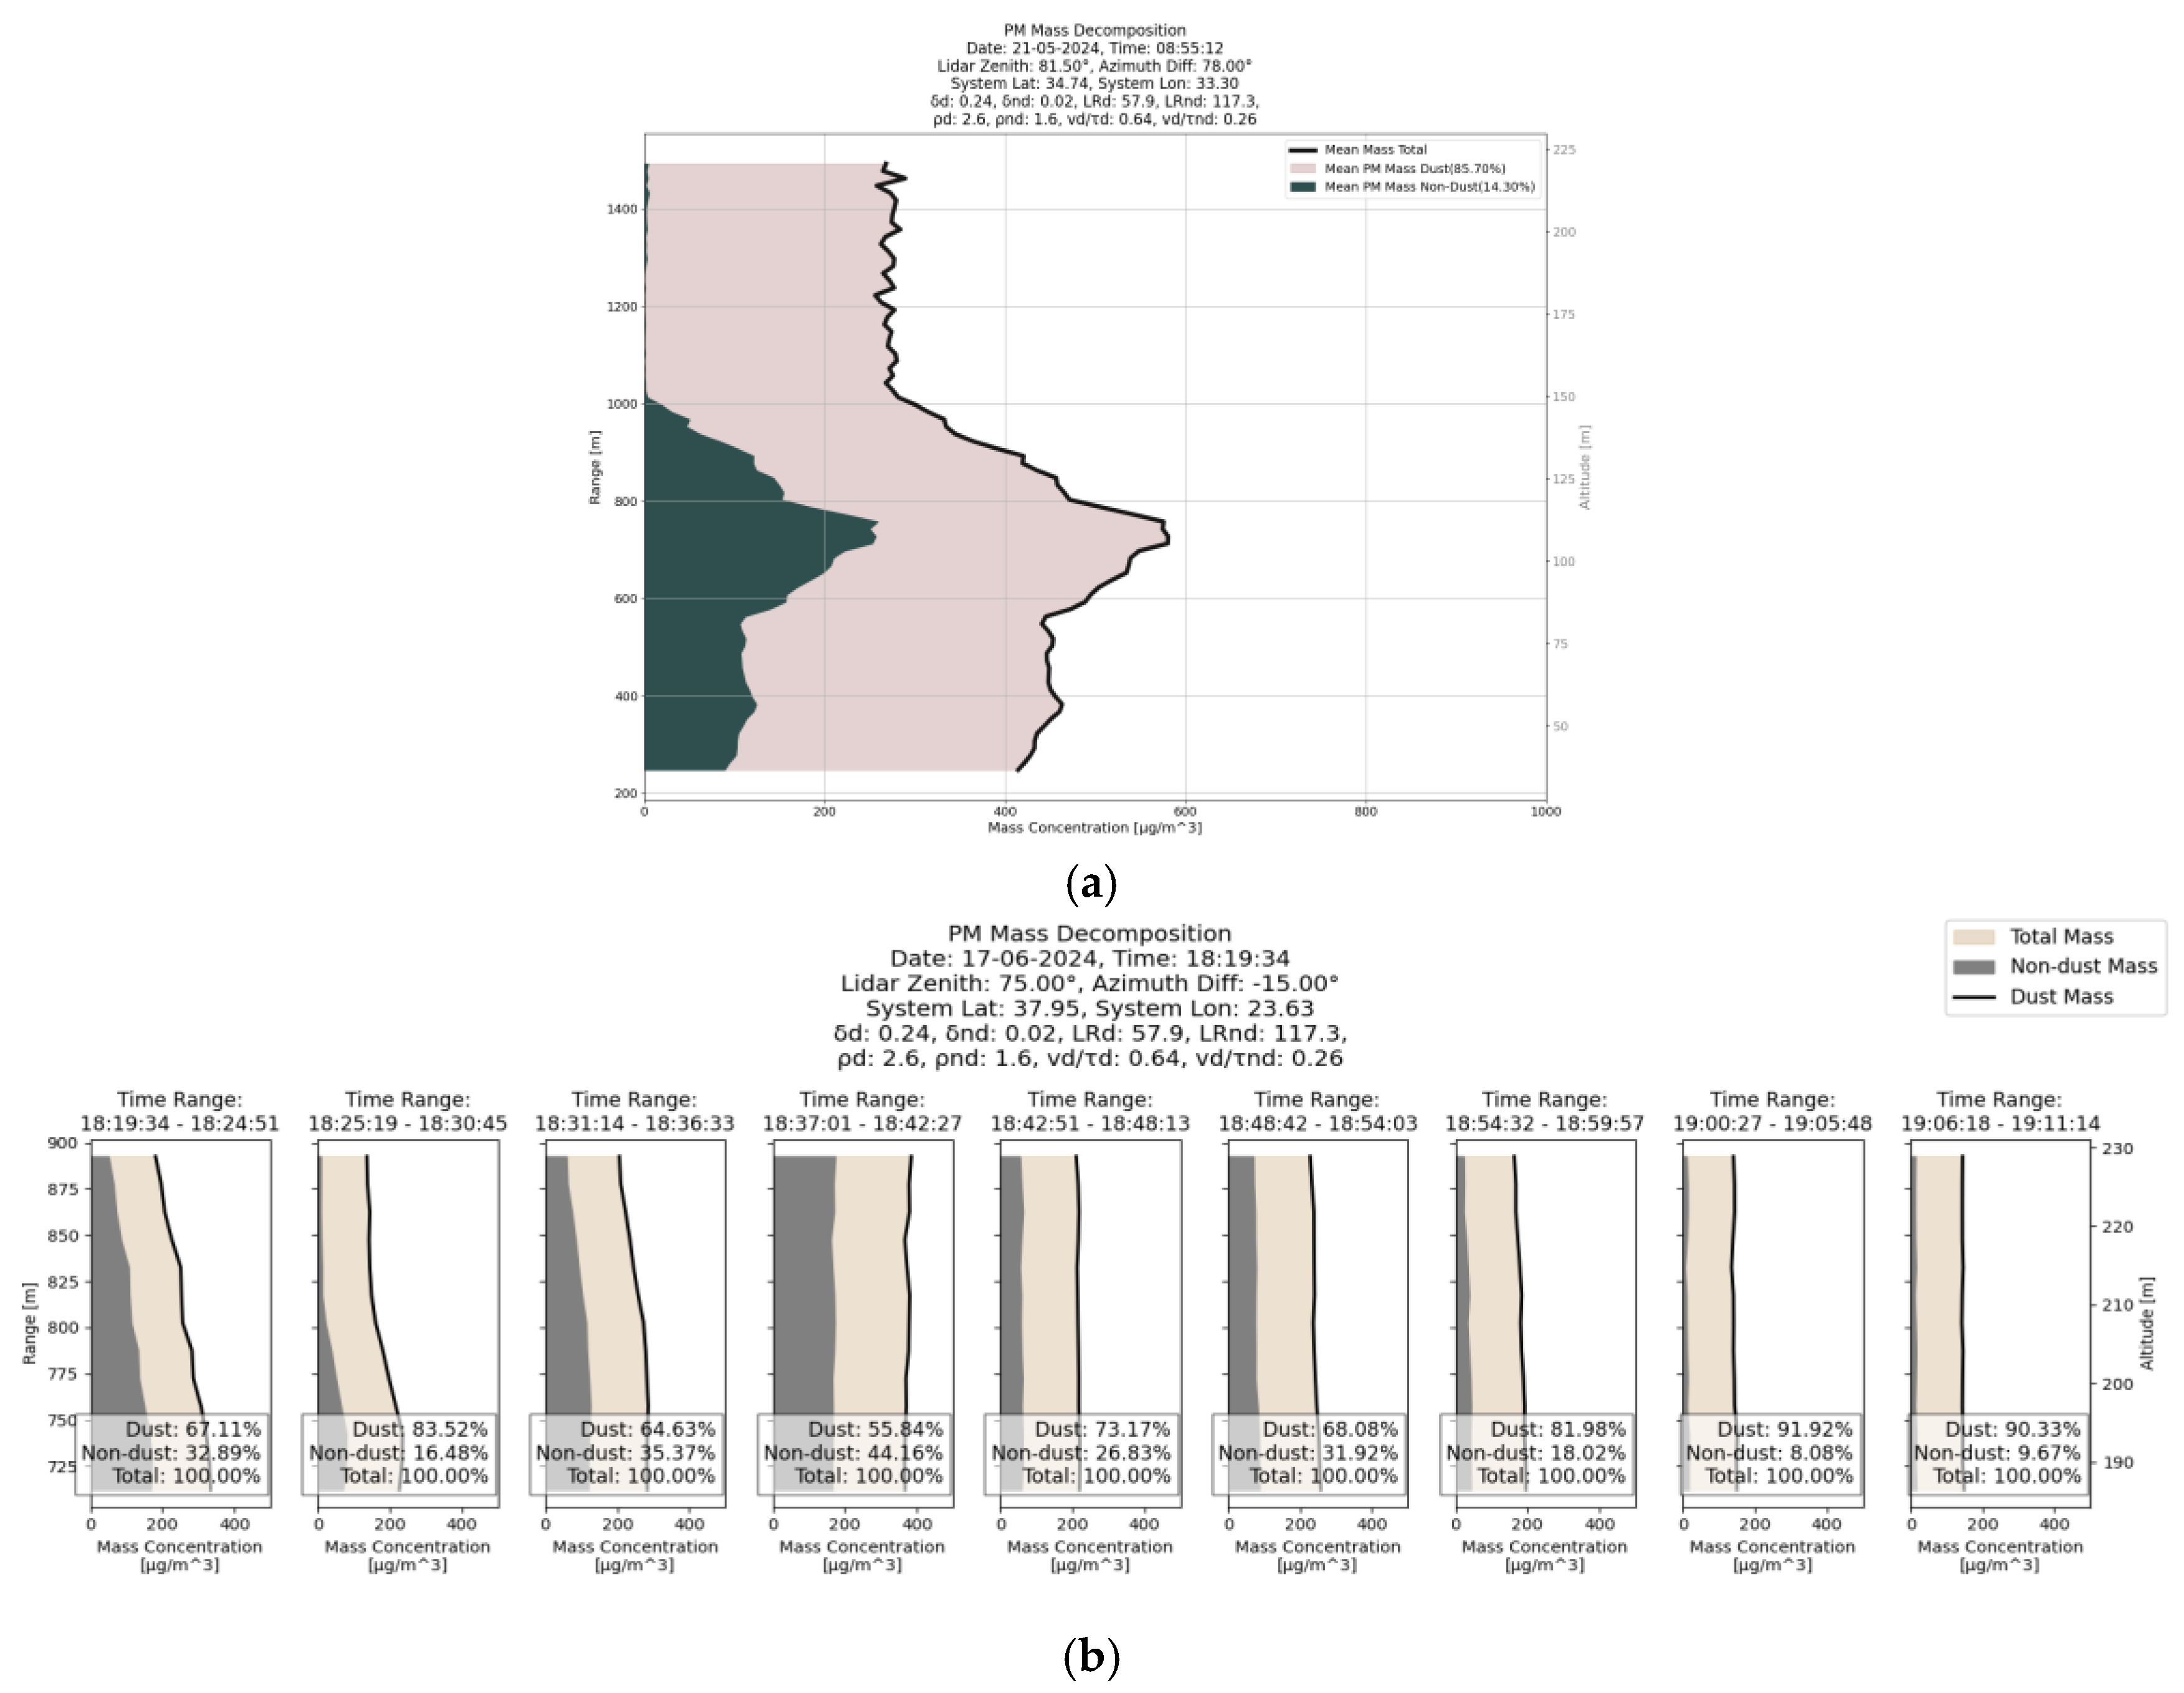
In Cyprus, Figure 5a shows time–height heatmaps: total and non-dust mass concentrations peak between 08:59 and 09:02 at 75–125 m, aligning with chimney height, while dust remains stable, indicating persistent background presence. Figure 6a presents spatially averaged PM mass concentrations, with pink indicating dust and green indicating non-dust (anthropogenic) aerosols. Dust dominates, contributing approximately 86% of total PM mass, while non-dust peaks near the power plant chimney (~14%), confirming local emission impact. These findings highlight the simultaneous influence of Saharan dust and local combustion sources on near-surface air quality.
In Piraeus, the PMeye system performed a full azimuthal scan on 17 June 2024 at 18:19 UTC (Figure 4b), capturing emissions from both the port and the city. Data were divided into nine-time intervals (Figure 6b), focused on the 700–900 m range. Using the same mass decomposition method, the highest non-dust share (~33%) appeared between 18:19 and 18:24 (ship emissions), and a second peak (~45%) between 18:37 and 18:42 (urban emissions). In other intervals, dust dominated (>90%), reflecting background Saharan influence (Figure 5b and Figure 6b).

4. Conclusions and Discussion

This study demonstrated the capability of the PMeye Scanning LiDAR system to monitor atmospheric pollution with high spatiotemporal resolution using horizontal scanning geometries. A novel decomposition of particulate mass concentration into dust and non-dust components—based on optical properties—was applied to horizontal scans for the first time, enabling source attribution. In Cyprus, Saharan dust transport combined with power plant emissions elevated PM levels (~500 μg/m3), while in Piraeus, maritime and urban sources produced lower but variable concentrations (~150 μg/m3). AERONET-based aerosol classification ensured accurate detection of dust-influenced periods. Results highlight how scan geometry, especially zenith angle, affects signal interpretation. PMeye effectively resolved spatial and temporal aerosol structures, distinguishing combustion plumes from background dust. This approach supports advanced air quality monitoring and can be integrated into urban networks, particularly in coastal and industrial areas where traditional methods lack directional insight.

Author Contributions

Conceptualization, E.G.; methodology, C.M., E.G. and O.S.; software, C.M.; validation, C.M., E.G. and O.S.; formal analysis, C.M.; investigation, C.M.; resources, O.S.; data curation, C.M.; writing—original draft preparation, C.M.; writing—review and editing, C.M., E.G. and O.S.; visualization, C.M.; supervision, E.G.; project administration, E.G.; funding acquisition, E.G. All authors have read and agreed to the published version of the manuscript.

Funding

The research work was funded by the Hellenic Foundation for Research and Innovation (H.F.R.I.) under the “Basic Research Financing (Horizontal support for all Sciences), National Recovery and Resilience Plan (Greece 2.0)” (Project Acronym: SCOPE, Project Number: 015144.

Institutional Review Board Statement

Not applicable. The study did not involve humans or animals.

Informed Consent Statement

Not applicable. The study did not involve humans.

Data Availability Statement

The data are available upon request from the authors.

Acknowledgments

We thank the PI Diofantos Hadjimitsis for his effort in establishing and maintaining CUT-TEPAK AERONET site.

Conflicts of Interest

The authors declare the following potential conflict of interest: Ourania Soupiona is employed by Raymetrics S.A. The PMeye data used in this study were provided by Raymetrics S.A. The company had no role in the design of the study, in the analysis or interpretation of the results, or in the decision to publish the findings.

References

  1. Hinds, W.C. Aerosol Technology: Properties, Behavior, and Measurement of Airborne Particles, 2nd ed.; Wiley-Interscience: New York, NY, USA, 1998. [Google Scholar]
  2. IPCC. Climate Change 2013: The Physical Science Basis. Contribution of Working Group I to the Fifth Assessment Report; Cambridge University Press: Cambridge, UK, 2013. [Google Scholar]
  3. Müller, D.; Ansmann, A.; Mattis, I.; Tesche, M.; Wandinger, U.; Althausen, D.; Pisani, G. Aerosol-type-dependent lidar ratios observed with Raman lidar. J. Geophys. Res. Atmos. 2007, 112, D16202. [Google Scholar] [CrossRef]
  4. Charlson, R.J.; Schwartz, S.E.; Hales, J.M.; Cess, R.D.; Coakley, J.A.; Hansen, J.E.; Hofmann, D.J. Climate forcing by anthropogenic aerosols. Science 1992, 255, 423–430. [Google Scholar] [CrossRef] [PubMed]
  5. Twomey, S. The influence of pollution on the shortwave albedo of clouds. J. Atmos. Sci. 1977, 34, 1149–1152. [Google Scholar] [CrossRef]
  6. Ansmann, A.; Wagner, F.; Müller, D.; Althausen, D.; Herber, A.; Wandinger, U. European pollution outbreaks during ACE-2: Lidar observations of anthropogenic aerosol layers. J. Geophys. Res. Atmos. 2002, 107, 8126. [Google Scholar] [CrossRef]
  7. Kleanthous, S.; Vrekoussis, M.; Mihalopoulos, N.; Kalabokas, P.; Lelieveld, J. On the temporal and spatial variation of ozone in Cyprus. Sci. Total Environ. 2014, 476–477, 677–687. [Google Scholar] [CrossRef] [PubMed]
  8. Shin, S.-K.; Tesche, M.; Noh, Y.; Müller, D. Aerosol-type classification based on AERONET version 3 inversion products. Atmos. Chem. Phys. 2019, 19, 3789–3803. [Google Scholar] [CrossRef]
  9. Giles, D.M.; Holben, B.N.; Eck, T.F.; Sinyuk, A.; Smirnov, A.; Slutsker, I.; Dickerson, R.R.; Thompson, A.M.; Schafer, J.S. An analysis of AERONET aerosol absorption properties and classifications representative of aerosol source regions. Atmos. Chem. Phys. 2012, 117. [Google Scholar] [CrossRef]
  10. Dubovik, O.; Holben, B.; Eck, T.; Smirnov, A.; Kaufman, Y.; King, M.; Tanré, D.; Slutsker, I. Variability of Absorption and Optical Properties of Key Aerosol Types Observed in Worldwide Locations. J. Atmos. Sci. 2002, 59, 590–608. [Google Scholar] [CrossRef]
  11. Freudenthaler, V.; Esselborn, M.; Wiegner, M.; Heese, B.; Tesche, M.; Ansmann, A.; Weinzierl, B. Depolarization ratio profiling at several wavelengths in pure Saharan dust during SAMUM 2006. Tellus B Chem. Phys. Meteorol. 2009, 61, 165–179. [Google Scholar] [CrossRef]
  12. Mamouri, R.E.; Ansmann, A. Fine and coarse dust separation with polarization lidar. Atmos. Meas. Tech. 2014, 7, 3717–3735. [Google Scholar] [CrossRef]
  13. Mamouri, R.E.; Ansmann, A. Potential of polarization/Raman lidar to separate fine dust, coarse dust, marine, and anthropogenic aerosol profiles. Atmos. Meas. Tech. 2017, 10, 3403–3427. [Google Scholar] [CrossRef]
  14. Ansmann, A.; Tesche, M.; Althausen, D.; Müller, D.; Seifert, P.; Freudenthaler, V.; Heese, B.; Wiegner, M.; Pisani, G.; Knippertz, P.; et al. Influence of Saharan dust on cloud glaciation in southern Morocco during the Saharan Mineral Dust Experiment. J. Geophys. Res. Atmos. 2008, 113, D04210. [Google Scholar] [CrossRef]
  15. Giannakaki, E.; Zyl, P.G.; Müller, D.; Balis, D.; Komppula, M. Optical and microphysical characterization of aerosol layers over South Africa by means of multi-wavelength depolarization and Raman lidar measurements. Atmos. Chem. Phys. Discuss. 2015, 16, 35237–35276. [Google Scholar] [CrossRef]
  16. Schuster, G.L.; Dubovik, O.; Holben, B.N. Angstrom exponent and bimodal aerosol size distributions. J. Geophys. Res. Atmos. 2006, 111, D07207. [Google Scholar] [CrossRef]
  17. Floutsi, A.A.; Baars, H.; Wandinger, U. HETEAC-Flex: An optimal estimation method for aerosol typing based on lidar-derived intensive optical properties. Atmos. Meas. Tech. 2024, 17, 693–714. [Google Scholar] [CrossRef]
  18. Hess, M.; Koepke, P.; Schult, I. Optical properties of aerosols and clouds: The software package OPAC. Bull. Am. Meteorol. Soc. 1998, 79, 831–844. [Google Scholar] [CrossRef]
  19. Cozic, J.; Verheggen, B.; Weingartner, E.; Crosier, J.; Bower, K.N.; Flynn, M.; Coe, H.; Henning, S.; Steinbacher, M.; Henne, S.; et al. Chemical composition of free tropospheric aerosol for PM1 and coarse mode at the high alpine site Jungfraujoch. Atmos. Chem. Phys. 2008, 8, 407–423. [Google Scholar] [CrossRef]
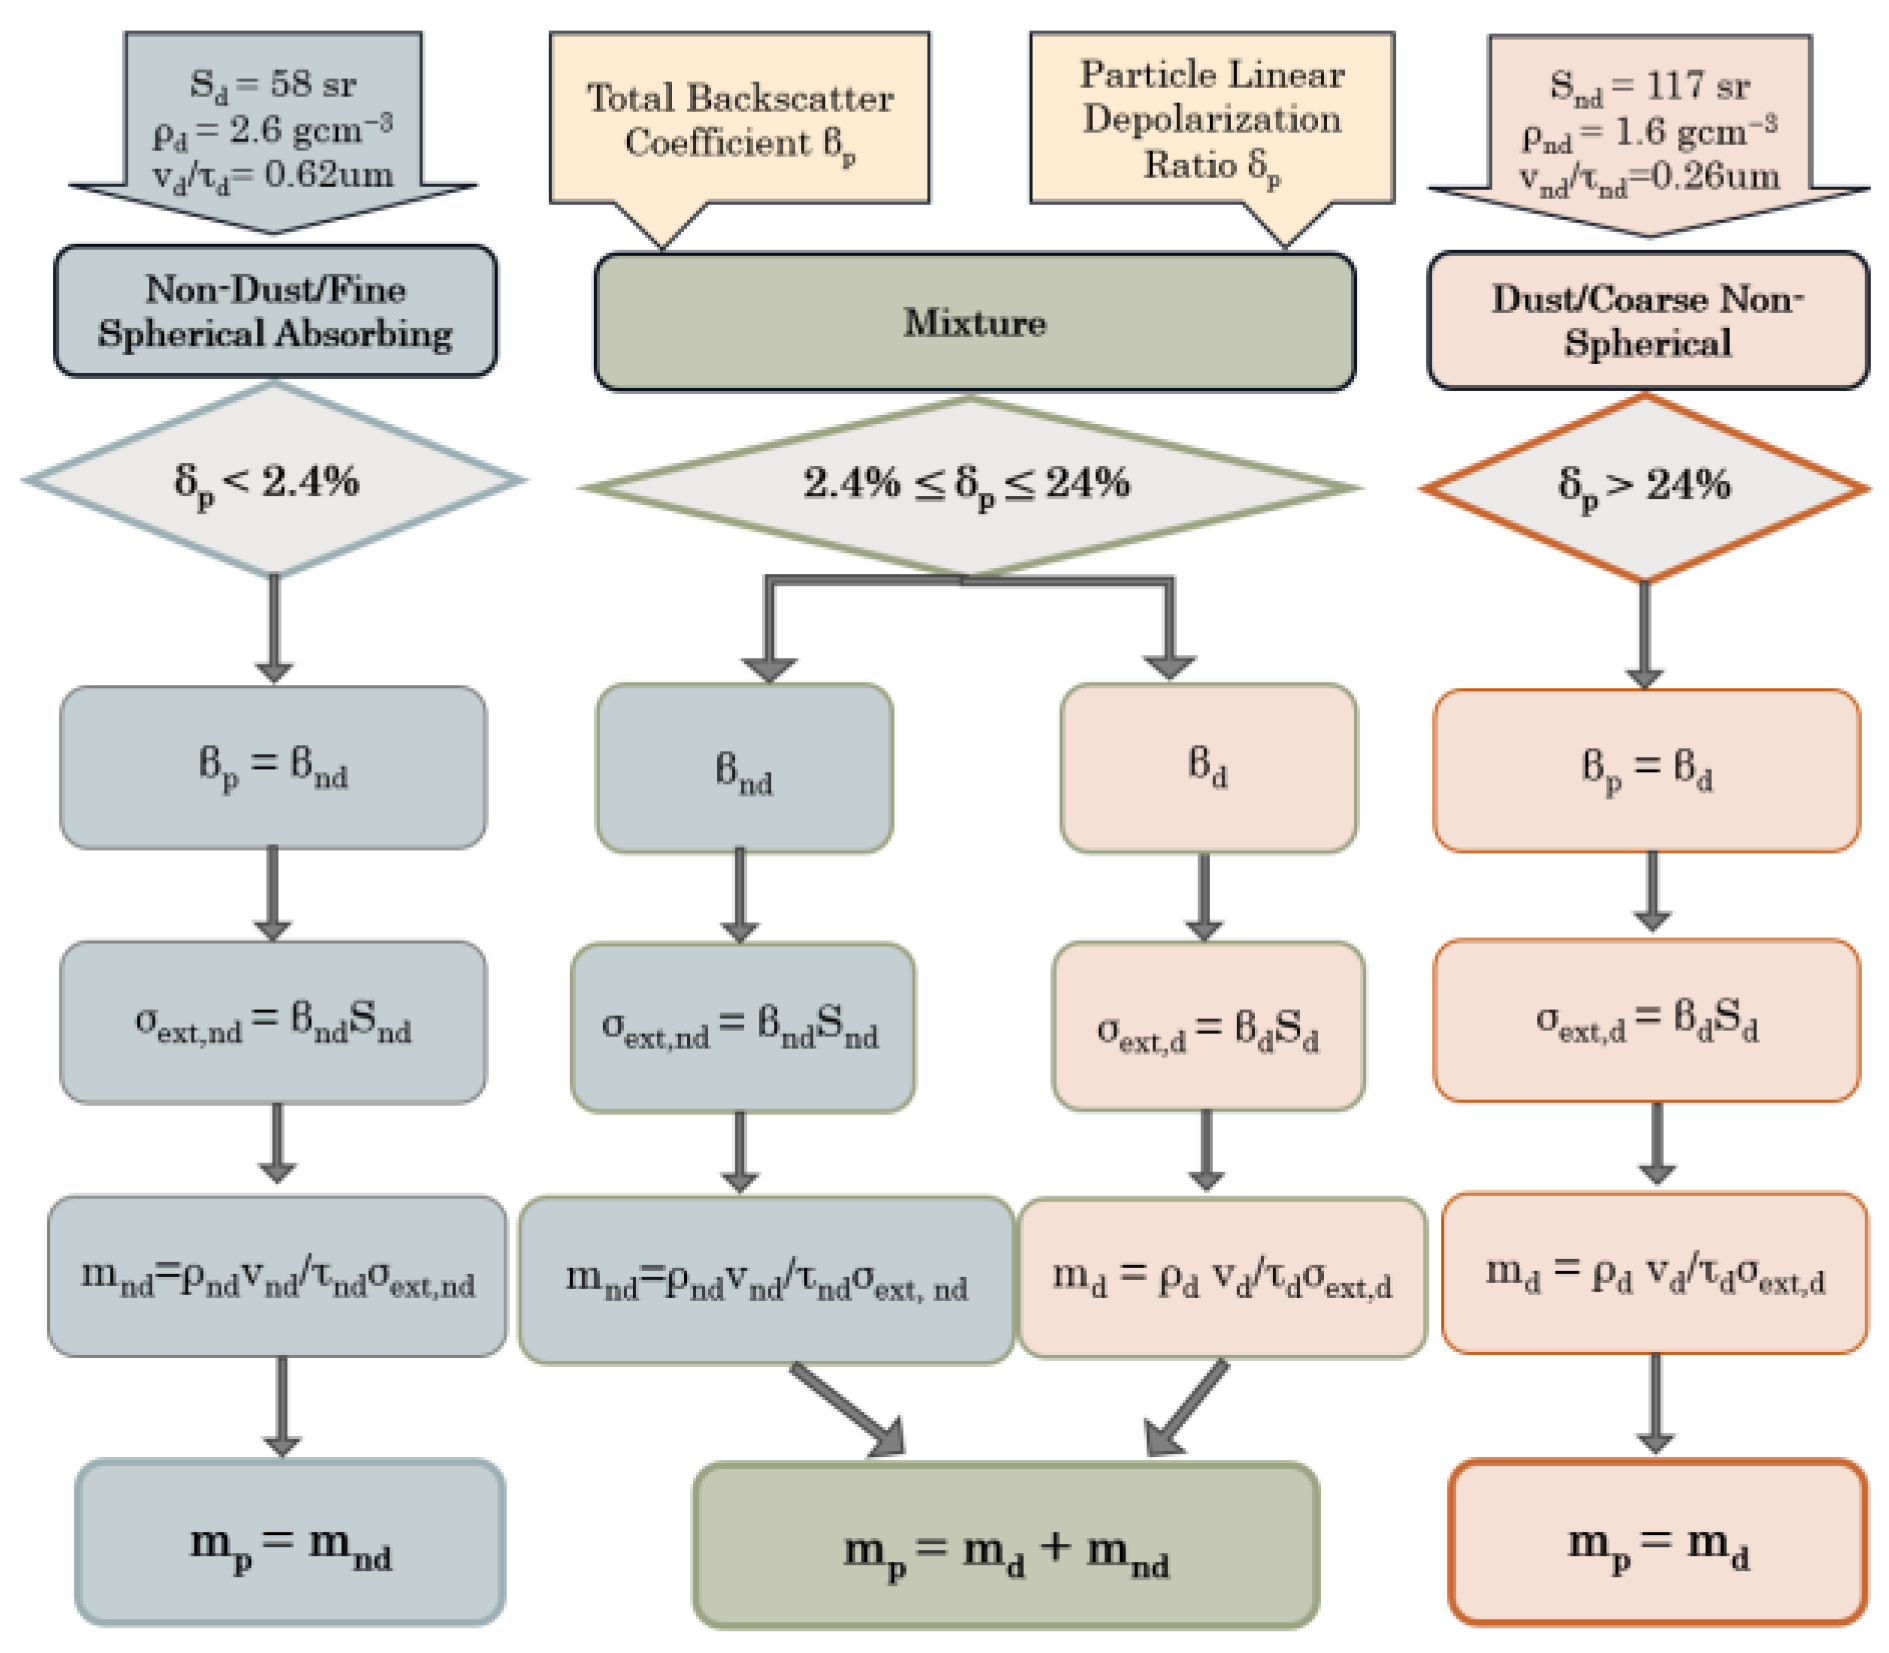
Figure 1. Flowchart of the methodology used in the present study for the horizontal distribution of aerosol mass concentration and the calculation of total aerosol mass, based on the optical properties retrieved from the PMeye Scanning LiDAR.
Eesp 35 00043 g001
Figure 2. (a) Time series of dust ratio and aerosol type classification (b) Time series of AOD at 440 nm for the period from 10 to 30 May 2024.
Eesp 35 00043 g002
Figure 3. Horizontal profiles of hourly mean values for each range of the backscatter coefficient and linear depolarization ratio for (a) 21 May 2024 at 08:55 and (b) 17 June 2024 at 18:19, including standard deviations.
Eesp 35 00043 g003
Figure 4. 3D heatmap of the backscatter coefficient and 2D heatmap the linear depolarization ratio for the AS measurement on (a) 21 May 2024 at 08:55 and (b) 17 June 2024 at 18:19.
Eesp 35 00043 g004
Figure 5. Two-dimensional heatmap of the spatial and temporal distribution of PM mass concentration on (a) 21 May 2024 at 08:55 and (b) 17 June 2024 at 18:19.
Eesp 35 00043 g005
Figure 6. Horizontal distribution of mass concentration of particulate matter for the AS measurement on (a) 21 May 2024 at 08:55 and (b) on 17 June 2024 at 18:19, divided into nine distinct time intervals and limited to the 700–900 m range.
Eesp 35 00043 g006
Disclaimer/Publisher’s Note: The statements, opinions and data contained in all publications are solely those of the individual author(s) and contributor(s) and not of MDPI and/or the editor(s). MDPI and/or the editor(s) disclaim responsibility for any injury to people or property resulting from any ideas, methods, instructions or products referred to in the content.