Proceeding Paper

An Analysis of the PM2.5 Concentrations from Insect Repellent Emissions Through a Bag Filter Unit †

Laboratory of Air Pollution, Department of Mechanical Engineering, University of West Attica, 250 Thivon & P. Ralli Street, 12241 Athens, Greece
*
Author to whom correspondence should be addressed.
Presented at the 17th International Conference on Meteorology, Climatology, and Atmospheric Physics—COMECAP 2025, Nicosia, Cyprus, 29 September–1 October 2025.
Environ. Earth Sci. Proc. 2025, 35(1), 40; https://doi.org/10.3390/eesp2025035040
Published: 18 September 2025

Abstract

This study investigates the variations in the PM2.5 particles in a baghouse filter unit under variable airflow conditions. PM2.5 emissions originate from the insect repellents commonly used in homes during warmer months, potentially affecting human health. Three low-cost sensors were installed at the entry, middle, and exit of the filter unit to measure the particle concentrations. Various filter combinations were tested. The findings revealed that using all filters achieved complete PM2.5 retention, while reduced filter setups led to only a partial reduction. These results offer useful insights for optimizing the design and performance of air filtration systems.

1. Introduction

Modern and highly urbanized societies create the need for anti-pollution and air quality improvement technologies in both outdoor and indoor environments. According to the World Health Organization (WHO) [1], particulate emissions are directly related to respiratory system and cardiovascular diseases due to the effects of prolonged and daily exposure on human health. It has been demonstrated that particulate filtering can contribute to a reduction in the significant morbidity and mortality associated with indoor exposure to outdoor particulate matter [2,3]. The industrial sector is a major contributor to air pollution at a global scale. The implementation of anti-pollution technologies in industrial facilities is widely regarded as being of paramount importance to the maintenance of an adequate air quality. The selection of anti-pollution technologies is made under parameters such as temperature, humidity, and the form and composition of the emitted pollutants. In addition, the technologies and filtering options employed are based on standards and follow a specific standardization [4,5] depending on the type and size of the emitting particles.
Baghouse retention units are devices in which a stream of exhaust gas and dust flows enter the chamber and are contained on their surfaces. The PM2.5 particles are trapped on the surface of the filters, creating a dust cake, while the outlet provides clean air to the room. According to the standard, maintenance and cleaning of the filters are necessary to ensure a stable performance and a longer life. Bag filters have high efficiencies, even for small particle diameters (~99%), as their filters have a filtration range from 100 μm to 0.3 μm [5,6]. These filters have a multitude of applications in the food, chemical, and mineral industries; in the power generation sector; and in workplaces where particulate emissions from various non-industrial activities are observed. The deployment of low-cost air quality sensors within the filtration unit at three distinct locations (the inlet, intermediate section, and outlet) has been demonstrated to facilitate the acquisition of valuable data for the purpose of evaluating the performance under varying conditions and emission sources.
The present study sought to analyze the performance scenarios of filter units under varying conditions, with consistent emissions of insect repellent spirals—a widely consumed product. This study is expected to provide valuable insights into the effectiveness of filters in retaining PM2.5.

2. The Bag Filter Retention Unit

The experimental filtration unit was constructed from steel and aluminum, with external dimensions of 2530 × 650 × 420 mm and internal dimensions of 570 × 335 mm, designed to accommodate commercially available standardized filters (Figure 1). It consists of six chambers: a combustion chamber housing the PurpleAir Sensor (A), a pre-filtration measurement chamber with a PurpleAir Sensor (B), a filtration chamber containing five consecutive filtration stages, a post-filtration measurement chamber with a PurpleAir Sensor (C), a centrifugal fan chamber, and an exhaust chamber. The filtration system includes a (G2) grease filter, a (G4) pre-filter, F8 and (H10) high-efficiency bag filters, and FCC-AC activated carbon filters, ensuring comprehensive air purification [7,8].

3. Methodology

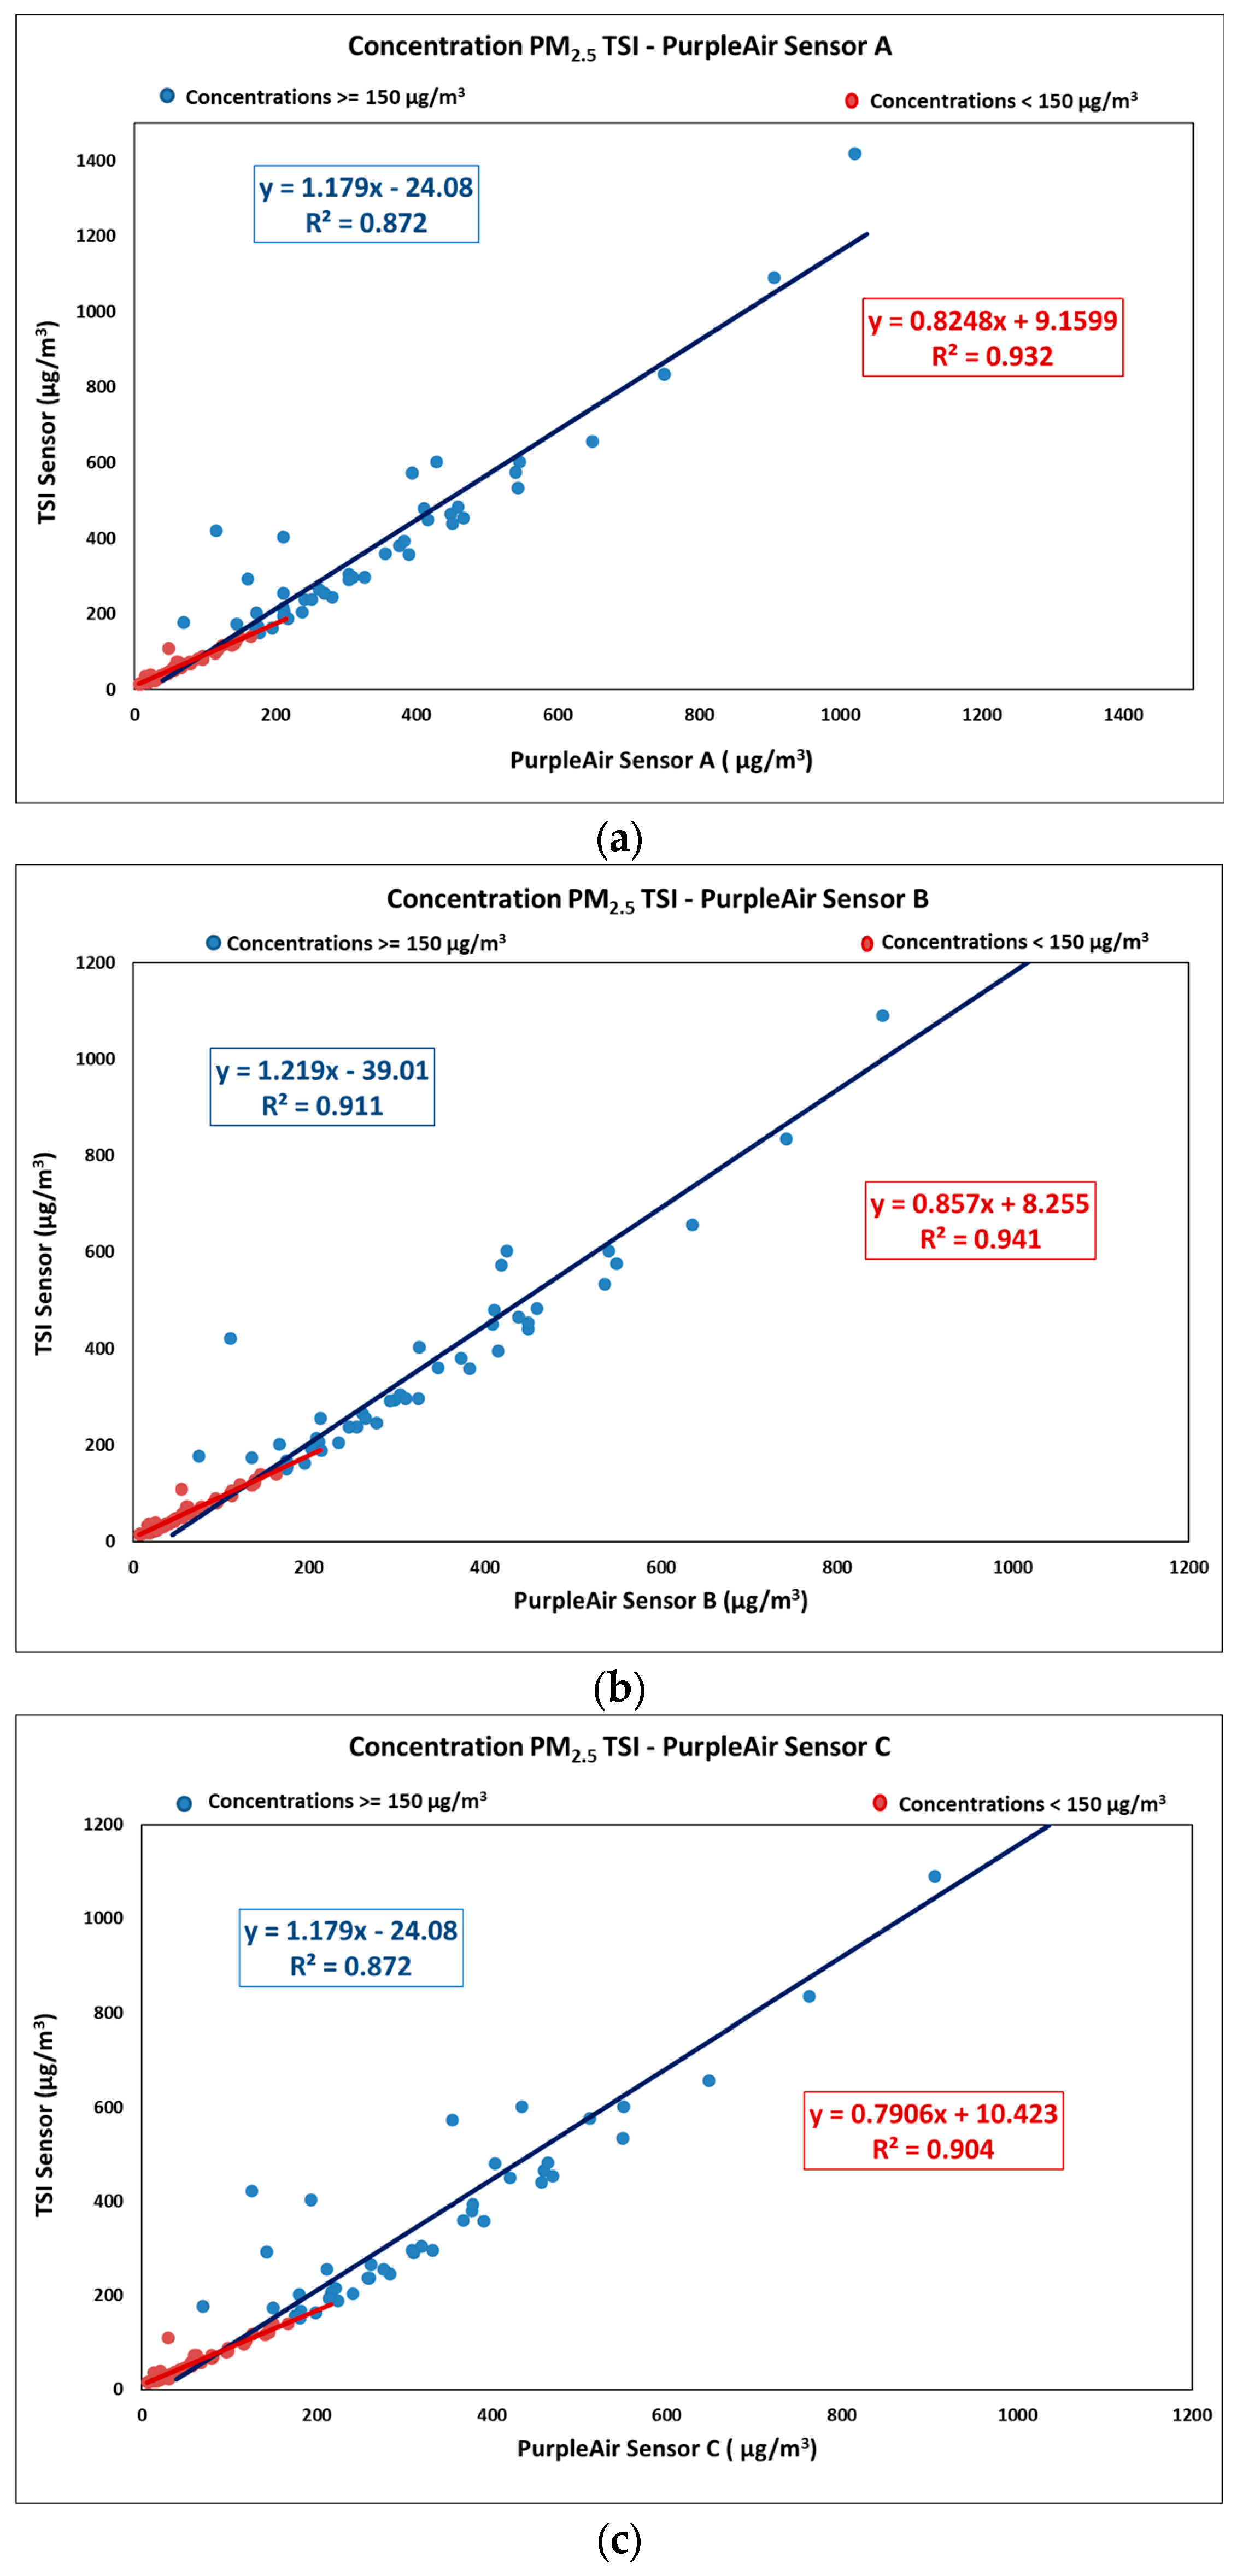
Before the experimental procedure, the Purple Air sensors (A, B, and C) were calibrated for PM2.5 concentrations (Figure 2). The TSI DustTrak 8530, known for its high precision and real-time monitoring capabilities, was used as the reference instrument during calibration.
The calibration procedure under scrutiny demonstrates and confirms [9] a high correlation between the low-cost Purple Air sensors (A, B, C) and the TSI DustTrak 8530 sensor (TSI Incorporated, Shoreview, MN, USA) reference instrument with regard to both concentrations exceeding 150 µg/m3 and concentrations falling below this threshold.

3.1. The Data Collection

The data was collected from the three sensors mounted onto the bag filter retention unit and involved recording of the PM2.5 variation data at a time step of two minutes, with the variation in the airflow rates being the variable of interest. The data underwent processing using the software platform Microsoft® Excel.

3.2. Scenario Analysis

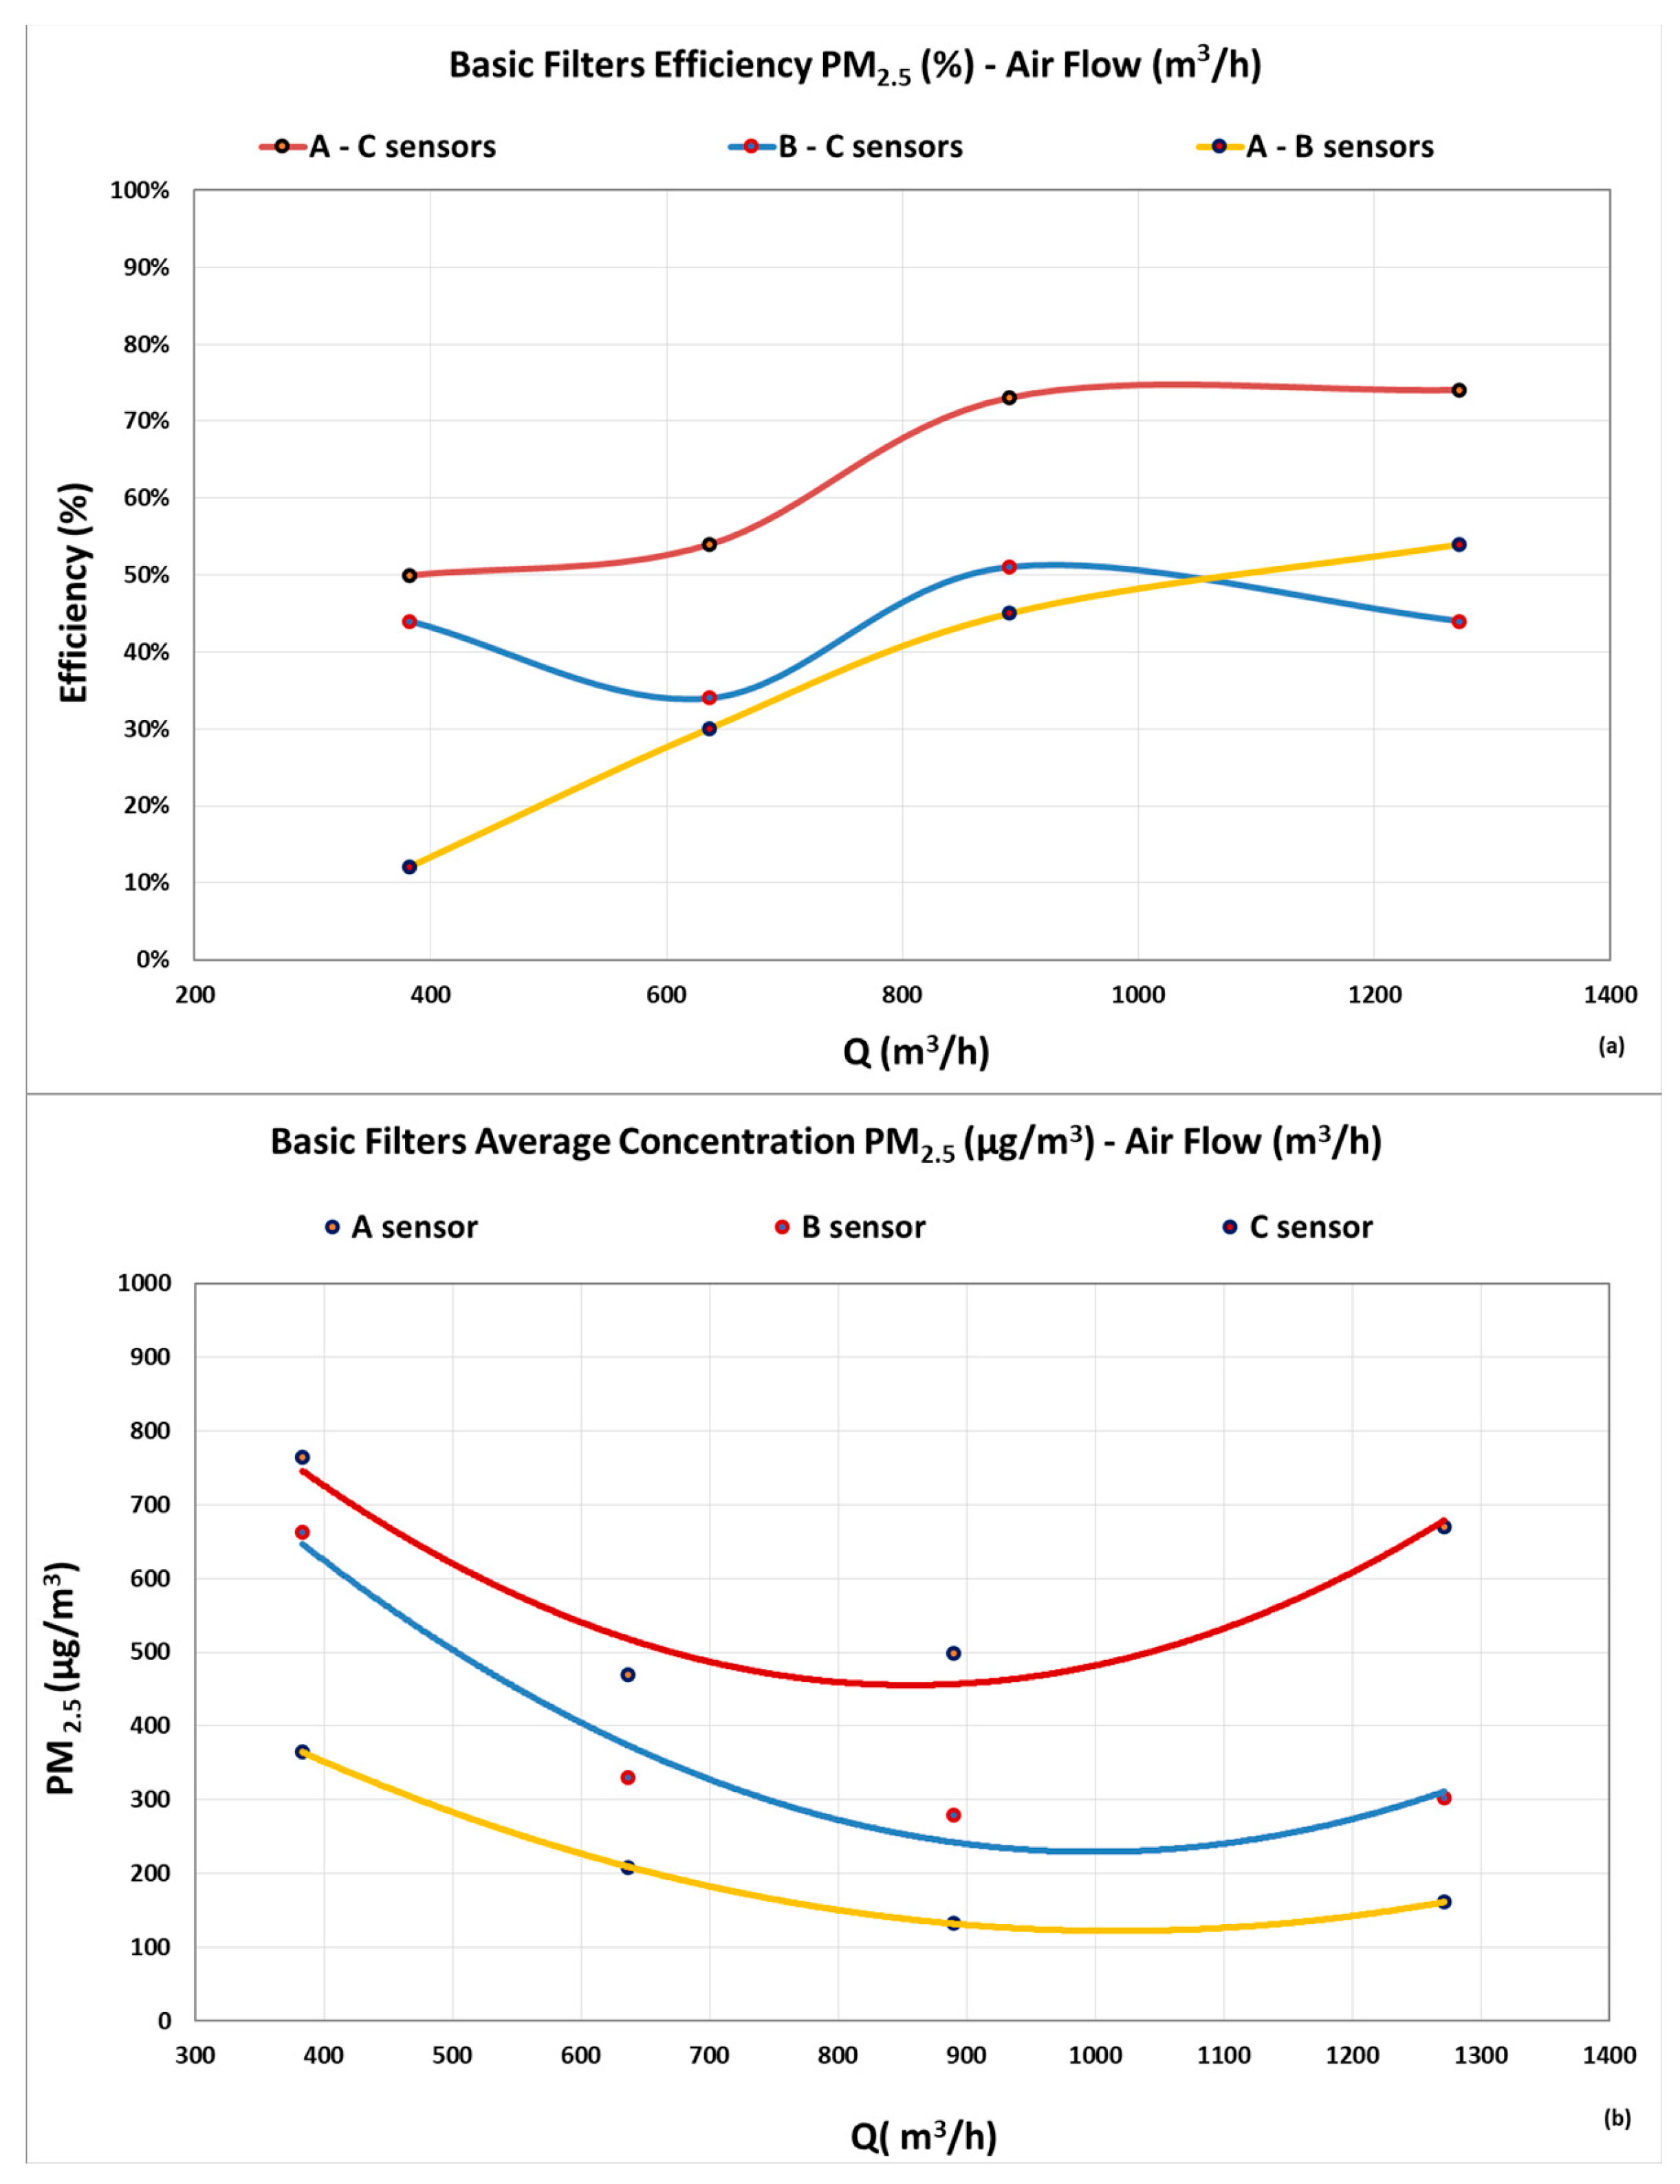
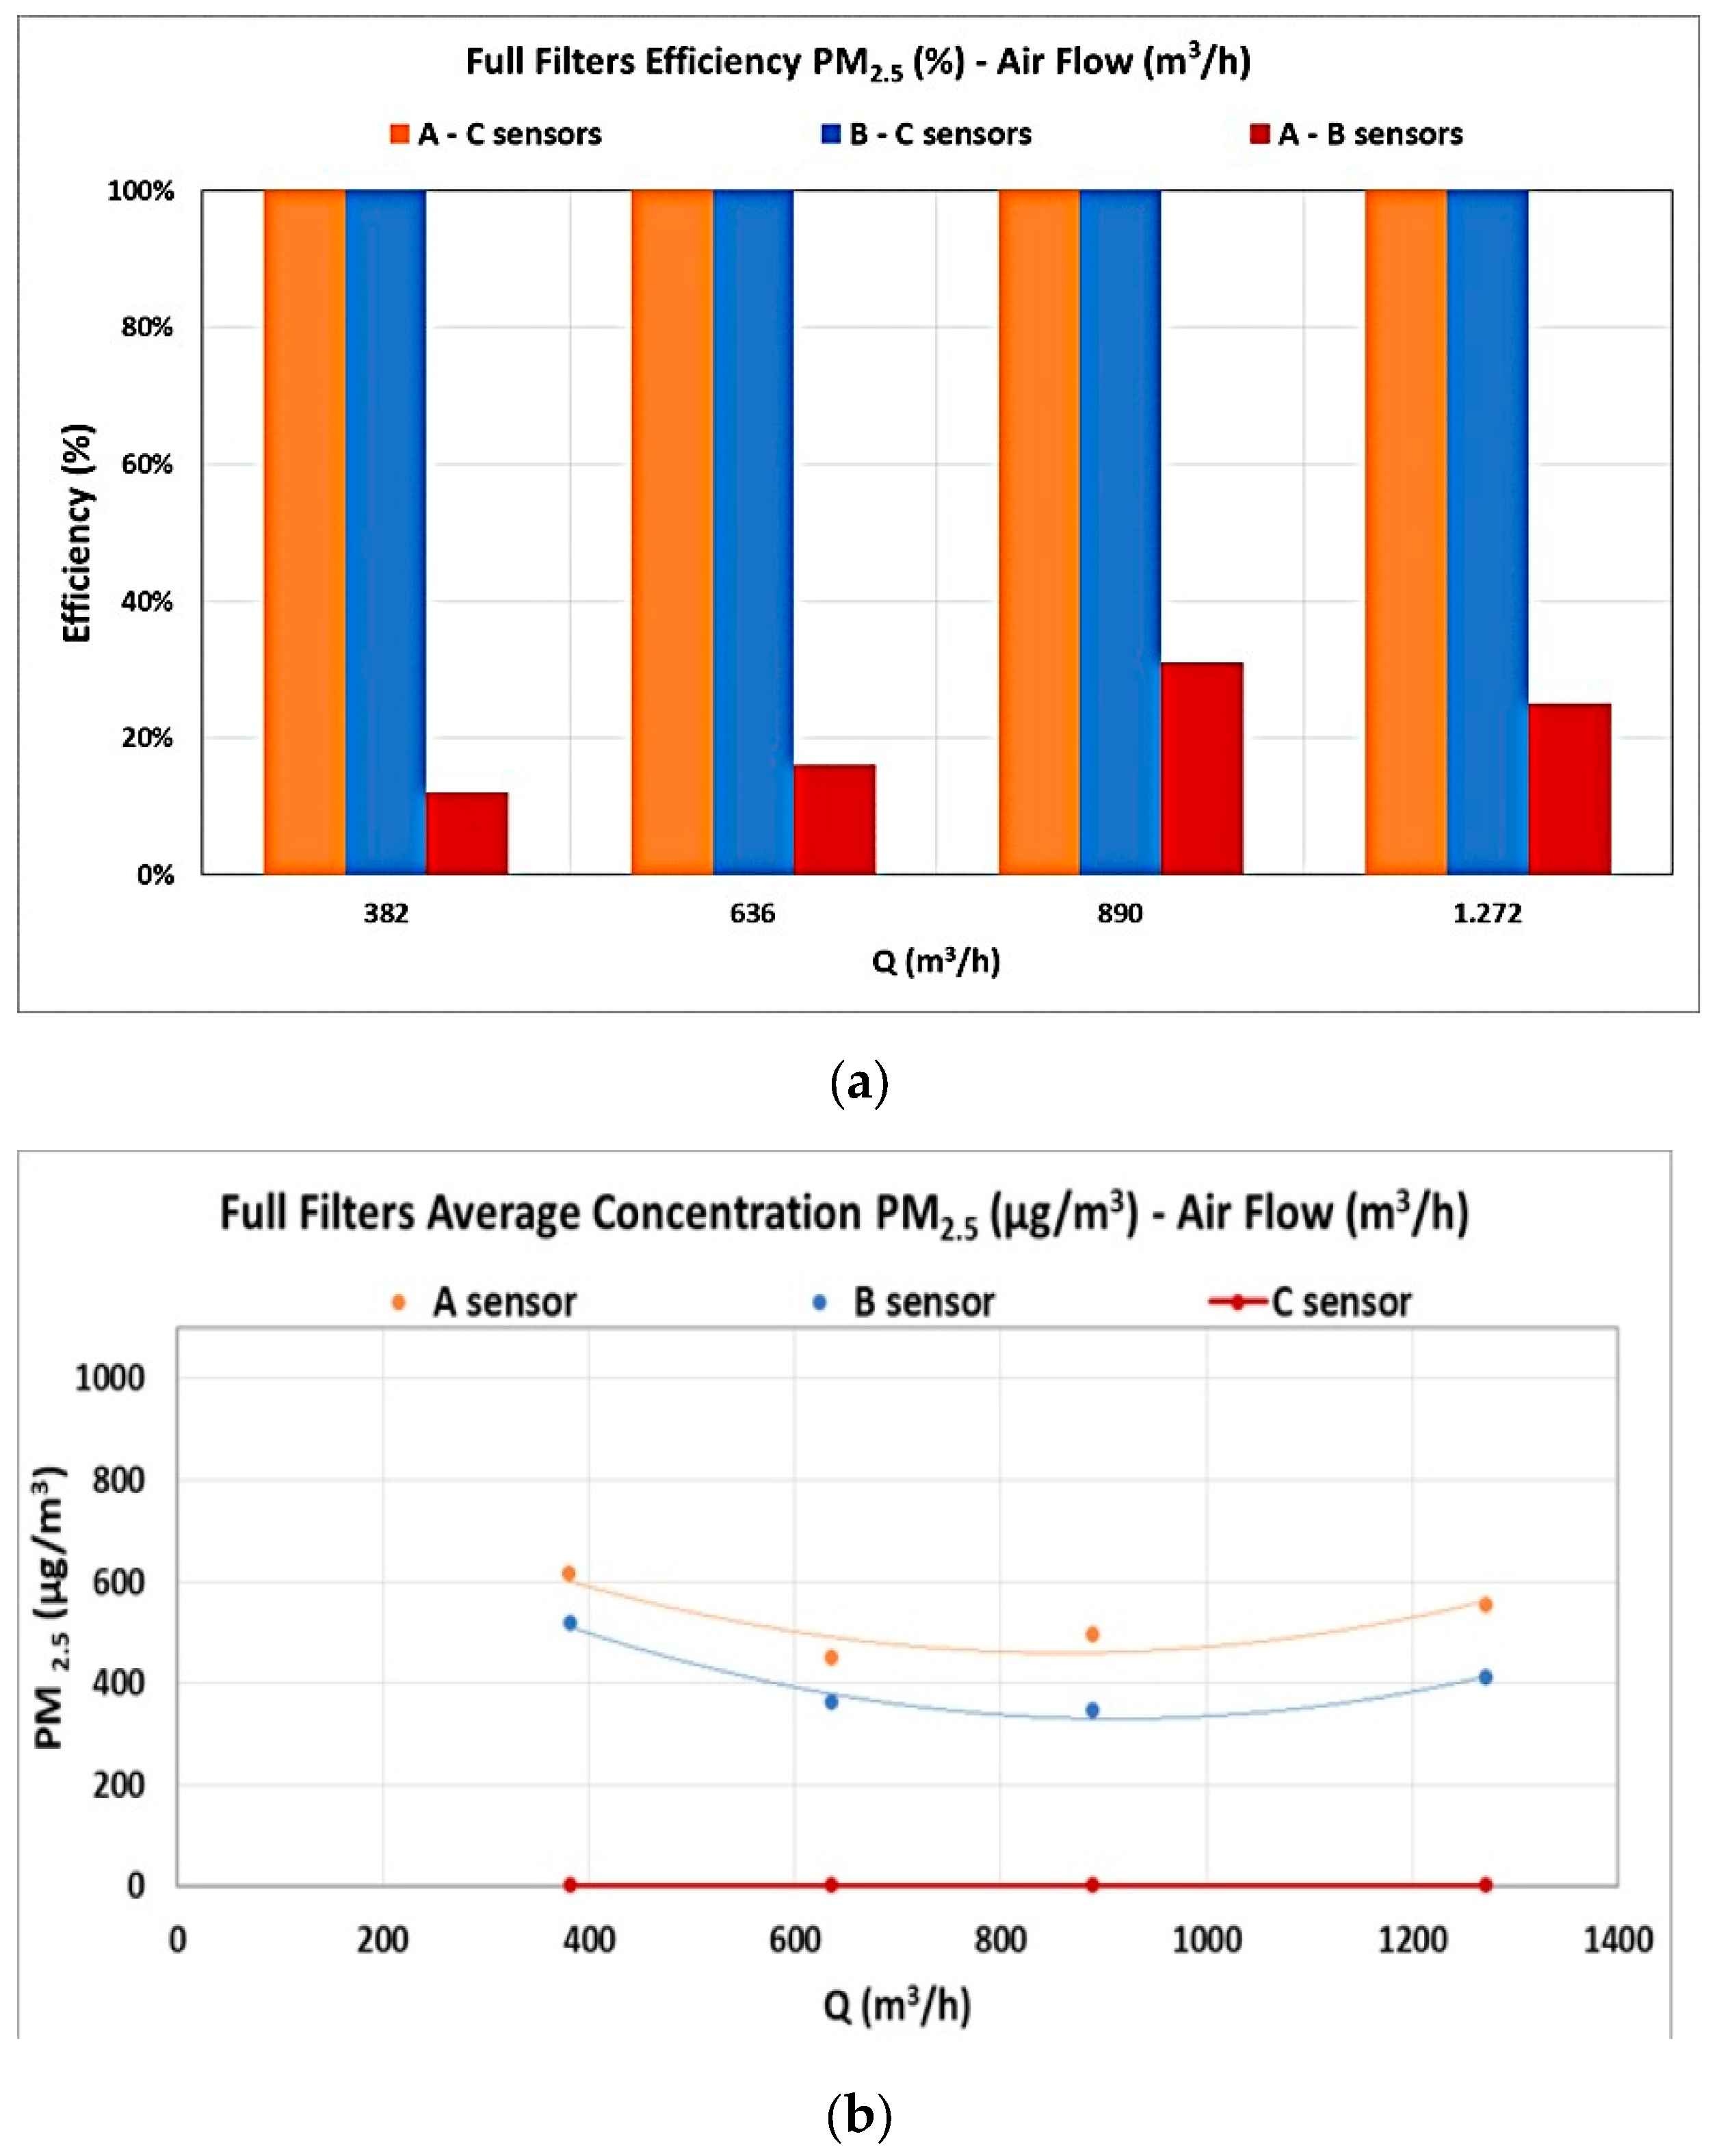
During the experimental procedure, two scenarios were carried out within the filtration unit. In scenario (A), the variation in PM2.5 particles at different airflows was examined with the basic filters (G2 and FCC) installed. In scenario (B), the variation in PM2.5 particles at different air flows was investigated with all five filtration stages incorporated. In both cases, two coil-type insect repellents were used as the combustion sources, which were selected on the basis of their wide commercial availability and relevance to real-world emission studies [10].

4. Results

The findings from the implementation of the two scenarios (A, B) (Figure 3 and Figure 4) illustrated the significance of the bag filter unit and the stages of filtration to various indoor air flows from potential PM2.5 emissions observed in domestic and workplaces.
Scenario (A) showed that the performance of the filter unit using only the fixed filters (G2 and FCC) is higher at high air flows [11] and between the inlet and outlet sensors (A–C), with an efficiency of over 73%, while the corresponding average concentrations show lower values at the outlet (sensor C), confirming that the use of even only the fixed filters reduces emissions.
In scenario (B), the performance of the filtering unit is demonstrated through the utilization of all available filters, the (G2) grease filter, a (G4) pre-filter, the (F8) and (H10) high-efficiency bag filters, and the FCC-AC, thereby exhibiting a 100% performance across all airflow variations between sensors (A–C). In accordance with the aforementioned data, the mean variation in PM2.5 is recorded as zero at output sensor element (C), thereby confirming the high efficiency of the filters employed in the stages of filtering (3–4) in the bag filter unit [8].

5. Conclusions

The necessity for indoor air filtration is now irrefutable and increasing, as it constitutes a fundamental prerequisite for safeguarding public health [12]. The present study has demonstrated the necessity of this approach by means of an analysis of the PM2.5 emissions under varying air conditions and filtration stages. Furthermore, it has also captured the importance of standards as a means to select the most appropriate filter to meet the requirement to improve indoor air quality.

Author Contributions

Conceptualization: K.M. and C.T.; methodology: C.T., A.L., K.M. and K.N.; formal analysis: C.T., K.M. and A.L.; investigation: C.T., K.M., A.L. and K.N.; data curation: C.T.; writing—original draft preparation: C.T., K.M. and A.L.; visualization: C.T., K.M. and K.N.; supervision: C.T. and K.M. All authors have read and agreed to the published version of the manuscript.

Funding

This research was funded by the University of West Attica grant number P.A.D.A.—NO.PROT: 69382—23/07/2025 Egaleo.

Institutional Review Board Statement

Not applicable.

Informed Consent Statement

Not applicable.

Data Availability Statement

The data presented in this study are available on request from the corresponding author. The data are not publicly available due to restrictions regarding privacy.

Conflicts of Interest

The authors declare no conflicts of interest.

References

  1. World Health Organization WHO. Air Pollution. 2019. Available online: https://www.who.int/health-topics/air-pollution#tab=tab_1 (accessed on 15 December 2024).
  2. Department of Health. Particle Pollution and Health. 2024. Available online: https://www.health.ny.gov/environmental/indoors/air/pmq_a.htm (accessed on 5 January 2025).
  3. EPA (United States Environmental Protection Agency). Health and Environmental Effects of Particulate Matter (PM). 2024. Available online: https://www.epa.gov/pm-pollution/health-and-environmental-effects-particulate-matter-pm (accessed on 5 January 2025).
  4. United States Environmental Protection Agency. What Is a MERV Rating? 2024. Available online: https://www.epa.gov/indoor-air-quality-iaq/what-merv-rating (accessed on 12 January 2025).
  5. ISO. ISO 16890-1:2016. 2016. Available online: https://www.iso.org/standard/57864.html (accessed on 12 January 2025).
  6. EMW filtertechnik. ISO 16890 Replaces EN 779. 2018. Available online: https://www.emw.de/en/filter-campus/iso-16890-replaces-en-779.html (accessed on 12 January 2025).
  7. Laios, A. Development of Experimental—Laboratory Exercises Using the Unit of Baghouses Filters Belonging to the Air Pollution Laboratory. 2025. Available online: https://polynoe.lib.uniwa.gr/xmlui/handle/11400/8452 (accessed on 15 April 2025).
  8. Kaffe, S.A. Active Carbon Removal System. 2017. Available online: https://www.kaffe.gr/product/1148/poiotita-aera-filtra-aera-tima-aposmisis-energoy-anthraka- (accessed on 18 March 2025).
  9. Seongjun, P.; Shinhye, L.; Myoungsouk, Y.; Donghyun, R. Field and laboratory evaluation of PurpleAir low-cost aerosol sensors in monitoring indoor airborne particles. Build. Environ. 2023, 234, 110127. [Google Scholar] [CrossRef]
  10. Lee, S.C.; Wang, B. Characteristics of emissions of air pollutants from mosquito coils and candles burning in a large environmental chamber. Atmos. Environ. 2006, 40, 2128–2138. [Google Scholar] [CrossRef]
  11. Ki-Joon, J.; Yong-Won, J. A simulation study on the compression behavior of dust cakes. Powder Technol. 2004, 141, 1–11. [Google Scholar] [CrossRef]
  12. Elsaid, A.M.; Mohamed, H.A.; Abdelaziz, G.B.; Ahmed, M.S. A critical review of heating, ventilation, and air conditioning (HVAC) systems within the context of a global SARS-CoV-2 epidemic. Process Saf. Environ. Prot. 2021, 155, 230–261. [Google Scholar] [CrossRef] [PubMed] [PubMed Central]
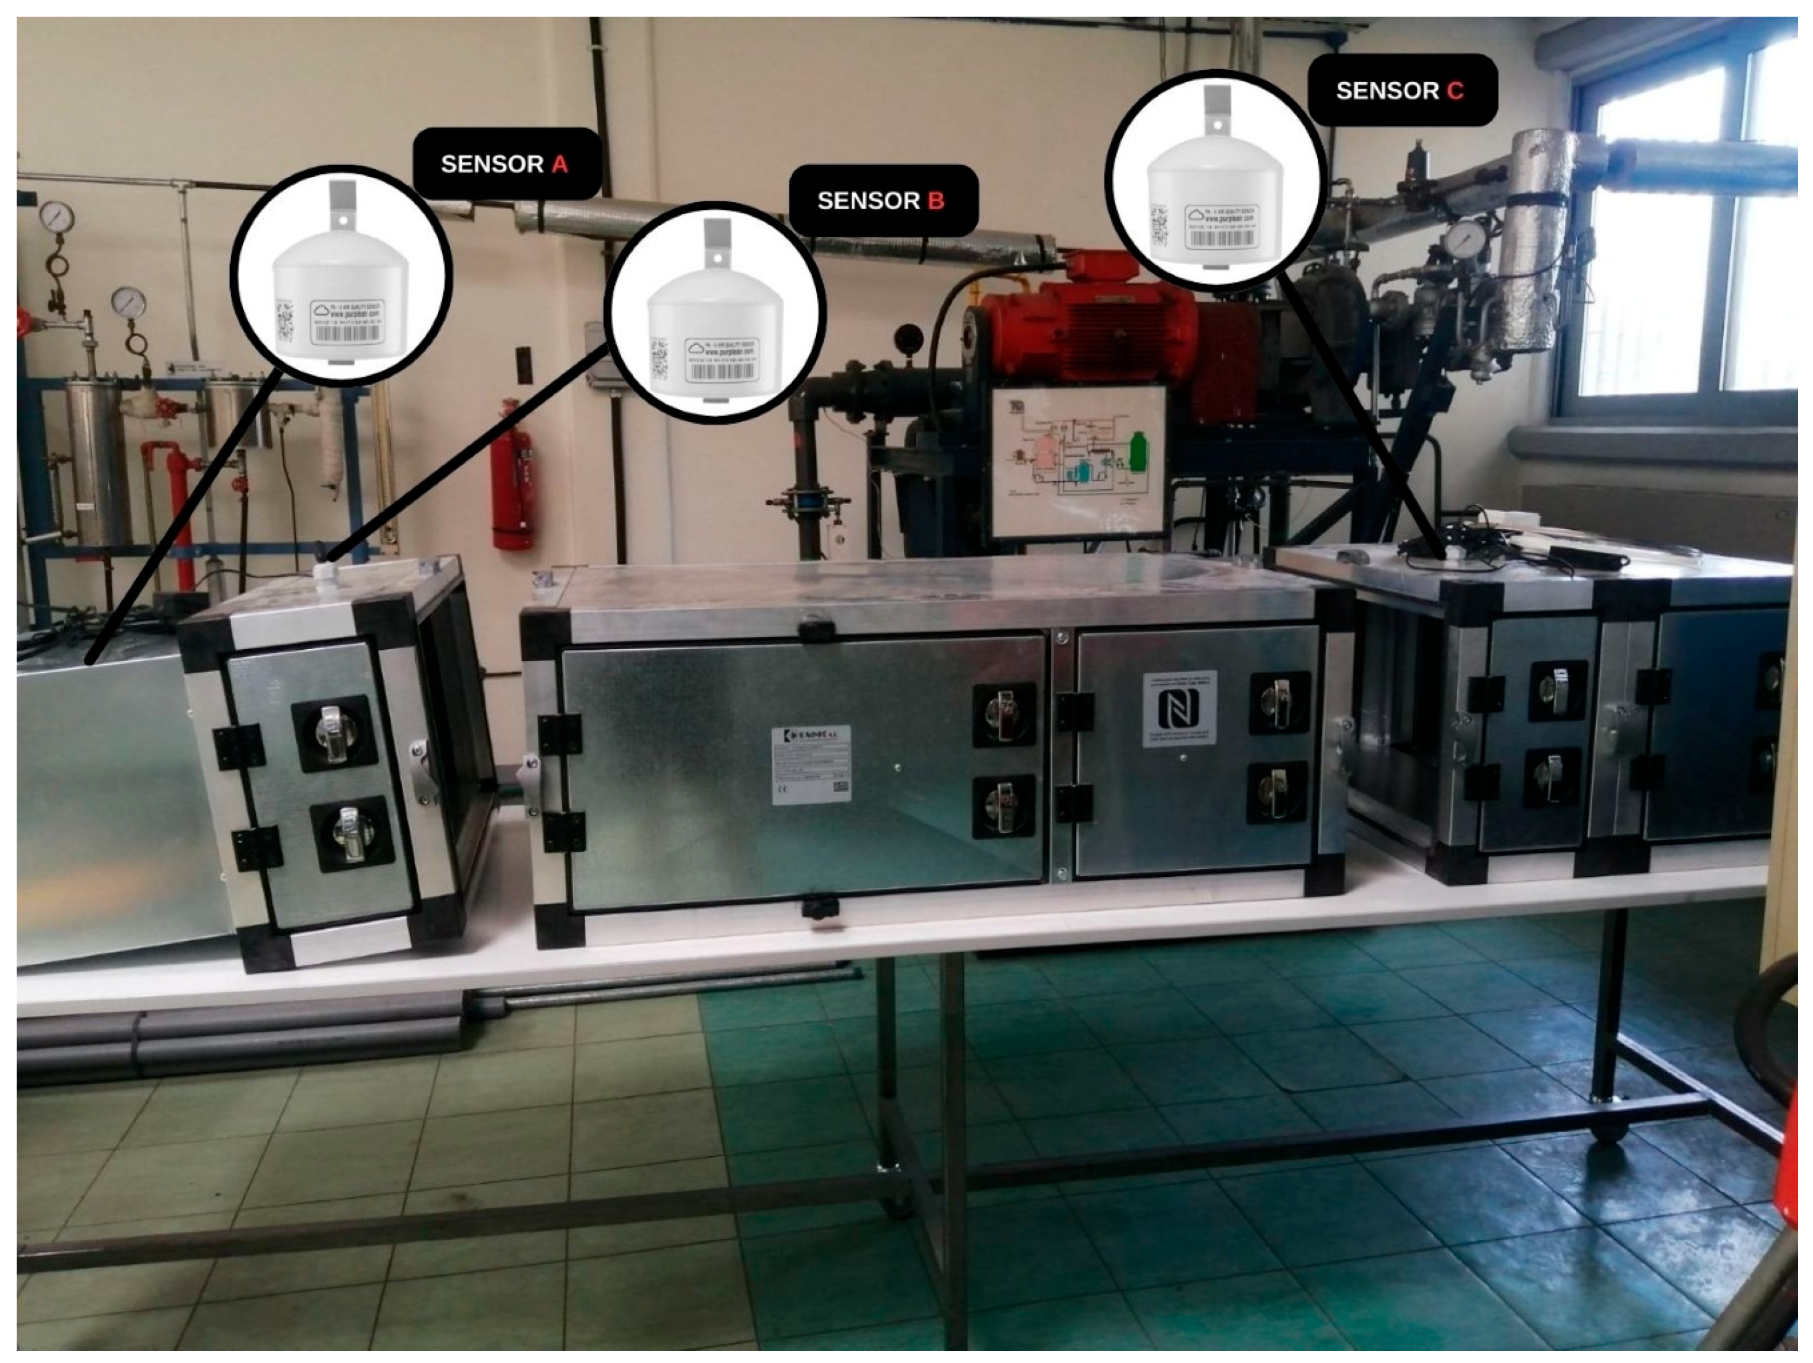
Figure 1. Bag filter retention unit [8].
Eesp 35 00040 g001
Figure 2. Purple Air Sensors vs. TSI DustTrak 8530 sensor calibration: Sensor A inlet (a), Sensor B intermediate (b), and Sensor C outlet (c).
Eesp 35 00040 g002
Figure 3. Scenario (A): basic filter efficiency (a) and average concentration (b).
Eesp 35 00040 g003
Figure 4. Scenario (B): filter efficiency (a) and average concentration (b).
Eesp 35 00040 g004
Disclaimer/Publisher’s Note: The statements, opinions and data contained in all publications are solely those of the individual author(s) and contributor(s) and not of MDPI and/or the editor(s). MDPI and/or the editor(s) disclaim responsibility for any injury to people or property resulting from any ideas, methods, instructions or products referred to in the content.