Proceeding Paper

AtmoHub: A National Atmospheric Composition Hub for Air Quality Monitoring and Forecasting in Greece †

1
Institute for Astronomy, Astrophysics, Space Applications and Remote Sensing (IAASARS), National Observatory of Athens, 10560 Athens, Greece
2
Department of Meteorology and Climatology, School of Geology, Faculty of Sciences, Aristotle University Thessaloniki, 54124 Thessaloniki, Greece
*
Author to whom correspondence should be addressed.
Presented at the 17th International Conference on Meteorology, Climatology, and Atmospheric Physics—COMECAP 2025, Nicosia, Cyprus, 29 September–1 October 2025.
Environ. Earth Sci. Proc. 2025, 35(1), 36; https://doi.org/10.3390/eesp2025035036
Published: 18 September 2025

Abstract

AtmoHub, the Greek Copernicus National Collaboration Programme (NCP) gateway, delivers daily air quality forecasts aligned with the EC Air Quality Directives and provides in situ measurements for key pollutants (NO2, O3, PM10, PM2.5, SO2), as well as insights into environmental phenomena such as pollen dispersion, smoke, volcanic activity, and dust transport. To address a previous lack of coordinated atmospheric services in Greece, it utilizes the WRF-Chem model for downscaling CAMS data. Offering hourly forecasts at 5 km resolution, AtmoHub supports researchers, authorities, and the public, promoting climate resilience and informed air quality management through a centralized, accessible platform.

1. Introduction

Greece is a climate change hotspot in the Mediterranean, frequently experiencing episodes of degraded air quality, particularly in its densely populated urban centres such as Athens and Thessaloniki. These areas face persistent air pollution problems with significant implications for public health, as highlighted by recent European Environment Agency [1] reports. In fact, over 90% of Greece’s urban population has been exposed to pollutant concentrations, especially PM10 NO2, and O3 that exceed European Union guidelines, leading to thousands of premature deaths annually.
The country’s unique geographical position exacerbates the issue, placing it at the intersection of transboundary pollution pathways that transport dust from North Africa and the Middle East [2,3], smoke from wildfires [4] and agricultural biomass burning, marine aerosols, and anthropogenic emissions from regional megacities [5,6]. Despite the clear need for responsive mitigation strategies, Greece has historically lacked a national, high-resolution air quality forecasting system that can support public health protection, regulatory compliance, and scenario-based environmental planning.
To address these challenges, the Copernicus Atmosphere Monitoring Service (CAMS) National Collaboration Programme (NCP) for Greece has established AtmoHub (https://atmohub.space.noa.gr/), a centralized web-based platform that enhances the accessibility and resolution of air quality data and forecasts. While CAMS already delivers valuable atmospheric products at the European scale, their relatively coarse resolution (10 × 10 km) limits practical usability for local decision-making in Greece’s varied terrain. AtmoHub closes this gap by providing daily air quality forecasts downscaled to a spatial resolution of 5 km (targeting 2 km), utilizing the WRF-Chem model and integrating real-time in situ observations.
Beyond improving spatial resolution, AtmoHub offers a reliable and publicly accessible interface for visualizing forecast data, comparing model outputs with live observations, and archiving information for long-term analysis. It serves as a powerful tool for researchers, regional authorities, and the public to monitor pollution trends, evaluate model performance, and support evidence-based policies for cleaner air and climate resilience. This paper presents an overview of the AtmoHub platform, its technical architecture, and the methodologies underpinning its downscaling and monitoring activities.

2. Methodology

AtmoHub’s web portal (https://portal.atmohub.gr/) hosts the results of both the downscaling and monitoring activities. Forecasts, along with continuous comparison results against CAMS regional data, are available in real time through an interactive online map featuring a 5 × 5 km resolution overlay. This interface enables users to explore key atmospheric variables and related statistics across the forecasting horizon. The following subsections describe the components of the numerical modelling system (Section 2.1), the monitoring (Section 2.2) and validation framework (Section 2.3).

2.1. Air Quality Numerical Modelling Service

The AtmoHub’s Air Quality Numerical Modelling System employs the WRF-Chem (v4.5.1) model [7,8] (here referred to as WRF-AtmoHub), a couple of weather prediction and air quality simulation tool which can simulate the release and transport of chemical constituents and their interactions, along with prediction of O3, UV radiation and particulate matter (PM). The Weather Research and Forecasting (WRF) Model is a next-generation mesoscale numerical weather prediction system designed for both atmospheric research and operational forecasting applications. It features two dynamical cores, a data assimilation system, and software architecture supporting parallel computation and system extensibility. The model serves a wide range of meteorological applications across scales from tens of metres to thousands of kilometres.
The domain configuration (Figure 1) is consisted of two telescoping nests (one-way), which cover an extended region of Middle and East Mediterranean (d01) and a wider area of Greece (d02). The horizontal discretization has been changed to 15 × 15 km (from 10 × 10 km) and 5 × 5 km (from 2 × 2 km) for the parent and the inner domain, respectively.
The model is driven by two different Global Circulation Models (GCMs). Regarding the meteorological fields, the initial and boundary conditions are obtained from the 12 UTC prognostic cycle of the NCEP/GFS (National Centers for Environmental Prediction/Global Forecast System) operational analysis and 3-hourly forecasts (0.25° × 0.25°) through the NCEP server. Regarding the atmospheric composition (chemistry), this information is inserted into the model from the CAMS global atmospheric composition forecasts (12 UTC prognostic cycle, 0.40° × 0.40°). The chemical species are retrieved through the Atmosphere Data Store (ADS). Moreover, a boundary nudging of five grid points is applied in the parent domain (d01). The anthropogenic emissions for the model are based on the Emissions Database for Global Atmospheric Research—Hemispheric Transport of Air Pollution (EDGAR-HTAP) global emission inventory [9], while the information about the biogenic emissions is retrieved from the MEGAN (Model of Emissions of Gases and Aerosols from Nature) modelling framework [10].
For the land use representation, the updated modified IGBP MODIS database (21 categories) were inserted into the model, while the elevation was obtained from the GMTED2010 database with 30-arc-second resolution (~900 m).
Regarding the physics suite, the parameterization of microphysical processes is based on the Morrison double-moment scheme [11], which includes ice, snow and graupel in its calculations and is recommended for cloud-resolving simulations. Also, the RRTMG scheme [12] is used, at 15 min intervals, for the shortwave and longwave radiation, with the slope effects option active in the inner domain (d02). Boundary layer processes are represented by the diagnostic non-local Yonsei University Scheme (YSU) [13], surface layer by the Revised MM5 Scheme [14] and land-atmosphere interactions by the Noah Land Surface Model. The parameterization of sub-grid convection is performed by the Grell–Freitas Ensemble Scheme [15] in both domains, where the sub-grid cloud effects to the optical depth of radiation are also considered.
The treatment of the simulated chemical mechanisms and aerosols by the model is defined by the GOCART aerosol scheme coupled with RACM-KPP chemistry.
Additional tuning regarding the WRF dynamics and numerics are foreseen in order to avoid numerical instabilities over the complex terrain in the area of interest (d02) and obtain robust results.

Species Mapping

Due to the use of the RACM-KPP chemical mechanism and GOCART aerosol scheme, species from CAMS global forecasts require mapping to WRF-AtmoHub formats. Dust data from three CAMS bins are converted into five WRF bins (0.1–10.0 µm). Sea salt, modelled in CAMS using a bi-modal log-normal distribution, is mapped from three to four WRF bins (0.1–10.0 µm). Additionally, CAMS gas-phase species (e.g., NO2, O3, and SO2) provided as mass mixing ratios (kg/kg), are converted to volume mixing ratios (ppmv) for compatibility with WRF-Chem.

2.2. Monitoring to In Situ Network

The Monitoring to In Situ Network activity has two primary objectives: (1) to quantify the agreement between CAMS regional model forecasts and in situ or remote sensing observations, and (2) to assess the observational conditions under which this comparison is valid. To support these goals, a comprehensive monitoring system has been implemented in the AtmoHub web portal, integrating data and methodologies from various sources, including the AIRBASE database. This framework enhances the accuracy, reliability, and robustness of the air quality forecasts and supports effective validation of model outputs.

AIRBASE Stations Integration

The AIRBASE European air quality dataset provides hourly average measurements of key pollutants (PM10, PM2.5, NO2, O3, and SO2) from 17 monitoring stations across Greece.
To streamline data integration, AtmoHub includes automated procedures for comparing AIRBASE observations with CAMS European forecasts at a 10 × 10 km resolution. Using the AIRBASE API, the system stores hourly measurements in a database and automatically compares them with CAMS outputs, ensuring continuous monitoring and high data integrity. Real-time feedback is also provided to station principal investigators (PIs), enabling prompt action in the event of data quality issues.

2.3. CAMS Forecast Data Assessment

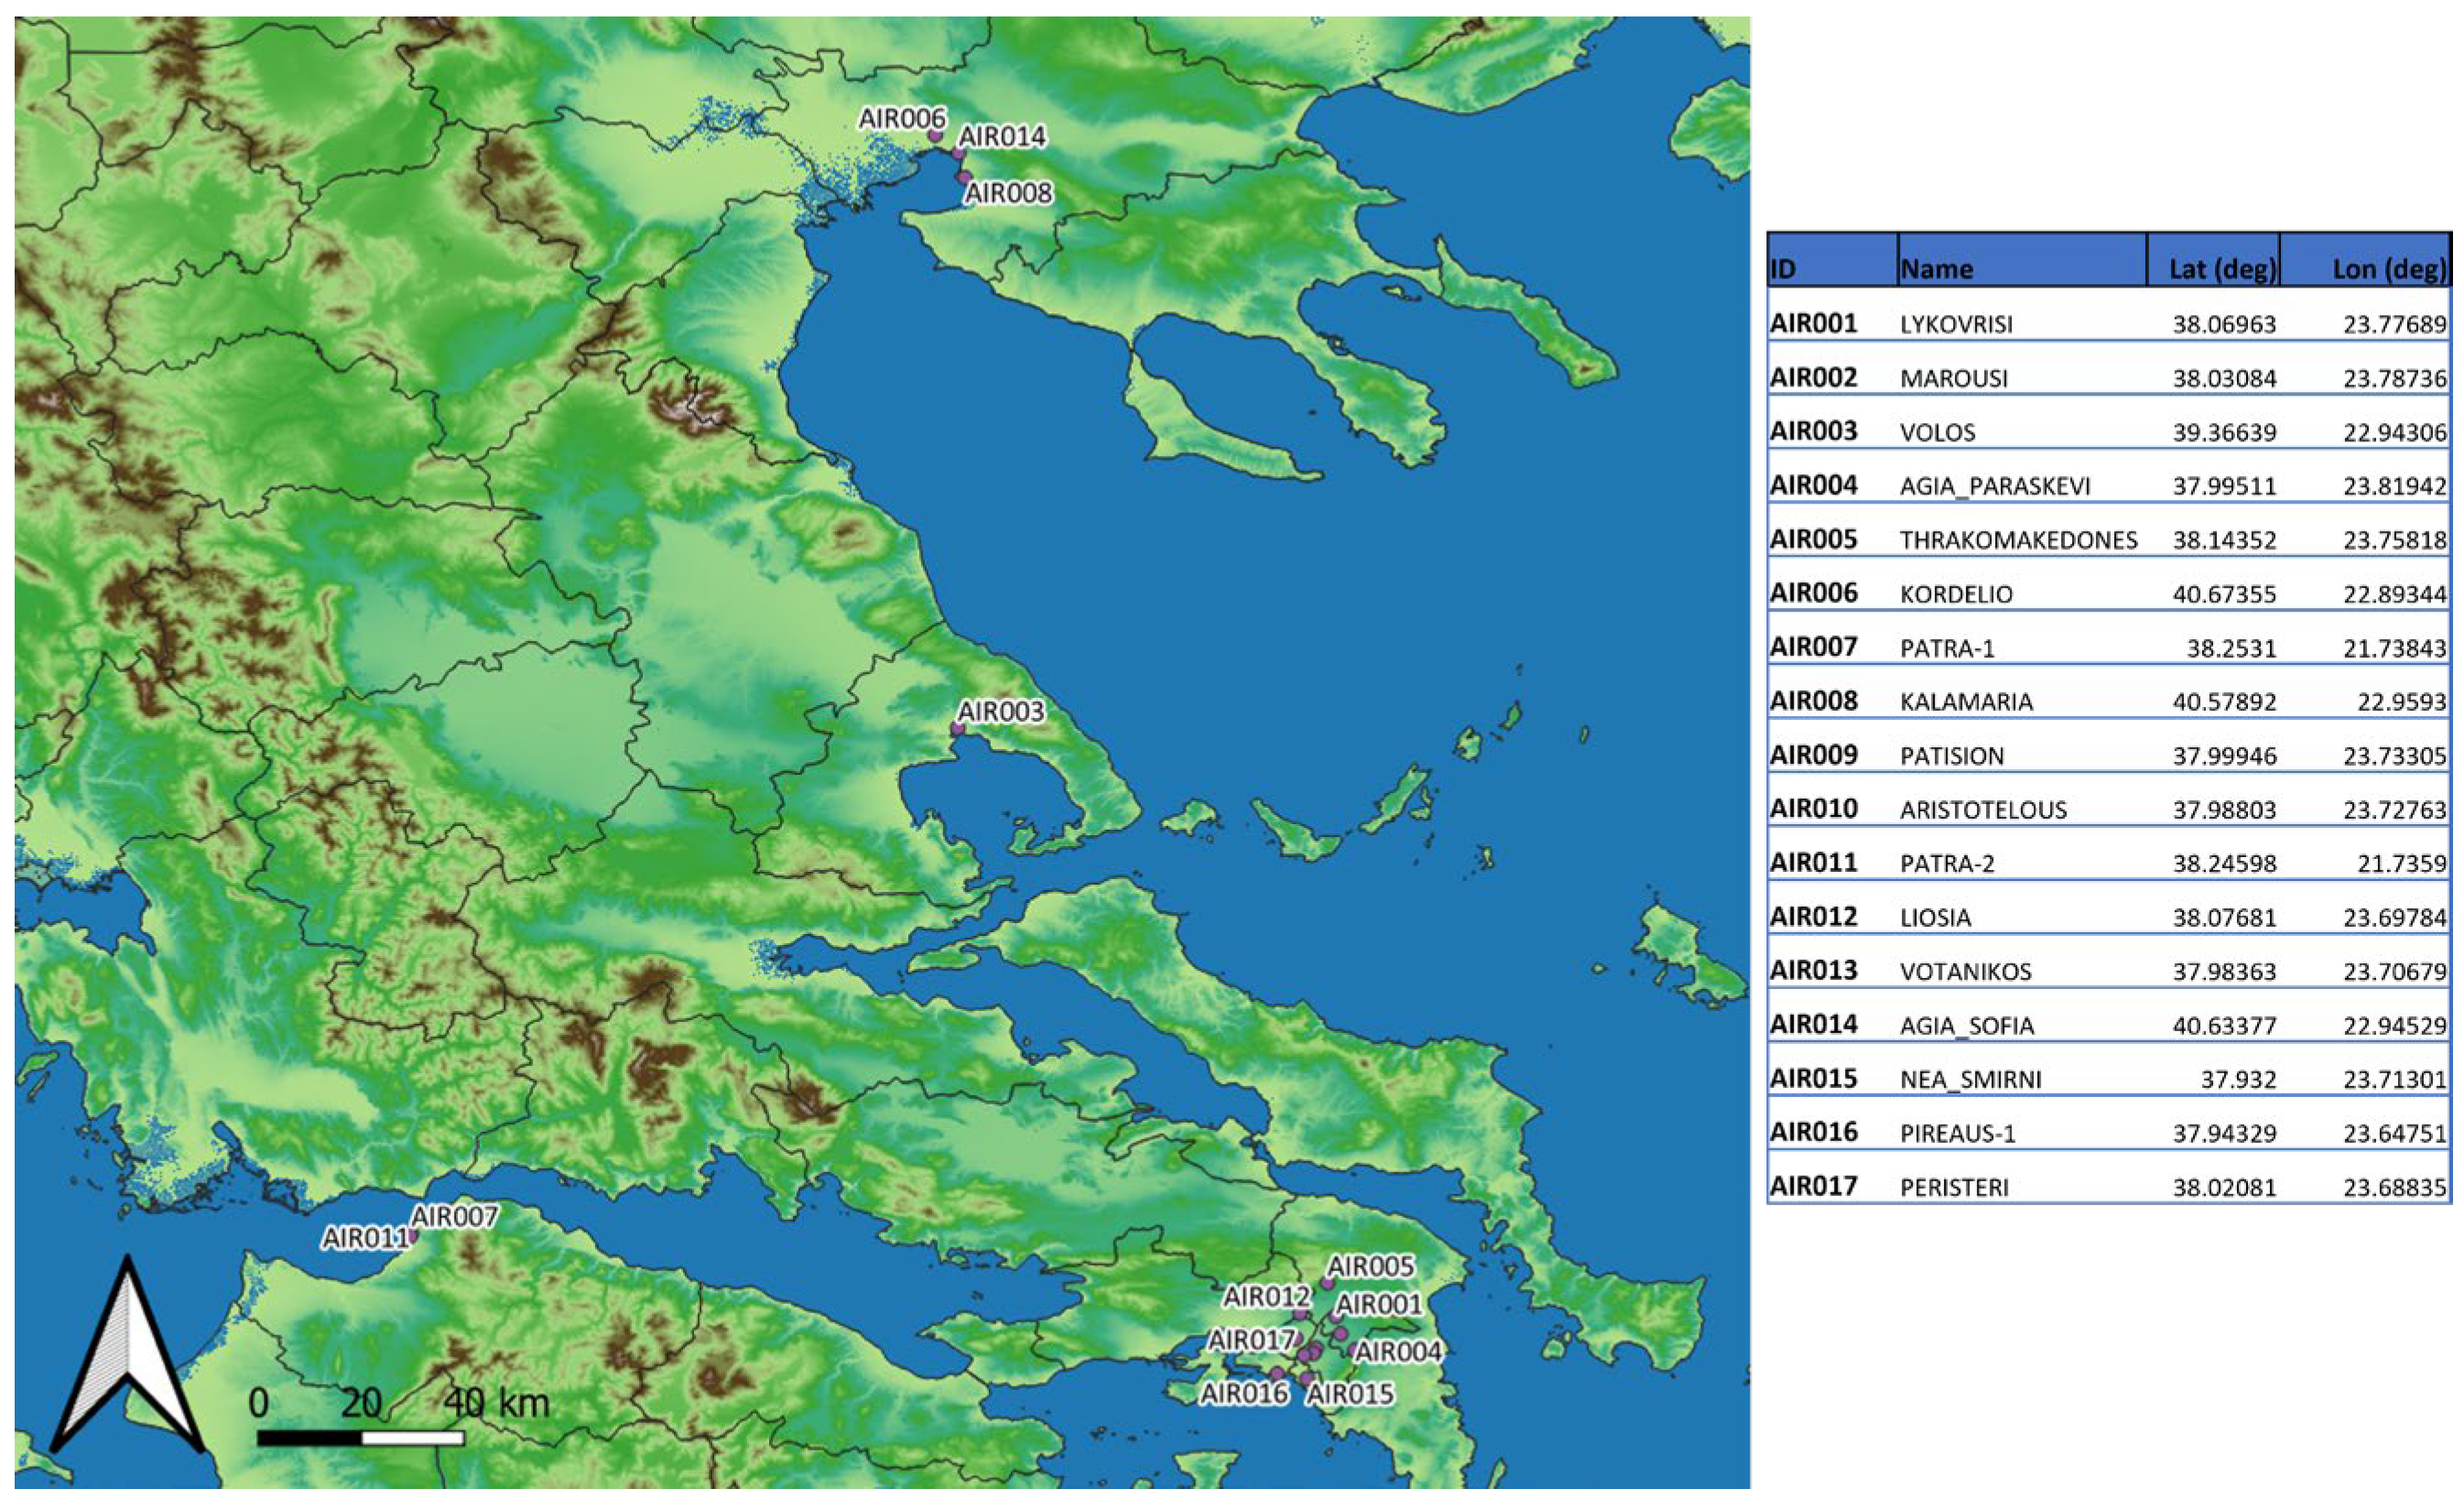
The evaluation of the WRF-AtmoHub modelling system and its downscaled air quality forecasts was conducted using surface observations of O3, NO2, SO2, PM2.5, and PM10 concentrations (μg/m3) from the AirBase European air quality database, maintained by the European Environment Agency (EEA). Seventeen AirBase monitoring stations across Greece (Figure 2) were included in the analysis, covering the period from 5 September 2024 to 14 January 2025.
WRF-AtmoHub forecasts and CAMS European regional forecasts (ensemble mean) were compared against AirBase observations from the 17 stations for the same period (Section 3.1). The assessment employed standard statistical metrics, including Mean Error (ME) and Root Mean Squared Error (RMSE), for two forecast windows: day 1 (T + 12 h–T + 36 h) and day 2 (T + 36 h–T + 60 h) (Table 1). The first 12 h after model initialization were treated as a spin-up period and excluded from the analysis.
On the other hand, for the validation of the AtmoHub monitoring-to-in situ network component (Section 3.2) against CAMS European regional data (analysis and forecasts), the same set of AirBase observations and evaluation period were utilized. A detailed statistical analysis was conducted to quantify differences between CAMS and observational data (from AirBase), providing a comprehensive assessment of CAMS model performance for key pollutants. Comparing these CAMS model outputs with in situ measurements from the AirBase network offers a robust method to assess the accuracy and reliability of CAMS forecasts while identifying any systematic discrepancies.

3. Results

3.1. Comparison of WRF-AtmoHub and CAMS Forecast Data Against AirBase Observations

The performance of the WRF-AtmoHub downscaled forecasts and the CAMS regional ensemble forecasts was evaluated against surface-level air quality observations obtained from 17 AirBase monitoring stations distributed across Greece. The assessment focused on five key pollutants: nitrogen dioxide (NO2), sulphur dioxide (SO2), ozone (O3), and particulate matter (PM10 and PM2.5). Evaluation metrics included the Mean Error (ME) and Root Mean Squared Error (RMSE) over two forecast windows: Day 1 (T + 12 h to T + 36 h) and Day 2 (T + 36 h to T + 60 h). The initial 12 h period post-initialization was excluded as a model spin-up phase.
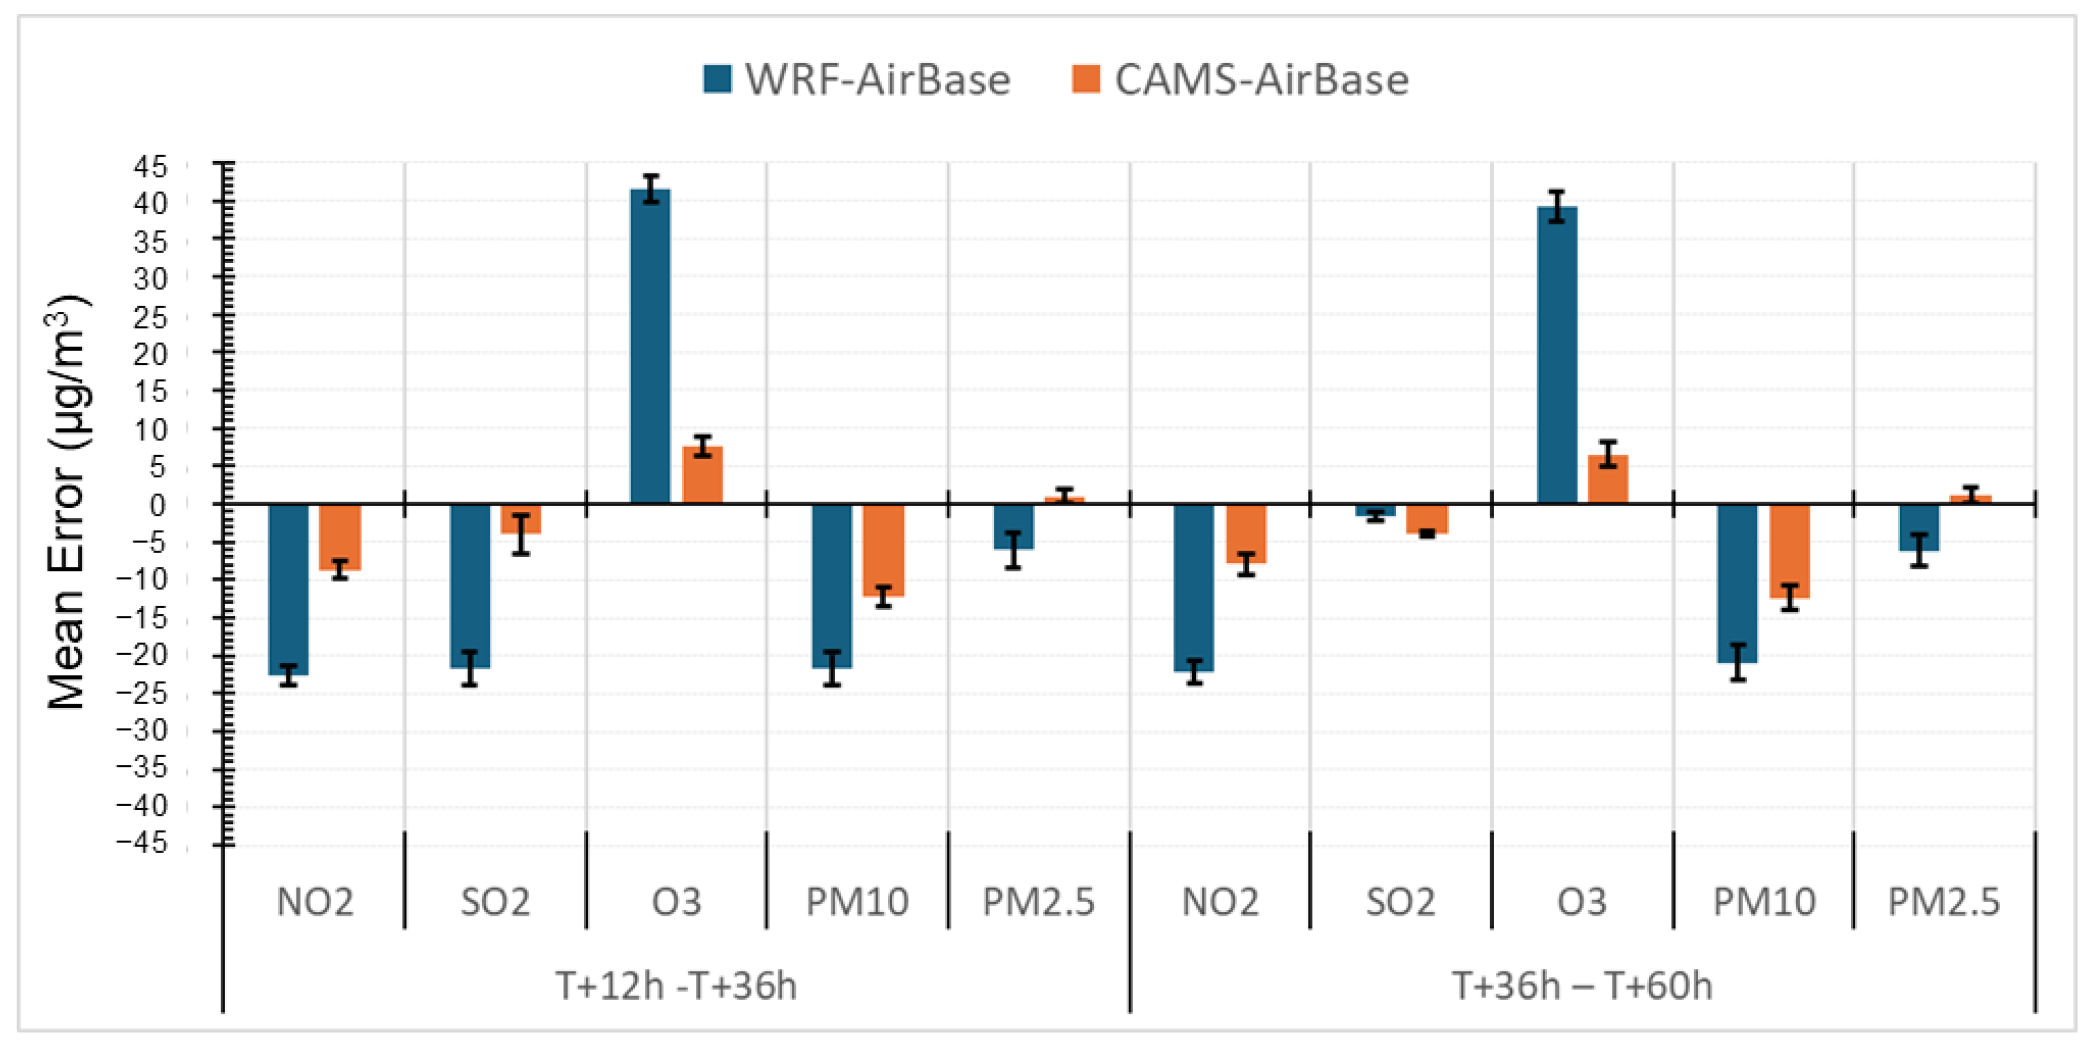
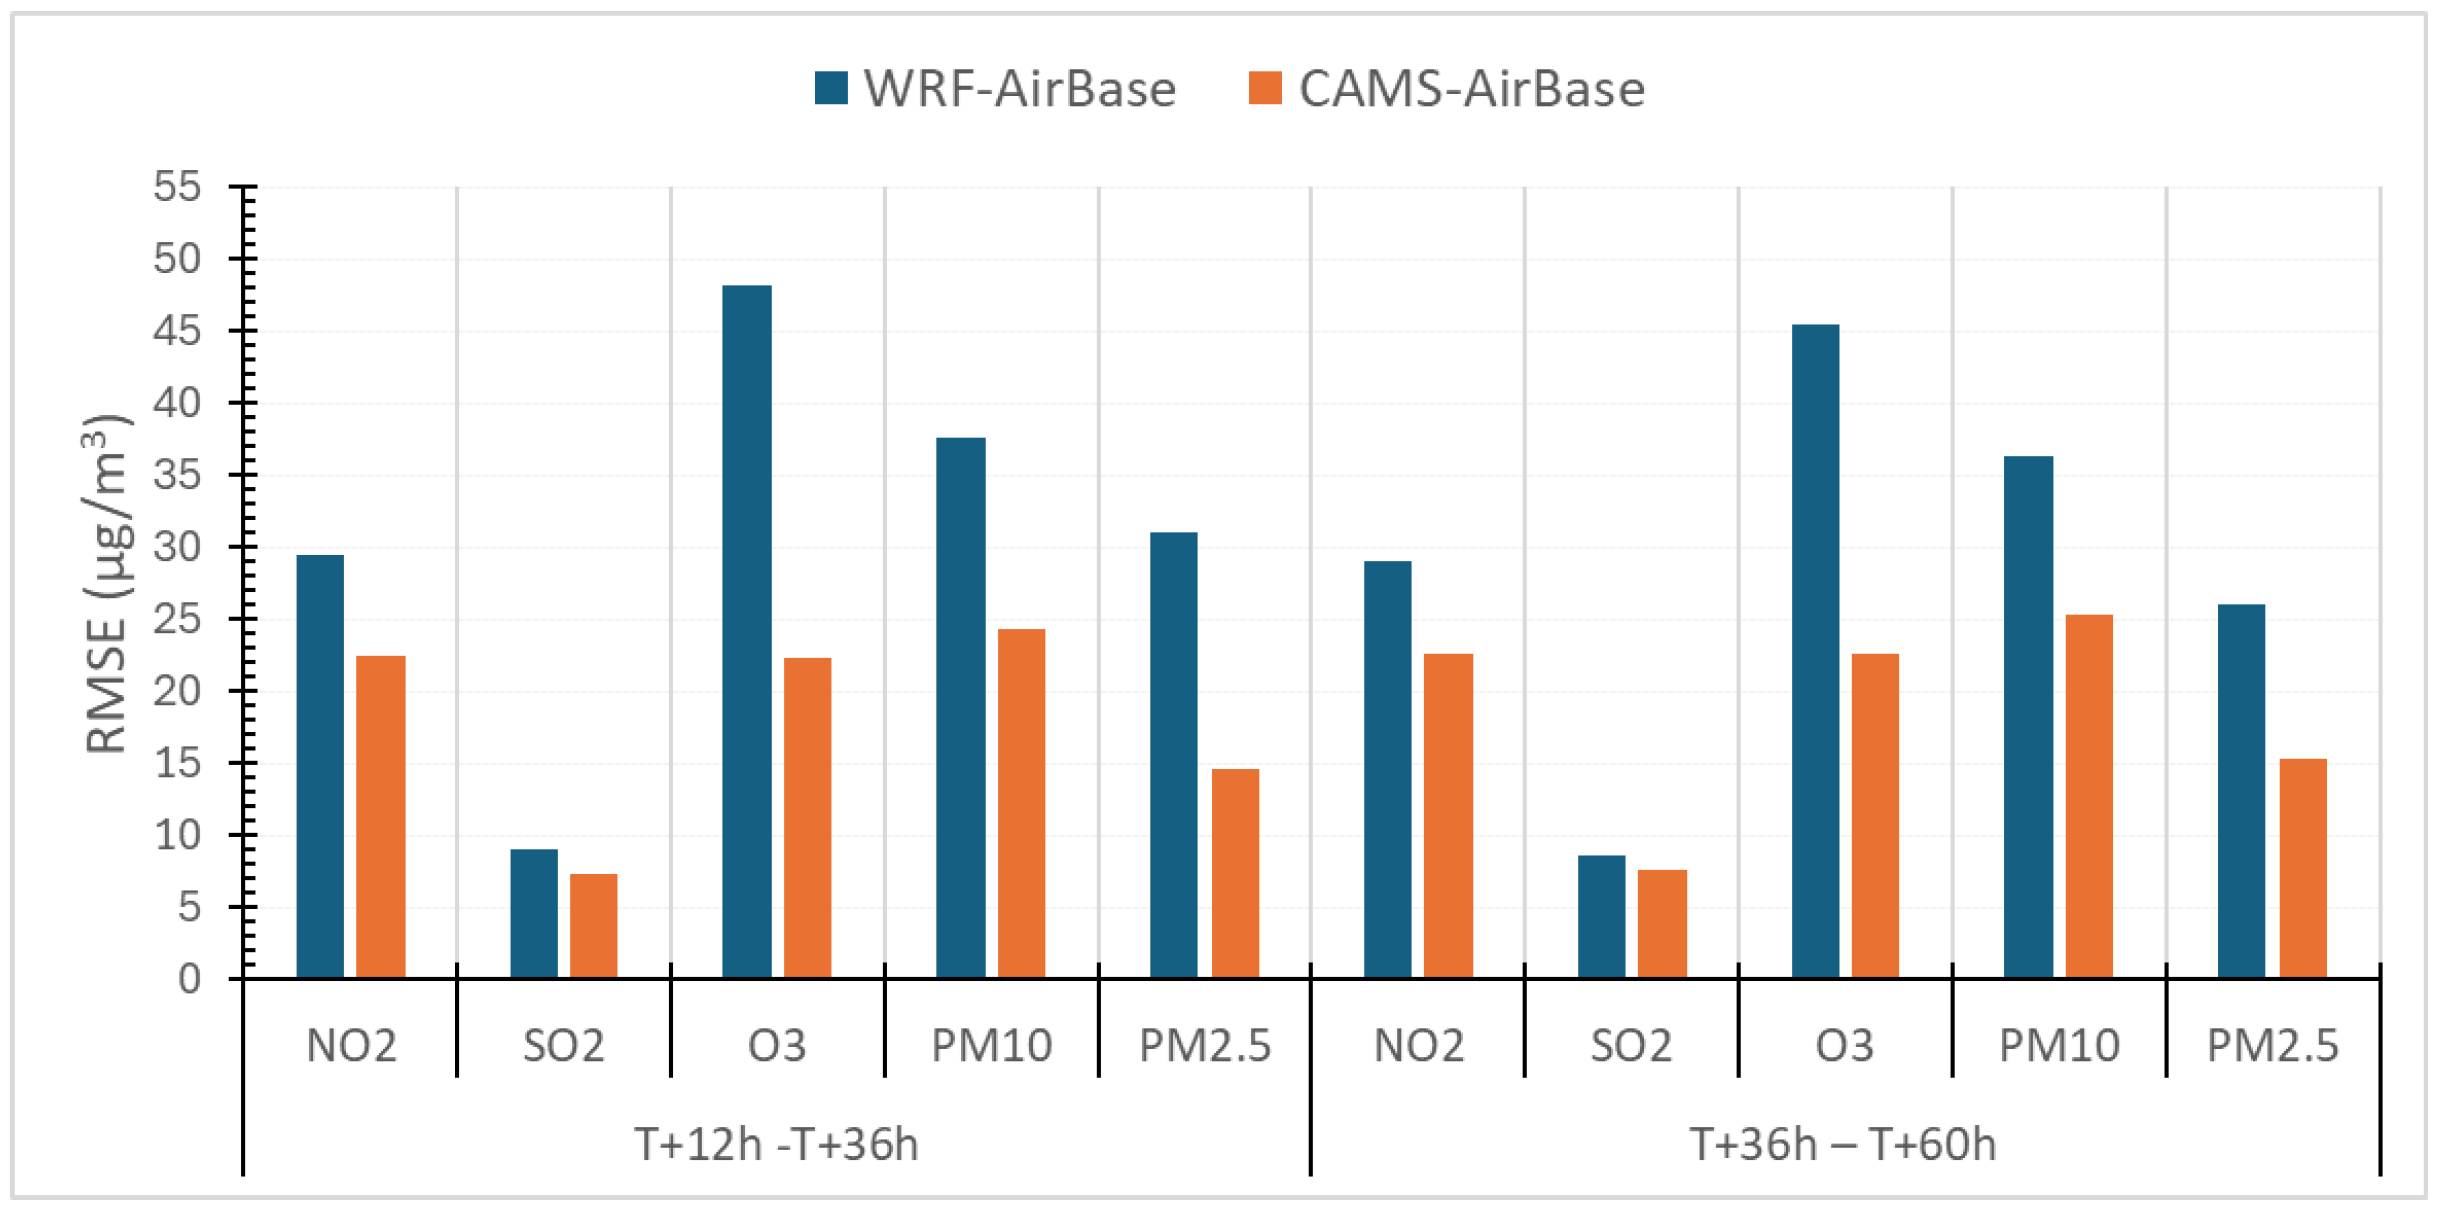
Figure 3 and Figure 4 illustrate the ME and RMSE values, respectively, contrasting the WRF-AtmoHub and CAMS regional forecasts against AirBase observations for both forecast windows.

3.1.1. Forecast Day 1 (T + 12 h − T + 36 h)

The WRF-AtmoHub forecasts generally exhibited a systematic bias when compared with AirBase observations. Specifically, the model underestimated concentrations of NO2 (ME = –22.59 ± 1.29 μg/m3), SO2 (ME = –21.64 ± 2.18 μg/m3), PM10 (ME = –21.64 ± 2.18 μg/m3), and PM2.5 (ME = –6.06 ± 2.34 μg/m3). Conversely, Ozone concentrations were overestimated (ME = 41.48 ± 1.79 μg/m3), (Figure 3). The corresponding RMSE values further indicated notable discrepancies, with the highest error observed for O3 (RMSE = 48.12 μg/m3), while the lowest was for SO2 (RMSE = 9.01 μg/m3), (Figure 4).

3.1.2. Forecast Day 2 (T + 36 h–T + 60 h)

On the second day of the forecast horizon, the direction of the biases remained consistent across all pollutants. However, a general reduction in the magnitude of the mean errors was observed, indicating an improvement in forecast accuracy. Notably, the ME for SO2 decreased to –1.62 ± 0.49 μg/m3. For other pollutants, mean errors showed a slight improvement compared to Day 1. Similarly, RMSE values either remained consistent (e.g., NO2, SO2) or decreased slightly (e.g., O3, PM10, PM2.5), demonstrating enhanced model performance over time.

3.2. Validation of the AtmoHub Monitoring-to-In Situ Network

In this study, the CAMS air quality data (analysis and forecasts) for key pollutants (NO2, SO2, O3, PM2.5, and PM10) were compared with hourly in situ observations from 17 AIRBASE monitoring stations across Greece. Although the comparison was performed for all pollutants, results are presented here specifically for ozone (O3), focusing on the two largest urban areas, Athens and Thessaloniki, where air quality issues are most pronounced.
The evaluation covered the entire study period and employed scatter plots to visualize the relationship between CAMS analysis and forecasted concentrations versus observed values. To quantify the degree of agreement, the coefficient of determination (R2) was calculated for each case.
This approach enables a detailed assessment of the CAMS regional model’s ability to replicate observed ozone patterns and highlights its strengths and limitations in both assimilated (analysis) and predictive (forecast) modes across different locations.
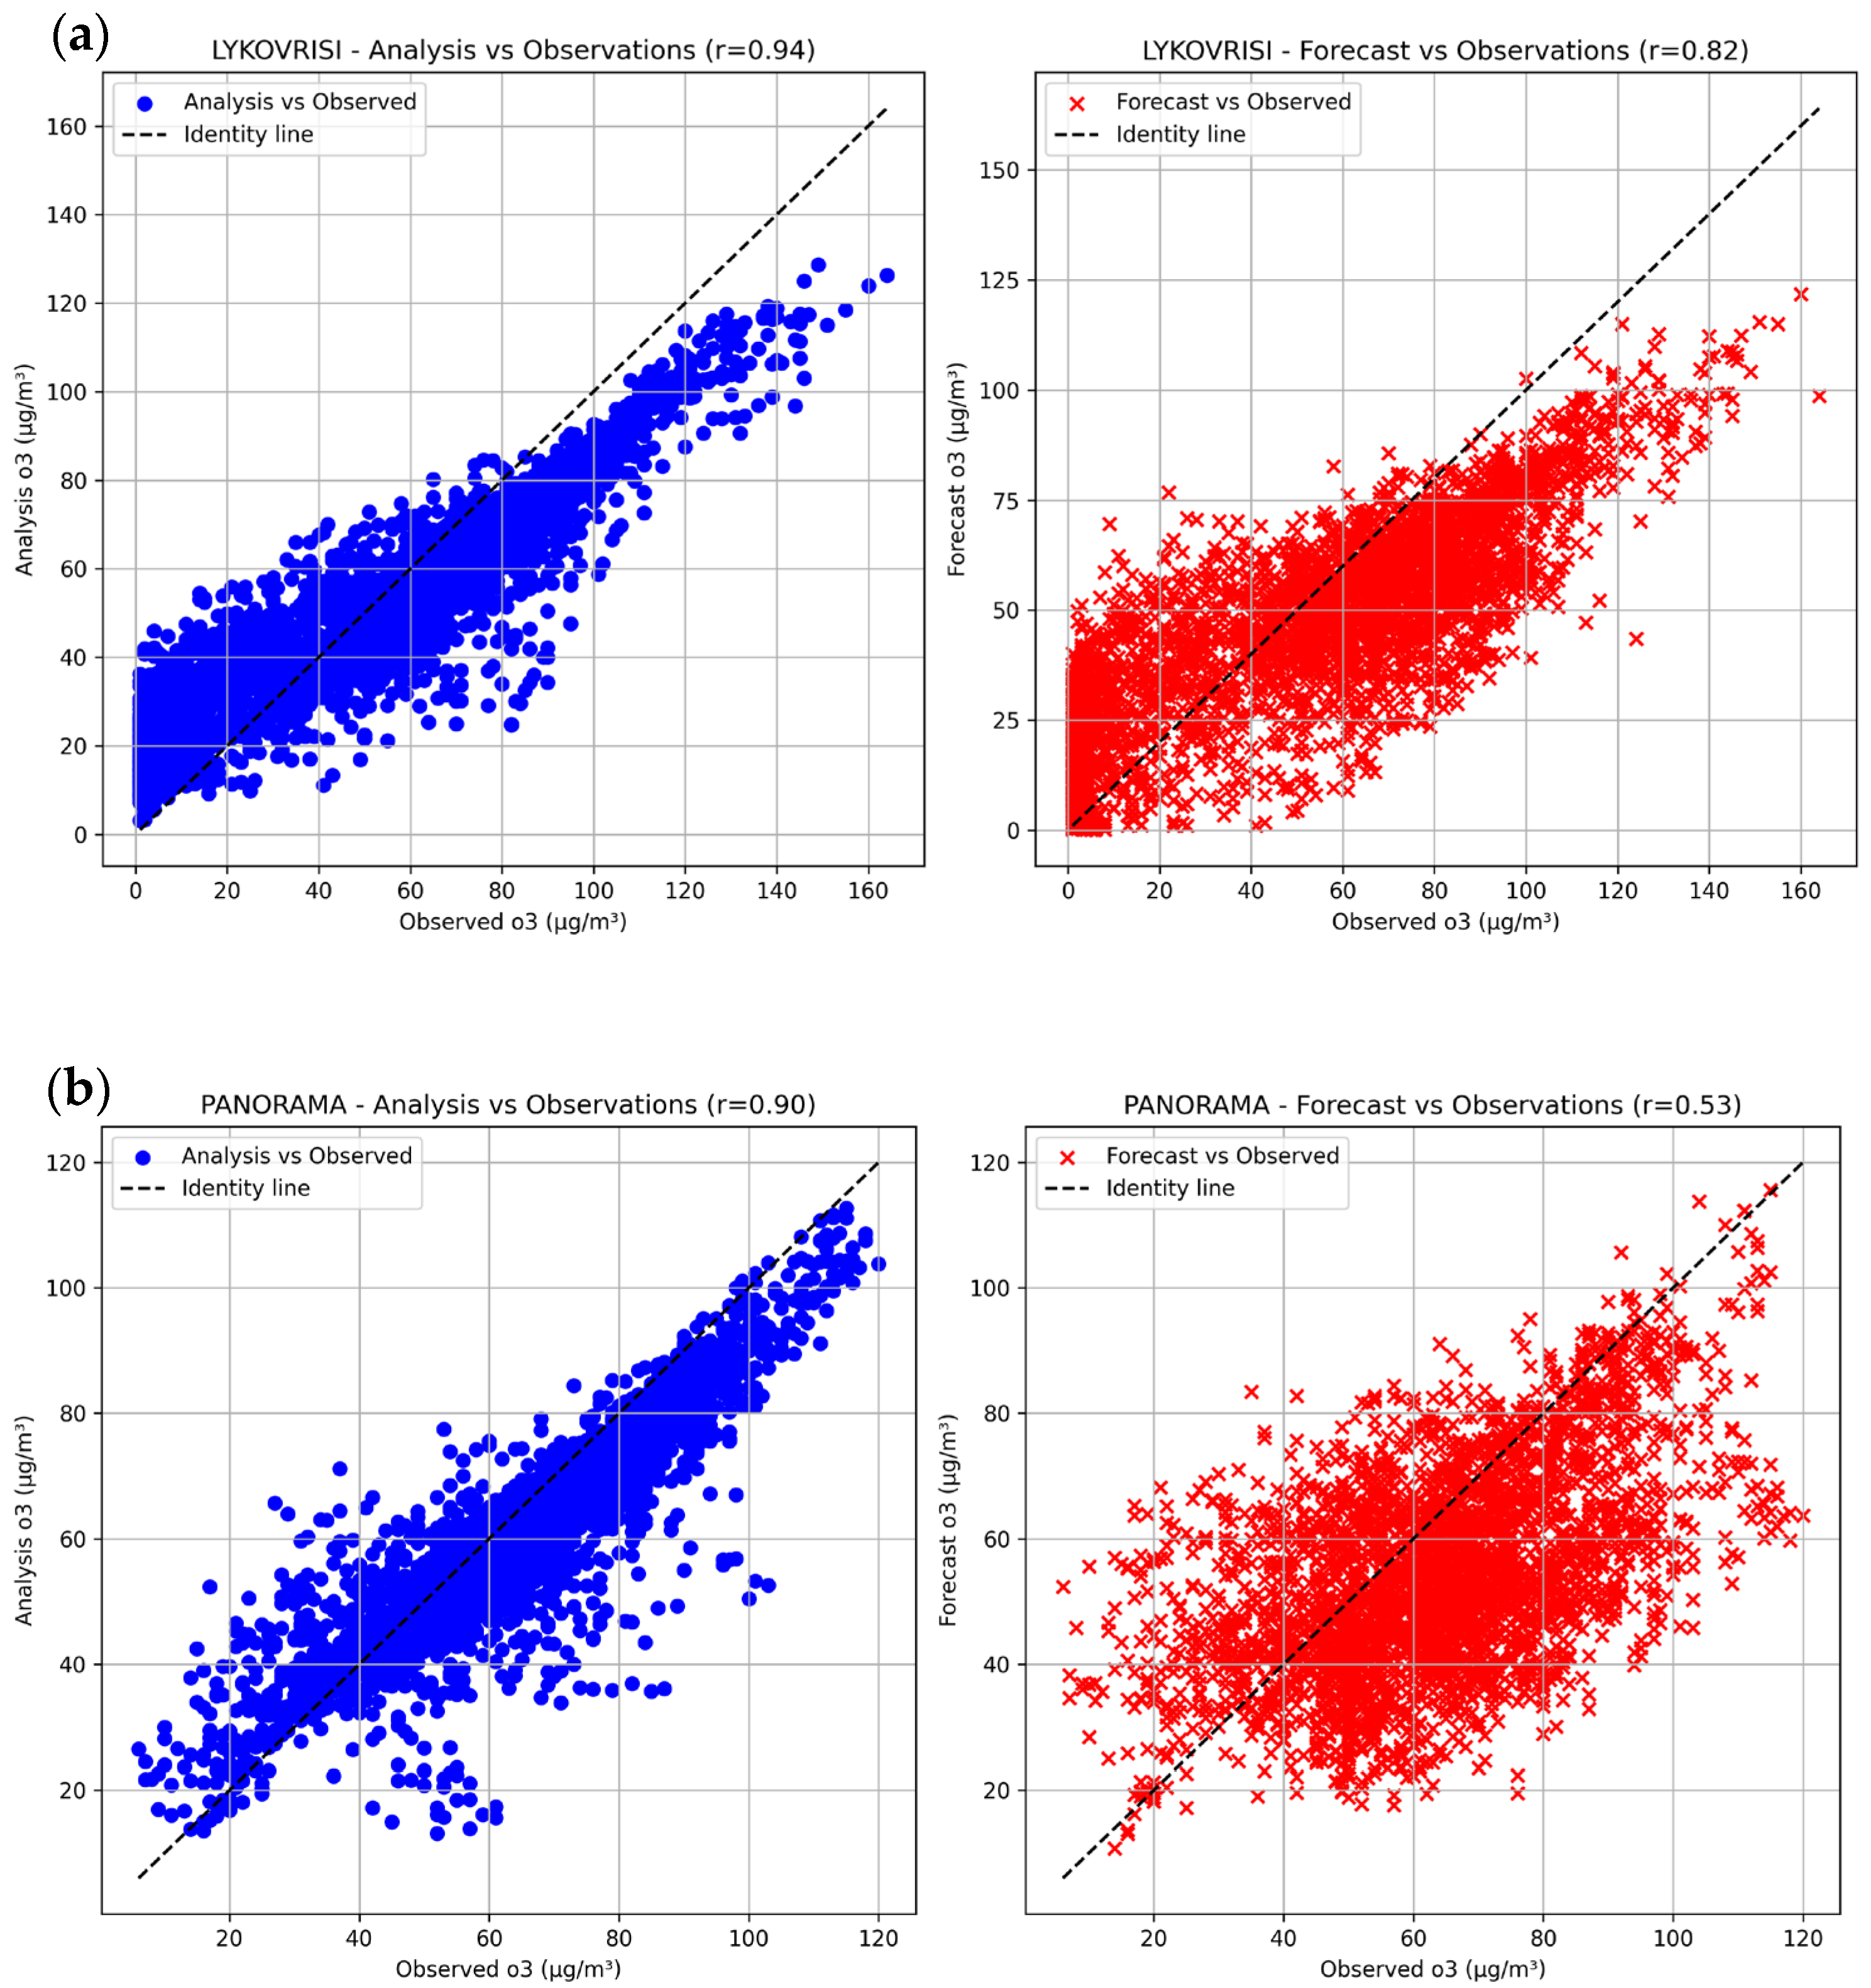
Figure 5 illustrates representative scatter plot analyses for ozone at: (a) Lykovrisi station in Athens, and (b) Panorama station in Thessaloniki. The plots compare CAMS regional analysis data (blue) and forecast outputs (red) against in situ AIRBASE observations. The calculated R2 values provide insight into the model’s predictive skill and consistency.
At the Lykovrisi site (Figure 5a), the CAMS analysis shows a strong correlation with observed ozone levels (R2 = 0.94), indicating high accuracy. Forecast data, while still performing reasonably well (R2 = 0.82), show increased deviations, particularly at higher concentrations, suggesting reduced predictive accuracy compared to the analysis.
A similar pattern is observed at the Panorama site (Figure 5b). The CAMS analysis again exhibits strong correlation with observations (R2 = 0.90), while the forecasts demonstrate moderate agreement (R2 = 0.53), with notable discrepancies at elevated ozone levels. This performance drop may be attributed to local emissions, complex topography, or meteorological conditions not fully captured in the model.
These results demonstrate the value of the AtmoHub monitoring-to-in situ framework for continuously validating CAMS forecasts and underscore the need for localized improvements to enhance forecast accuracy, especially under conditions of high pollutant concentrations.

4. Conclusions

AtmoHub provides a robust national platform for high-resolution air quality forecasting and monitoring in Greece, integrating advanced modelling and real-time observations. While the WRF-AtmoHub system shows promising accuracy—particularly for SO2—discrepancies remain for pollutants like O3 and NO2, largely due to complex urban dynamics and input data limitations. Continuous updates to model configuration, emission inventories, and resolution are essential to enhance its performance and forecasting skill.

Author Contributions

Conceptualization, A.K. and V.A.; Data curation, A.K., T.K., T.G., A.G., M.T. and K.A.V.; Investigation, A.K.; Methodology, A.K., V.A., S.K., T.K., M.T., V.S., M.M. and K.A.V.; Software, A.K., T.K., M.T. and K.A.V.; Supervision, V.A.; Visualization, A.K., S.K., T.K., V.S., E.D., M.M. and M.T.; Writing—original draft, A.K., S.K., T.K., M.T. and V.S.; Writing—review & editing, V.A., S.K., M.T., M.M., K.A.V. and V.S. All authors have read and agreed to the published version of the manuscript.

Funding

This research was funded by CAMS National Collaboration Programme (NPC) Greece (https://atmosphere.copernicus.eu/greece) (CAMS2_72GR_NOA project) and the Copernicus Atmosphere Monitoring Service (CAMS).

Institutional Review Board Statement

Not applicable for this study.

Informed Consent Statement

Not applicable for this study.

Data Availability Statement

The code used to process the model simulations along with the downscaled maps can be available from the authors upon request.

Acknowledgments

A.K. and the authors affiliated to the National Observatory of Athens acknowledges the support by the ACTRIS Research Infrastructure; data and services obtained from the PANhellenic GEophysical Observatory of Antikythera (PANGEA) of NOA and the PANGEA4CalVal project funded by the European Union (Grant Agreement 101079201); The project was supported by the European Commission and the European Centre for Medium-Range Weather Forecasts (ECMWF).

Conflicts of Interest

The authors declare no conflicts of interest.

References

  1. EEA. Greece—Air Pollution Country Fact Sheet 2024; EEA: Copenhagen, Denmark, 2024. [Google Scholar]
  2. Marinou, E.; Amiridis, V.; Binietoglou, I.; Tsikerdekis, A.; Solomos, S.; Proestakis, E.; Konsta, D.; Papagiannopoulos, N.; Tsekeri, A.; Vlastou, G.; et al. Three-Dimensional Evolution of Saharan Dust Transport towards Europe Based on a 9-Year EARLINET-Optimized CALIPSO Dataset. Atmos. Chem. Phys. 2017, 17, 5893–5919. [Google Scholar] [CrossRef]
  3. Lelieveld, J.; Berresheim, H.; Borrmann, S.; Crutzen, P.J.; Dentener, F.J.; Fischer, H.; Feichter, J.; Flatau, P.J.; Heland, J.; Holzinger, R.; et al. Global Air Pollution Crossroads over the Mediterranean. Science 2002, 298, 794–799. [Google Scholar] [CrossRef] [PubMed]
  4. Solomos, S.; Amiridis, V.; Zanis, P.; Gerasopoulos, E.; Sofiou, F.I.; Herekakis, T.; Brioude, J.; Stohl, A.; Kahn, R.A.; Kontoes, C. Smoke Dispersion Modeling over Complex Terrain Using High Resolution Meteorological Data and Satellite Observations—The FireHub Platform. Atmos. Environ. 2015, 119, 348–361. [Google Scholar] [CrossRef]
  5. Paraskevopoulou, D.; Liakakou, E.; Gerasopoulos, E.; Mihalopoulos, N. Sources of Atmospheric Aerosol from Long-Term Measurements (5years) of Chemical Composition in Athens, Greece. Sci. Total Environ. 2015, 527–528, 165–178. [Google Scholar] [CrossRef] [PubMed]
  6. Raptis, I.-P.; Kazadzis, S.; Amiridis, V.; Gkikas, A.; Gerasopoulos, E.; Mihalopoulos, N. A Decade of Aerosol Optical Properties Measurements over Athens, Greece. Atmosphere 2020, 11, 154. [Google Scholar] [CrossRef]
  7. Skamarock, W.C.; Klemp, J.B.; Dudhia, J.; Gill, D.O.; Barker, D.M.; Duda, M.G.; Huang, X.-Y.; Wang, W.; Powers, J.G. A Description of the Advanced Research WRF Version 4; National Center for Atmospheric Research: Boulder, CO, USA, 2019. [Google Scholar]
  8. Grell, G.A.; Peckham, S.E.; Schmitz, R.; McKeen, S.A.; Frost, G.; Skamarock, W.C.; Eder, B. Fully Coupled “Online” Chemistry within the WRF Model. Atmos. Environ. 2005, 39, 6957–6975. [Google Scholar] [CrossRef]
  9. Janssens-Maenhout, G.; Crippa, M.; Guizzardi, D.; Dentener, F.; Muntean, M.; Pouliot, G.; Keating, T.; Zhang, Q.; Kurokawa, J.; Wankmüller, R.; et al. HTAP_v2.2: A Mosaic of Regional and Global Emission Grid Maps for 2008 and 2010 to Study Hemispheric Transport of Air Pollution. Atmos. Chem. Phys. 2015, 15, 11411–11432. [Google Scholar] [CrossRef]
  10. Guenther, A.B.; Jiang, X.; Heald, C.L.; Sakulyanontvittaya, T.; Duhl, T.; Emmons, L.K.; Wang, X. The Model of Emissions of Gases and Aerosols from Nature Version 2.1 (MEGAN2.1): An Extended and Updated Framework for Modeling Biogenic Emissions. Geosci. Model Dev. 2012, 5, 1471–1492. [Google Scholar] [CrossRef]
  11. Morrison, H.; Thompson, G.; Tatarskii, V. Impact of Cloud Microphysics on the Development of Trailing Stratiform Precipitation in a Simulated Squall Line: Comparison of One- and Two-Moment Schemes. Mon. Weather Rev. 2009, 137, 991–1007. [Google Scholar] [CrossRef]
  12. Iacono, M.J.; Delamere, J.S.; Mlawer, E.J.; Shephard, M.W.; Clough, S.A.; Collins, W.D. Radiative Forcing by Long-Lived Greenhouse Gases: Calculations with the AER Radiative Transfer Models. J. Geophys. Res. Atmos. 2008, 113, 2–9. [Google Scholar] [CrossRef]
  13. Hong, S.-Y.; Noh, Y.; Dudhia, J. A New Vertical Diffusion Package with an Explicit Treatment of Entrainment Processes. Mon. Weather Rev. 2006, 134, 2318–2341. [Google Scholar] [CrossRef]
  14. Jiménez, P.A.; Dudhia, J.; González-Rouco, J.F.; Navarro, J.; Montávez, J.P.; García-Bustamante, E. A Revised Scheme for the WRF Surface Layer Formulation. Mon. Weather Rev. 2012, 140, 898–918. [Google Scholar] [CrossRef]
  15. Grell, G.A.; Freitas, S.R. A Scale and Aerosol Aware Stochastic Convective Parameterization for Weather and Air Quality Modeling. Atmos. Chem. Phys. 2014, 14, 5233–5250. [Google Scholar] [CrossRef]
Figure 1. Domain configuration in the WRF-Chem numerical model. The Greek territory is depicted in ivory.
Eesp 35 00036 g001
Figure 2. Locations of the available air quality surface observations from the AirBase database which were used in the evaluation process of the WRF-AtmoHub forecasts.
Eesp 35 00036 g002
Figure 3. Mean Error (μg/m3) of NO2, SO2, O3, PM10 and PM2.5 at 17 AirBase stations. Blue bars represent WRF-AtmoHub forecasts for Day 1 (T + 12 h − T + 36 h) and Day 2 (T + 36 h − T + 60 h), while orange bars show CAMS regional ensemble forecasts, both compared against in Airbase situ observations.
Eesp 35 00036 g003
Figure 4. Root Mean Squared Error (RMSE, μg/m3) of NO2, SO2, O3, PM10 and PM2.5 at 17 AirBase stations. Blue bars represent WRF-AtmoHub forecasts for Day 1 (T + 12 h – T + 36 h) and Day 2 (T + 36 h − T + 60 h), while orange bars show CAMS regional ensemble forecasts, both compared against in Airbase situ observations.
Eesp 35 00036 g004
Figure 5. Scatter plot analysis comparing CAMS Regional Analysis (blue) and Forecast (red) data with AIRBASE hourly in situ O3 concentrations at (a) Lykovrisi (Athens) and (b) Panorama (Thessaloniki) stations over the study period. The coefficient of determination (R2) is shown to quantify the level of agreement between model outputs and observations.
Eesp 35 00036 g005
Table 1. Definition of statistical metrics used in the evaluation process.
Statistical MetricDefinition
Mean Error M E = 1 n i = 1 n f i o i
Root Mean Squared Error R M S E = 1 n i = 1 n f i o i 2
Disclaimer/Publisher’s Note: The statements, opinions and data contained in all publications are solely those of the individual author(s) and contributor(s) and not of MDPI and/or the editor(s). MDPI and/or the editor(s) disclaim responsibility for any injury to people or property resulting from any ideas, methods, instructions or products referred to in the content.