
Assessment of the Lower Danube Sediment Regime and Morphology for the Identification of Habitats for Critically Endangered Sturgeon †

 and
and
Abstract
1. Introduction
- Sieving using sieves (grain diameter d > 2.00 mm);
- In situ sieving method (0.05–0.08 (0.063) < d< 2.00 mm);
- Sedimentation method (d < 0.05–0.08 (0.063) mm).
- The frequency curve, which is a graphical depiction of a string that consists of pairs of particle size classes and their corresponding fractions—a histogram representing the simple frequency distribution in percentage [%] and the proportion of involvement for each distinct size class.
- The cumulative frequency refers to the total accumulation of frequencies in a dataset. The cumulative percentage involvement refers to the total proportion of each particle size class up to a specific diameter value.
2. Materials and Methods
2.1. Sampling Campaigns
2.2. Granulometric Assessment
- The median, also known as D50, is the diameter value that splits the particle size distribution into two equal sections, with 50% of the particles having a diameter smaller than or equal to this value. Additional significant values are the size values corresponding to the selected cumulative frequencies equidistant from D50: D16 and D84, D5 and D95, and D25 and D75.
- The graphical mean of a distribution refers to the arithmetic mean of frequencies that are equidistant from the 50th percentile.
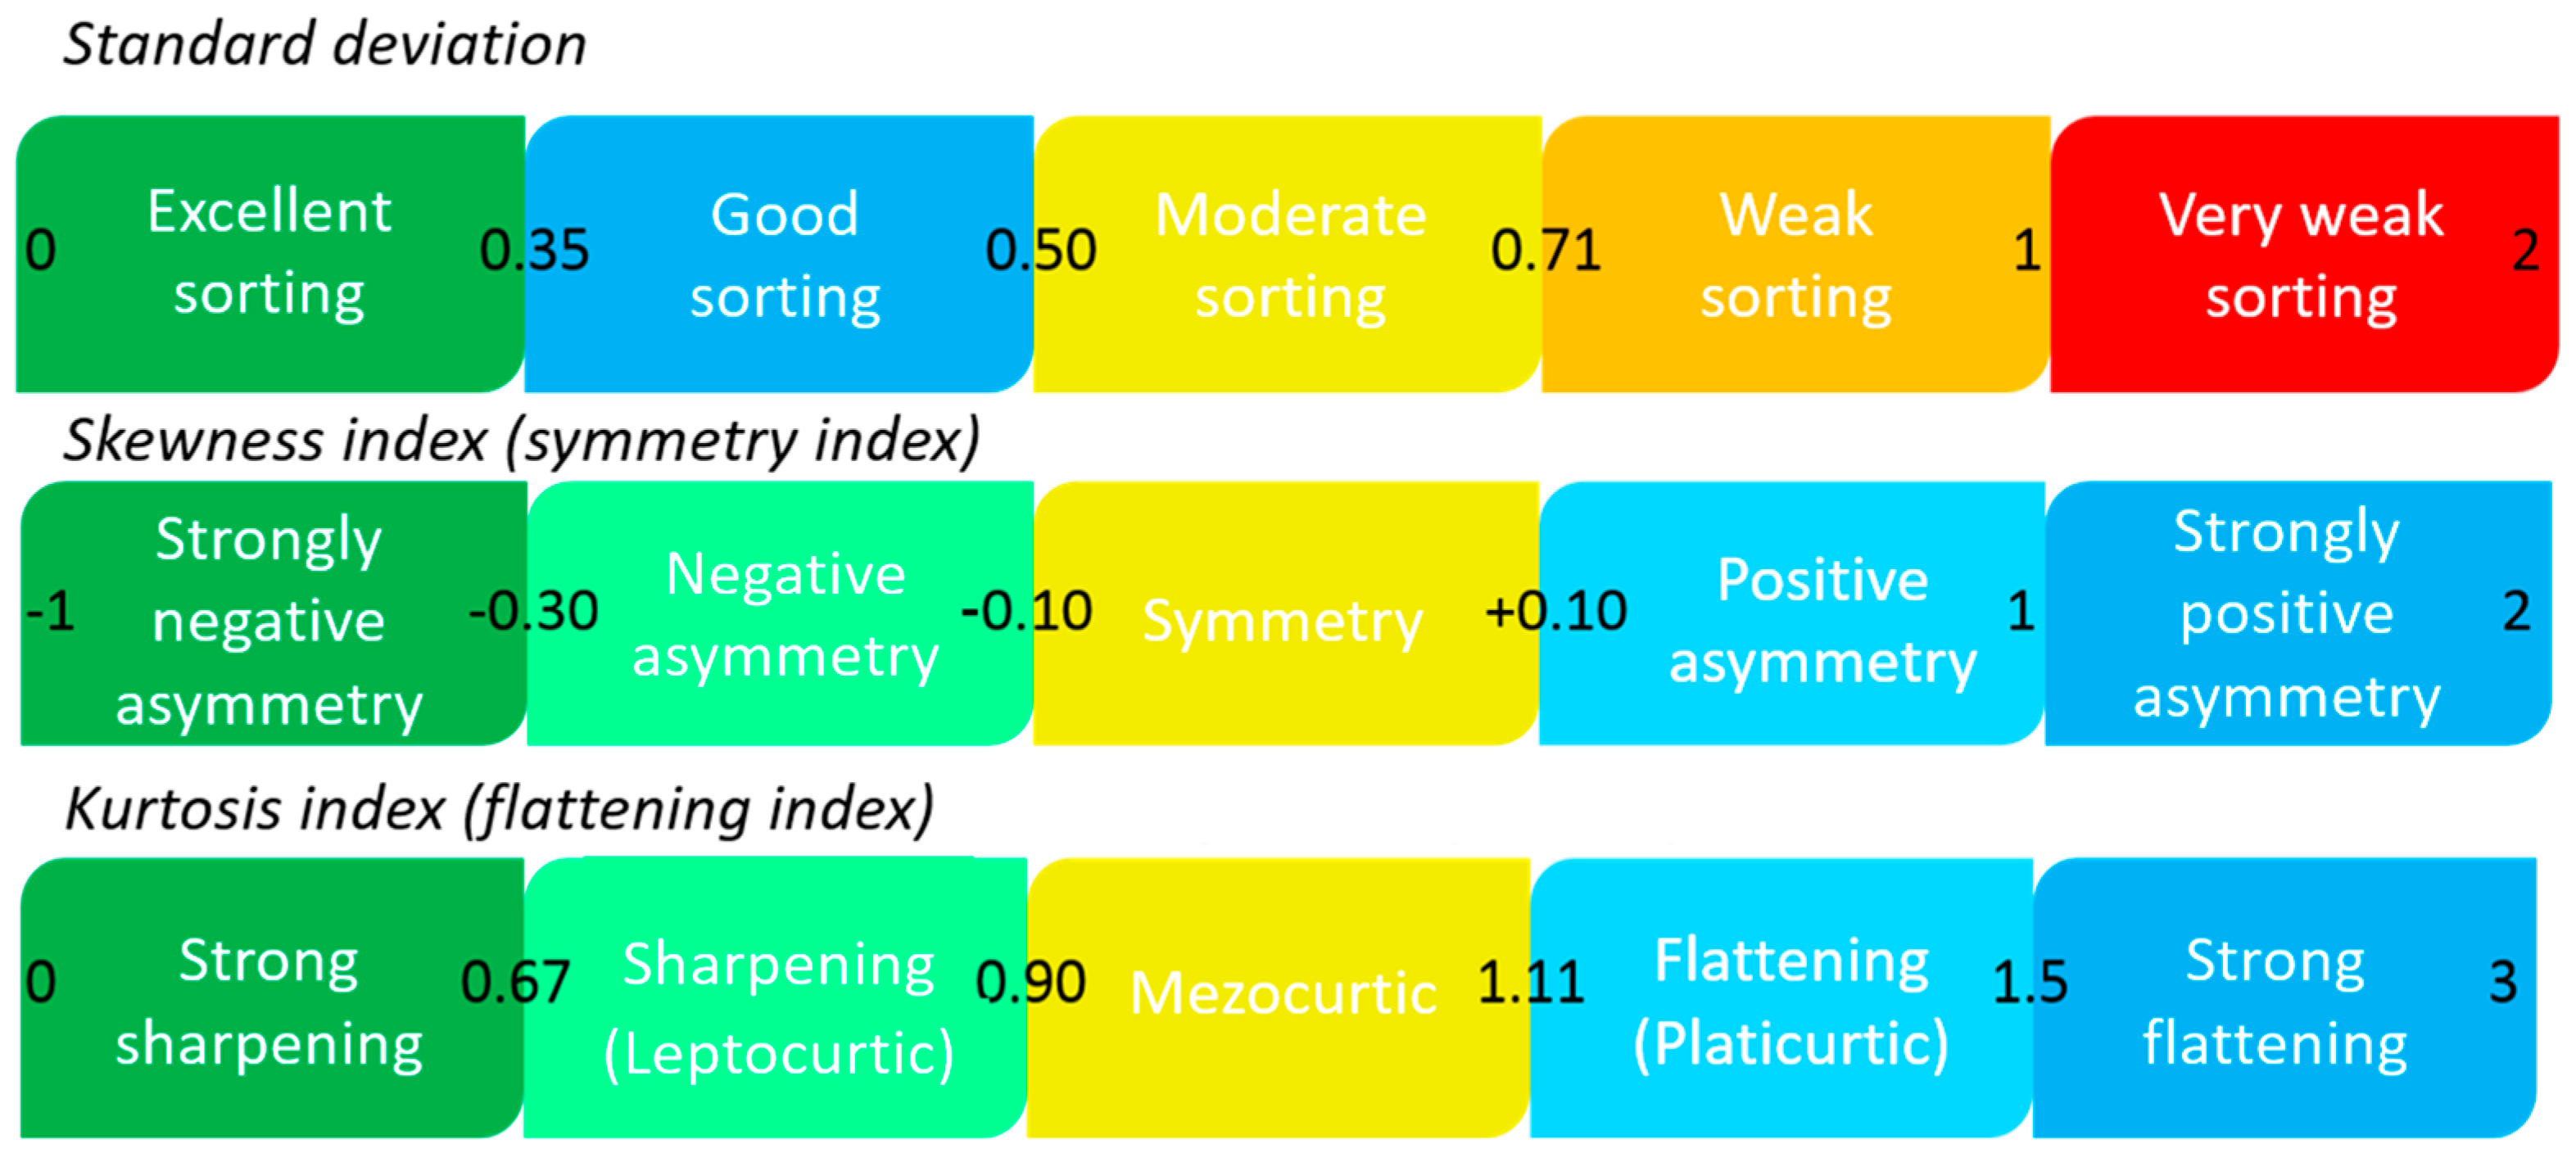
- Standard deviation corresponds to the dispersion of size values within the distribution around the mean of 50%.
- The skewness index, also known as the mean squared deviation, quantifies the extent to which values are dispersed in a frequency distribution.
- The kurtosis index quantifies the degree to which values in a frequency distribution are concentrated in a certain region.
3. Results and Discussion
4. Conclusions
Author Contributions
Funding
Institutional Review Board Statement
Informed Consent Statement
Data Availability Statement
Acknowledgments
Conflicts of Interest
References
- INCDPM PN 23 31 02 01. Assessment of Anthropogenic Impacts on Migration Routes/Breeding Habitats for the Development of Complementary Conservation Measures and Extension of Strict Protection Areas for the Sturgeon Population Monitored on the Danube River in Accordance with the EU Mission and Biodiversity Strategy 2030—SturHabCons (2023–2026). Available online: https://www.incdpm.org/reports (accessed on 18 March 2025).
- INCDPM-Project Evolution of sturgeon populations and Danube ichthyofauna in the context of changes in the course of the Danube in recent decades (Contract no. 39N/2019), phase 19 43 02 01.4.2.2 Identification of Sturgeon Behavior Under Different Hydromorphodynamic Conditions Resulting from the Implementation of Hydrotechnical Works (2021). Available online: https://www.incdpm.org/_files/ugd/698962_b592a834336f45158ff25a59b77f660f.pdf (accessed on 18 March 2025).
- Deák, G.; Georgescu, P.-L. Sustainable Development Strategy for the Conservation of Wild Sturgeons in the Lower Danube in the Context of Climate Change and the European Green Deal; UEFISCDI Publishing House: Bucharest, Romania, 2023; pp. 383–412. ISBN 978-606-95687-2-9. [Google Scholar]
- Tudor, G.; Deak, G.; Arsene, M.; Holban, E.; Monica, M.; Boboc, M.; Raischi, M. Methodology for Identification of Areas with Possible Risk for Sturgeon Species Migration Disruption on The Lower Danube. E3S Web Conf. 2023, 437, 02006. [Google Scholar] [CrossRef]
- Nasir, N.A.N.M.; Zakarya, I.A.; Kamaruddin, S.A.; Islam, A.K.M.A. Advances and future prospects on biotechnological approaches towards Azolla for environmental sustainability. Pertanika J. Trop. Agric. Sci. 2022, 45, 595–609. [Google Scholar] [CrossRef]
- Xian, B.C.C.; Kang, C.W.; Ab Wahab, M.; Zainol, M.R.R.M.A.; Baharudin, F. Evaluation of low impact development and best management practices on peak flow reduction using SWMM. IOP Conf. Ser. Earth Environ. Sci 2021, 646, 012045. [Google Scholar] [CrossRef]
- Danalache, T.M.; Deák, G.; Holban, E.; Raischi, M.C.; Fronescu, D.S.; Nicolae, C.G.; Cristea, M.A. Evaluating the effect of the hydrotechnical works from the Danube’s Caleia branch on the spawning migration of sturgeons. IOP Conf. Ser. Earth Environ. Sci 2020, 616, 012025. [Google Scholar] [CrossRef]
- Deak, G.Y.; Daescu, V.; Holban, E.; Marinescu, P.; Tanase, G.S.; Csergo, R.; Daescu, A.I.; Gaman, S. Health-environment relation: A key issue of Romanian environmental protection. J. Environ. Prot. Ecol. 2015, 16, 304–315. [Google Scholar]
- Tudor, G.; Deák, G.; Uriţescu, B.; C-tin, C.; Nicolae, A.F.; Zamfir, S.; Dănălache, T.; Olteanu, M. Comparative Analysis of Hydrodynamic and Hydromorphological Parameters Variation Resulting from Anthropic Interventions on Lower Danube—Caleia Branch. Available online: https://www.cabidigitallibrary.org/doi/full/10.5555/20193267770 (accessed on 18 March 2025).
- Ghita, G.; Ilie, M.; Tudor, G.; Arsene, M.; Luminarioiu, L.; Raischi, M.; Petrache, I. Investigations Regarding the Contamination with Emerging Pharmaceutical Pollutants in Representative Rivers and Lakes in Romania. E3S Web Conf. 2023, 437, 02008. [Google Scholar] [CrossRef]
- Nicolae, A.-F.; Zamfir, A.-Ș.; Georgescu, L.; Tudor, G.; Dumitru, D.-F.; Ilie, M.; Ghiță, G.; Raischi, M.C. Study regarding the dispersion of water quality indicators in the Danube river. Analele Univ. “Dunărea De Jos” Din Galați. Fasc. II Mat. Fiz. Mec. Teor. Ann. “Dunarea De Jos” Univ. Galati. Fascicle II Math. Phys. Theor. Mech. 2017, 40, 69–74. [Google Scholar]
- Rząsa, S.; Owczarzak, W. Methods for the granulometric analysis of soil for science and practice. Pol. J. Soil Sci. 2013, XLVI/1, 1–50. [Google Scholar]
- Blair, T.C.; McPherson, J.G. Grain-size and textural classification of coarse sedimentary particles. J. Sediment. Res. 1999, 69, 6–19. [Google Scholar] [CrossRef]
- Krumbein, W.C. Size frequency distributions of sediments and the normal phi curve. J. Sediment. Res. 1938, 8, 84–90. [Google Scholar] [CrossRef]


| Sample | Sieve Diameter [mm] | 2 | 1 | 0.5 | 0.25 | 0.16 | 0.09 | <0.09 | Total |
|---|---|---|---|---|---|---|---|---|---|
| PS_Bala_1 | Sieve debris [g] | 0.000 | 0.000 | 0.410 | 36.300 | 202.099 | 45.601 | 3.027 | 287.437 |
| Gravimetric percentage [%] | 0.000 | 0.000 | 0.143 | 12.629 | 70.311 | 15.865 | 1.053 | 100.000 | |
| PS_Bala_2 | Sieve debris [g] | 0.000 | 0.000 | 0.445 | 16.800 | 170.232 | 51.250 | 5.575 | 244.302 |
| Gravimetric percentage [%] | 0.000 | 0.000 | 0.182 | 6.877 | 69.681 | 20.978 | 2.282 | 100.000 | |
| PS_Bala_3 | Sieve debris [g] | 0.000 | 3.494 | 10.695 | 20.528 | 77.361 | 84.371 | 33.278 | 229.727 |
| Gravimetric percentage [%] | 0.000 | 1.521 | 4.656 | 8.936 | 33.675 | 36.727 | 14.486 | 100.000 | |
| PS_Bala_4 | Sieve debris [g] | 0.000 | 16.020 | 17.066 | 32.880 | 58.466 | 67.134 | 27.154 | 218.720 |
| Gravimetric percentage [%] | 0.000 | 7.324 | 7.803 | 15.033 | 26.731 | 30.694 | 12.415 | 100.000 | |
| PS_Bala_5 | Sieve debris [g] | 0.000 | 6.160 | 42.221 | 43.202 | 39.342 | 29.983 | 18.565 | 179.473 |
| Gravimetric percentage [%] | 0.000 | 3.432 | 23.525 | 24.072 | 21.921 | 16.706 | 10.344 | 100.000 |
| Sample | Sieve Diameter [mm] | 2 | 1 | 0.5 | 0.25 | 0.16 | 0.09 | <0.09 | Total |
|---|---|---|---|---|---|---|---|---|---|
| PS_Caleia_1 | Sieve debris [g] | 5.804 | 8.570 | 5.430 | 16.336 | 26.329 | 98.050 | 42.474 | 202.993 |
| Gravimetric percentage [%] | 2.859 | 4.222 | 2.675 | 8.048 | 12.970 | 48.302 | 20.924 | 100.000 | |
| PS_Caleia_2 | Sieve debris [g] | 5.806 | 11.937 | 6.274 | 9.249 | 14.010 | 85.940 | 66.399 | 199.615 |
| Gravimetric percentage [%] | 2.909 | 5.980 | 3.143 | 4.633 | 7.019 | 43.053 | 33.264 | 100.000 | |
| PS_Caleia_3 | Sieve debris [g] | 6.225 | 11.220 | 5.640 | 2.933 | 14.639 | 117.176 | 42.572 | 200.405 |
| Gravimetric percentage [%] | 3.106 | 5.599 | 2.814 | 1.464 | 7.305 | 58.470 | 21.243 | 100.000 | |
| PS_Caleia_4 | Sieve debris [g] | 6.059 | 10.039 | 7.598 | 41.958 | 54.362 | 69.538 | 29.371 | 218.925 |
| Gravimetric percentage [%] | 2.768 | 4.586 | 3.471 | 19.165 | 24.831 | 31.763 | 13.416 | 100.000 | |
| PS_Caleia_5 | Sieve debris [g] | 4.015 | 18.340 | 14.690 | 21.061 | 16.759 | 65.102 | 60.015 | 199.982 |
| Gravimetric percentage [%] | 2.008 | 9.171 | 7.346 | 10.531 | 8.380 | 32.554 | 30.010 | 100.000 |
| Sample | Standard Deviation | Skewness Index | Kurtosis Index |
|---|---|---|---|
| PS_Bala_1 | 0.042 | 1.078 | 0.810 |
| PS_Bala_2 | 0.052 | 0.171 | 1.112 |
| PS_Bala_3 | 0.119 | 0.342 | 2.054 |
| PS_Bala_4 | 0.251 | 0.641 | 2.055 |
| PS_Bala_5 | 0.276 | 0.535 | 0.839 |
| Sample | Standard Deviation | Skewness Index | Kurtosis Index |
|---|---|---|---|
| PS_Caleia_1 | 0.274 | 0.724 | 5.670 |
| PS_Caleia_2 | 0.298 | 0.717 | 10.022 |
| PS_Caleia_3 | 0.278 | 0.609 | 11.023 |
| PS_Caleia_4 | 0.305 | 0.675 | 2.987 |
| PS_Caleia_5 | 0.398 | 0.838 | 2.517 |
Disclaimer/Publisher’s Note: The statements, opinions and data contained in all publications are solely those of the individual author(s) and contributor(s) and not of MDPI and/or the editor(s). MDPI and/or the editor(s) disclaim responsibility for any injury to people or property resulting from any ideas, methods, instructions or products referred to in the content. |
© 2025 by the authors. Licensee MDPI, Basel, Switzerland. This article is an open access article distributed under the terms and conditions of the Creative Commons Attribution (CC BY) license (https://creativecommons.org/licenses/by/4.0/).
Share and Cite
Sadîca, I.; Tudor, G.; Holban, E.; Arsene, M.; Carachiciu, M.; Cucu, G.; Stegărescu, S. Assessment of the Lower Danube Sediment Regime and Morphology for the Identification of Habitats for Critically Endangered Sturgeon. Environ. Earth Sci. Proc. 2025, 33, 9. https://doi.org/10.3390/eesp2025033009
Sadîca I, Tudor G, Holban E, Arsene M, Carachiciu M, Cucu G, Stegărescu S. Assessment of the Lower Danube Sediment Regime and Morphology for the Identification of Habitats for Critically Endangered Sturgeon. Environmental and Earth Sciences Proceedings. 2025; 33(1):9. https://doi.org/10.3390/eesp2025033009
Chicago/Turabian StyleSadîca, Isabela, Georgeta Tudor, Elena Holban, Miruna Arsene, Maria Carachiciu, George Cucu, and Sorin Stegărescu. 2025. "Assessment of the Lower Danube Sediment Regime and Morphology for the Identification of Habitats for Critically Endangered Sturgeon" Environmental and Earth Sciences Proceedings 33, no. 1: 9. https://doi.org/10.3390/eesp2025033009
APA StyleSadîca, I., Tudor, G., Holban, E., Arsene, M., Carachiciu, M., Cucu, G., & Stegărescu, S. (2025). Assessment of the Lower Danube Sediment Regime and Morphology for the Identification of Habitats for Critically Endangered Sturgeon. Environmental and Earth Sciences Proceedings, 33(1), 9. https://doi.org/10.3390/eesp2025033009