Proceeding Paper

Assessing Dam Site Suitability Using an Integrated AHP and GIS Approach: A Case Study of the Purna Catchment in the Upper Tapi Basin, India †

by
Shravani Yadav
1,
Usman Mohseni
2,*,
Mohit Dashrath Vasave
3,
Advait Sanjay Thakur
3,
Uday Ravindra Tadvi
3 and
Rohit Subhash Pawar
3
1
Department of Hydrology, IIT Roorkee, Roorkee 247667, India
2
Department of Civil Engineering, IIT Roorkee, Roorkee 247667, India
3
Department of Civil Engineering, Viva Institute of Technology, Vasai 401305, India
*
Author to whom correspondence should be addressed.
Presented at the 8th International Electronic Conference on Water Sciences, 14–16 October 2024; Available online: https://sciforum.net/event/ECWS-8.
Environ. Earth Sci. Proc. 2025, 32(1), 21; https://doi.org/10.3390/eesp2025032021
Published: 9 June 2025
(This article belongs to the Proceedings of The 8th International Electronic Conference on Water Sciences)

Abstract

:
In the present study, dam site suitability mapping was carried out for the Purna sub-basin of the upper Tapi basin. Constructing dams in strategically chosen locations is a crucial water management approach to alleviate flood risks and water scarcity. Selecting appropriate dam sites requires considering criteria such as precipitation, elevation, soil properties, slope, geomorphology, geology, lithology, stream order, distance from a road, and fault tectonics. To address this complex problem, integrating Multiple-Criteria Decision-Making (MCDM) techniques with Geographic Information System (GIS) has become increasingly prevalent. Among these techniques, the Analytic Hierarchy Process (AHP) is particularly effective for addressing water-related challenges. In this study, we developed a Dam Site Suitability Model (DSSM) by evaluating nine thematic layers: precipitation, stream order, geomorphology, geology, soil, elevation, slope, land use and land cover (LULC), and major fault tectonics. The AHP technique was employed to assign weights to these thematic layers, which were then used in an overlay analysis to create a suitability map with five classes ranging from high to low suitability. This study revealed that approximately 14% of the Purna sub-basin falls into the very high suitability category, while 27.2% is classified as highly suitable. This cost-effective approach not only simplifies the traditional method of dam site selection but also enhances decision-making accuracy. This methodology can be universally applied to identify potential dam sites, aiding flood mitigation and addressing water scarcity exacerbated by global and regional climate change. The DSSM, leveraging GIS and the AHP, can significantly improve dam management and promote sustainable, environmentally responsible water resource management practices worldwide.

1. Introduction

Water is essential and crucial for all life on Earth [1,2]. Due to urbanization, population growth, and the adverse effects of climate change, there has been a significant increase in flooding risks [3]. Urbanization and population growth increase water demand, leading to severe water scarcity. Climate change exacerbates hydrological processes, potentially increasing future flood frequency and severity [3,4]. The construction of dams can help in overcoming floods, storing water for irrigation and drinking, and hydroelectric power generation [5]. Dams help regulate river flow, reduce the risk of floods and droughts, and provide a reliable water supply to support agriculture and communities [6]. Additionally, they can generate renewable energy, contributing to regional development and economic growth [7]. The construction of dams in appropriate locations is a paramount water management approach for flood and water scarcity relief [8,9]. Therefore, site suitability analysis for the construction of dams requires the selection of subjective and quantifiable criteria such as rainfall, land use and land cover (LULC), stream order, elevation, soil, geomorphology, geology, and fault tectonics.
MCDM techniques coupled with GIS are now being used to solve real-world problems [9,10] and will enable us to decide on a suitable site for building a dam. Decision analysis consists of a systematic assessment of complex decision problems, typically evaluated by various individuals and members of interest groups, each of whom has a distinct preference for the criteria used in the evaluation [11]. Integrating GIS with MCDA enhances site suitability [12], as a GIS provides spatial context while MCDM compares alternatives. Most research has used different MCDM approaches to establish the most acceptable location for the dam site [3]. The AHP is a widely adopted method in DSSM due to its structured approach and ability to integrate expert judgment. However, other methods like TOPSIS and Weighted Overlay Analysis are also commonly used, each with its own strengths and limitations [13]. The AHP assumes criteria independence, making it less ideal for interrelated factors like elevation and slope. While it handles qualitative and quantitative criteria well, it struggles with scalability and rank reversal. Studies like [14] have critically highlighted its limitations in complex scenarios, suggesting refinements for improved reliability. The flexibility of the AHP in certain applications, in showing how customized algorithms could improve its accuracy for heuristic evaluations, is demonstrated in [15]. This establishes the AHP as beneficial; however, it must be justified in comparison to other MCDM methods. The present study aims to identify suitable regions for the development of dams by utilizing remote sensing, GIS, and AHP systems. The AHP was applied to select suitable sites for dam construction on selected streams. The objectives of this research were as follows:
(a)
To investigate suitable zones for constructing a dam in the Purna sub-catchment located in the upper half of the Tapi basin;
(b)
To investigate and categorize geomorphological, geological, and meteorological factors and to determine their contribution to identifying the best sites for dam construction;
(c)
To create a DSSM using the AHP approach of decision-making followed by overlay analysis.

2. Study Area and Data Collection

The Purna sub-basin, Figure 1, in the upper half of the Tapi basin is the principle affluent of the Tapi [16]. It is the only river in the upper basin with a perennial flow, rising in the Gawilgarh hills at an elevation of 900 m., north latitude of 21°38′00″, and east longitude of 77°36′00″ (21°5′45″ N 76°0′36″ E). The mean annual rainfall is 1596.8 mm. It originates in the eastern Satpura Range of southern Madhya Pradesh and flows westward, draining Maharashtra’s Vidarbha region before merging with the Tapi River, covering a total length of 334 km. The watershed, primarily situated in the western Vidarbha region of Maharashtra, spans approximately 18,929 square kilometers. The basin has several significant features, including a vast alluvial tract of Quaternary sediments covering 6522 square kilometers with variable lithological setups, a structural setup with resemblance to the major tectonic Son–Narmada–Tapi lineament zone, and occurrences of ash beds in the Quaternary successions, which aid in precise inter- and intra-basinal correlations and paleoclimate interpretations. The central alluvial zone, known as the saline track, spans 2900 square kilometers and is characterized by saline groundwater. The data used for the present study are listed in Table 1.

3. Methodology

The methodology adopted to identify suitable sites for dam construction is illustrated in Figure 2. The data to generate various thematic layers for the DSSM have been obtained from various sources (Table 1). In order to determine the ideal locations for dam construction, the examination of DSSM criteria necessitates examining a number of variables. The criterion evaluation process in MCDM approaches entails finding pertinent criteria, normalizing the data, allocating weights according to their significance, and scoring each alternative appropriately. After this, these weighted scores are added together to rank the alternatives and choose the best one. For the present study, nine thematic layers were developed: slope, elevation, geology, geomorphology, fault tectonic line, precipitation, stream order, land use and land cover (LULC), and soil. For a comprehensive explanation of the methodology, refer to [11].
In the analysis, qualitative variables like soil type and geomorphology were treated as categorical and converted into quantitative inputs using expert-based scoring. Each category was assigned a suitability score (1–9) based on a questionnaire survey of domain experts, academic researchers, practitioners, or a combination of these groups and the literature. Thematic layers were standardized using the Reclassify tool in ArcGIS, enabling their use in AHP pairwise comparisons to derive criteria weights for overlay analysis. Standardization, expert validation, and sensitivity analysis reduce the impact of any correlations between certain criteria.
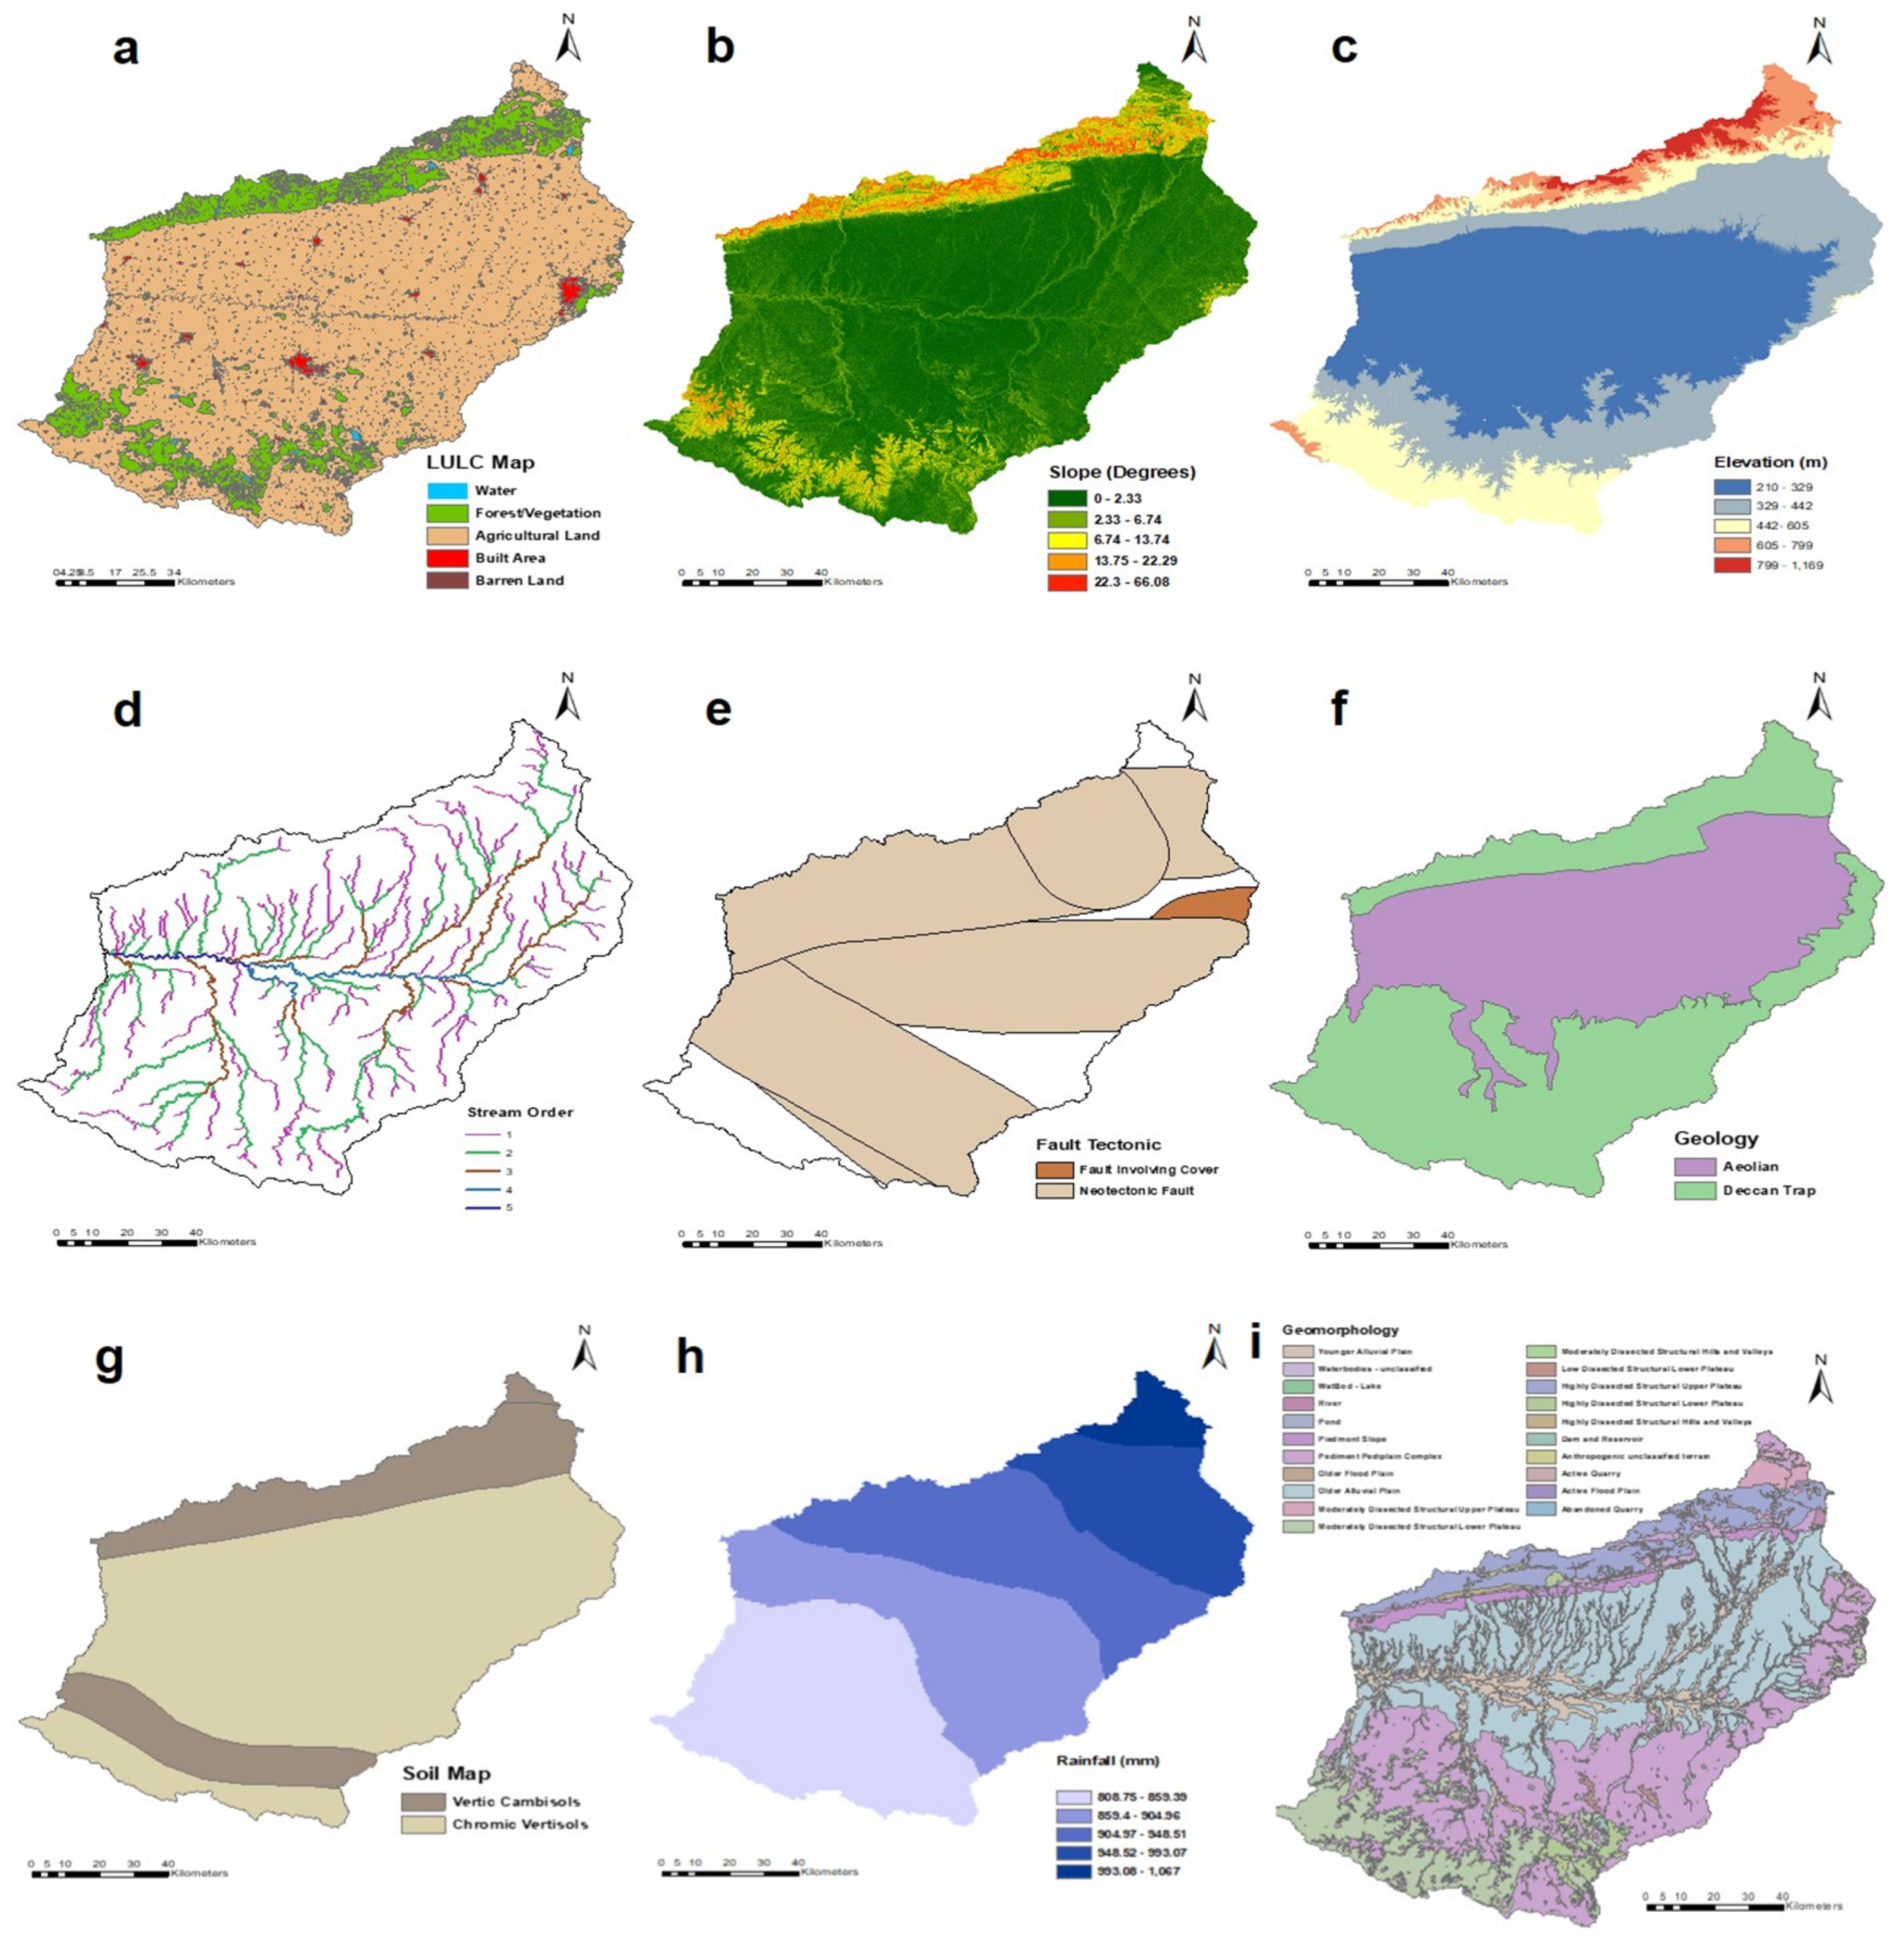
  • Elevation (m): The optimal position of the dam is influenced by the digital elevation model (DEM) as it has an impact on water circulation and accumulation. Building a dam at low levels has been considered appropriate due to the increased likelihood of precipitation and groundwater accumulation at such a level. An ASTER DEM of 30 m resolution was considered, and the elevation ranged from 210 to 1169 m.
  • Slope (degrees): Water velocity for both surface water and groundwater is influenced by the slope degree parameter, which suggests that the probability of water accumulation increases with decreasing slope. The slope map was generated using a DEM of 30 m resolution, and the values ranged from 0 to 66.08 degrees.
  • Geology: The produced geology map consists of Aeolian sand dunes and loess deposits and Deccan Traps, which are vast volcanic structures primarily composed of basalt. Most of the study region is covered by the Deccan Traps, which can be more conducive to water accumulation in certain areas. Hard rock formations like granite are preferred for structural stability.
  • Geomorphology: The geomorphology layer represents physical features such as concrete buildings, asphalt roads, and natural landforms, which were mapped as thematic layers. These layers were categorized into seven classes: urban areas, fan deposits, sand, mountains, vegetation, and high and low dunes. Alluvial plains are more suitable, while hills and valleys are less suitable.
  • Fault Tectonics (km): From higher to lower sites, the streamflow is directed based on the primary fracture line. There should be a minimum of 100 m between tectonic fractures and faults in order to select a feasible dam location. Areas having faults should not be included when determining the appropriateness of a dam site. The strength of the dam foundation is directly impacted by faults and cracks.
  • Precipitation (mm): The maximum discharge of a river occurs during periods of intense rainfall. Increased rainfall intensity results in elevated river water levels, hence augmented outflow. A map was created in ArcGIS by interpolating gridded data that were downloaded from IMD during a 30-year period, from 1992 to 2022, using the IDW tool. The quantity of rainfall in the present study ranged from 1067 mm in the north to 859 mm in the south region.
  • Stream Order: Surface water availability is a function of stream order, and certain structures like check dams, which need to be erected in lower-order streams, are better suited to a certain drainage order. The Strahler technique is the most often utilized approach which idealizes the drainage network as a tree with robust roots and slender branches. ArcGIS’s hydrology toolkit was utilized to create a stream network utilizing flow accumulation and flow direction rasters. However, these two approaches differ in how they identify distinct branch levels. Higher stream orders are preferred as they indicate better runoff accumulation.
  • Land Use and Land Cover (LULC): One of the most important factors is an area’s land cover, which reveals how the land is currently used and patterned as well as how important that use is in connection to the population and rate of population increase. Built-up areas are less permeable than water bodies, and land use and vegetation changes have the most impact on the water cycle, which is significant in the study region.
  • Soil Texture: The texture of the soil is defined as the ratio of sand, silt, and clay. Because the pores in sand-rich soils are significant, water may drain out of them without restriction. The rate of drainage is reduced in these soils. When the amount of clay in the soil rises, the pore space becomes smaller, which limits the flow of water through the soil and increases runoff. Vertic cambisols are low-weight soil types because they lack clay and exhibit strong penetration and minimal runoff production. Because of their high clay content, chromatic luvisols are weighted highly. Clay and other fine-grained soil foundations are sufficiently water-resistant and are recommended for dam building.

AHP Analysis

Prof. Thomas L. Saaty originated the AHP in 1990 as an MCDM tool [17]. This method helps decision-makers define priorities among choices, criteria, and sub-criteria during the decision-making process and supports them in producing the best conclusion feasible. To determine the percentage significance of the attributes utilized in selecting appropriate locations for water storage, the AHP is employed. Within a collection of reciprocal matrices, it contains pairwise parameters. These criteria are categorized on a scale of 1 to 9 based on the AHP scale that Saaty provided for pairwise comparison. If the associated consistency ratio (CR), Equation (2), is less than 10%, pairwise comparisons are considered consistent in the AHP approach. A Consistency Index (CI), Equation (1), which is calculated as follows, is defined to assess the CR coefficient:
C I = λ m a x n n 1
where λmax is the maximum eigenvalue for the pairwise comparison matrix.
C R = C I R C I
Only when the CR is less than 10% are the acquired data considered consistent, whereas when the CR is larger than 10%, the obtained data are considered inconsistent. Weights from the above table were entered into the tool’s “scale value” and “impact percent” settings. The spatial resolution of 30 m × 30 m and the corresponding weights were included in all raster layers. Stream order was included in the overlay analysis in the first stage. The second phase computed the stream order reciprocal using the Euclidean distance layer.

4. Results and Discussion

4.1. AHP Outputs

The weights assigned to each criterion in the pairwise comparison matrix of criteria were determined using the AHP technique. With the most significant weights, rainfall and stream order are the most crucial factors, as seen in Table 2, whereas the least significant factors include distance to a road and a fault line. The pairwise comparison alternatives were selected based on the locations and criteria. The weightage is obtained by multiplying the weight vector (Table 2) and alternative matrix (Table S1), which allocates values to each site according to the AHP technique. All pairwise comparison matrices are consistent, as indicated by the CR value for the study area being less than 10%. The various mapped thematic layers are shown in Figure 3. RCI and CI values for each matrix are obtained using Table S2 and Equation (1), and then, Equation (2) is employed to compute CR values, as seen in Table 3. The maximum eigenvalue is λmax = 10.327 (Table S2), CI = 0.036, and CR = 0.024 < 0.1. Thus, the calculations are acceptable.

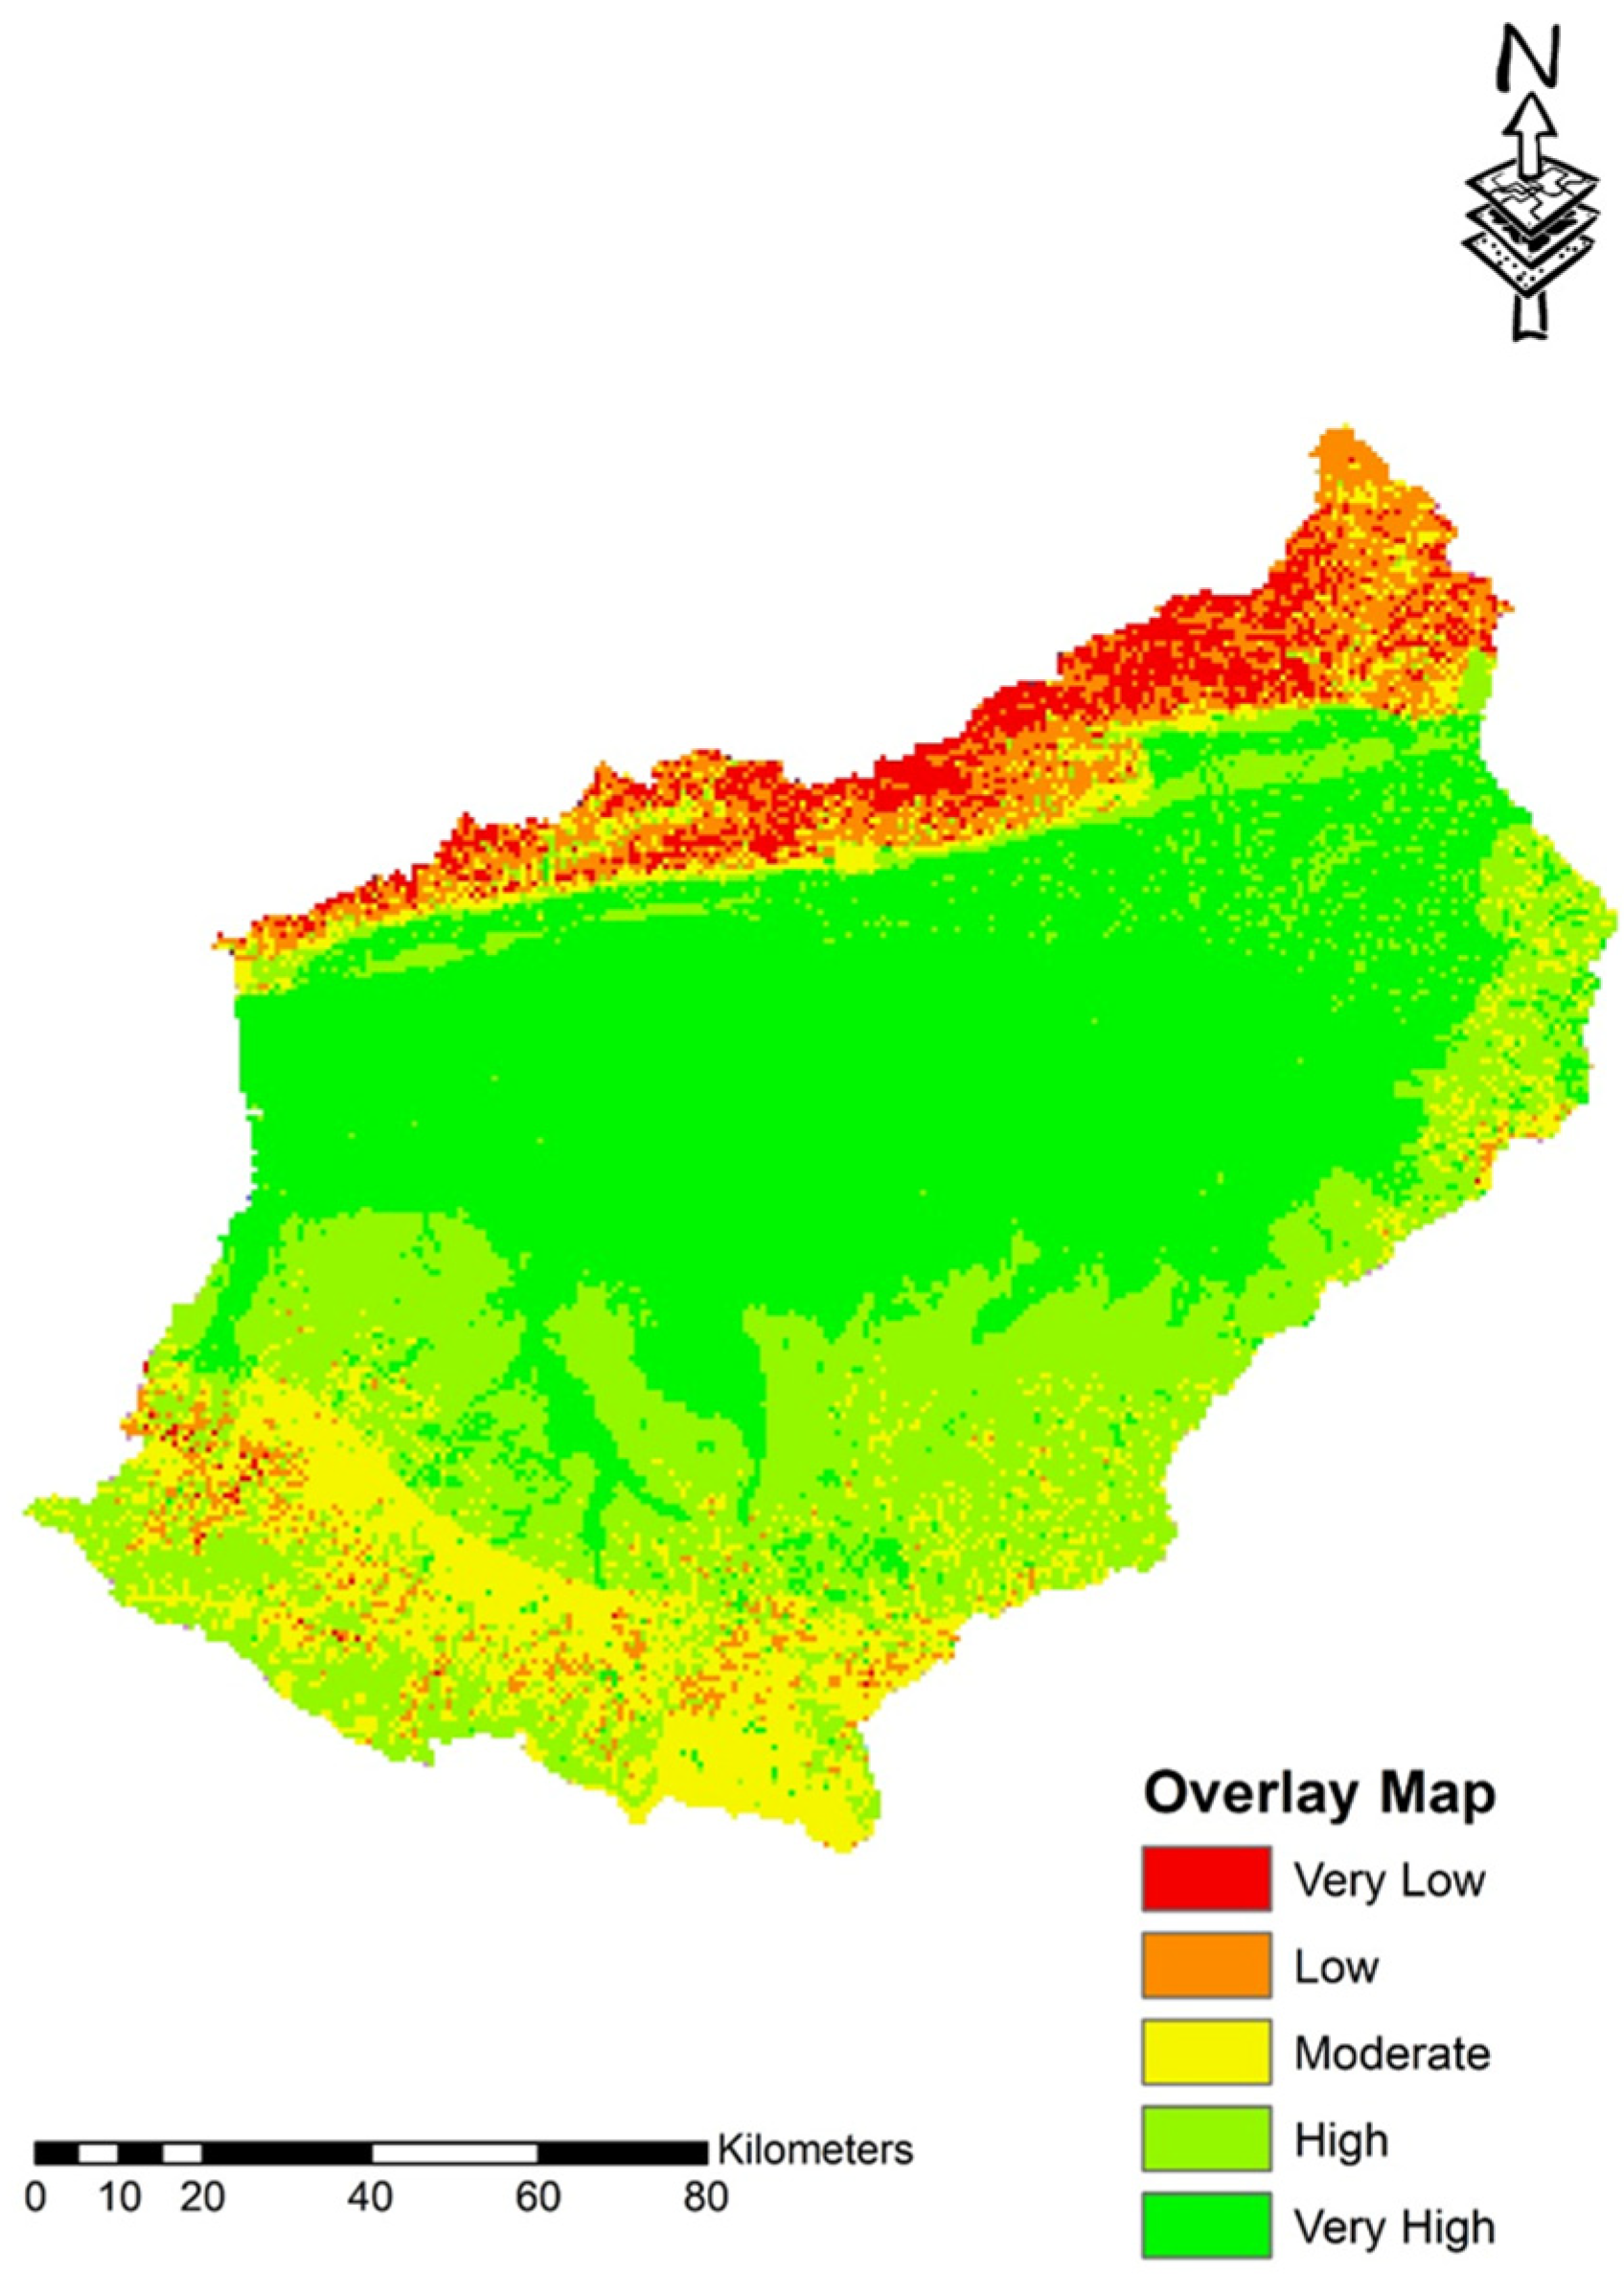
4.2. DSSM and Its Impacts

We obtained the DSSM by applying the weighted results of each AHP map to the ArcGIS overlay analysis. The map was generated with a reclassified raster layer that matches the pixel dimensions of the other layers in the overlay analysis, specifically 30 m × 30 m. A suitability map for dam construction in the Purna sub-basin, shown in Figure 4, was developed by overlay analysis, categorizing five distinct suitability levels: extremely low suitability, low suitability, moderate suitability, high suitability, and very high suitability.
In terms of the DSSM, it is noted that the majority of the region falls under the category of a very highly suitable region, indicating favorable conditions for dam construction. The northwest portion of the study region has extremely low suitability, whereas the south and southeastern regions represent a moderate level, showing that conditions in these areas are somewhat suitable, though not as optimal as in high- and very-high-suitability regions.

4.3. Limitations of the Study

  • The total priority is influenced by the importance assigned to each criterion. At this stage, it is essential to conduct a sensitivity analysis to see whether altering the parameters’ priority would affect the conclusion;
  • Validation of the obtained results with the existing dams in the Lower Tapi basin in the region should be performed to check the efficiency of the obtained model;
  • More criteria, such as the curve number and distance from a road, could be considered for the overlay analysis to obtain better results.

5. Conclusions

Choosing a dam location is complicated in terms of several factors. This investigation used the AHP as an MCDM technique. The AHP is a strong and flexible method that provides an integrated measurement of physical aspects with different priorities through pairwise comparison. To make the measurement and presentation more visually appealing, the AHP was implemented using the GIS. As one of the most prevalent GIS software globally, ArcGIS was employed as the software tool for this study. The DSSM was developed by evaluating 10 thematic layers, including rainfall, stream order, geomorphology, geology, elevation, slope, the fault tectonic line, soil, land use, and land cover. The results of this study can be used as a guide for concerned academics and engineers to decide where a new dam should be built in our study region. The newly developed technology, being more effective and cost-efficient, may be employed alongside established techniques to discover new dam construction sites. Despite hydrological and agroclimatic variations, the methods and analyses employed in this study are readily applicable in other regions of the world, particularly in developing countries, because they are non-specific. This approach may be used to identify possible places for various major watersheds and is more accurate and time-efficient. Additionally, it is possible to compute the dam’s maximum capacity at the chosen site.

Supplementary Materials

The following supporting information can be downloaded at https://www.mdpi.com/article/10.3390/eesp2025032021/s1, Table S1: Normalized pairwise comparison matrix using AHP for each criterion; Table S2: Maximum eigenvalue values (λmax) for each parameter.

Author Contributions

Conceptualization, S.Y. and U.M.; methodology, U.M.; software and formal analysis, M.D.V., A.S.T., U.R.T. and R.S.P.; investigation, S.Y.; resources and data curation, S.Y. and U.M.; writing—original draft preparation, S.Y.; writing—review and editing, S.Y. and U.M.; visualization, S.Y.; supervision, S.Y. and U.M. All authors have read and agreed to the published version of the manuscript.

Funding

On behalf of all authors, the corresponding author states that there is no funding for the present research.

Informed Consent Statement

Not applicable.

Data Availability Statement

Data will be made available on request.

Acknowledgments

The authors would like to acknowledge Indian Institute of Technology Roorkee for providing the necessary resources and support. We also thank the anonymous reviewers whose comments significantly improved this manuscript.

Conflicts of Interest

The authors declare no conflicts of interest.

References

  1. Pathan, A.I. AHP and TOPSIS Based Flood Risk Assessment—A Case Study of the Navsari City, Gujarat, India; Springer International Publishing: Berlin/Heidelberg, Germany, 2022. [Google Scholar]
  2. Bargav, S.; Muskula, R.; Yadav, S.; Mohseni, U. Application of Remote Sensing and GIS Techniques for Moni-toring Water Quality Parameters of River Brahmani. In Proceedings of the 5th International Electronic Conference on Remote Sensing, Online, 7–21 November 2023; Volume 7, p. 21. [Google Scholar]
  3. Al-ruzouq, R.; Hamad, K.; Shanableh, A.; Khalil, M. Infrastructure growth assessment of urban areas based on multi-temporal satellite images and linear features. Ann. GIS 2017, 23, 183–201. [Google Scholar] [CrossRef]
  4. Pathan, A.I.; Girish, P.A.; Patel, D. Integrated approach of AHP and TOPSIS (MCDM) techniques with GIS for dam site suitability mapping: A case study of Navsari City, Gujarat. Environ. Earth Sci. 2022, 81, 443. [Google Scholar] [CrossRef]
  5. Mohseni, U.; Muskula, S.B. Rainfall-Runoff Modeling Using Artificial Neural Network—A Case Study of Purna Sub-Catchment of Upper Tapi Basin, India. Environ. Sci. Proc. 2023, 25, 1–8. [Google Scholar]
  6. Lin, C.; Lin, C.; Hung, Y.; Chung, C.; Wu, P.; Liu, H. Application of geophysical methods in a dam project: Life cycle perspective and Taiwan experience. J. Appl. Geophys. 2018, 158, 82–92. [Google Scholar] [CrossRef]
  7. Pandya, U.; Patel, D.P.; Singh, S.K. A flood assessment of data scarce region using an open-source 2D hydrodynamic modeling and Google Earth Image: A case of Sabarmati flood, India. Arab. J. Geosci. 2021, 14, 2200. [Google Scholar] [CrossRef]
  8. Pradhan, A.; Srinivasan, V. Do dams improve water security in India? A review of post facto assessments. Water Secur. 2022, 15, 100112. [Google Scholar] [CrossRef]
  9. Nakamura, R.; Shimatani, Y. Regional Studies Extreme-flood control operation of dams in Japan. J. Hydrol. Reg. Stud. 2021, 35, 100821. [Google Scholar] [CrossRef]
  10. Gebre, S.L.; Cattrysse, D. Multi-Criteria Decision-Making Methods to Address Water Allocation Problems: A Systematic Review. Water 2021, 12, 125. [Google Scholar] [CrossRef]
  11. Rousta, B.A.; Araghinejad, S. Development of a Multi Criteria Decision Making Tool for a Water Resources Decision Support System. Water Resour. Manag. 2015, 29, 5713–5727. [Google Scholar] [CrossRef]
  12. Raaj, S.; Ibrahimkhan, A.; Usman, P.; Prasit, M.; Agnihotri, G.; Patidar, N. Dam site suitability analysis using geo-spatial technique and AHP: A case of flood mitigation measures at Lower Tapi Basin. Model. Earth Syst. Environ. 2022, 8, 5207–5223. [Google Scholar] [CrossRef]
  13. Shao, Z.; Jahangir, Z.; Yasir, Q.M. Identification of Potential Sites for a Multi-Purpose Dam Using a Dam Suitability Stream Model. Water 2020, 12, 3249. [Google Scholar] [CrossRef]
  14. Munier, N.; Hontoria, E. Uses and Limitations of the AHP Method; Springer International Publication: Berlin/Heidelberg, Germany, 2021. [Google Scholar]
  15. Talero-sarmiento, L.; Gonzalez-capdevila, M.; Granollers, A.; Lamos-diaz, H.; Pistili-Rodrigues, K. Towards a Refined Heuristic Evaluation: Incorporating Hierarchical Analysis for Weighted Usability Assessment. Big Data Cogn. Comput. 2024, 8, 69. [Google Scholar] [CrossRef]
  16. Srivastava, A.K.; Kale, V.M. Purna River, Maharashtra. In Indian Rivers; Springer: Singapore, 2018; pp. 479–507. [Google Scholar]
  17. Saaty, R. The Analytic Hierarchy Process What and How It Is Used. Math. Model. 1987, 9, 161–176. [Google Scholar] [CrossRef]
Figure 1. Index map of the study area.
Eesp 32 00021 g001
Figure 2. Methodology adopted for mapping DSSM of Purna sub-basin, inspired by [12].
Eesp 32 00021 g002
Figure 3. Thematic layers utilized in the present study: (a) LULC; (b) slope; (c) elevation; (d) stream order; (e) fault tectonic; (f) geology; (g) soil; (h) rainfall; (i) geomorphology.
Eesp 32 00021 g003
Figure 4. Dam site suitability map of Purna sub-basin.
Eesp 32 00021 g004
Table 1. List of data sources.
Data TypeData Source
RainfallIndian Meteorological Department
Digital Elevation Model (DEM) 30 m × 30 mASTER DEM
SoilFAO
Geology, Geomorphology, and Fault TectonicsBhukosh Portal
Table 2. Pairwise comparison matrix and weightage using AHP for each criterion [11].
ParametersRainfallStream OrderSlopeGeologyGeomorphologySoilLULCElevationTectonic Fault LineWeight (%)
Rainfall11233456825.665
Stream Order11233456825.665
Slope0.50.5122222412.06
Geology0.330.330.51122238.69
Geomorphology0.330.330.51122238.69
Soil0.250.250.50.50.511226.27
LULC0.20.20.50.50.50.50.5125.25
Elevation0.1670.1670.50.250.250.50.50.3334.7
Tectonic Fault Line0.1250.1250.330.330.330.50.50.513.01
Table 3. RCI values for various kinds of n [17].
n12345678910
RCI000.520.891.111.251.351.41.451.49
Disclaimer/Publisher’s Note: The statements, opinions and data contained in all publications are solely those of the individual author(s) and contributor(s) and not of MDPI and/or the editor(s). MDPI and/or the editor(s) disclaim responsibility for any injury to people or property resulting from any ideas, methods, instructions or products referred to in the content.

