1. Background on Research Evaluation in the UK’s Higher Education System
At the time of writing there are well over 100 universities in the UK’s large, diverse and competitive Higher Education (HE) landscape. They range from the ancient universities of Oxford and Cambridge to the post-1992 universities (also sometimes referred to as new or modern universities) created by the Further and Higher Education Act of 1992, which allowed polytechnics to acquire university status. Universities have come together to form groups such as the elite research-intensive Russell Group and the Million Plus Group, which acts as a voice for the country’s modern universities. University teaching and research are supported by a mixture of public funding and user charges, with the balance between these varying from one part of the UK to another. In Scotland, for example, undergraduate students studying at Scottish universities who meet the residential criteria do not pay course fees, unlike their counterparts in England and Wales.
Recent times have witnessed the rapid expansion of efforts by various public and private bodies across the globe to develop standardised approaches to the measurement of what is carried out in universities [
1]. Putting aside the difficulties inherent in trying to draw valid inferences from the data produced by Research Evaluation Exercises (REEs), it seems likely that access to more and higher-quality information ought to at least have the potential to improve the working of the higher education system. Students and academics may make use of the data when deciding where to study and work, and university managers may use it when deciding who to hire and fire. Few would question whether REEs have had a pronounced effect on the jobs and careers of academic staff, creating winners and losers. The process of linking research quality assessments to funding was ushered in by the creation of the University Grants Committee by the UK government of the time, an event which was soon followed by a research selectivity exercise in 1989. Subsequently Research Assessment Exercises took place in 1992, 1996, 2001 and 2008, with Research Excellence Frameworks (REFs) established in 2014 and 2021, with the next one planned for 2029. Universities submit their research to UOAs, of which there are many, e.g., in the 2014 REF there were 36 UOAs covering everything from Clinical Medicine to Communication Studies. The time period between REEs increased from 3 years between 1986 and 1989 to 8 years between 2021 and 2029. Early iterations focused solely on research outputs and measured quality using a single number, initially on a five-point scale, which was then increased to a seven-point scale to allow for greater granularity in quality distinctions. The 2008 RAE introduced research profiling, with percentages of research in each of the five categories (1*–4*, UC) being recorded. Though it retained the practice of research profiling, the 2014 REF fundamentally changed the way research quality was measured by adding the impact of research on the wider community and the research environment to the outputs. Critics argued that this led to dilution of the importance of academic quality in research assessment, while supporters stated that the change was long overdue and that the failure to capture the extent to which the research undertaken in universities benefitted those who funded it through their taxes was a serious shortcoming in the previous approach. REF2021 went further still when it raised the weighting attached to impact from 20% to 25%, and cut that attached to outputs from 65% to 60%, with the weight attached to the research environment unchanged at 15%. As well as what is measured and how it is measured changing, the way funding is allocated has also changed, with funding for research deemed by research panels to be at the lower end of the quality range being phased out and an increased share of funding being channelled to the highest-quality research. For those interested in a more detailed discussion of the evolution of the UK’s research assessment system, ref. [
2] provide an excellent account. REEs are not cost-free. Indeed, the latest REE in the UK (REF21) was estimated to have cost GBP 471 million [
3]. Given that there is no well-developed market for university research outputs, how, supposing it wanted to, the state would go about placing a monetary value on the data provided by REEs is open to question. Nonetheless, given that REEs are costly and the fact that the state is not obliged to undertake them, their continuation, assuming the state acts on a rational basis, must reflect a belief that the benefits conferred by REEs outweigh the costs. In addition to the financial costs of conducting the REE itself, there are many other costs, financial and non-financial, which have been the subject of a burgeoning body of literature dedicated to criticisms of the research evaluation process in the UK.
2. An Outline of the Pros and Cons of REEs
Though a detailed discussion of this extensive literature is beyond the scope of this paper, to put what follows in context, it may be useful to briefly outline some of the pros and cons of REEs, paying particular attention to how they have impacted the country’s business schools. Ref. [
4], in a scathing assessment of REEs, claims that they have “contributed to, and provided legitimacy for, a combination of work intensification, casualisation, tenure abolition and salary depletion” and that “they have become a potent mechanism for justifying the withdrawal of public research funding from an increasing proportion of academics and departments”. REEs, by reducing the diverse work of individuals, research groups and institutions to a number, have enabled greater commensurability within and between universities, e.g., a university can readily compare the quality of its ancient Sanskrit research with that of its work in Inorganic Chemistry. The research measures supplied by REEs make it easy for universities’ administrators to rank their staff and research groups, rewarding stars, punishing laggards and setting in motion a divisive dynamic which, if unchecked, could harm the very fabric of the institution. Interestingly, the ordinal quality of REE data seems to be more important than the cardinal dimension—being above or below a competitor is more important than the score itself. The putative objectivity and external nature of the process makes its judgements easy to internalise and difficult for universities and academics individually to challenge. Others bemoan the part played by REEs in the homogenisation of academic research along narrow mainstream lines with unorthodox approaches being further undermined and marginalised [
5,
6,
7]. Another group of critics argue that given the strong correlation between the results of REEs and how journals are rated in journal quality guides (JQGs) such as the ABS JQG, there is little information gained from REEs that is not already available for free from JQGs [
8].
On the other hand, proponents of REEs take the view that as good research may be published in low-ranked journals and poor research in high ranked journals, fairness and efficiency demand that REEs are carried out. Not only that, but to the extent that REEs provide a more accurate picture of research quality than those available from metrics or JQGs, they do have the potential to benefit all of those involved in the research process—funders, producers and users. Rather than the pre-REE elitist status quo continuing indefinitely, REEs offer a way for less prestigious universities and researchers to challenge the pervasive impact of history, reputation and brand image on them and their institutions. Moreover, the information on research quality allows the state, as a funder of research, to better understand how the funding it has provided has been used and enables it to channel funds away from what it regards as inefficient and provide them to efficient research producers and programmes: they may enhance allocative efficiency and accountability. From the point of view of the universities themselves, university researchers may behave opportunistically by seeking to exploit information asymmetries between themselves and university research managers [
9]. REEs, made up of independent subject experts, are well placed to provide information that allows university research managers to plug the information gap between themselves and researchers. Ref. [
10] state that “PVCs and REF managers find that submitting to the REF yields strategic intelligence about institutional and departmental performance, through external scrutiny and benchmarking, which complements ongoing performance management”. For researchers themselves, the results of REEs may help them to identify their own strengths and weaknesses.
In the case of the UK, the outcomes of REEs are linked to financial rewards, giving universities a financial motive to raise their research ratings. Whether the amounts of money involved are enough to raise the quantity and quality of research is an empirical question. Fortunately for us, it is a question on which there is a growing body of evidence. Ref. [
11], for example, using data on a range of academic disciplines across 31 countries, found that the adoption of performance-based funding systems (PBFSs) led to a short-lived increase in the quantity of research output. This study also revealed that although the introduction of an PBFS appeared to boost the average quality of research (where quality was proxied by the number of citations), they did not appear to increase the number of excellent articles (where excellence was proxied by the share of papers published in the top-ranked journals). In a later investigation into the impact of two iterations of Italy’s national research assessment exercise, [
12] established that the financial incentives inherent in PBFSs had induced a degree of convergence between and within universities, and that this was “…largely due to changes in the relative productivity of researchers who participated in both exercises as well as to hiring and promotions [that had] occurred between the two exercises”. University managers do appear to have responded to the change in financial incentives brought about by the introduction of PBFSs. In contrast, [
13], using research performance in the US as a synthetic control group, concluded that although the introduction of PBRFs had raised the number and quality of publications in the UK, they had not done so through increases in research productivity.
3. Research Gap, Aim and Motivation
Previous research by [
14,
15,
16,
17] has shown that the results of REEs in the UK appear to have had an influence on the future UOA submission decisions of UK universities. This paper builds on [
15] and attempts to plug a gap in the existing literature by assessing whether the use made of the research metrics which emerge from REEs varies from one subject to another. The comparators used in this paper are submissions to the BMS and E&E UOAs. The research reported in this paper has several aims and provides fresh insights into how REE scores have been used by university managers. Firstly, is internal or external relative performance most important to university research leads? Secondly, is there a cumulative impact of past research performance on future research submissions? Thirdly, is poor performance in one of the UOAs more likely to be tolerated by research leads than in the other? Fourthly, is there evidence of convergence in the quality of research outputs in the BMS and E&E UOAs? Lastly, is there a difference between new and non-new universities in their use of the results of REEs? The primary motivation for this research is to assess whether the increased significance attached to the results of REEs may have had the unintended consequence of hollowing out the position of the Economics and Econometrics discipline in the UK’s higher education system.
4. Assessing Research Performance Using REE Data
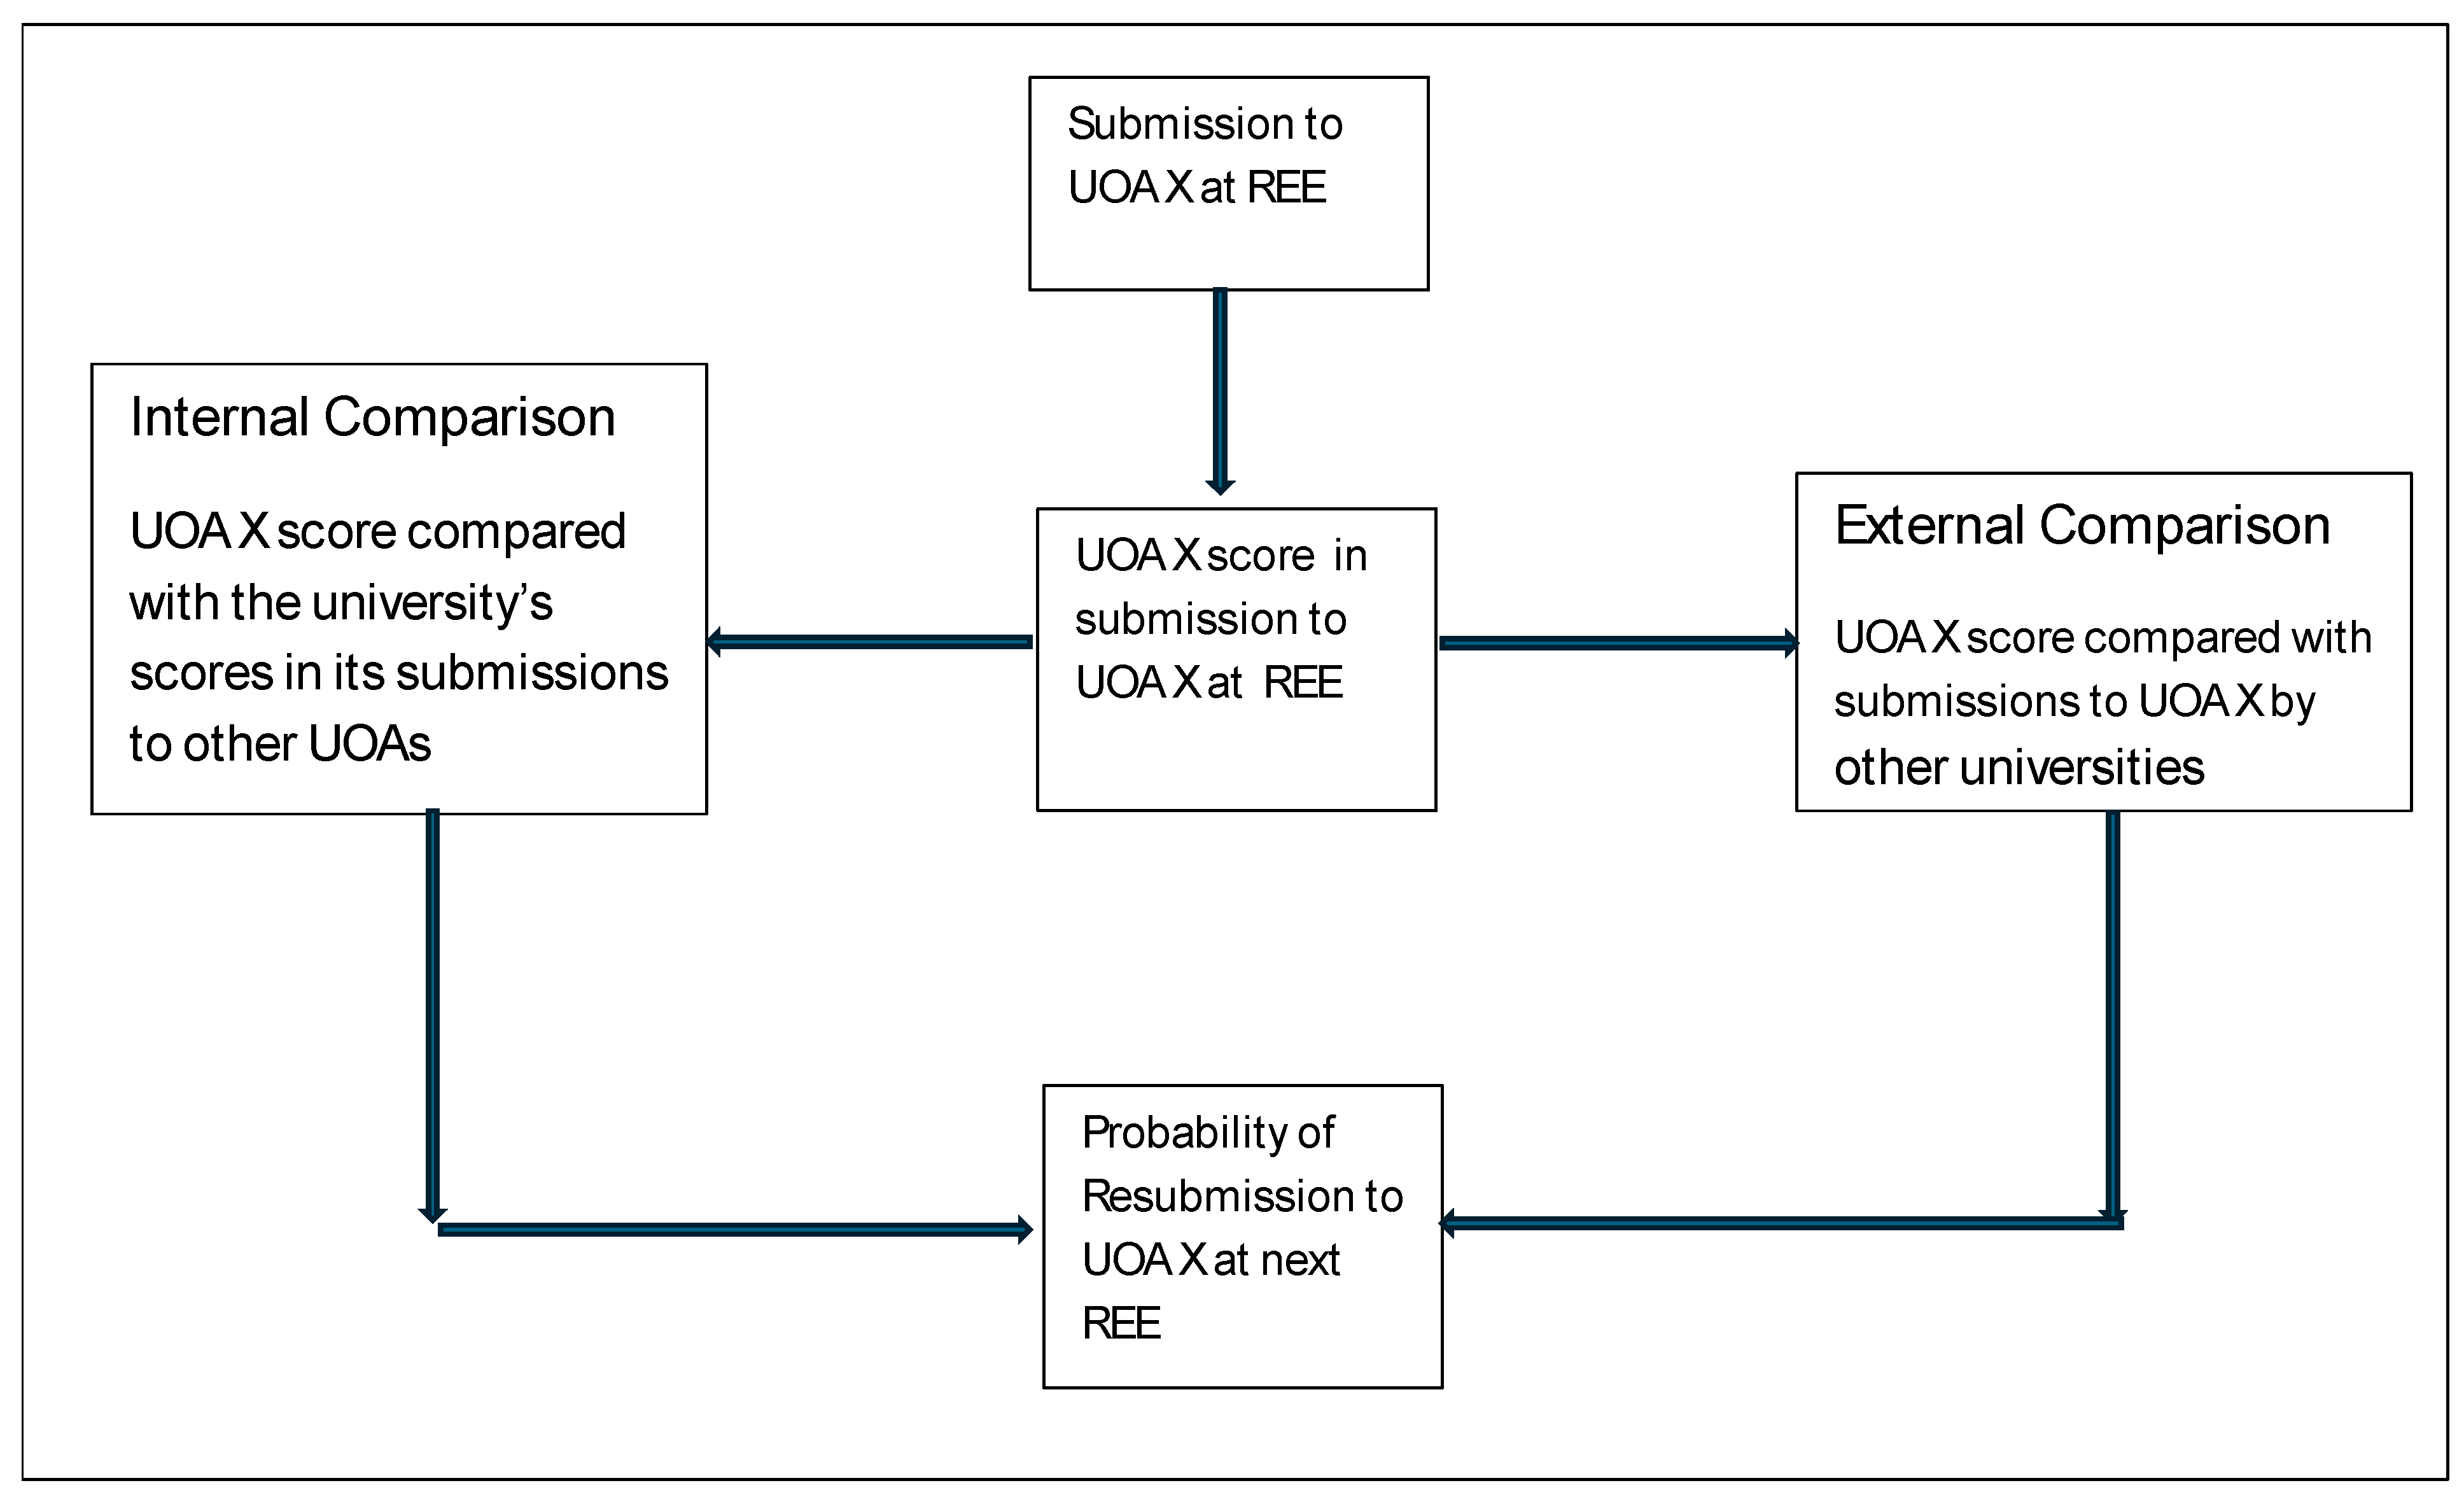
In this section of the paper, we make use of the novel theoretical approach developed in [
15] to explain how the management of universities might make use of the research data provided by REEs to measure research performance. Two broad approaches naturally suggest themselves: an inward or an outward looking one. The former would involve comparing how a university’s submission to UOA X compares with its submission to other UOAs. This would give the university useful information on how different sections of the university compare with each other in terms of research, allowing it to make better decisions about where it needs to channel its resources. An outward-facing approach would involve a university comparing its submission to UOA X with that of other universities which submitted to the same UOA. This has the advantage of showing the university how its researchers measure up against their rivals in the competition for research funding. The process of using an REE in a particular UOA when deciding whether to submit to the same UOA and the next REE is illustrated in
Figure 1 below.
Let us now be slightly more precise. For all the universities which submitted to the E&E or BMS UOA in UK REEs between 1992 and 2014, a grade point average (GPA) was calculated. The GPA was calculated by multiplying the percentage of research in each category by its rating (1–4), summing the values and dividing the result by 100. An institutional FTE-weighted mean GPA (
) was then calculated by multiplying the GPA for each UOA to which the institution had submitted by the number of FTEs submitted to that UOA, summing the values and dividing by the total number of
submitted by the institution:
where m is the number of UOAs to which the university has submitted, GPAij is the GPA in the ith UOA (i = 1….m) for the jth university, and FTEij is the number of full-time equivalent research staff entered in the submission to
in university j. This method was used to compute an FTE-weighted mean GPA for the BMS and E&E UOAs, recognising the need to weight the scores by the number of FTEs submitted in each of the UOAs by each university. The formula is
where n is the number of universities that submitted to the BMS or E&E UOAs, GPAj is the FTE-weighted mean GPA for the jth university in the BMS or E&E UOAs, and FTEj is the number of FTEs submitted to each of the UOAs by the jth university. As before, the sum of the products was divided by the number of FTEs to give the FTE-weighted mean GPA for each of the UOAs.
To compute the internal gaps the institutional FTE-weighted mean GPA (
) for each institution was subtracted from its GPAs for the BMS and E&E UOAs (
. This calculation was carried out for both the E&E and BMS UOAs.
As a practical example, the internal gap will be positive when the UOA score is higher than the overall university score, negative when it is lower and zero when it is the same. For example, a gap of +0.32 indicates that the UOA score was 0.32 higher than the average score for all UOAs in that university, and, conversely, an internal gap of −0.32 would indicate that the UOA score was 0.32 less than the overall average in that university.
The external gaps for a given UOA were found by subtracting the FTE-weighted mean UOA GPA from the UOA GPA.
A positive external gap ( signifies that a university is performing better than the average of all universities in the UOA, a negative gap that it is performing worse, and a gap of zero that it is at the average for all universities which submitted to the UOA. So, if the external gap in BMS for a given university is +0.50 then that university scores 0.50 higher than the average BMS score in all universities. If, on the other hand, it has an external gap of −0.5, it scores 0.5 less than the BMS average across all universities.
5. Interpreting the Gaps
Gaps can be positive, negative or zero. A double-positive gap in a UOA picks out a submission stronger than the average achieved by other groups at the same institution and other institutions in the same UOA. It is expected that such an outcome would raise the probability of entry into that UOA in the next REE. In contrast, it is expected that a double-negative gap would raise the probability of withdrawal from a UOA in the next REE. There are two other interesting possibilities: (i) a negative internal and a positive external gap; and (ii) a positive internal and a negative external gap. In the first case university managers would have to decide whether to move resources away from an area that is under-performing its internal peers but that is out-performing rival institutions. In the second case, although the university submission is poor relative to its external peers, it is nonetheless strong relative to other groups within its own institution. In this case it might be expected that such a group would retain resources.
The sensitivity of future submission decisions to REE scores is ultimately an empirical question. Some research leads may be more hawkish than others, being reluctant to put up with a poor research score. Others may take a softer approach, allowing struggling groups more time to improve their ratings. Other aspects of a university’s situation are likely to exert an influence the decision making of research leads. So, for example, discipline-specific investments (e.g., the appointment of staff on permanent contracts) made in advance of a poor set of REE results may make it costly in the short term for an institution to withdraw from that area.
Until now, the focus of the discussion has been on how universities might react to the results of one REE. However, REEs, at least in the UK, are not one-off events. Though universities may be willing to tolerate one instance of poor performance, they may be less inclined to put up with repeated poor performance. Though the circumstances of universities may be similar, they are all in a unique position, and as such, their reaction to any given REE scores is also likely to be unique. For instance, a university may continue to resubmit to the BMS UOA in all REEs despite performing poorly, or conversely, it may leave despite performing well. If we just consider those that have performed poorly and ask “when does a university decide to leave the UOA?”, an instance of poor performance after several instances of good performance may be seen merely as a blip and not a good reason to leave the UOA. On the other hand, two or three consecutive instances of poor performance might be enough to trigger withdrawal from a UOA.
A cursory analysis of UOA withdrawals from the BMS and E&E UOAs shows that the rate of withdrawal has been higher in E&E than in BMS. One explanation for this difference could be poorer performance on the part of E&E submissions. An alternative view may be that universities are less tolerant of poor performance in E&E than in B&M. To bring some clarity on which of these two competing hypotheses is most plausible, a dummy variable called Economics was entered into the estimated equation. Lastly, to evaluate the possibility that post-1992 universities (many of which are more teaching-oriented) react differently to the results of REEs when compared to pre-1992 universities (more research-oriented), a binary variable which distinguishes between the two groups is included as an explanatory variable.
6. Data and Sources
The results of the REEs [
18,
19,
20,
21,
22] which have already taken place in the UK are publicly available and broken down by institution and UOA. This rich source of longitudinal data allows for an examination of the relationship between the research score in one REE and submissions to the same UOA in the next or later REEs. For each of the five REEs covered by this paper [
18,
19,
20,
21,
22], the outcomes/results for the two UOAs in question—E&E and BMS—were extracted and entered into an Excel spreadsheet. This was possible for these two UOAs because they were generally unchanged in all REEs, having the same title and basically the same content in all REEs, save for one important exception. From 1992 to 2008, Accounting and Finance (A&F) was a separate UOA, but in 2014, it was incorporated into BMS as part of the process of trimming down the number of UOAs from about seventy to thirty-six. This was made easy because A&F was quite a small UOA with just fourteen universities submitting to it in 2008, with nine of these each entering eleven or fewer FTE Category A research-active staff. In view of these small numbers, it would have made sense to transfer them across to BMS, which already had the largest number of university entries and the most research-active Category A staff of all UOAs.
While the five REE websites were the most important sources of data, use was also made of two other sources, namely the Guardian newspaper and Times Higher Education, a weekly magazine that produces various rankings broken down by university and UOA. Both of these were used in this paper partly to check the authors’ calculations made using the REE data described above. Also used extensively were individual university websites. Over the course of the twenty plus years, that REEs that have been carried out the UK HE sector have changed in many ways. The institutions submitting to the first REE in 1992 were the traditional universities, but also polytechnics, specialist colleges and institutions in the likes of education, religion and agriculture, and Scottish Central Institutions. The Further and Higher Education Acts of 1992 converted many of these into universities, giving them degree-awarding powers, and the 21st century saw many smaller institutions awarded the title of university. All sources are robust and reliable, with no concerns over inaccuracies or missing data.
Given the binary nature of the dependent variable (stay/leave), the use of the least squares estimator (linear probability model (LPM)) would not yield best linear unbiased estimates (BLUE) of the model parameters. Fortunately, the problems associated with the LPM can be overcome by using limited dependent variable models such as the logit and probit models. Though these models differ primarily in terms of the assumption made about the distribution of the error term, in practical terms they yield very similar results [
23]. In this case, a probit model in which the binary dependent variable takes a value of one if the university resubmits to the UOA (resubmits) in the next REE, and zero otherwise (withdraws), is estimated by the maximum likelihood method.
7. Empirical Results
Table 1 shows estimates of the average values of the GAP measures derived above in the BMS UOA. These are calculated separately for stayers and leavers, where stayers are universities that resubmitted to the same UOA in the next REE, e.g., universities which submitted to the BMS UOA in 1996 and also submitted in 2001, and leavers are institutions which did not submit to the same UOA in the next REE, e.g., they submitted to the BMS UOA in 1996 but not in 2001. It is noteworthy that in all of the REEs examined, for both stayers and leavers, the sign of the internal gap (row 1) was negative. These figures suggest that submissions to the BMS UOA typically achieved lower scores than the same institution’s submissions to other UOAs in the same REEs. Row 1 of
Table 1 shows that the average internal gap for stayers was almost always lower than that for leavers, which is consistent with the hypothesis that the poorer the performance, the less likely a university would be to submit to the BMS UOA in the next REE.
Table 1 also shows that between the 2001 and 2014 REEs, the average internal gap for both stayers and leavers, though negative, became smaller with each successive REE. This indicates that between the 1996 and 2014 REEs, the quality of BMS research seems to have caught up with that in other areas of the same university. Two explanations of this convergence suggest themselves. Firstly, if the research of lower-quality research groups was less likely to be submitted to a UOA in the next REE, then the standard of the average submission to that UOA would (all else being equal) increase with each successive REE. Secondly, if universities reacted to poor REE results by placing greater weight on research prowess when it came to recruiting staff, then the quality of research submitted to the UOA would increase (all else being equal).
This process of research ‘catch up’ in BMS is clearly encouraging for the institutions involved. Indeed, for universities which submitted to the BMS UOA in the 2014 REF, the lagged internal gap in the 2008 REE for stayers, though negative, was very close to zero. It is also noteworthy that the lower the value of the external gap, which measures how a university’s submission compares with the submissions of other universities to the BMS UOA, the lower the likelihood of a university submitting to the BMS UOA in the next REE. Once again, this is consistent with what would be expected. No university wants to be ranked low compared to other institutions, particularly those it sees as its rivals, and one way of avoiding this fate is to withdraw from the UOA. So, both the internal and external gaps appear to be related to the decision on whether to resubmit to the BMS UOA in the next REE.
Table 2 shows the same figures as presented in
Table 1 for the BMS UOA for submissions to the E&E UOA. The difference between the E&E figures and those for the BMS UOA is stark. In the E&E UOAs, stayers had a positive lagged internal GAP at all REEs, indicating that those institutions that submitted to the next REE performed better than other groups within the same institution. In contrast, leavers had negative average internal gaps in all but the last REE. In the 2014 REF, the average internal gap for leavers was positive and close to zero, suggesting that performing marginally better (0.044) than internal peers was not enough to ensure submission to subsequent REEs in the E&E UOA, which contrasts with the average internal mean for stayers in the BMS UOA of −0.076. The fact that the leavers in the E&E UOA in the 2014 REF performed better than the stayers in BMS relative to their internal peers speaks to a difference in terms of how institutions react to research scores in the two UOAs.
The link between average scores and future submission decisions also appears to be stronger in the E&E UOA than in BMS. The descriptive statistics presented above suggest that research quality, whether measured according to the internal or external gap, carried greater weight in E&E than in BMS when it came to future submission decisions. Universities with research scores in the E&E UOA which were lower than those earned in submissions to other units by the same institution (i.e., a negative internal gap) were less likely to submit to the E&E UOA in the next REE. Similarly, institutions where the scores for submissions to the E&E UOA were below the average of the scores for all submissions to the E&E UOA (i.e., a negative external gap) were also less likely to be included in the UOA in the next REE. This differs markedly from the case of the BMS UOA, where institutions often appear to continue to submit to the UOA even though they may have performed poorly compared to other institutions and other groups within their own institutions. In E&E, continued submission seems to require submissions be strong relative to submissions from the same institution to other UOAs, but also relative to submissions from other institutions to the same UOA. More stringent internal and external comparisons seem to be applied in the case of E&E. The lower value for the internal gap in the previous REE among leavers in E&E when compared to BMS means that universities that pull out of E&E and remain in BMS are likely to see their BMS scores boosted.
To investigate whether these associations held up in a multivariate context, a probit model was estimated, the results of which are shown in
Table 3. The model specified in column 1 explores whether the sign—as opposed to the size—of the lagged internal and external gaps was associated with the UOA stay/leave decision. The positive sign of the coefficient for both variables indicates that a positive sign on both gaps (internal and external) was associated with a higher probability of submitting to the same UOA in the next REE. Note that a positive internal gap indicates research which was deemed higher in quality than that carried out by other parts of the same institution in any REE. Likewise, a positive external gap indicates research which is rated more highly than that submitted by other institutions to the same REE. Unlike the internal gap variable, the external gap variable is significant at the 1% level. Not only that, but the value of the coefficient of the external gap variable is higher than that of the internal gap variable. Interestingly it would appear that external comparisons are more important in the determination of resubmission decisions than internal ones.
Column 2 explores whether the size of the gap had an effect on the resubmission probability over and above that exerted by the sign of the gap. Once again, the sign of the external gap variable remained significant and positive. It emerges that the size of the external gap was also significant and positively signed, i.e., the higher the research is rated relative to that of other institutions submitting to the same UOA, the more likely the university is to submit to the same UOA in the next REE. The size of the external gap reinforces the effect of the sign on the probability of resubmission to the same UOA. In contrast the results on the internal gap variable were less clear-cut. On the one hand, the sign of the internal gap variable in the previous REE was positive but not significant, indicating that good performance relative to internal peers increased the probability of being resubmitted in the next REE in the same UOA. This is in line with what is expected. However, the size of the internal gap appears to have had a negative and significant effect on resubmission probability, suggesting that performing better than internal peers make a group less likely to submit to the same UOA going forward. The sensitivity of the reactions of universities to the information provided by REEs is tested in column 3, with the inclusion of the average of the accumulated internal and external gaps in each REE and the average accumulated gap scores across all REEs. Here, again, the external gap emerges as the more important factor in decision making. There are clear reasons as to why this result is not unexpected. Groups that run persistent positive external gaps are likely to build up a good reputation within and outside their institutions and so be less likely to be pulled from their UOA. Not only that, but given the link between quality and funding, they are likely to be the recipients of resources that can be used to strengthen their groups, a version of Merton’s “Matthew effect” [
24].
The inclusion of new (post-1992) university and subject dummies add significantly to the explanatory power of the model. Universities that submitted to the E&E UOA were much less likely to submit to the unit in the next REE, after controlling for relative research performance, as measured according to internal and external gaps. This is consistent with the idea that universities apply a higher threshold to research in E&E than to research in BMS. Furthermore, it seems that new (post-1992) universities are more likely to stay in a unit in the next REE than their traditional (pre-1992) counterparts. On this point it should be noted that by 2014, there were no submissions to the E&E UOA from post-1992 universities. Only a small number of new universities ever submitted to the E&E UOA in the past, and they tended to perform poorly. Ref. [
16] showed that there was a link between poor research scores and the withdrawal of programmes in Economics. Whether this matters or not is open to debate. However, it does appear that weak REE performance does seem to have been a factor in the withdrawal of undergraduate programmes in Economics. One of the reasons this might matter is that new universities are the primary conduit through which students from lower socio-economic backgrounds access the UK HE system. The trends that have been described may result in the lack of ability of students from lower socio-economic backgrounds to study a subject as important as Economics. The serious study of Economics is at risk of becoming restricted to the elite in elite UK universities.
8. Implications of the Model
If the decisions of university research leads are consistent with this model, then the steady state, that is, the state in which there is no further pressure for resources to be reallocated, in the long run, would involve only one university submitting to each UOA, with that institution’s research score being the average for the UOA as a whole. In these circumstances this “last institution standing” would have no external gap, though it would still have a positive, negative or zero internal gap. The last of these three cases—a zero internal and external gap—would occur if the university was not only the only institution to submit to a particular unit, but also if that UOA was the only one that it submitted to. Though there were some specialist institutions that submitted to a single UOA (e.g., LBS only submitted to BMS), there have been, as yet, no UOAs that have received only one submission. In the short to medium term, the model points to a narrowing of the number of UOAs to which universities submit. The results of this study reinforce those of other studies which have found that REEs have contributed to the emergence of a dominant, small, elite group of Economics departments focused on mainstream economics in the UK [
5,
6].
To the extent that decisions on what research to support depends on factors other than relative research performance, as measured in REEs, the rather bleak long-term prognosis offered by the model may not materialise. The findings reported here are consistent with the possibility that universities may continue to conduct research in areas even though their research scores in REEs place them at the lower end of the unit’s rankings. It may be the case that at some point, it is better to be ranked lowest among an elite group than not to be ranked at all. Universities always have the option of not submitting. The need to be seen to offer certain sorts of subjects might also help offset this trend, with elite universities continuing to research subjects such as E&E even when their scores in these disciplines fall short of what they would like. Moreover, factors such as the ability of institutions to attract fee-paying students to these areas even in the absence of a strong research track record or to generate income from other sources, such as commercial consultancy, may introduce an element of inertia to the system, slowing down the rate at which it moves to long-term equilibrium. To the extent that there are diminishing returns on investments in research into UOAs this will limit the tendency for resources to be continuously moved from lower- to higher-performing units. Yet in UOAs, where measures of research performance in REEs is of paramount importance (and the evidence presented here suggests that E&E may well be one of these disciplines), the model is likely to be a closer fit to what happens in practice. The fact that only a small number of institutions (mainly the Russell Group) were submitted to E&E in REF2014 suggests that it has already travelled a long way along this road and that E&E has become the preserve of the academic elite. Whether this continues will be revealed when we see the next group of submissions.
9. Limitations
Critics of the approach set out above might regard the idea that university research leads actually calculate internal and external gaps and then use them as the basis for decisions on future REE submissions somewhat fanciful. Two responses to this criticism come to mind. Firstly, do universities use REE scores at all when making decisions on where to submit in future REEs? Secondly, if past REE scores do influence future submissions, how do they enter into the decision-making process? In relation to the first question, though possible, it seems implausible that universities would attach a weight of zero to the results of REEs when making decisions on future REE submissions. To do so would see them continue to submit to UOAs where the research has already been identified as weak. Such an approach would also see research in any areas identified in REEs as strong denied the resources needed to develop. Just as it is improbable that REE scores would not play any role whatsoever in the direction of research in a university, it is equally unlikely that future research submissions will be influenced solely by past REE scores. Rather, past REE scores and other factors probably influence the decision making of research leads when deliberating on future REE submissions. The question is “how much weight is attached to REE scores and other factors in these decisions?” Given the well-documented growth of managerialism in the increasingly competitive, market-based higher education system found in the UK, this seems unrealistic [
25,
26,
27]. In relation to the second question, internal and external gaps are but two of many possible ways of using REE data to judge research quality. So, even though research leads may not react to the latest set of REE results by calculating internal and external gaps, the fact that the gaps appear to be correlated with future submission decisions suggests that they may act
as if they do. Ref. [
28] described how billiard players, when carrying out a shot, will probably not be aware of, never mind understand, the mathematical equations which capture the relationship between factors such as the force, direction and angle of the shot required to make it optimal; they “just figure it out”. Research leads may behave in a similar way. Whether it is desirable for REE scores to be used in the way outlined above is a normative question and one on which different people will hold different views. So, if they were used to justify the closure of your group, you would probably be critical of using them this way, but if they were used to justify an increase in your funding, you may think they are a great idea.
Another complication in the approach outlined above is that it is not entirely clear what withdrawal from a UOA means for those who teach and research the discipline involved. On the one hand, it could presage the closure of programmes, with staff redeployed or released. Academic staff may be pressured into researching different areas. On the other hand, pulling out of a UOA does not necessarily mean the university has decided to disinvest completely from research in that area. It could mean that teaching and research continue in the same vein but that the work produced is simply submitted to a different UOA. In the UK, work deemed to be related to Economics or Econometrics by the BMS panel is automatically sent to the E&E panel for assessment. Interestingly, the E&E panel at the 2014 REF [
29] concluded that “…on average, outputs submitted directly in UOA 18 [E&E] were assessed to be of a higher quality than those cross-referred from Sub-panel 19 [BMS]”. Nonetheless, if a university had, but no longer has, a research rating in a subject, it is difficult to see how that can have anything other than negative implications for the status of the subject and those involved in teaching and researching it within the institutions and across the higher education sector.
Though the focus of this model is clearly on the effect of the gaps on future UOA submission decisions, the authors recognise that there are likely to be many other factors which influence that decision, but which are not included in the regressions, and that this may introduce an element of omitted-variable bias into the parameter estimates for those explanatory variables which have been measured and enter into the regressions. Reputational considerations may mean a university continues to submit to the E&E UOA when research cores in REEs are poor if they believe that not doing so would be detrimental to their standing as a seat of learning. It is worth commenting that almost all of the UK universities which continue to submit to the E&E UOA are members of the elite Russell Group. Dropping out of submitting to the E&E UOA may be regarded by members of this prestigious club as akin to dropping out of the Russell Group itself. The popularity of and financial income attached to courses in E&E will probably be traded off against research performance in REEs when it comes to deciding on whether to drop out of the UOA going forward. So, poor REE scores are more likely to be tolerated if student numbers remain buoyant. There are many other factors which will all go through the all-important internal political process when it comes to making these sorts of decisions. It is very difficult for researchers to obtain access to accurate data on these sorts of factors, though this may be a fruitful avenue for future research. Likewise, the generalizability of this approach to Research Evaluation Exercises outside the UK is open to question.
10. Conclusions
It appears that the data provided by formal REEs has had far-reaching effects on the UK higher education system, setting in motion a process which has led many UK universities to retreat from the E&E UOA. Though the empirical findings of this study suggest that both internal and external gaps play a role in determining the probability of resubmission, the evidence suggests that comparison with the other institutions submitted to the same UOA (the external gap) is most important. Repeatedly poor performance heightens the risk of withdrawal. The data also suggests that universities are more willing to tolerate weak relative research scores in BMS than in E&E, where the likelihood of withdrawal is higher for any given level of research performance. Taken together these factors are contributing to the radical reshaping of the UK higher education landscape. In particular, the introduction of formal Research Evaluation Exercises may have had the presumably unintended consequence of narrowing access to the study of Economics at the university level for students from disadvantaged backgrounds.


