Article

Thermodynamics Analysis of Cryogenic Supercritical Hydrogen Storage System Based on Multi-Stage Joule–Brayton Cycle

by
Ruiqi Wan
,
Tenglong Yue
,
Jingxuan Xu
*,
Wenjie Wu
,
Xi Chen
and
Binlin Dou
School of Energy and Power Engineering, University of Shanghai for Science and Technology, Shanghai 200082, China
*
Author to whom correspondence should be addressed.
Submission received: 24 February 2025 / Revised: 7 April 2025 / Accepted: 11 April 2025 / Published: 25 April 2025
(This article belongs to the Special Issue Efficient Production, Storage and Transportation of Liquid Hydrogen)

Abstract

:
The cryogenic supercritical hydrogen storage system offers notable advantages including heightened hydrogen storage density and operation under relatively moderate conditions compared to conventional hydrogen storage methodologies. In this study, a cryogenic supercritical hydrogen storage system based on the multi-stage Joule–Brayton refrigeration cycle is presented, analyzed, and optimized. The proposed system employs a five-stage cascade cycle, each stage utilizes a distinct refrigerant, including propane, ethylene, methane, and hydrogen, facilitated by Joule–Brayton cycles, with expanders employed for mechanical work recovery, which is capable of effectively cooling hydrogen from ambient temperature and atmospheric pressure to a cryogenic supercritical state of −223.15 °C (50 K), 18,000 kPa, exhibiting a density of 73.46 kg/m3 and a hydrogen processing capacity of 2 kgH2/s. The genetic algorithm is applied to optimize 25 key parameters in the system, encompassing temperature, pressure, and flow rate, with the objective function is specific energy consumption. Consequently, the specific energy consumption of the system is 5.71 kWh/kgH2 with an exergy efficiency of 56.2%. Comprehensive energy analysis, heat transfer analysis, and exergy analysis are conducted based on the optimized system parameters, yielding insights crucial for the development of medium- and large-scale supercritical hydrogen storage systems.

1. Introduction

The rapid development of human society and the continuous improvement of industrial levels have resulted in a concomitant increase in the total amount of energy used by human beings. According to U.S. Energy Information Administration (EIA), the world’s energy consumption will increase by nearly 50 percent from 2022 to 2050. The fossil fuels available on Earth are limited, and many countries will face the problems of energy shortage and even energy exhaustion in the future [1]. Thus, the search for a new alternative energy has become the world’s current priority.
Hydrogen is regarded as a viable alternative to fossil fuels due to its status as a clean energy source with zero carbon emissions, environmental benefits, and other properties. It possesses a high calorific value, high energy density, and a wide range of sources [2,3,4]. Consequently, it is poised to become a significant energy carrier in the future [5]. However, the utilization of hydrogen is currently hindered by several challenges, including the need for cost-effective production, safe storage and transportation methods, and large-scale application [6]. At present, the major application of hydrogen is in the field of transportation, with its energy density being approximately three times that of gasoline [7]. Despite hydrogen’s higher gravimetric energy density compared to gasoline, its density (mass/volume) is relatively low at normal temperature and pressure. This results in a much lower volumetric energy density than gasoline, thereby limiting the driving range of vehicles. Research in the field of hydrogen storage systems is predominantly focused on the development of high-density storage solutions.
At present, there are three main methods of hydrogen storage [8,9]. The most widely used of these is high-pressure gaseous hydrogen storage, whereby hydrogen is compressed to a very high pressure for storage. The pressure in the gas cylinder is usually about 35,000 to 70,000 kPa [10]. The container is required to have high pressure resistance, which is a more dangerous aspect. Liquid hydrogen storage entails cooling hydrogen to a temperature below its boiling point, rendering it liquid for storage [11]. Under atmospheric pressure, the density of liquid hydrogen is 800 times that of hydrogen at room temperature. However, the liquefaction process is complex, necessitating a catalyst, high energy, and cost [12]. Chemical hydrogen storage encompasses solid material hydrogen storage, metal hydride storage [13], and organic storage. While it possesses a substantial volume density, the absorption and discharge of hydrogen are sluggish, and the technology is not yet mature [14].
Cryogenic supercritical hydrogen storage technology represents a novel approach to hydrogen storage, founded on the research into liquid hydrogen [15]. At temperatures and pressures that exceed the critical point (where temperature is −240 °C, pressure is 1296 kPa), hydrogen exists in a supercritical state [16]. The density of gaseous hydrogen is 40.19 kg/m3 at 14.85 °C and 70,000 kPa, while liquid hydrogen at −253.15 °C and atmospheric pressure has a density of 71.28 kg/m3. Notably, cryogenic supercritical hydrogen can achieve densities comparable to liquid hydrogen, even reaching 80 kg/m3. This state of hydrogen exhibits both a high density, comparable to liquid hydrogen, and a fluidity that is similar to gaseous hydrogen. The adoption of this technology offers distinct advantages over conventional gaseous and liquid storage methods due to its ability to operate under comparatively mild conditions during the absorption and release of hydrogen.
In the liquid hydrogen storage system, the problem of ortho–para hydrogen conversion must also be given due consideration [17]. At room temperature, hydrogen exists in an ortho–para equilibrium state, with 75% of the hydrogen being normal hydrogen. Following the liquefaction process, the ortho hydrogen undergoes a gradual conversion into para hydrogen. The energy released by this transformation (525 kJ/kg) exceeds the latent heat of hydrogen vaporization (447 kJ/kg), which results in a liquid hydrogen phase transition [17,18,19]. Therefore, ortho–para conversion must be carried out in the hydrogen liquefaction system, which leads to huge energy consumption. However, the ortho–para conversion rate in supercritical hydrogen is extremely slow [20]. For some application scenarios that do not require long-term storage of hydrogen, such as in hydrogen-powered vehicles, an ortho–para converter is not necessary. A lot of energy consumption can be reduced without using the converter.
To date, there has been a paucity of research on the storage of supercritical hydrogen, in contrast to the extensive research that has been conducted on liquefaction hydrogen. However, the two processes are analogous. Consequently, a novel cryogenic supercritical hydrogen storage system could be designed based on the extant hydrogen liquefaction systems.
Dewar first produced liquid hydrogen through a J-T valve in 1898 [21], but the output was very low. The improved hydrogen liquefaction system mainly includes the pre-cooled Linde–Hampson system [22], the Claude system [23], and the helium-cooled hydrogen liquefaction system [24]. The current hydrogen liquefaction cycle generally includes a pre-cooling part and a cryogenic part. Nitrogen and helium are generally considered safe, non-toxic, non-polluting, and non-combustible, and are typically employed as refrigerants for pre-cooling cycles. Presently, large-scale hydrogen liquefaction units in many factories utilize nitrogen pre-cooling.
As illustrated in Table 1, a comparison has been made of the energy consumption and exergy efficiency of representative hydrogen storage systems of various types. It is important to note that some of these processes do not take into account the effect of ortho–para hydrogen conversion. The SEC of existing liquid hydrogen production plants typically ranges from 11 to 15 kWh/kg [25]. It is equivalent to 33–45% of the low calorific value of hydrogen, resulting in a huge cost of hydrogen storage. The latest research focus is to reduce the energy consumption of hydrogen storage.
Tang Lu [26] designed a hydrogen liquefaction process with a liquefaction capacity of 50 t/d, in which the pre-cooling circulating refrigerant is nitrogen and the cryogenic circulating refrigerant is helium. The exergy efficiency is 38.52% in the case of J-T valve and 40.17% in the case of expander. Neon is regarded as having superior properties in comparison with helium and is frequently utilized as a refrigerant in pre-cooling cycles. In another case, Quack [27] proposed a Claude system pre-cooled by Joule–Brayton cycle, and the cryogenic section refrigerant was helium–neon, with an exergy efficiency of 60%. The SEC ranges from 5 to 7 kWh/kgH2, and varies with the temperature pressure of the feed gas and the product.
Hydrogen liquefaction systems can be combined with liquefied natural gas (LNG) systems in plants producing hydrogen from natural gas, with the purpose of pre-cooling hydrogen by LNG [22]. For instance, Cao Xuewen et al. [28] proposed a new pre-cooled dual-pressure Linde–Hampson hydrogen liquefaction system, utilizing LNG as the refrigerant. In the cryogenic section, the hydrogen is cooled through expansion refrigeration as well as heat transfer cooling. In this system, the SEC is 9.802 kWh/kgH2 and the EXE is 41.4%. In the context of concurrent natural gas and hydrogen production and transportation, Xu et al. [29] proposed a multi-stage multicycle cascade (MMcascade) refrigeration system for the simultaneous production of LH2 and LNG, utilizing hydrogen–methane mixtures as feedstock. The system integrates a mixed refrigerant (MR) cycle for pre-cooling and four-stage cascade cycles for cryogenic cooling, achieving an SEC of 14.0–17.4 kWh/kmol. The process demonstrates high exergy efficiency (33.6–41.45%) and excellent product purity, with LH2 and LNG recoveries exceeding 99%. The MR cycle optimization has been shown to significantly reduce complexity and energy consumption, particularly in scenarios with high hydrogen content.
In the domain of liquefied natural gas and liquid hydrogen, the concept of mixed refrigerant (MR) has garnered significant attention. It is noteworthy that such a refrigerant does not possess a specific boiling point. Refrigeration systems based on the Joule–Brayton cycle exhibit analogous characteristics. The absence of phase change in a Joule–Brayton cycle is attributable to the gaseous state of the refrigerant. This property serves to diminish the temperature differential between streams, thereby enhancing the efficiency of the heat exchanger and mitigating the loss of exergy. Following its passage through the expander, the refrigerant’s temperature is reduced to enable its use as a cooling medium, without lowering it to a level that might induce liquefaction. The effectiveness of MR is further substantiated by the results of Yujing Bi’s work [30], where a configuration employing helium expansion with MR pre-cooling was devised and optimized. The SEC of this liquefaction process is 9.703 kWh/kgH2, which is evidently less than the processes with LN2 pre-cooling, and the EXE and COP are 39.1% and 0.1333, respectively.
The utilization of MR in the LH2 processes has been the subject of extensive research. Hojat Ansarinasab [31] et al. developed a cascaded system comprising five cycles, of which four are single refrigeration cycles and one is an MR cycle. Advanced exergy and exergoeconomic analyses were conducted. The findings of this study indicated that the pressure ratio of compressors and the performance of heat exchangers exert the most significant influence on the exergy destruction cost rate of the system, while the impact on cost is predominantly exerted by compressors and coolers.
Sun et al. [32] proposed a cascaded dual-mixed refrigerant hydrogen liquefaction process, which was optimized using the particle swarm algorithm. The process integrates pre-cooling and sub-cooling cycles, achieving an SEC of 5.664 kWh/kgLH2 and an exergy efficiency of 52.77%. The cascaded design maximizes refrigerant utilization, thereby reducing energy loss when compared to non-cascaded systems. The study underscores the significant role of pre-cooling stages in determining efficiency, with an increase in stages resulting in a decline in SEC and an enhancement in exergy efficiency.
Aasadnia [33] et al. proposed and analyzed a novel configuration for a hydrogen liquefier process, which incorporates an absorption refrigeration system in the middle section to cool certain hydrogen streams, powered by solar source. This is preceded by a mixed refrigerant cycle and followed by a Joule–Brayton cycle. The low-temperature gaseous hydrogen is cooled by a new cascade Joule–Brayton cycle in the cryogenic section of the plant, and the refrigerant is a new MR. The study achieved an SEC of 6.74 kWh/kgH2 and an EXE of 0.2034. In a similar vein, Ceyhun Yilmaz [34] also utilized absorption refrigeration in a hydrogen liquefaction process, but the heat source is geothermal energy.
The above studies about hydrogen storage aim to obtain liquid hydrogen, while there have been few studies conducted to date on cryogenic supercritical hydrogen. The difficulty of transition from liquid hydrogen storage to cryogenic supercritical hydrogen storage is that cryogenic supercritical hydrogen needs high pressure storage tank. Moreno-Blanco et al. [35,36,37] designed and analyzed on-board vessels for cryogenic supercritical hydrogen. The results show that cryogenic supercritical hydrogen has advantages in cost, density, and safety. Hao Fu [38] has designed a storage tank with a pressure capacity of up to 115,100 kPa, which means that the cryogenic supercritical hydrogen storage system is entirely feasible. The cryogenic supercritical hydrogen storage system is expected to meet the hydrogen storage density goals proposed by the U.S. Department of Energy (DOE) [39,40].
Initial progress has been made in research on cryogenic supercritical hydrogen storage, as shown in Table 1. Zekai Song [40] proposed a cryogenic supercritical hydrogen storage system based on a helium expansion cycle with liquid nitrogen pre-cooling, achieving a hydrogen density of 63.36 kg/m3 at 10,000 kPa and −235.15 °C. The system, which has been optimized using the genetic algorithm, exhibits an SEC of 5.432 kWh/kgH2 and an EXE of 43.88%, thus demonstrating its superiority to conventional hydrogen liquefaction processes.
Jingxuan Xu et al. [41] proposed a high-density cryogenic supercritical hydrogen storage system integrating dual parallel/cascade mixed refrigerant cycles (DPMR and DCMR) to address the low density of high-pressure gaseous hydrogen and evaporation issues in liquid hydrogen storage. The DPMR process achieved an SEC of 6.422 kWh/kgH2 with an exergy efficiency of 52.66%, while the DCMR process had an SEC of 6.872 kWh/kgH2 and an exergy efficiency of 49.24%. Furthermore, the integration of ortho–para converters in the DPMR process was investigated, revealing a 23.31% increase in SEC due to the exothermic conversion process. In a subsequent study [42] by the author, a design for a cryogenic supercritical hydrogen storage system integrating mixed refrigerant pre-cooling and gas expansion cycles was proposed, with the capacity to cool hydrogen to −203.15 °C and 30,000 kPa, while achieving a storage density of 72.53 kg/m3. Through the utilization of genetic algorithm optimization, neon was identified as the most efficient expansion working medium, resulting in an SEC of 5.87 kWh/kgH2 and an EXE of 49.74%.
Haocheng Wang et al. [43] investigated cryogenic supercritical hydrogen storage processes utilizing mixed refrigerant Joule–Thomson (MRJT) cycles and nitrogen/neon reverse Brayton cycles (RBCs). The MRJT process achieved a hydrogen density of 71.59 kg/m3 at −193.15 °C and 50,000 kPa, with an SEC of 6.42 kWh/kgH2, which is significantly lower than traditional hydrogen liquefaction methods. The study emphasizes the efficacy of MRJT cycles in minimizing exergy losses and in synchronizing temperature-distributed cooling loads. It also suggests the integration of neon RBCs for temperatures below −193.15 °C to further improve performance, although operation below −213.15 °C is considered less favorable due to higher energy costs.
Table 1. Comparison of different types of hydrogen storage processes.
Hydrogen Storage ProcessStorage Density
(kg/m3)
SEC
(kWh/kg)
Exergy Efficiency
(%)
LH2Existing plants [25]70.8511–15-
Tang Lu [26]70.85-38.52/40.17
Cao Xuewen [28]70.859.80241.4
Yujing Bi [30]70.859.70339.1
Sun [32]70.855.66452.77
CcH2Zekai Song [40]63.365.43243.88
Jingxuan Xu [41]72.535.8749.74
Haocheng Wang [43]71.596.42-
As demonstrated by the comparison, the CcH2 method generally exhibits a lower SEC and a higher EXE, which is more significant in terms of energy saving in cases where the difference in hydrogen storage density is not significant. Therefore, in this paper, a novel design of producing cryogenic supercritical hydrogen based on multi-stage Joule–Brayton cycle refrigeration is proposed, which aims to increase the storage density of hydrogen without phase change. To simulate and optimize the system, Aspen HYSYS V12 [40,44] and the genetic algorithm were used, with SEC and EXE maintaining a relatively good level.

2. System Description

Figure 1 shows the flow chart of the cryogenic supercritical hydrogen storage system based on multi-stage Joule–Brayton cycle refrigeration. This design consists of two parts, that is, the compression process of mainstream hydrogen and the cooling process. In addition, the cooling progress includes hydrogen mainstream and refrigeration cycles.
In the compression process, the feed hydrogen (30 °C, 102 kPa) goes through six consecutive compression-cooling processes, and the pressure reaches 18,000 kPa and the temperature is normal temperature. The cascade structure is set to provide cooling capacity for the cooling process, with each stage of the refrigeration cycle being a Joule–Brayton cycle. Propane, ethene, and methane are the refrigerants in the first three stages of the cycle, and in the last two stages of the cycle it is hydrogen, which gradually reduces the temperature of the mainstream hydrogen to −223.15 °C.
The principle of the five refrigeration cycles is similar. Taking the first-stage refrigeration cycle as an example, low-temperature propane (P1) flows through the first-stage heat exchanger HX-1. It provides cooling capacity for mainstream hydrogen, with the temperature rising. Then propane goes through two compressors and water coolers to become high-pressure normal temperature propane (P6). Internal energy is released in the expansion machine while temperature and pressure are reduced. Finally, propane returns to the heat exchanger to continue the loop. In the other four cycles, every refrigerant passes through several heat exchangers both before and after the expander. This is to make full use of the high-quality cold source, while ensuring that the temperature of the compression process is appropriate. In addition, in the fifth cycle, the low-pressure hydrogen (LH6) undergoes three compression-cooling processes before returning to the heat exchanger.
After the above process, the mainstream hydrogen flows into the tank, with the pressure being 18 kPa and the temperature being −223.15 °C inside the tank.

3. Process Construction Basis

3.1. Assumptions and Initial Parameters

The steady-state simulation of the above process was carried out in the chemical software Aspen HYSYS V12 [44]. Aspen HYSYS V12 is a process simulation software for oil and gas production, gas processing, and refining industries [40,41,43]. HYSYS has rigorous and rich physical property packages, as well as a large number of thermodynamic methods, convergence methods, functional modules, etc. The Peng–Robinson equation built in HYSYS was selected for the simulation. Due to the complexity of engineering problems, software simulation cannot completely restore the actual situation, and too much disturbance will cause difficulties in the computer calculation process, so assumptions about the process must be made in the simulation:
  • The influence of fluid kinetic energy and gravitational potential energy on fluid is ignored;
  • The process is stable and will not be disturbed by external disturbance;
  • The ambient temperature is 30 °C;
  • Referring to the existing research, the adiabatic efficiency of the compressor and the expander is set to 85% [29,45];
  • There is no pressure drop in water coolers and heat exchangers;
  • In total, 90% of the mechanical work produced by the expansion machines is recovered by the compressors;
  • The flow temperature at the exit of all water coolers is the same as the ambient temperature;
  • The fluid pipeline between all equipment is insulated from the outside world;
  • The parameters of the feed gas are 30 °C, 102 kPa, 2 kgH2/s;
  • The minimum temperature difference for heat exchange in the multi-flow heat exchanger is 3 °C.
In addition, this paper assumes that the temperature of each flow strand at the heat flow outlet of each heat exchanger is the same; the temperature at the cold flow outlet of each heat exchanger is also the same.
t H 14 = t L H 13 = t H H 10 = t M 9 = t E 8 t H 15 = t L H 14 = t H H 11 = t M 10 t H 17 = t L H 16 t E 3 = t M 4 = t H H 5 = t L H 6 t M 3 = t H H 4 = t L H 5 t H H 3 = t L H 4

3.2. Specific Energy Consumption

Specific energy consumption (SEC) is the ratio of the net energy consumption of the whole process to the mass flow of supercritical hydrogen products:
S E C = W C W E m H 2
where
S E C is the specific energy consumption, kWh/kgH2;
W C is the total compressor work consumption, kW;
W E is the total expander output work, kW;
m H 2 is the mass flow of feed gas, kg/h.

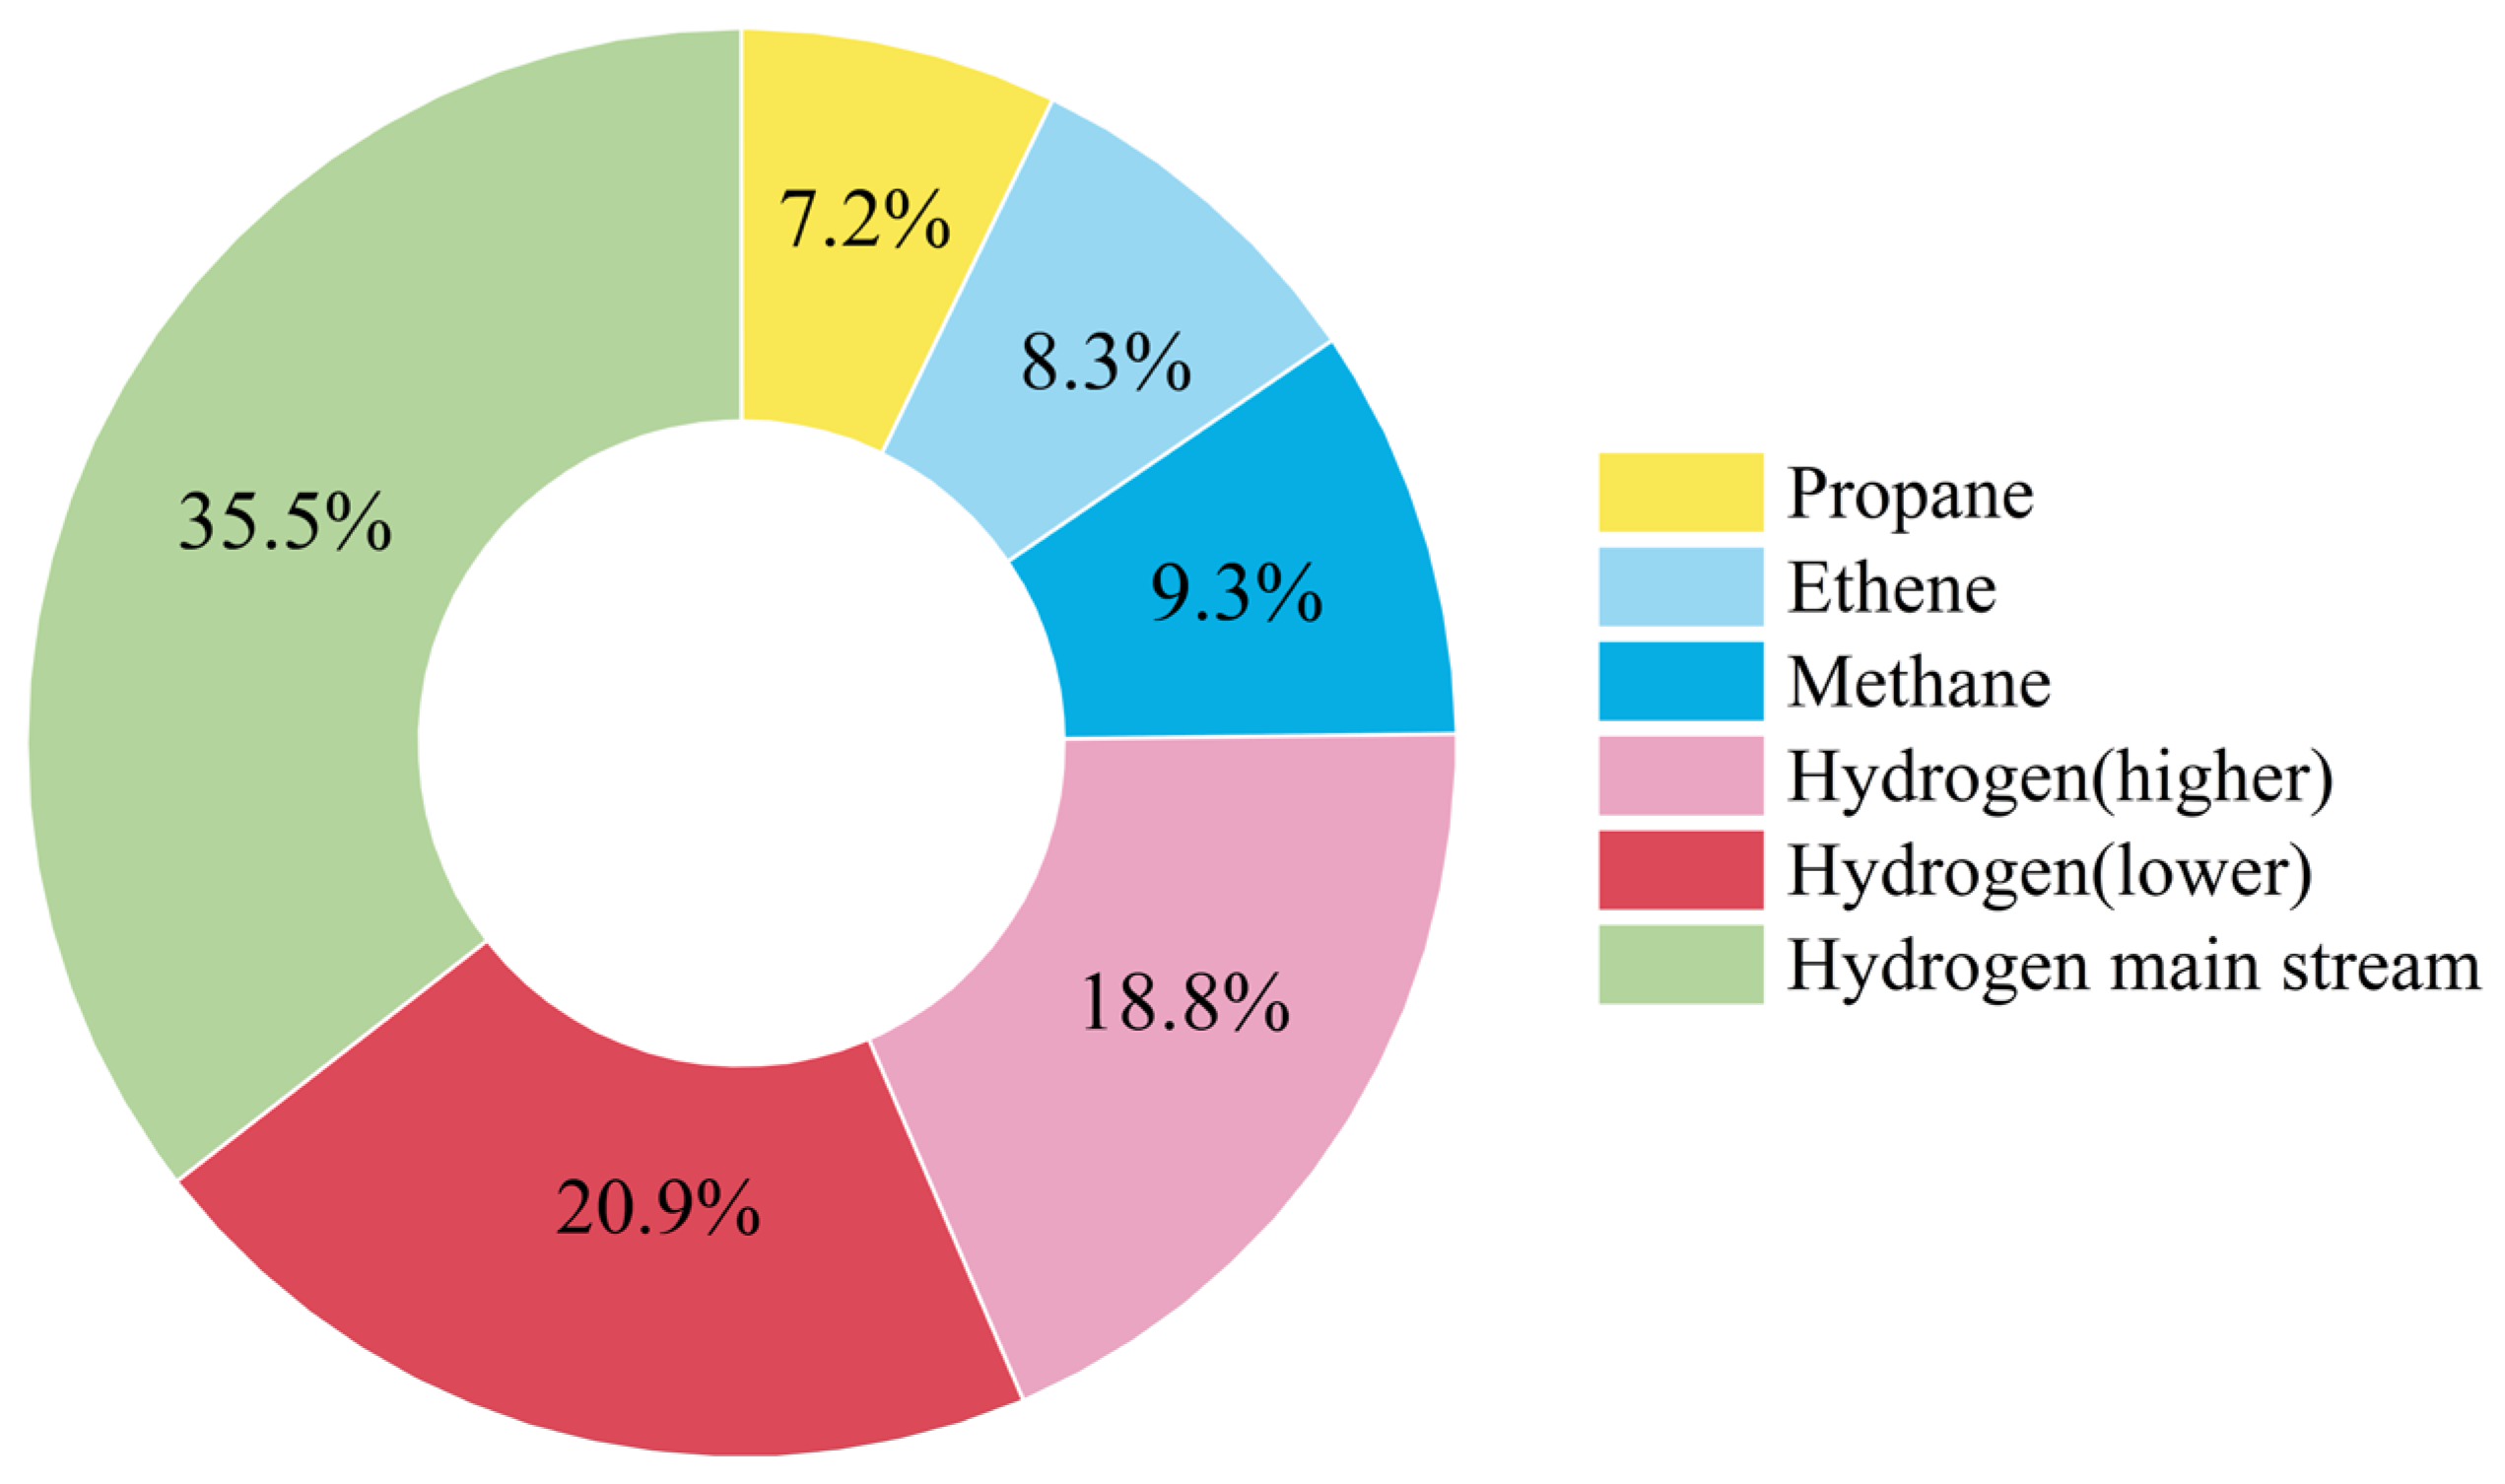
3.3. Coefficient of Performance

Coefficient of performance (COP) refers to the ratio of the refrigeration capacity to the actual power consumption in a refrigeration cycle:
C O P = Q W C W E = m ( h 2 h 1 ) W C W E
where
C O P is the coefficient of performance;
m is the mass flow of refrigerant, kg/s;
h 1 is the specific enthalpy of the refrigerant flowing out of the expander and into the heat exchanger, kJ/kg;
h 2 is the specific enthalpy of the refrigerant flowing out of the heat exchanger into the compressor.

3.4. Exergy Efficiency

Exergy refers to the maximum amount of energy that can be converted into useful work under environmental conditions, as well as the theoretical minimum work of hydrogen conversion from feed gas to product in this system:
W m i n = m H 2 h h 0 T 0 s s 0
where
W m i n is the theoretical minimum work of hydrogen conversion, kW;
h is the specific exergy of the product hydrogen, kJ/kg;
h 0 is the specific exergy of the feed hydrogen, kJ/kg;
T 0 is the ambient temperature;
s is the specific entropy of the product hydrogen, kJ/(kg·K);
s 0 is the specific entropy of the feed hydrogen, kJ/(kg·K).
Exergy efficiency refers to the ratio of the theoretical minimum energy consumption of a process to the net energy actually consumed:
E X E = W m i n W C W E = m H 2 h h 0 T 0 s s 0 W C W E
There is exergy loss in every device. The exergy damage rate of a device refers to the proportion of exergy loss of a device in the overall system. Table 2 shows the exergy loss equation of various equipment.

4. Process Simulation and Optimization

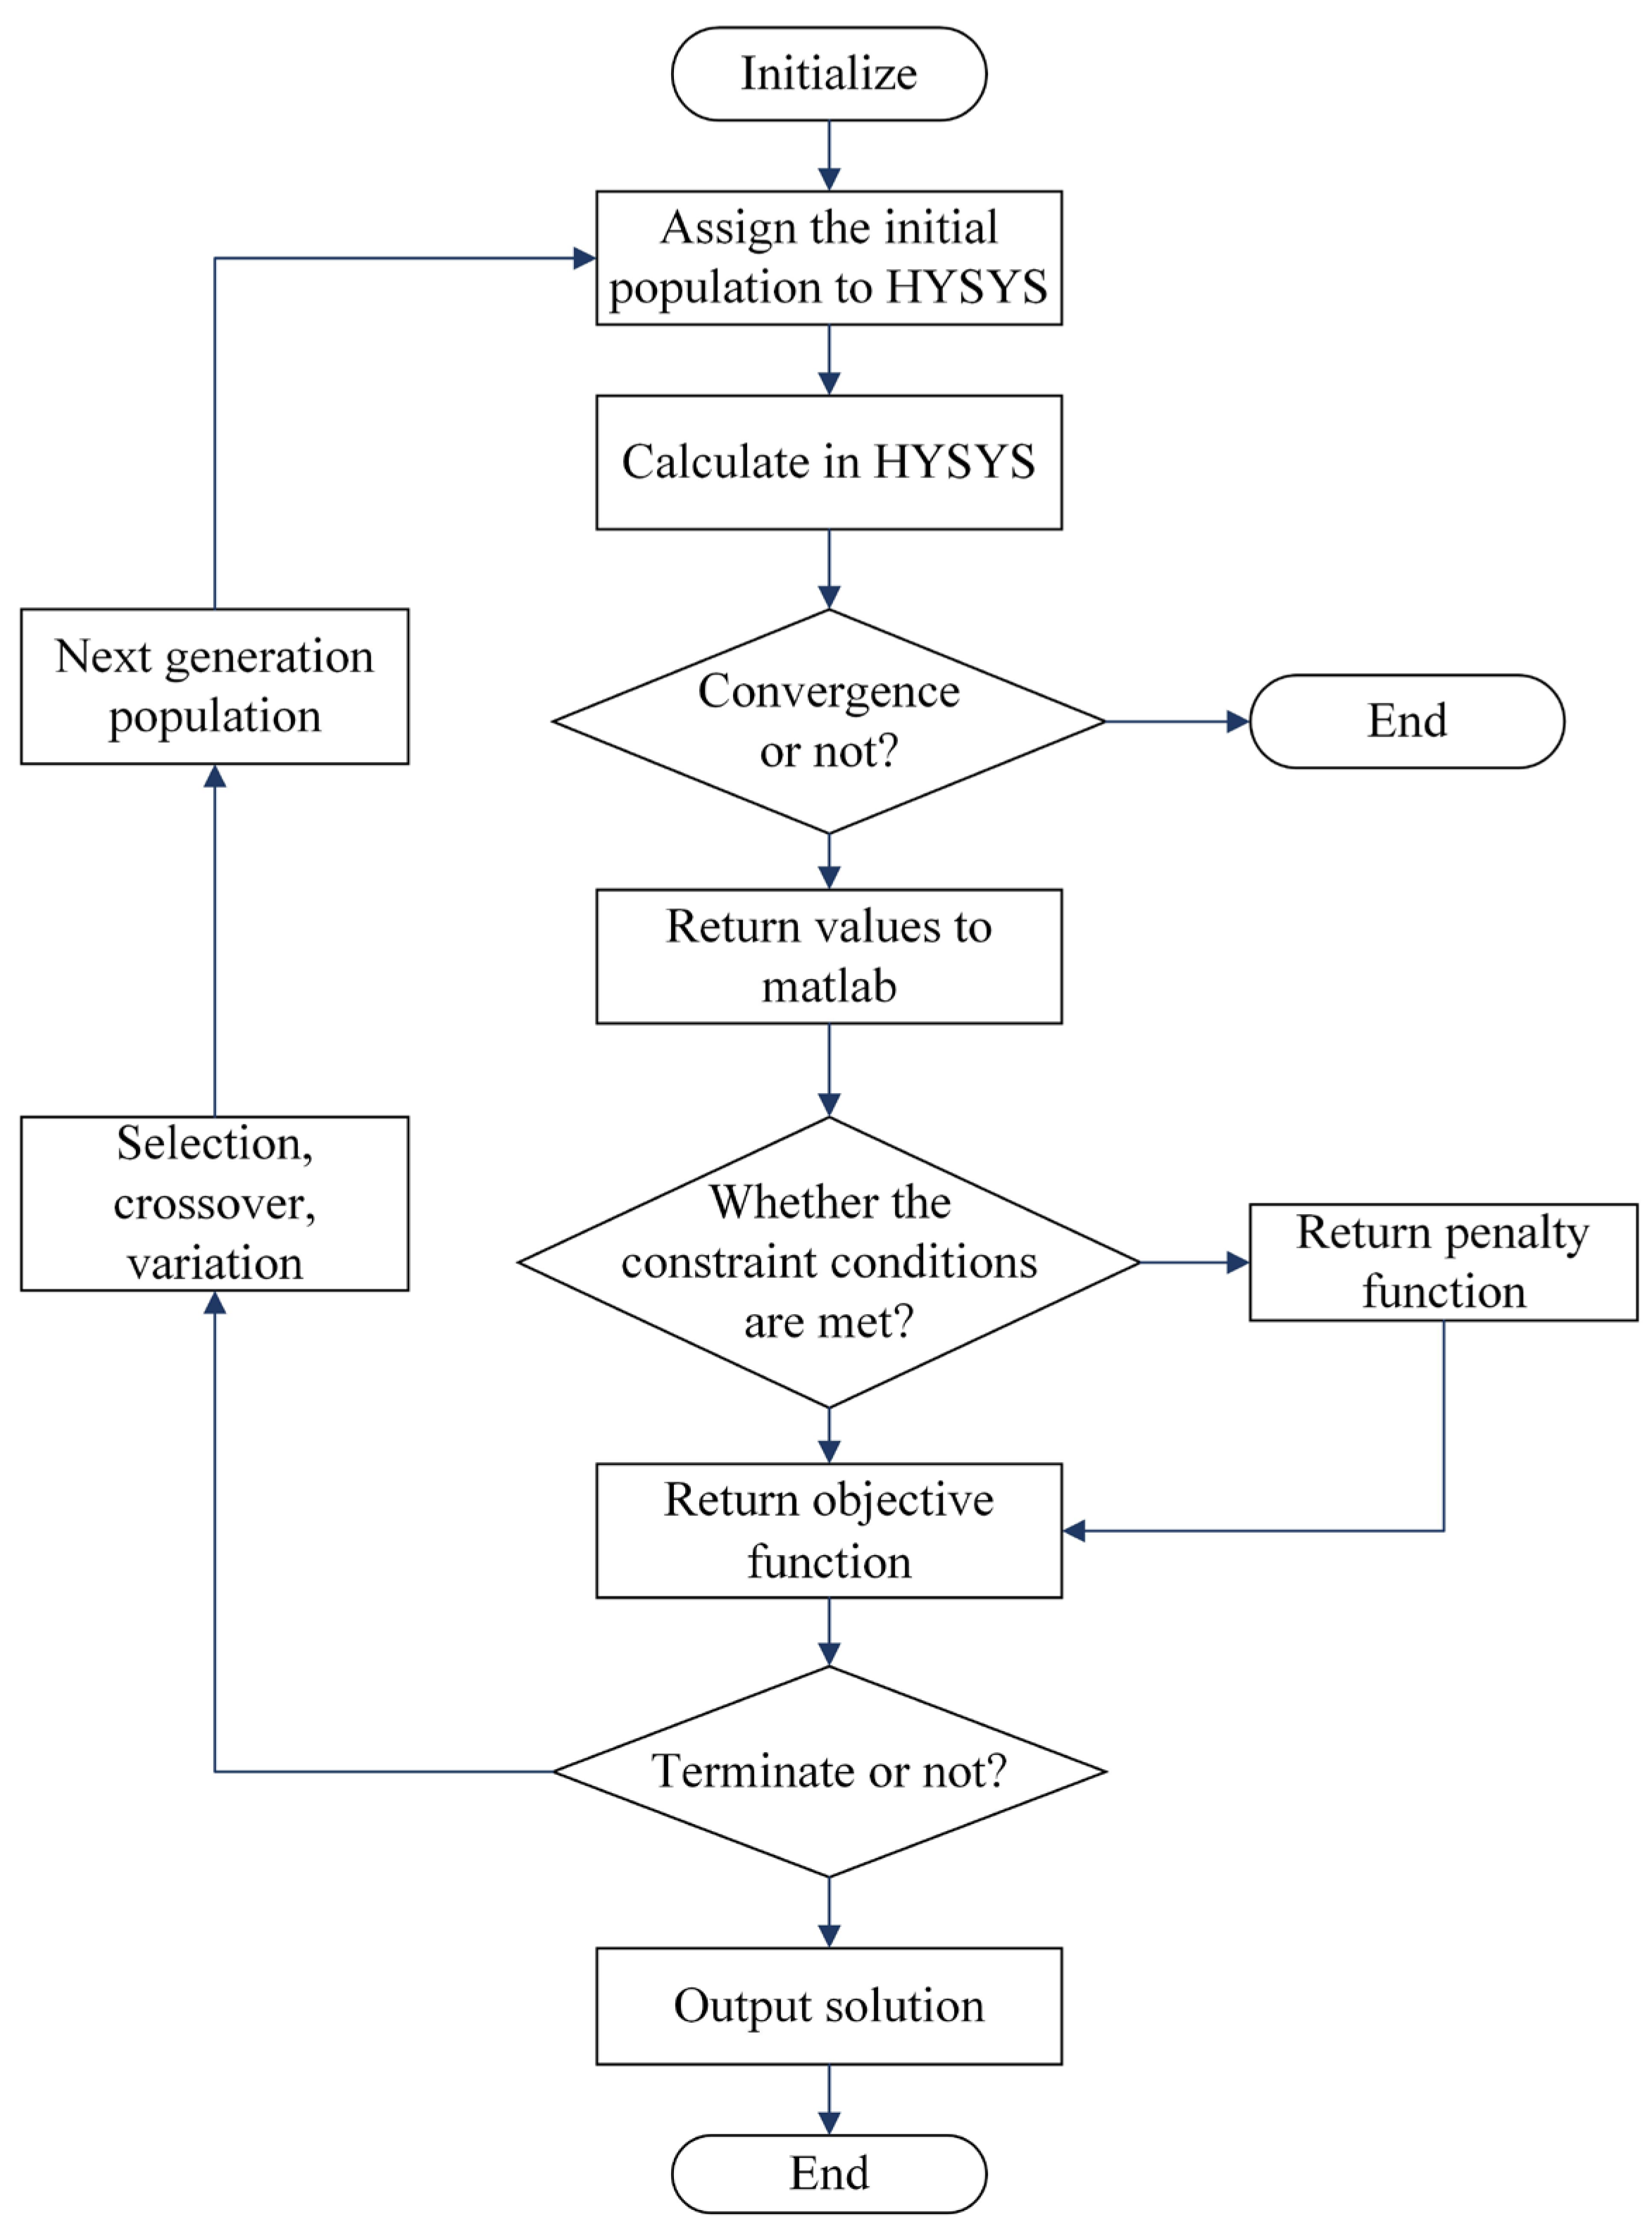
4.1. Optimization Method

The process involves several variables and constraints. After the completion of the process design, the key parameters need to be optimized, and in the hydrogen liquefaction process, the GA is widely used. The genetic algorithm (GA) was created in 1975 and is an algorithm that simulates the evolutionary mechanism of natural organisms. The GA randomly selects multiple sets of data within a certain range as multiple individuals within the “population”. Individuals within the “population” compete with each other, and those who perform well are preserved and iterated, while those who perform poorly are eliminated [46]. A closed and convergent complete process was built in the Aspen HYSYS V12 software, and the relevant physical property data were captured in the built-in spreadsheet. Then, the GA code in Matlab was used to interact with the spreadsheet in HYSYS. Figure 2 shows the process of the GA. GA setting parameters are shown in the Table 3.

4.2. Objective Function

The compression process of hydrogen and refrigerants requires a lot of energy, and the goal of optimization is to reduce the energy consumption of the system. In this study, specific energy consumption is the objective function of the genetic algorithm, and the calculation formula is shown as follows:
f X = S E C = W C W E m H 2
where X is the array of parameters to be optimized.

4.3. Optimization Variable

For supercritical hydrogen making process, the major factors that affect the unit consumption are the various loop refrigerant flow rates and the pressure of each compressor import and export. It is necessary to optimize the inlet and outlet pressure of the compressor and the flow input of all levels of refrigerant. The temperature of the cold and hot ends of the heat exchanger also affects the energy consumption. There are 25 parameters to be optimized, and the upper and lower limits of parameter optimization are given in Table 4.

4.4. Constraints and Penalty Function

In order to ensure that the optimization process can reach a reasonable set of solutions, it is necessary to set some restrictions for the genetic algorithm [47]. In this paper, it is assumed that the minimum heat transfer temperature difference of the heat exchanger is not more than 3 °C to ensure the normal process. When calculating does not satisfy the constraint conditions, the following penalty function is used:
p X = f X 1 + e g X
g X = 3 m i n T m i n H X 1 ~ 5
where T m i n H X means the minimum temperature difference in the heat exchanger.

5. Results and Analysis

5.1. Results

Through the GA and Aspen HYSYS V12 coupling calculation, the optimal solution can be obtained. Optimized parameters are given in Table 5.

5.2. Energy Consumption Analysis

Table 6 shows the power consumption of the system, where the SEC is 5.71 kWh/kgH2 and the EXE is 56.2%. The SEC of existing liquid hydrogen production plants typically ranges from 11 to 15 kWh/kg [25]. The proposed system achieves a reduction of 49% to 63% in SEC. Moreover, compared with other studies listed in Table 1, this study also represents an advanced level, which proves the superiority of this cryogenic supercritical hydrogen storage system in energy consumption.
Figure 3 shows the power consumption of the compressor in the six parts of the process. This part of the six-stage hydrogen compression process consumes the most energy, which compresses hydrogen from ordinary pressure to 18,000 kPa.
In the five cycles other than the compression process of the mainstream hydrogen, the power consumption of the compressor from the high-temperature stage to the low-temperature stage gradually increases. This is because the refrigerant of the low-temperature stage also flows back to the high-temperature stage heat exchanger as a cold source to cool the high temperature fluid, which requires a large cooling capacity of the low-temperature stage, and the required compression power also increases. Due to the adiabatic index of hydrogen being relatively larger than other refrigerants, the energy consumption of the two cycles with refrigerant of hydrogen is significantly higher than other three cycles.
There are 17 compressors in this system, and the pressure ratio of 11 compressors has changed. The pressure before and after optimization is shown in Table 7 and Figure 4. It can be seen that the pressure ratio of all compressors after optimization is lower than that before optimization. When the GA was employed to minimize the SEC, it reduced the compression ratios of all compressors, which indicates that a smaller compression ratio correlates with lower energy consumption. Additionally, reducing the compression ratio effectively lowers the discharge temperature at the compressor outlet, which is beneficial for the stable operation and service life of the equipment.
The COP of each refrigeration cycle is given in Table 8, which shows a trend of decreasing the refrigeration coefficient with the decrease in temperature. It is acceptable in the process of low temperature refrigeration.

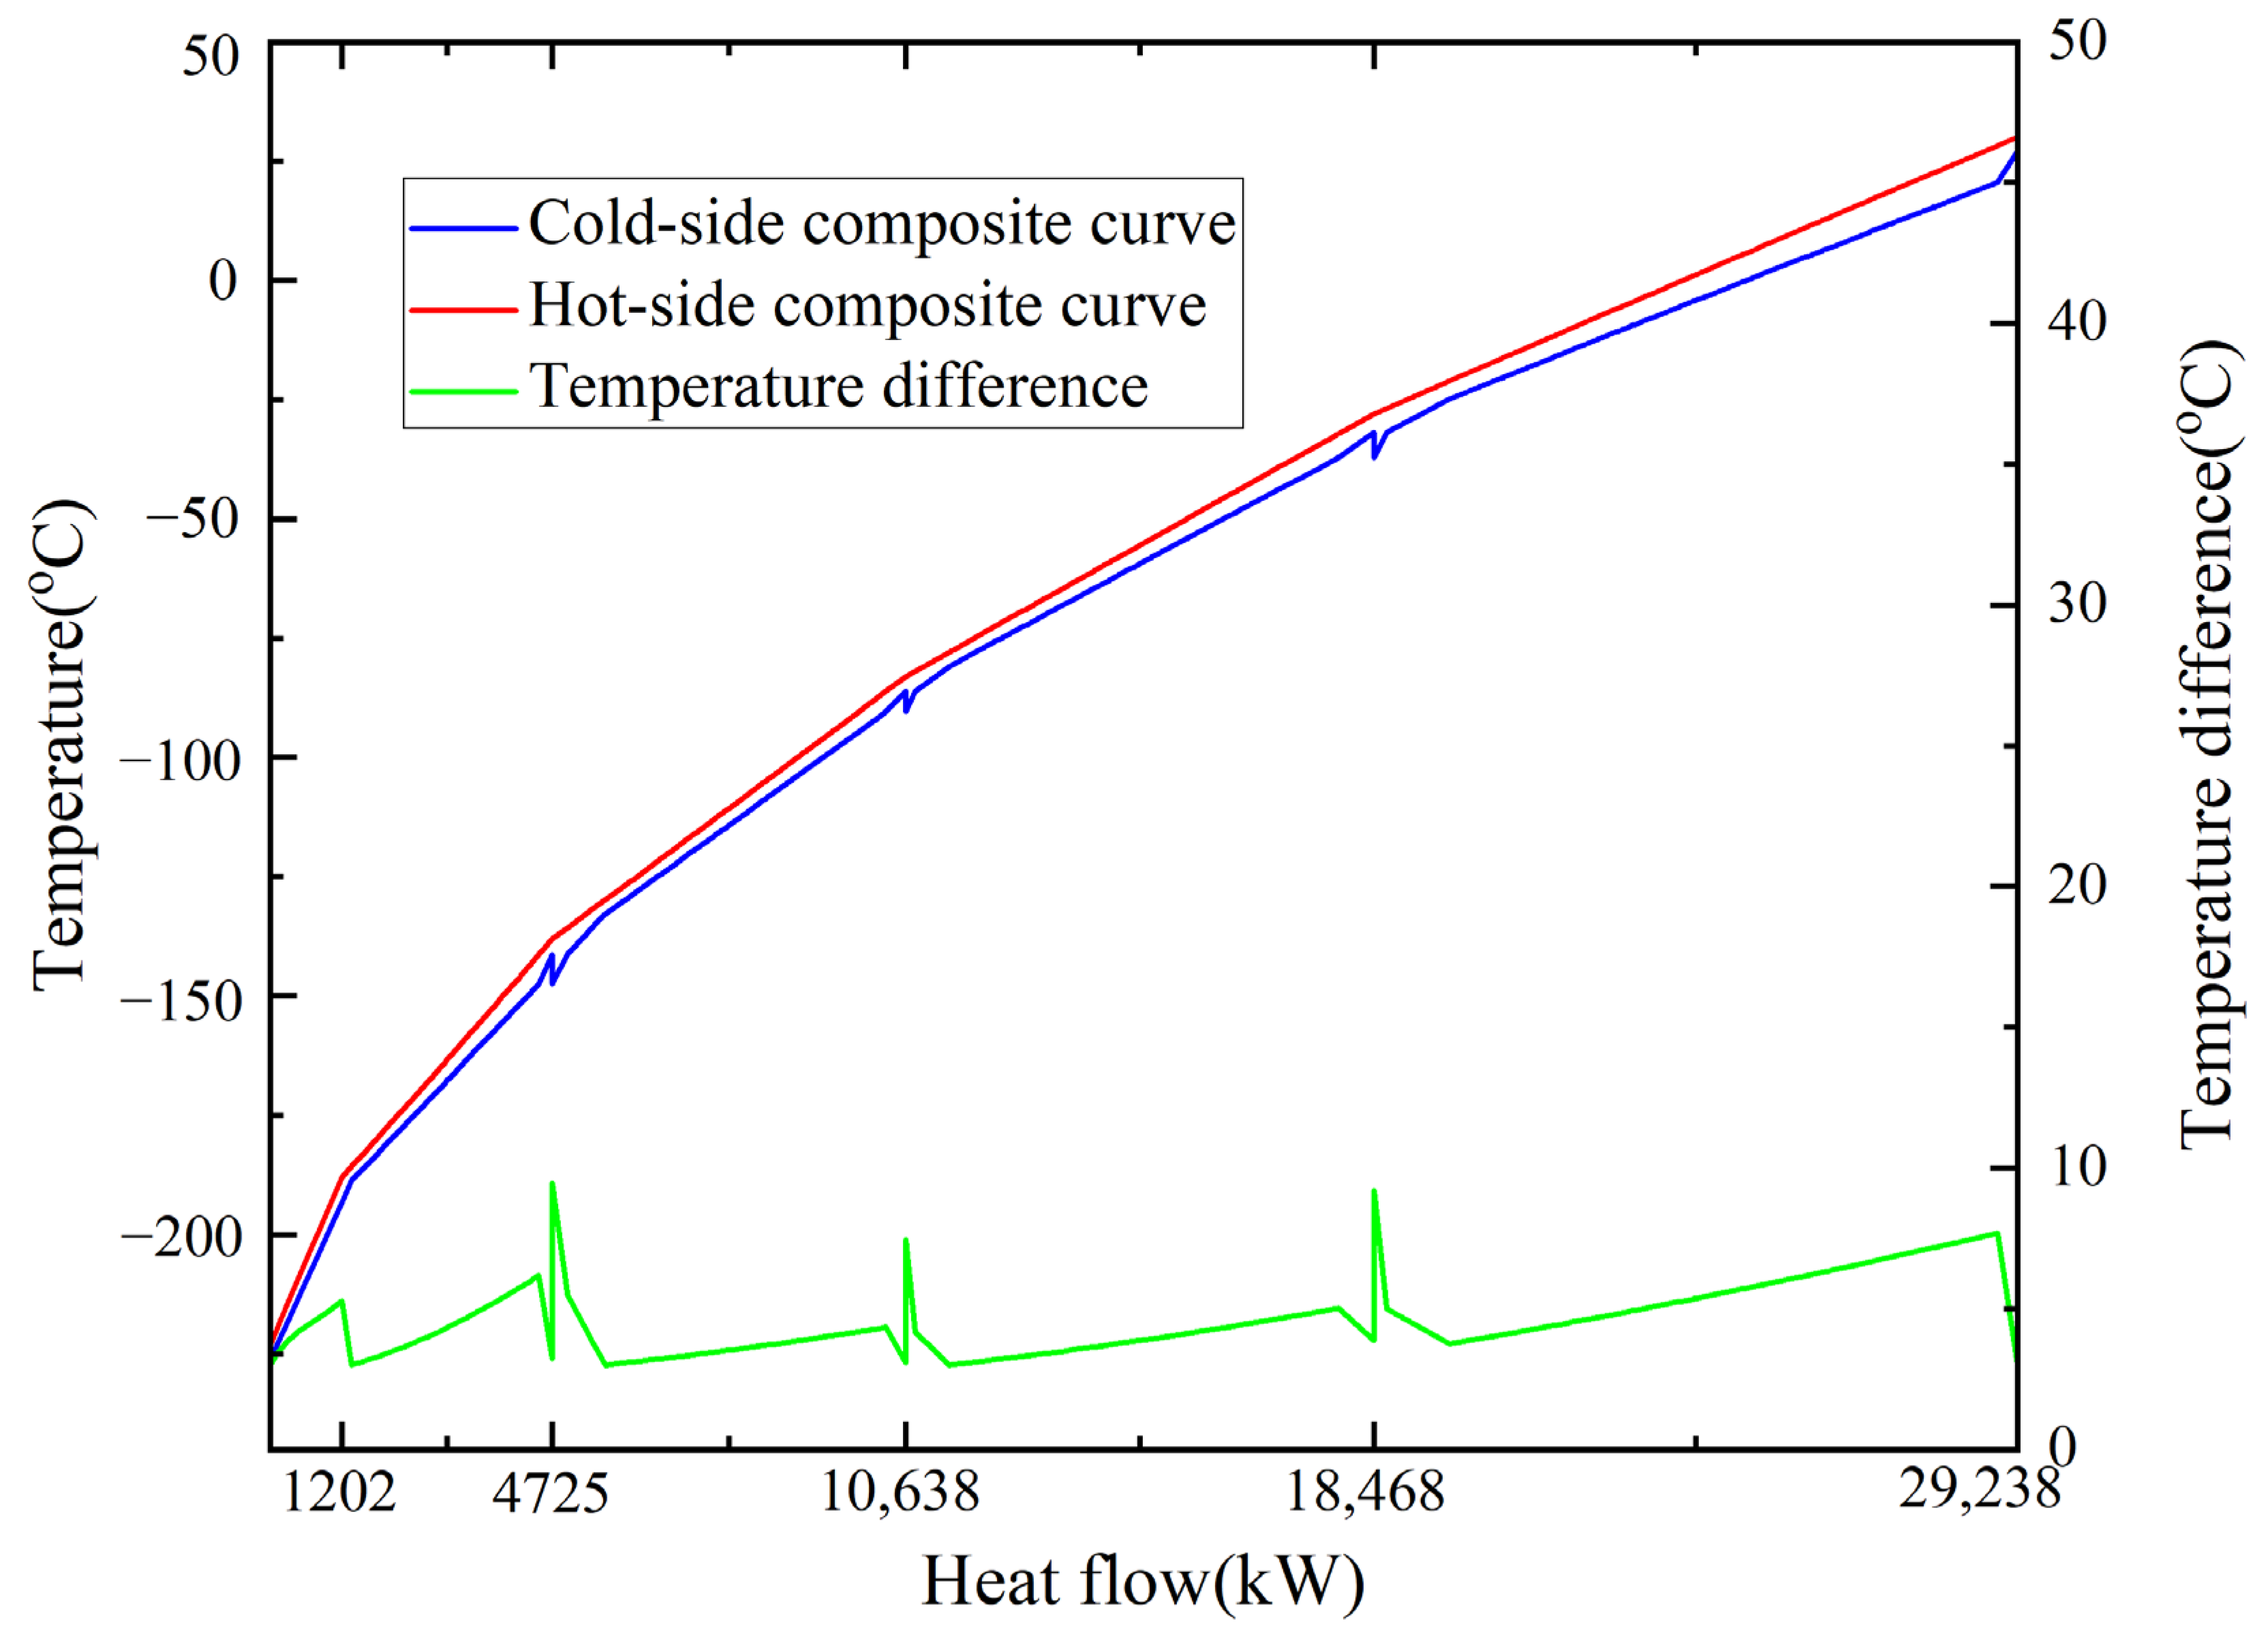
5.3. Heat Transfer Analysis

In the hydrogen storage system, the heat transfer performance will have a great impact on the performance of the whole process, so the heat transfer analysis is necessary. Table 9 shows that after optimization, the minimum temperature difference for heat exchange of the multi-flow heat exchanger is close to 3 °C, indicating that all parameters in the process are close to the optimal solution.
The thermal composite curve can be used to evaluate the efficiency of the heat transfer process. It is widely used as a thermodynamic graphical tool. Generally, the closeness of the cold and hot side curves represents the performance of the heat exchanger. Figure 5 is composed of the composite curves of five multi-stream heat exchangers, which makes it easy to compare the performance of all heat exchangers. The heat transfer temperature difference in each heat exchanger shows a decreasing trend during the heat transfer process. In general, the cold-side composite curve and hot-side composite curve fit well, indicating that the heat exchanger performance is good.
Heat exchanger HX-1 has the largest average heat transfer temperature difference and the junction of the two heat exchangers has a large local heat transfer temperature difference. There are break points on both sides of the heat transfer temperature difference curve, and the trend of sudden drop in HX-1. The cold flow into the heat exchanger has three different temperatures, and the outflux has two. At the entrance of the cold flow, the fluid that provides the cold capacity for the heat flow is first ethene, which has the lowest temperature, followed by the cold fluid from the later stages of the cycle, and finally propane, which has the highest temperature. This results in a sharp drop in the heat transfer curve on the left side. At the outlet of the cold flow, the temperature of propane is higher than that of other flows, so the right side of the heat transfer temperature difference curve also has a sudden decline. The conditions of the heat exchangers HX-2, HX-3, and HX-4 are similar to those of HX-1. However, in HX-5, there are only two streams of hot and cold fluid, so HX-5 has the smoothest heat transfer temperature difference curve with no break point.

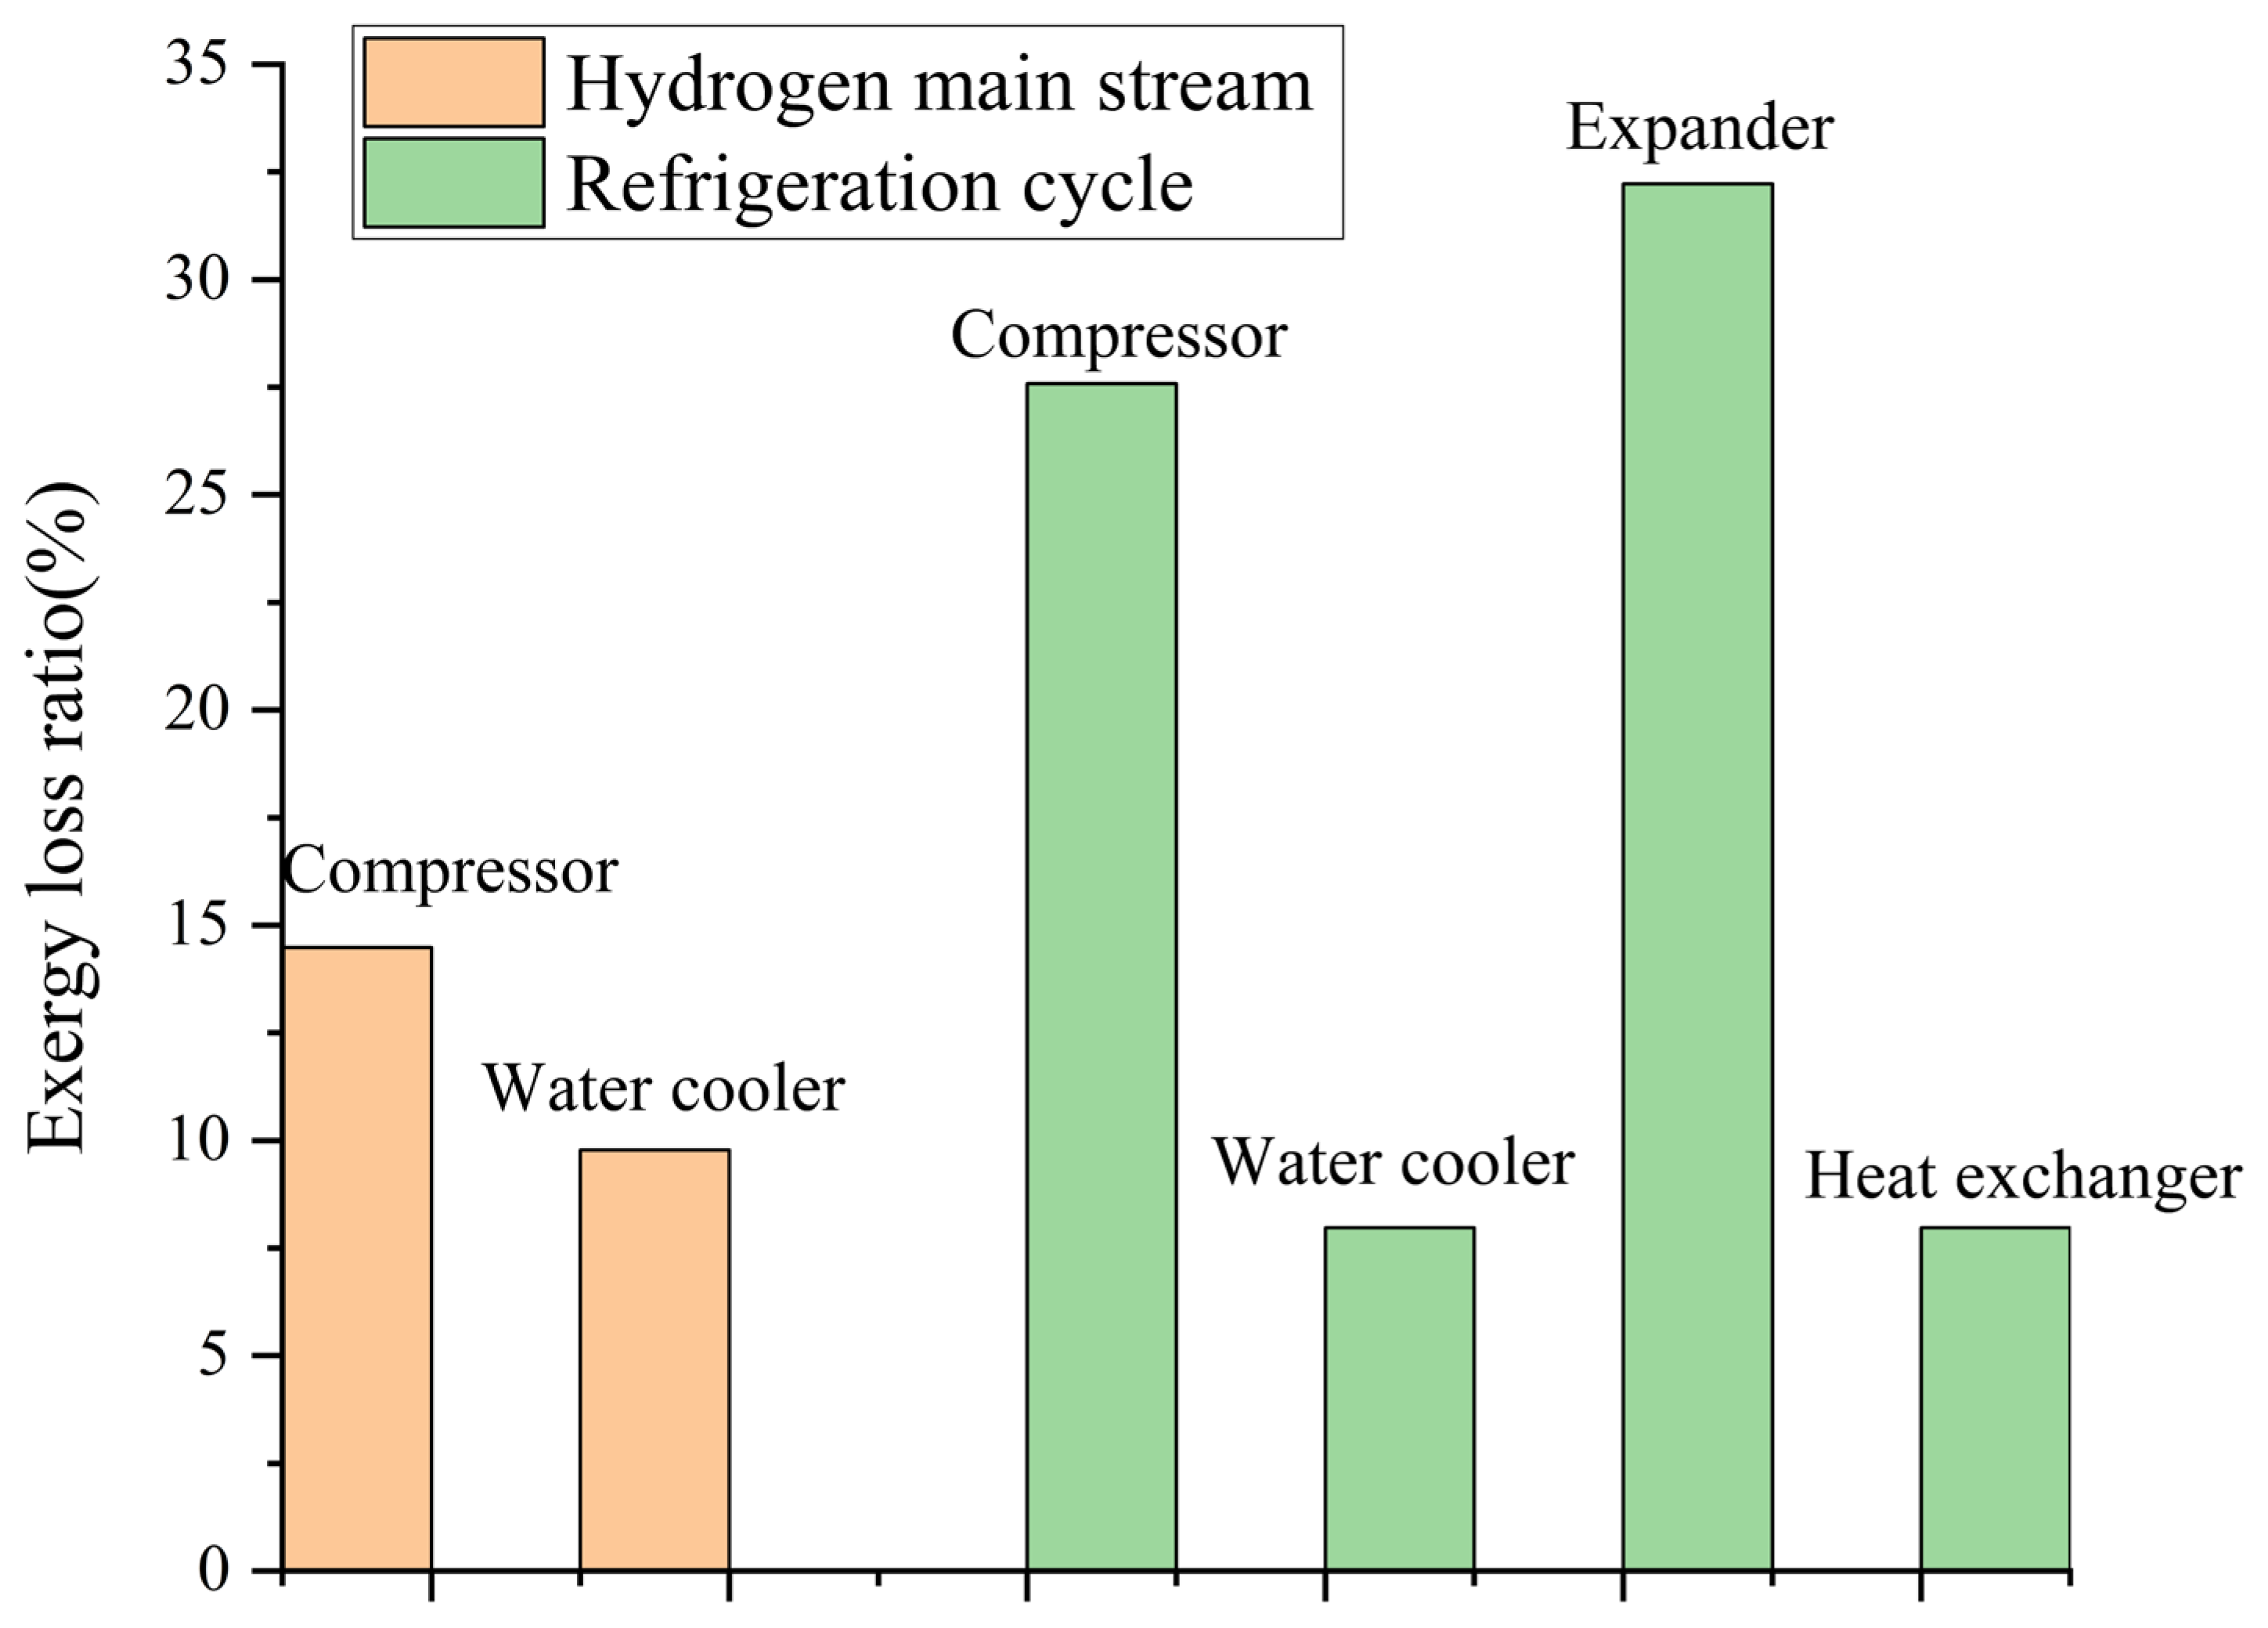
5.4. Exergy Analysis

Exergy losses occurred in the hydrogen storage system. Exergy loss of each equipment in the system can be calculated according to Table 2, whose detailed data are given by Table 10.
Exergy loss of the heat exchangers only accounts for 7.97% of the overall exergy loss, while for compressors it accounts for 42.06%; expander exergy loss is 32.22%, and water cooler exergy loss is 17.74%. Figure 6 shows the distribution of exergy losses according to the type of equipment. The compressor has the largest exergy loss, while the multi-stream heat exchanger has the smallest one. Namely the irreversible loss in the process is mainly from the fluid itself, rather than from the interaction between the fluids.
The number of compressors and water coolers are the same, and the exergy loss of the compressors is mainly caused by the irreversible loss of the compression process, while the exergy loss of the water coolers is caused by heat exchange. The former has more significant impact than the latter, so the exergy loss of compressors is greater. If the mainstream hydrogen compression and cooling process is ignored, the expanders cause the greatest exergy loss, although the number of expanders is the lowest.
Among all the compressors, the one with hydrogen flowing through has a greater exergy loss than other working medium because the adiabatic index of hydrogen is higher than that of other refrigerants. The greatest exergy loss occurred in COM-7 because the pressure ratio of compressor-7 is the largest. The exergy loss of the water coolers in each cycle was the same as that of the compressors. As for the expanders, the expanders with hydrogen fluid also had higher exergy losses.

6. Conclusions

In this paper, a cryogenic supercritical hydrogen storage system is presented, optimized, and analyzed based on a multi-stage Joule–Brayton refrigeration cycle. The system adopts five-stage Joule–Brayton cycle refrigeration and employs propane, ethene, methane, and hydrogen as refrigerants to cool hydrogen from normal temperature and atmospheric pressure to −223.15 °C, 18 kPa; it achieved a density of 73.46 kg/m3. Energy analysis, heat transfer analysis, and exergy analysis are carried out. Key conclusions from the work include the following:
1.
The expansion machines are used to recover the mechanical work, which effectively reduce the energy consumption of cooling hydrogen. With an SEC as low as 5.71 kWh/kgH2, the system can provide a reference for medium and large supercritical hydrogen storage systems.
2.
The cascade arrangement of the J-B cycle improves the performance of the multi-flow heat exchanger because of the small heat transfer temperature difference between the gaseous refrigerant and the hydrogen main stream.
3.
Exergy efficiency of the system is 56.2%. Exergy loss from the compressors and expanders is the most significant. The multi-flow heat exchangers have the minimum exergy loss.

Author Contributions

Conceptualization, J.X. and X.C.; methodology, J.X. and B.D.; software, R.W, T.Y. and W.W.; formal analysis, J.X. and B.D.; investigation, R.W. and W.W.; data curation, R.W. and T.Y.; writing—original draft preparation, R.W. and T.Y.; writing—review and editing, B.D., X.C. and J.X.; visualization, R.W. and T.Y.; supervision, B.D., X.C. and J.X.; project administration, J.X and X.C. All authors have read and agreed to the published version of the manuscript.

Funding

This research was funded by the Shanghai Municipal Science and Technology Commission for the Project (23YF1428500).

Data Availability Statement

The original contributions presented in this study are included in the article. Further inquiries can be directed to the corresponding author(s).

Acknowledgments

The authors would like to express sincere gratitude to the editorial team of cryo journal for their professional support throughout the publication process.

Conflicts of Interest

The authors declare no conflicts of interest to report regarding the present study.

Nomenclature

SymbolsAbbreviations
eexergyCcH2cryogenic compressed hydrogen
henthalpyCOPcoefficient of performance
mmass flowDCMRdual cascade mixed refrigerant
ppressureDOEDepartment of Energy
sentropyDPMRdual parallel mixed refrigerant
TtemperatureEXEexergy efficiency
WpowerGAgenetic algorithm
IPCCIntergovernmental Panel on Climate Change
SubscriptsLH2liquid hydrogen
COM/CcompressorLMTDlogarithmic mean temperature difference
COOLwater coolerLNGliquefied natural gas
EXP/EexpanderMRmixed refrigerant
HXheat exchangerMRJTmixed refrigerant Joule–Thomson
H2hydrogenMTDminimum temperature difference
ininlet flowRBCreverse Brayton cycle
outoutlet flowSECspecific energy consumption

References

  1. U.S. Energy Information Administration. International Energy Outlook 2023; U.S. Department of Energy: Washington, DC, USA, 2023.
  2. Chapman, A.; Itaoka, K.; Farabi-Asl, H.; Fujii, Y.; Nakahara, M. Societal penetration of hydrogen into the future energy system: Impacts of policy, technology and carbon targets. Int. J. Hydrogen Energy 2020, 45, 3883–3898. [Google Scholar] [CrossRef]
  3. Midilli, A.; Dincer, I. Hydrogen as a renewable and sustainable solution in reducing global fossil fuel consumption. Int. J. Hydrogen Energy 2008, 33, 4209–4222. [Google Scholar] [CrossRef]
  4. Andrews, J.; Shabani, B. Re-envisioning the role of hydrogen in a sustainable energy economy. Int. J. Hydrogen Energy 2012, 37, 1184–1203. [Google Scholar] [CrossRef]
  5. Turner, J.A. Sustainable Hydrogen Production. Science 2004, 305, 972–974. [Google Scholar] [CrossRef]
  6. Berry, G.D.; Aceves, S.M. The case for hydrogen in a carbon constrained world. J. Energy Resour. Technol. 2005, 127, 89–94. [Google Scholar] [CrossRef]
  7. Song, J.; Zhu, Y.; Liang, D.; Cheng, Q.; Yao, D.; Bao, W. Hydrogen energy system for renewable energy consumption. In E3S Web of Conferences; EDP Sciences: Les Ulis, France, 2021; Volume 233, p. 01083. [Google Scholar]
  8. Züttel, A. Hydrogen storage methods. Naturwissenschaften 2004, 91, 157–172. [Google Scholar] [CrossRef]
  9. Bondarenko, V.L.; Ilyinskaya, D.N.; Kazakova, A.A.; Kozlovtsev, P.S.; Lavrov, N.A.; Razenko, E.A. Hydrogen Storage. Chem. Pet. Eng. 2022, 57, 1026–1032. [Google Scholar] [CrossRef]
  10. Zheng, J.; Liu, X.; Xu, P.; Liu, P.; Zhao, Y.; Yang, J. Development of high pressure gaseous hydrogen storage technologies. Int. J. Hydrogen Energy 2012, 37, 1048–1057. [Google Scholar] [CrossRef]
  11. Aziz, M. Liquid Hydrogen: A Review on Liquefaction, Storage, Transportation, and Safety. Energies 2021, 14, 5917. [Google Scholar] [CrossRef]
  12. Barthélémy, H. Hydrogen storage—Industrial prospectives. Int. J. Hydrogen Energy 2012, 37, 17364–17372. [Google Scholar] [CrossRef]
  13. Sakintuna, F.; Lamari-Darkrim, M. Hirscher, Metal hydride materials for solid hydrogen storage: A review. Int. J. Hydrogen Energy 2007, 32, 1121–1140. [Google Scholar] [CrossRef]
  14. Principi, G.; Agresti, F.; Maddalena, A.; Russo, S.L. The problem of solid state hydrogen storage. Energy 2009, 34, 2087–2091. [Google Scholar] [CrossRef]
  15. Aceves, S.M.; Berry, G.D.; Rambach, G.D. Insulated pressure vessels for hydrogen storage on vehicles. Int. J. Hydrogen Energy 1998, 23, 583–591. [Google Scholar] [CrossRef]
  16. Züttel, A. Materials for hydrogen storage. Mater. Today 2003, 6, 24–33. [Google Scholar] [CrossRef]
  17. Stetson, N.T.; Bowman, R.C., Jr.; Olson, G.L. Overview of Hydrogen Storage, Transportation, Handling, and Distribution. In Handbook of Hydrogen Energy; CRC Press: Boca Raton, FL, USA, 2014. [Google Scholar]
  18. Larsen, A.H.; Simon, F.E.; Swenson, C.A. The Rate of Evaporation of Liquid Hydrogen Due to the Ortho-Para Hydrogen Conversion. Rev. Sci. Instrum. 1948, 19, 266–269. [Google Scholar] [CrossRef]
  19. Zhuzhgov, A.V.; Krivoruchko, O.P.; Isupova, L.A.; Mart’yanov, O.N.; Parmon, V.N. Low-Temperature Conversion of ortho-Hydrogen into Liquid para-Hydrogen: Process and Catalysts. Review. Catal. Ind. 2018, 10, 9–19. [Google Scholar] [CrossRef]
  20. Wang, H.; Zhao, Y.; Dong, X.; Yang, J.; Guo, H.; Gong, M. Thermodynamic analysis of low-temperature and high-pressure (cryo-compressed) hydrogen storage processes cooled by mixed-refrigerants. Int. J. Hydrogen Energy 2022, 47, 28932–28944. [Google Scholar] [CrossRef]
  21. Dewar, J. Liquid Hydrogen. Science 1900, 11, 641–651. [Google Scholar] [CrossRef]
  22. Krasae-in, S.; Stang, J.H.; Neksa, P. Development of large-scale hydrogen liquefaction processes from 1898 to 2009. Int. J. Hydrogen Energy 2010, 35, 4524–4533. [Google Scholar] [CrossRef]
  23. Nandi, T.K.; Sarangi, S. Performance and optimization of hydrogen liquefaction cycles. Int. J. Hydrogen Energy. 1993, 18, 131–139. [Google Scholar] [CrossRef]
  24. McIntosh, G.E. Hydrogen liquefiers since 1950. In AIP Conference Proceedings; Waynert, J., Barclay, J., Breon, S., Daly, E., Demko, J., Dipirro, M., Hull, J., Kelley, P., Kittel, P., Klebaner, A., et al., Eds.; American Institute of Physics: Melville, NY, USA, 2004; Volume 710, pp. 9–15. [Google Scholar]
  25. Raab, M.; Simon, M.; Ralph-Uwe, D. Comparative techno-economic assessment of a large-scale hydrogen transport via liquid transport media. Int. J. Hydrogen Energy 2021, 46, 11956–11968. [Google Scholar] [CrossRef]
  26. Tang, L. Hydrogen Liquefaction Process Design and System Simulation Based on Liquid Nitrogen Precooling. Master’s Thesis, Zhejiang University, Hangzhou, China, 2011. [Google Scholar]
  27. Quack, H. Conceptual design of a high efficiency large capacity hydrogen liquefier. In AIP Conference Proceedings; AIP: Madison, WI, USA, 2002; pp. 255–263. [Google Scholar]
  28. Cao, X. Design and analysis of a new type of dual-pressure Linde-Hampson hydrogen liquefaction process. Chem. Ind. Eng. Prog. 2021, 40, 6663–6669. [Google Scholar]
  29. Xu, J.; Lu, Y.; Song, Z.; Chen, X.; Lin, W. Optimal design and analysis of a liquid hydrogen and LNG coproduction system with multistage multicycle cascade refrigeration system. Int. J. Hydrogen Energy 2024, 49, 1432–1449. [Google Scholar] [CrossRef]
  30. Bi, Y.; Ju, Y. Conceptual design and optimization of a novel hydrogen liquefaction process based on helium expansion cycle integrating with mixed refrigerant pre-cooling. Int. J. Hydrogen Energy 2022, 47, 16949–16963. [Google Scholar] [CrossRef]
  31. Ansarinasab, H.; Mehrpooya, M.; Mohammadi, A. Advanced exergy and exergoeconomic analyses of a hydrogen liquefaction plant equipped with mixed refrigerant system. J. Clean. Prod. 2017, 144, 248–259. [Google Scholar] [CrossRef]
  32. Sun, H.; Xu, J.; Wang, C.; Geng, J.; Rong, G.; Gao, X. Optimization and analysis of a cascaded dual mixed refrigerant hydrogen liquefaction process considering the influence of pre-cooling stages. Int. J. Hydrogen Energy 2023, 48, 31653–31670. [Google Scholar] [CrossRef]
  33. Aasadnia, M.; Mehrpooya, M. Conceptual design and analysis of a novel process for hydrogen liquefaction assisted by absorption precooling system. J. Clean. Prod. 2018, 205, 565–588. [Google Scholar] [CrossRef]
  34. Yilmaz, C.; Kaska, O. Performance analysis and optimization of a hydrogen liquefaction system assisted by geothermal absorption precooling refrigeration cycle. Int. J. Hydrogen Energy 2018, 43, 20203–20213. [Google Scholar] [CrossRef]
  35. Moreno-Blanco, J.; Petitpas, G.; Espinosa-Loza, F.; Elizalde-Blancas, F.; Martinez-Frias, J.; Aceves, S.M. The storage performance of automotive cryo-compressed hydrogen vessels. Int. J. Hydrogen Energy 2019, 44, 16841–16851. [Google Scholar] [CrossRef]
  36. Moreno-Blanco, J.; Petitpas, G.; Espinosa-Loza, F.; Elizalde-Blancas, F.; Martinez-Frias, J.; Aceves, S.M. The fill density of automotive cryo-compressed hydrogen vessels. Int. J. Hydrogen Energy 2019, 44, 1010–1020. [Google Scholar] [CrossRef]
  37. Moreno-Blanco, J.; Camacho, G.; Valladares, F.; Aceves, S.M. The cold high-pressure approach to hydrogen delivery. Int. J. Hydrogen Energy 2020, 45, 27369–27380. [Google Scholar] [CrossRef]
  38. Fu, H.; Lv, C.; Meng, J.; He, M.; Wu, J.; Gong, L. Strength and fatigue study of on-board type III cryo-compressed hydrogen storage cylinder. Int. J. Hydrogen Energy 2024, 57, 1081–1088. [Google Scholar] [CrossRef]
  39. U.S. Department of Energy. On-Board Hydrogen Storage Systems—Projected Performance and Cost Parameters; U.S. Department of Energy: Washington, DC, USA, 2010.
  40. Song, Z.; Xu, J.; Chen, X. Design and optimization of a high-density cryogenic supercritical hydrogen storage system based on helium expansion cycle. Int. J. Hydrogen Energy 2024, 49, 1401–1418. [Google Scholar] [CrossRef]
  41. Xu, J.; Song, Z.; Chen, X.; Yang, Q. Design and optimization of high-density cryogenic supercritical hydrogen storage systems integrating with dual mixed refrigerant cycles. Energy 2024, 290, 130124. [Google Scholar] [CrossRef]
  42. Xu, J.; Huang, F.; Chen, X.; Yang, Q.; Zhang, H. Design and optimization of cryogenic supercritical hydrogen storage system coupled with mixed refrigerant and gas expansion cycle. Appl. Therm. Eng. 2024, 243, 122606. [Google Scholar] [CrossRef]
  43. Lu, Y.; Chen, X.; Xu, J.; Tian, Y.; Zhang, H. Techno-economic analysis of an advanced polygeneration liquid air energy storage system coupled with LNG cold energy, solar energy, and hydrate based desalination. Energy Convers. Manag. 2023, 297, 117726. [Google Scholar] [CrossRef]
  44. Aspen Technology, Inc. Aspen HYSYS, V12; AspenTech: Bedford, MA, USA, 2020.
  45. Incer-Valverde, J.; Mörsdorf, J.; Morosuk, T.; Tsatsaronis, G. Power-to-liquid hydrogen: Exergy-based evaluation of a large-scale system. Int. J. Hydrogen Energy 2023, 48, 11612–11627. [Google Scholar] [CrossRef]
  46. Xu, J.; Lin, W. Research on systems for producing liquid hydrogen and LNG from hydrogen-methane mixtures with hydrogen expansion refrigeration. Int. J. Hydrogen Energy 2021, 46, 29243–29260. [Google Scholar] [CrossRef]
  47. Yin, L.; Ju, Y. Process optimization and analysis of a novel hydrogen liquefaction cycle. Int. J. Refrig. 2020, 110, 219–230. [Google Scholar] [CrossRef]
Figure 1. Hydrogen storage system based on multi-stage Joule–Brayton cycle refrigeration.
Cryo 01 00006 g001
Figure 2. Process of GA.
Cryo 01 00006 g002
Figure 3. Ratio of energy consumption of compressors.
Cryo 01 00006 g003
Figure 4. Pressure ratio of compressors.
Cryo 01 00006 g004
Figure 5. The thermal composite curve.
Cryo 01 00006 g005
Figure 6. Exergy loss ratio of all types of equipment.
Cryo 01 00006 g006
Table 2. The formula of exergy losses for each equipment.
EquipmentEquation of Exergy Loss
Compressor E C O M = E i n E o u t = W C O M + m e i n e o u t
Cooler E C O O L = E i n E o u t = m e i n e o u t
Expander E E X P = E i n E o u t = m e i n e o u t W C O M
Heat exchanger E H X = E i n E o u t = m e i n e o u t
Table 3. Settings of GA.
ParametersValue
Maximum number of generation500
Population size233
Crossover fraction0.8
Migration fraction0.05
Stopping criteria (stall generations)50
Table 4. Upper and lower limits of parameter optimization.
ParametersPropertyUnitsLower LimitUpper Limit
MPMolar flowkmol/h8002800
PP1PressurekPa100200
PP3PressurekPa200450
PP5PressurekPa450900
MEMolar flowkmol/h22004000
PE1PressurekPa100200
PE4PressurekPa200450
PE6PressurekPa450900
MMMolar flowkmol/h25004500
PM1PressurekPa100200
PM5PressurekPa200450
PM7PressurekPa450900
MHHMolar flowkmol/h35005500
PHH1PressurekPa100200
PHH6PressurekPa200450
PHH8PressurekPa450900
MLHMolar flowkmol/h30005000
PLH1PressurekPa100200
PLH7PressurekPa200450
PLH9PressurekPa450900
PLH11PressurekPa9001700
TLH3Temperature°C−151−141
TLH4Temperature°C−96−86
TLH5Temperature°C−41−31
TLH6Temperature°C1727
Table 5. Optimized parameters.
StreamTemperature
/°C
Pressure
/kPa
Molar Flow
/(kmol/h)
Exergy/(kJ/kg)
P1−24.85136.35245123.8
P227.00136.35245116.4
P361.60321.21245166.6
P430.00321.21245162.9
P568.46797.992451114.8
P630.00797.992451109.3
E1−80.93186.81346588.8
E2−37.22186.81346564.7
E320.55186.81346553.6
E469.08380.293465120.2
E530.00380.293465115.3
E667.46652.293465166.0
E730.00652.293465161.4
E8−28.00652.293465169.7
M1−132.86125.183731173.3
M2−90.44125.18373197.4
M3−31.87125.18373146.1
M420.55125.18373132.7
M586.43272.223731165.3
M630.00272.223731152.2
M784.28512.203731261.3
M830.00512.203731249.1
M9−28.00512.203731260.8
M10−83.00512.203731305.7
HH1−188.71106.8350592334.5
HH2−147.48106.8350591255.4
HH3−86.09106.835059456.3
HH4−31.87106.835059152.6
HH520.55106.83505965.5
HH6141.64299.6350591592.3
HH730.00299.6350591334.6
HH8139.48751.1750592715.9
HH930.00751.1750592466.7
HH10−28.00751.1750592541.6
HH11−83.00751.1750592833.6
HH12−138.00751.1750593492.2
LH1−226.15141.5246544608.3
LH2−193.27141.5246542849.3
LH3−141.22141.5246541486.9
LH4−86.09141.524654802.3
LH5−31.87141.524654498.6
LH620.55141.524654411.4
LH7120.42338.0646541661.7
LH830.00338.0646541483.2
LH9115.43706.1146542552.2
LH1030.00706.1146542390.4
LH11124.601582.2246543579.8
LH1230.001582.2246543386.3
LH13−28.001582.2246543461.5
LH14−83.001582.2246543754.9
LH15−138.001582.2246544419.3
LH16−188.001582.2246545690.0
All the streams are gas phase or supercritical state, and there is no liquid phase or solid phase.
Table 6. System energy consumption.
ParametersValue
Compressor power consumption (kW)48,913.8
Power recovered by the expander (kW)8665.4
The flow rate of mainstream hydrogen (kg/h)7200
SEC (kWh/kg)5.71
EXE (%)56.2
Table 7. Pressure ratio of compressors.
EquipmentBefore OptimizationOptimize
COM-12.852.36
COM-22.822.48
COM-32.242.04
COM-42.161.72
COM-52.462.17
COM-62.441.88
COM-72.852.80
COM-83.052.51
COM-92.622.39
COM-102.642.09
COM-112.702.24
Table 8. The COP of each refrigeration cycle.
Refrigerant of CycleCOP
Propane1.770
Ethene1.657
Methane1.805
Hydrogen (higher temperature)1.140
Hydrogen (lower temperature)0.994
Table 9. Heat transfer condition.
Before OptimizationOptimized
MITD/°CLMTD/°CMITD/°CLMTD/°CUA/(kW/°C)
HX-15.006.413.005.272044
HX-25.006.853.003.882017
HX-35.005.693.003.721590
HX-44.724.943.004.22836
HX-55.026.643.004.21285
Table 10. Exergy loss of the equipment.
EquipmentExergy Loss/kWExergy Damage Rate/%
COM-1234.321.72
COM-2236.691.74
COM-3273.512.01
COM-4208.771.53
COM-5318.032.34
COM-6262.751.93
COM-7536.073.94
COM-8486.673.58
COM-9426.983.14
COM-10369.372.71
COM-11400.912.95
COM-12322.672.37
COM-13325.042.39
COM-14326.132.40
COM-15327.252.40
COM-16331.232.43
COM-17339.462.49
EXP-1455.443.35
EXP-2477.253.51
EXP-3613.114.50
EXP-41301.849.56
EXP-51538.2611.30
COOL-13.750.03
COOL-25.490.04
COOL-34.900.04
COOL-44.610.03
COOL-513.060.10
COOL-612.240.09
COOL-7257.681.89
COOL-8249.251.83
COOL-9178.541.31
COOL-10161.771.19
COOL-11193.491.42
COOL-12216.341.59
COOL-13219.761.61
COOL-14220.971.62
COOL-15221.521.63
COOL-16224.331.65
COOL-17227.531.67
HX-1209.491.54
HX-2192.951.42
HX-3255.721.88
HX-4331.762.44
HX-595.250.70
Overall exergy loss13,612.11100.00
Disclaimer/Publisher’s Note: The statements, opinions and data contained in all publications are solely those of the individual author(s) and contributor(s) and not of MDPI and/or the editor(s). MDPI and/or the editor(s) disclaim responsibility for any injury to people or property resulting from any ideas, methods, instructions or products referred to in the content.

