Article

Research on a Real-Time Tunnel Vehicle Speed Detection System Based on YOLOv8 and DeepSORT Algorithms

1
Nanping Wusha Expressway Co., Ltd., Nanping 353000, China
2
Fujian Expressway Science & Technology Innovation Research Institute Co., Ltd., Fuzhou 350000, China
3
College of Civil Engineering, Fuzhou University, Fuzhou 350116, China
*
Author to whom correspondence should be addressed.
Intell. Infrastruct. Constr. 2025, 1(3), 10; https://doi.org/10.3390/iic1030010
Submission received: 8 September 2025 / Revised: 27 October 2025 / Accepted: 1 November 2025 / Published: 18 November 2025

Abstract

Tunnels serve as a critical hub in urban transportation networks; their monotonous and enclosed environment is prone to inducing speeding behavior, necessitating an efficient vehicle speed monitoring system. Traditional methods suffer from high costs and slow response times, making them inadequate for the complex scenarios encountered in tunnel environments. This study proposes a real-time tunnel vehicle speed monitoring system based on YOLOv8s and DeepSORT. YOLOv8s is used to detect and classify cars, trucks, and buses, while DeepSORT applies Kalman filtering and the Hungarian algorithm to construct motion trajectories. Vehicle speed is estimated through perspective geometric transformation combined with a sliding-window approach, with a speeding threshold of 100 km/h and corresponding visual alerts. Using surveillance video from an expressway tunnel as the dataset, the system achieved detection accuracies of 98% for cars, 96% for trucks, and 91% for buses. Speed detection performance metrics included an average speed deviation (ASD) of 2.54 km/h, a deviation degree of vehicle speed (DDVS) of 3.12, vehicle speed stability (VST) of 1.22, and speed difference ratio (SDR) of 2.9%. Analysis revealed a longitudinal “deceleration–acceleration–deceleration” inverted U-shaped speed profile along the tunnel. Statistical tests confirmed these findings: the Mann–Whitney U test showed highly significant differences in vehicle speeds between cars and trucks across different tunnel sections, and the Kruskal–Wallis test further indicated significant speed variations across the entrance, middle, and exit segments for both vehicle types.

1. Introduction

In recent years, with the accelerated pace of urbanization and the rapid growth of traffic volumes, tunnel traffic management has been facing increasingly severe challenges. As key components of urban transportation networks, tunnels require real-time monitoring of internal traffic flow and timely identification of abnormal driving behaviors to ensure traffic safety and improve road efficiency. Traditional traffic monitoring methods mainly rely on physical devices, such as inductive loop detectors and radar speed sensors. Although these technologies offer high measurement accuracy, they suffer from high installation costs, maintenance difficulties, and limited coverage, making them inadequate for precise vehicle behavior analysis in complex environments [1]. In tunnel scenarios in particular, factors such as varying lighting conditions and perspective distortion further complicate traffic monitoring.
Statistics indicate that speeding is one of the primary causes of tunnel traffic accidents, with its occurrence closely related to vehicle type, traffic density, and driver behavior [2]. Research has demonstrated that expressway tunnels, as semi-enclosed structures with abrupt lighting transitions, can induce constrained and irritable psychology among drivers, leading to risky behaviors such as speeding and fatigued driving [3]. More critically, monitoring driver behavior has been identified as crucial for improving tunnel traffic safety, as drivers often fail to properly adjust their speed when transitioning between different tunnel zones [4]. Therefore, the development of real-time, high-precision systems for traffic speed monitoring and abnormal speed behavior detection is not only fundamental to ensuring tunnel safety but also forms a core technological foundation for advancing next-generation intelligent transportation systems (ITSs).
In recent years, the rapid development of computer vision and deep learning technologies has provided new opportunities for traffic flow monitoring. Object detection algorithms such as the YOLO (You Only Look Once) series have demonstrated excellent performance in vehicle recognition due to their efficient detection capabilities, gradually becoming the mainstream method for object detection in traffic scenarios [5]. Multi-object tracking algorithms like DeepSORT achieve stable inter-frame target association by integrating deep features with kinematic models [6]. YOLOv8, developed by the Ultralytics team, optimizes network architecture and training strategies, achieving a better balance between accuracy and speed. It is especially suitable for edge device deployment and real-time detection tasks [7]. When combined with DeepSORT, which integrates Kalman filtering, the Hungarian matching algorithm, and deep appearance features, it can effectively handle occlusion and ID switching problems in complex scenes. This combination has been widely applied in fields such as traffic flow analysis and trajectory extraction [8,9]. Multi-object tracking technology based on YOLOv8 and DeepSORT can address tracking instability caused by occlusion between targets. In terms of speed estimation, Costa et al. proposed a method using pixel-based image scaling factors to estimate vehicle distance from the camera in video sequences, enabling average speed calculation [10]; Tayeb et al. implemented a background subtraction technique based on Gaussian mixture models to handle complex backgrounds and appearance variations caused by lighting and scaling effects, using Kalman filtering for frame-by-frame vehicle tracking and perspective geometry for speed estimation [11]. Most existing studies calculate speed through pixel-to-physical coordinate mapping combined with motion models, but due to detection noise and environmental interference, there is still room to improve the stability and accuracy of speed estimation.
Although the aforementioned technologies have made significant progress in general traffic scenarios, vehicle speed detection in tunnel environments still faces challenges such as low lighting, glare, complex backgrounds, high-speed vehicle movement, and potential occlusions. Accurate speed estimation in tunnels requires comprehensive consideration of factors such as camera calibration, inter-frame noise, and vehicle type differences. Most existing studies have focused on open road environments or intersection scenes [12,13,14], while systematic detection and analysis tailored to tunnels—an enclosed and constrained environment—remain insufficient. There is an urgent need to develop a comprehensive solution with strong adaptability, high precision, and real-time performance.
Against this backdrop, this study proposes an integrated real-time tunnel vehicle speed detection system that combines YOLOv8 for object detection and DeepSORT for multi-object tracking. Using surveillance video from an expressway tunnel as the dataset, the system’s performance in terms of classification accuracy and speed analysis is evaluated, verifying the effectiveness and robustness of the proposed approach.
The main contributions of this study are as follows:
(1) A fusion framework for vehicle detection and tracking tailored to tunnel scenarios is constructed, significantly improving detection stability under complex lighting conditions;
(2) A speed estimation algorithm based on perspective transformation is designed, enabling non-contact speed measurement;
(3) A complete abnormal event identification and warning mechanism is established, providing technical support for tunnel traffic safety management.

2. Methods

2.1. Overview

The system is designed to achieve real-time monitoring of vehicle speeds and detection of abnormal speed behaviors in tunnel traffic flows based on YOLOv8 and DeepSORT. The core processing pipeline is illustrated in Figure 1 and consists of the following components.
(1) Video Acquisition and Data Preprocessing:
The system reads video streams from a specified path, parses frame rate and resolution parameters, and establishes a standardized data input channel. A frame buffer mechanism is employed to ensure stable video transmission and prevent frame loss caused by hardware latency.
(2) Vehicle Detection
The YOLOv8s object detection algorithm is applied to analyze each video frame. A confidence threshold of 0.5 is set to filter reliable bounding boxes. Combined with a custom-built training dataset, the system classifies detected vehicles into three categories, with class IDs 0/1/2 corresponding to cars, trucks, and buses, respectively.
(3) Vehicle Tracking
The DeepSORT algorithm is utilized to associate detected objects across frames. Kalman filtering is used for trajectory prediction and unique ID assignment, forming a vehicle trajectory database to support subsequent speed estimation.
(4) Perspective Transformation and Vehicle Speed Detection
By integrating physical motion models with perspective transformation theory, the system dynamically calculates vehicle speeds. When speeding behavior is detected (exceeding 100 km/h), an abnormal event is triggered.
(5) Result Display and Data Storage:
The system overlays bounding boxes, speed information, and warning messages on video frames in real time. Screenshots of abnormal events are saved to local storage, forming a diversified alert mechanism.

2.2. YOLOv8

YOLO (You Only Look Once) is a class of end-to-end methods that reformulate object detection as a regression problem. Its core advantages lie in high speed, lightweight architecture, and suitability for deployment on edge devices [5]. YOLOv8 utilizes Convolutional Neural Networks (CNNs) to learn object features within images, adopting an end-to-end detection framework that leverages multi-scale prediction and grid partitioning to detect and localize objects [15]. The model performs a single forward pass to simultaneously predict object locations and categories, offering significantly higher detection efficiency compared to traditional two-stage detection algorithms.
YOLOv8s, with a moderate number of parameters and high recognition accuracy, achieves efficient real-time detection performance on edge computing platforms. This meets the technical requirements of real-time monitoring in tunnel traffic flow scenarios. Therefore, YOLOv8s is selected as the base detection model in this study. The network architecture of YOLOv8s is shown in Figure 2.

2.2.1. Classification and Prediction

In this system, YOLOv8 is responsible for identifying and locating vehicle targets from video frames, including three types: cars, trucks, and buses. The basic principles are as follows:
For an input image I R H × W × 3 , the YOLO network divides it into S × S grid cells. Each grid cell is responsible for predicting B bounding boxes. Each bounding box contains five parameters: the center coordinates ( x ,   y ) , width and height ( w ,   h ) , and a confidence score c .
The bounding box prediction is determined using Equations (1)–(4):
x = σ t x + c x
y = σ t y + c y
w = p w · e t w
h = p h · e t h
Here, c x , ,   c y denote the top-left coordinates of the grid cell; p w , p h represent the width and height of the anchor box; σ is the sigmoid activation function; and t x , t y , t w , t h are the predicted outputs of the network.
Meanwhile, each grid cell also predicts the probabilities for G object classes.
The trained YOLOv8 model in this system is capable of distinguishing between three main vehicle types: lightweight cars, heavy-duty trucks, and buses. This classification capability is essential for traffic flow statistics and speed analysis, as different types of vehicles exhibit distinct driving characteristics and speed distributions.
The class probabilities output by the model are normalized using the softmax function, defined as Equation (5):
G c k x = e z k j = 1 G e z j
where z k represents the raw output score for class k, and G is the total number of classes. The system only processes detection results with confidence scores exceeding a predefined threshold to ensure the reliability of the classification.

2.2.2. Loss Function

The loss function guides the network to learn how to distinguish between different vehicle categories and optimizes the model’s performance in multi-class recognition tasks. The loss function of YOLO consists of three components: coordinate loss, confidence loss, and classification loss, determined using Equations (6)–(9):
L t o t a l = L c o o r d + L c o n f + L c l s
L c o o r d = λ c o o r d i = 0 S 2 j = 0 B 1 i j o b j x i x i ^ 2 + y i y i ^ 2 + w i w i ^ 2 + h i h i ^ 2
L c o n f = i = 0 S 2 j = 0 B 1 i j o b j C i C i ^ 2 + λ n o o b j 1 i j n o o b j C i C i ^ 2
L c l s = i = 0 S 2 1 i o b j c c l a s s e s p i c p i ^ c 2
Specifically, 1 i j o b j indicates whether the j-th predicted bounding box in the i-th grid cell is responsible for detecting an object, λ c o o r d ,   λ n o o b j are balancing parameters used to weight the coordinate loss and the confidence loss for background boxes, respectively. L c o o r d represents the coordinate loss, L c o n f is the confidence loss, and L c l s denotes the classification loss.

2.2.3. Non-Maximum Suppression Mechanism

To address the issue of duplicate detections potentially generated by YOLOv8, the system implements a customized Non-Maximum Suppression (NMS) algorithm. The core idea of this algorithm is to suppress redundant detection boxes that have lower confidence scores and a high degree of overlap with boxes of higher confidence.
The Intersection over Union (IoU) is calculated using Equation (10):
I o U B 1 , B 2 = A r e a B 1 B 2 A r e a B 1 B 2
where B 1 and B 2 represent two bounding boxes, respectively. If the IoU between two boxes I o U B i , B j > τ I o U , the box with the lower confidence score is suppressed, and the box with the higher confidence score is retained. In this system, the IoU threshold τ I o U is set to 0.4, and the confidence threshold is set to 0.5, which ensures accurate detection while minimizing false positives and false negatives.

2.3. DeepSORT

Although YOLOv8 enables efficient detection of vehicle objects in images, its detection is performed independently on a frame-by-frame basis, making it incapable of tracking the identity and trajectory of the same object across consecutive frames. Therefore, a multi-object tracking algorithm is required to maintain the temporal consistency of vehicle IDs.
This study adopts the DeepSORT (Deep Simple Online and Realtime Tracking) algorithm to perform real-time tracking based on YOLOv8s detection results. The algorithm combines Kalman filtering for motion prediction and the Hungarian algorithm for data association, while also leveraging deep feature embeddings for appearance matching, effectively addressing challenges such as object occlusion and ID switching [16]. Through the integration of YOLOv8s and DeepSORT, the system achieves real-time detection, identity assignment, and trajectory tracking for each vehicle in the video, providing reliable data support for subsequent vehicle speed estimation and analysis.

2.3.1. State Space Model

DeepSORT uses an 8-dimensional state vector to describe the motion state of a target. Let M represent the state vector of the i -th tracked object, as shown in Equation (11):
M = x , y , s , r , x ˙ , y ˙ , s ˙ , r ˙ T
Here, ( x , y ) denotes the pixel coordinates of the center of the bounding box, s is the scale (area) of the bounding box, and r is the aspect ratio (width-to-height ratio). The terms x ˙ , y ˙ , s ˙ , r ˙ are the corresponding velocity components of these quantities.
The state transition equation for predicting the vehicle’s state in the next frame is shown in Equation (12):
m k + 1 = F x k + m k , F = I 4 × 4 Δ t × I 4 × 4 O 4 × 4 I 4 × 4
where F is the state transition matrix. Assuming constant velocity motion, Δ t represents the time interval between frames, and w k is the process noise.
The observation equation and observation matrix used to map the predicted state to the observed measurements are defined as Equation (13):
z k = P m k + v k , P = I 4 × 4 , 0 4 × 4
Here, the observation matrix P projects the 8-dimensional state vector m i into a 4-dimensional observation space, extracting only the position and scale information, and v k represents the observation noise.

2.3.2. Data Association Strategy

DeepSORT adopts a cascade matching strategy that combines Mahalanobis distance and cosine distance for target association.
The Mahalanobis distance is used to measure the discrepancy between the predicted position and the actual detection. Let z j be the observation vector of the j -th detection, provided by YOLO. S i is the covariance matrix, representing the statistical characteristics of observation noise, used to evaluate the reliability of motion-based matching. The distance is calculated using Equation (14):
d 1 m i , z j = z j P m i T S i 1 z j P m i
The cosine distance is used to compare the similarity of vehicle appearance features. Let r i be the appearance feature vector of the i -th tracked object, and r j be the appearance feature vector of the j -th detection. Both r j T   a n d   r k i are typically normalized unit vectors. The cosine distance is computed using Equation (15).
d 2 r i , r j = m i n { 1 r j T r k i | r k i } R i
The combined association metric is defined using Equation (16):
c i , j = λ d 1 m i , z j + 1 λ d 2 r i , r j
where λ [ 1 , 0 ] is a weighting coefficient that balances the contributions of the two distances.

2.4. Perspective Transformation and Speed Estimation Module

2.4.1. Principle of Perspective Transformation

Perspective transformation is the process of converting the image coordinates—i.e., the 2D pixel coordinates captured by the camera—into physical coordinates on the actual road surface, thereby eliminating distortion caused by the camera’s viewing angle. In the tunnel vehicle speed detection system, perspective transformation ensures that vehicle positions are accurately mapped from the image plane to the road plane, providing reliable spatial data for subsequent speed estimation.
During the transformation of the image into a bird’s-eye view, four corresponding points must be selected in both the original image and the transformed image. Specifically, four points (a, b, c, and d) are selected in the original image, and four corresponding points (a′, b′, c′, and d′) are selected in the bird’s-eye view image. Each point in the original image corresponds to a point in the transformed image: point a is mapped to a′, b to b′, and the same for c and d, as shown in Figure 3.
The transformation process is achieved using a 3 × 3 matrix H , known as the homography matrix. This matrix H is computed based on four pairs of corresponding points between the original image and the bird’s-eye view image, as shown in Equation (17):
A h = b
The coefficient matrix A R 8 × 8 is constructed from the original and bird’s-eye view coordinates of the four corresponding points (a, b, c, and d). The vector h = h 11 ,   h 12 , h 13 , h 21 , h 22 , h 23 , h 31 , h 32 , h 33 , T represents the homography matrix elements, and b R 8 is the target coordinate vector.
The homography matrix H describes the projective transformation between two planes, and maps image coordinates (x, y) to real-world coordinates via, as shown in Equation (18):
x y 1 = H x y 1 , H = h 11 h 12 h 13 h 21 h 22 h 23 h 31 h 32 h 33
To obtain the normalized real-world coordinates (x′, y′), a perspective division is performed using Equation (19):
x = h 11 x + h 12 y + h 13 h 31 x + h 32 y + h 33 , y = h 21 x + h 22 y + h 23 h 31 x + h 32 y + h 33

2.4.2. Principle of Vehicle Speed Estimation

To improve the accuracy and stability of speed estimation, the system adopts a multi-point-based speed calculation method using historical positions. For trajectory i , its speed at frame t is calculated using Equation (20):
v t i = j = 1 N 1 d t j + 1 , t j i j = 1 N 1 Δ t t j + 1 , t j · f f p s · 3.6
where d t j + 1 , t j i represents the Euclidean distance between two consecutive positions of trajectory i , calculated using the real-world coordinates ( x t j , y t j ) and ( x t j + 1 , y t j + 1 ) after perspective transformation using Equation (21):
d t j + 1 , t j i = x t j + 1 i x t j i 2 + y t j + 1 i y t j i 2
Δ t t j + 1 , t j is the time interval between the two frames, derived from the video frame rate f f p s . The factor 3.6 is used to convert the speed from meters per second (m/s) to kilometers per hour (km/h). To reduce the impact of noise from any single frame, the system uses the average speed across the most recent N = 10 positions.
To further enhance the reliability of speed estimation, a sliding window-based speed smoothing algorithm is implemented. For each trajectory, a speed history queue of length W (set to W = 10 ) is maintained. The current smoothed speed is computed using Equation (22):
v t ¯ ( i ) = 1 W i = t W + 1 t v i
The system incorporates an outlier detection mechanism, where only speed values within the valid range of 1 v 200 km/h are considered reasonable. Speed values outside this range are discarded. This approach effectively eliminates abnormal velocity measurements caused by detection errors or trajectory jumps.

2.4.3. Speeding Detection Mechanism

The system includes a real-time speeding detection function, which compares each vehicle’s smoothed speed against a predefined threshold, v l i m i t . If, for any trajectory i, the smoothed speed v t ¯ ( i ) > v l i m i t , a speeding alert is triggered. Based on publicly available information, the speed limit within this tunnel is 100 km/h. Therefore, the system sets v l i m i t = 100 km/h.
When a speeding vehicle is detected, a visual warning is displayed in the video: a semi-transparent red overlay is drawn inside the bounding box of the speeding vehicle. The transparency parameter is set to α = 0.3. The output image is generated using Equation (23):
I t = α · I o + 1 α · I z
where I t is the red overlay layer, I o is the original frame, and I z is the final rendered frame. Additionally, the bounding box color is changed to bold red, and the warning text “SPEEDING!” along with the current speed is displayed above the vehicle.

2.5. Bounding Box Smoothing and Stabilization

Considering the possibility of occlusion, stopping, or other anomalies during vehicle movement in the video, the system enhances robustness by applying exponential moving average (EMA) smoothing to the bounding box coordinates within a sliding window. The smoothing is computed using Equation (24):
B t s = α B t d + 1 α B t 1 s
where B t d is the detected bounding box at frame t, B t s is the smoothed bounding box, and α is the smoothing factor (set to 0.7). This method effectively enhances visual stability while maintaining the real-time nature of object tracking.

3. Results

3.1. Experimental Dataset and Environment

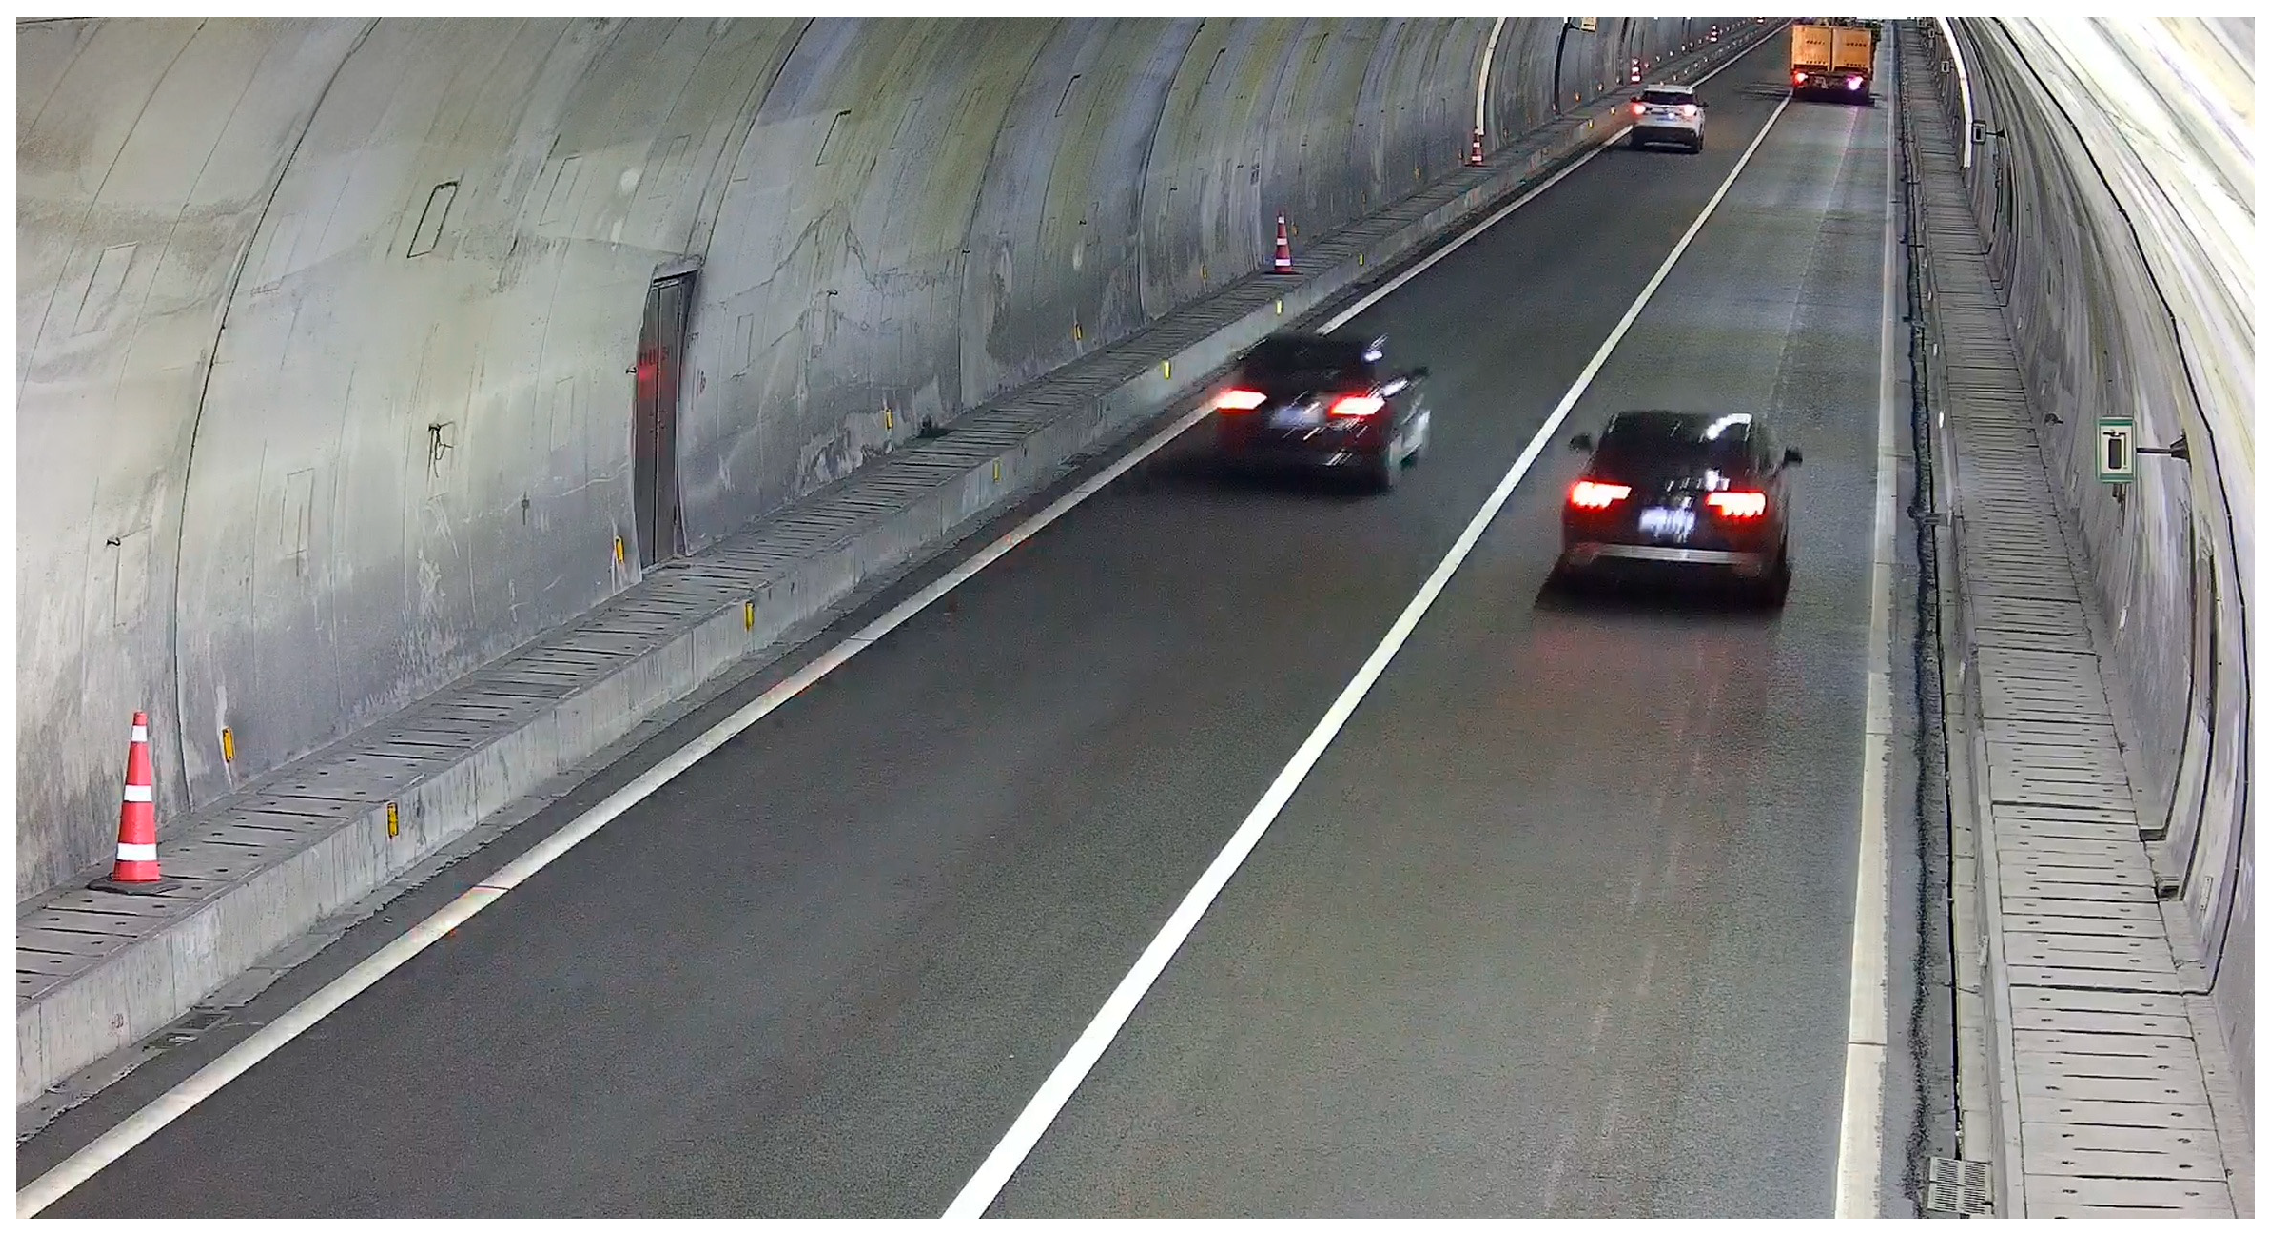
This study utilized traffic surveillance video from an expressway tunnel, recorded between 09:00 and 11:00 on 31 May 2025. Video frames were extracted at 25 fps intervals. The dataset was cleaned by removing redundant and blurred frames, and the class distribution was adjusted through reclassification. The final experimental dataset contained 2564 images, with YOLO-format bounding box annotations generated using the LabelImg tool for model training. The dataset contains 4130 labeled objects distributed across classes as follows: 3091 for “car,” 628 for “truck,” and 411 for “bus.” The dataset was divided into a training set of 2051 images and a validation set of 513 images. A separate test set was not used due to the limited dataset size; instead, model performance was assessed on the validation set through multiple training runs to ensure consistency and reproducibility. The sample video frame used for detection is shown in Figure 4.
To evaluate the performance and practical value of the proposed algorithm in vehicle object tracking scenarios, the experiments were conducted on a Windows 11 operating system. The hardware configuration included an AMD Ryzen 7 7435H CPU and an NVIDIA GeForce RTX 4050 GPU. On the software side, Python 3.10 was used as the programming environment, with CUDA 11.8 acceleration and the PyTorch 2.0 framework for deep learning implementation. The YOLOv8s model was reproduced using the Ultralytics implementation, and a custom-built dataset was employed for training. During the training phase, input images were standardized to a resolution of 640 × 640 pixels. The initial learning rate was set to 0.01, and the training process ran for 120 epochs with a batch size of 16. Stochastic Gradient Descent (SGD) was selected as the optimizer, with a momentum value set to 0.937.

3.2. Accuracy Evaluation

3.2.1. Classification Accuracy

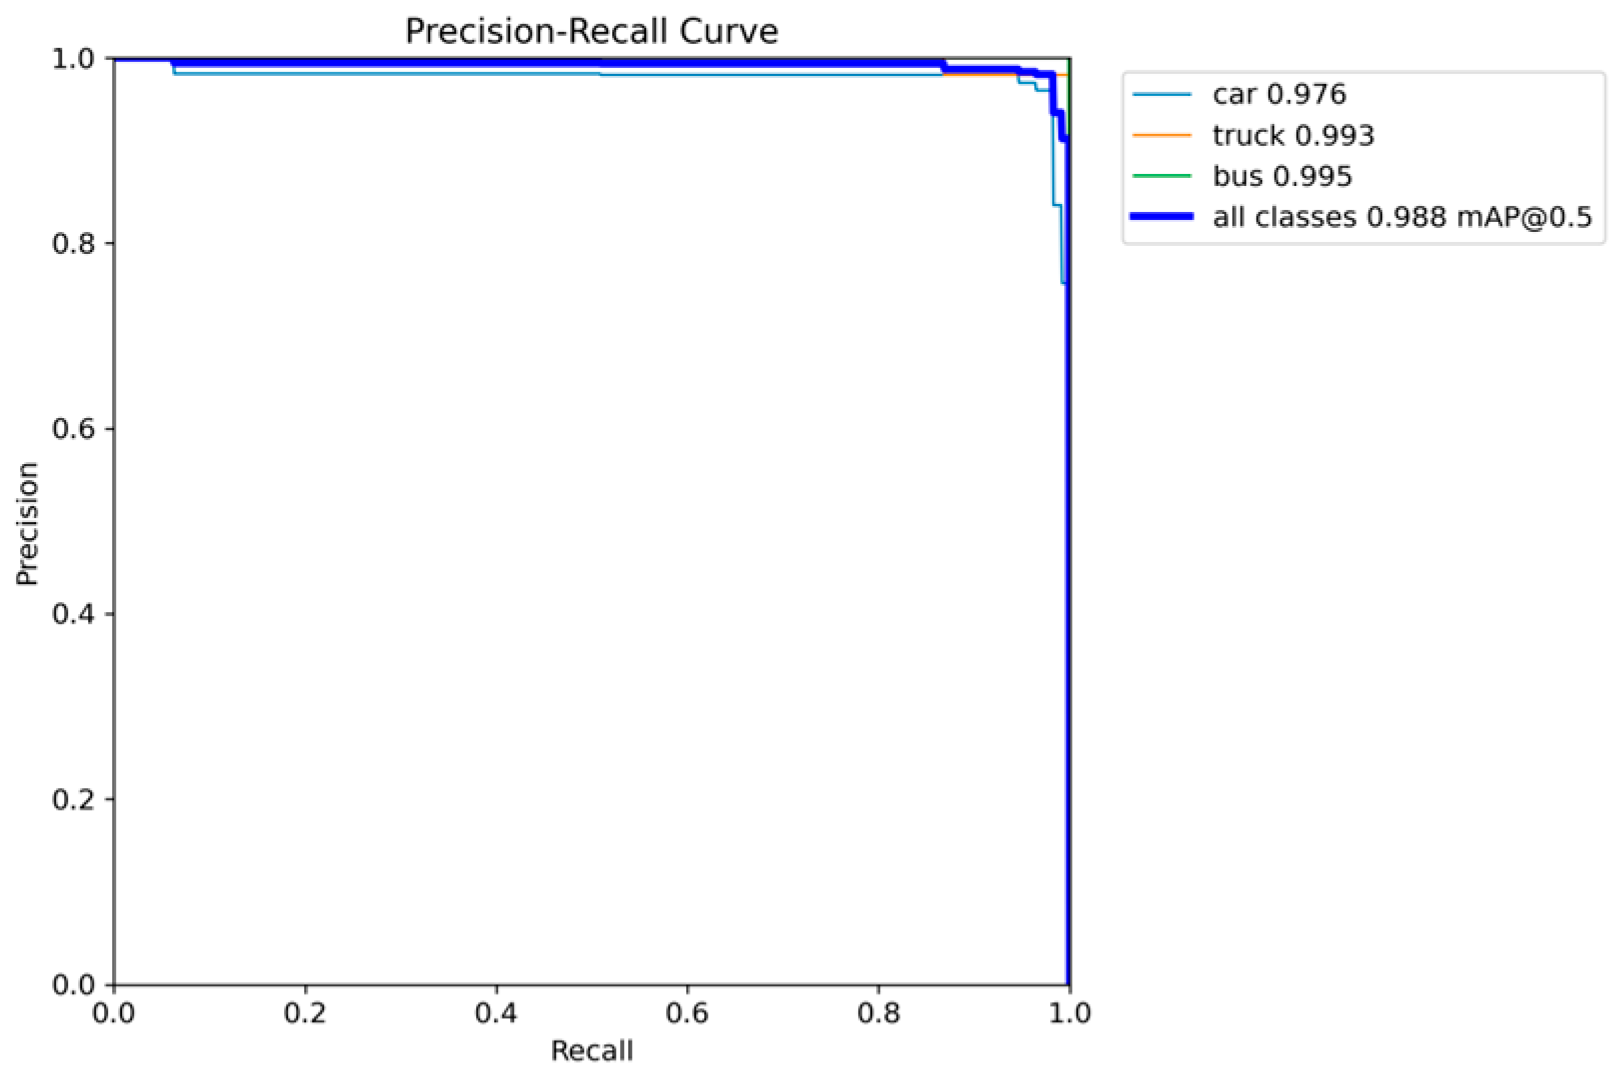
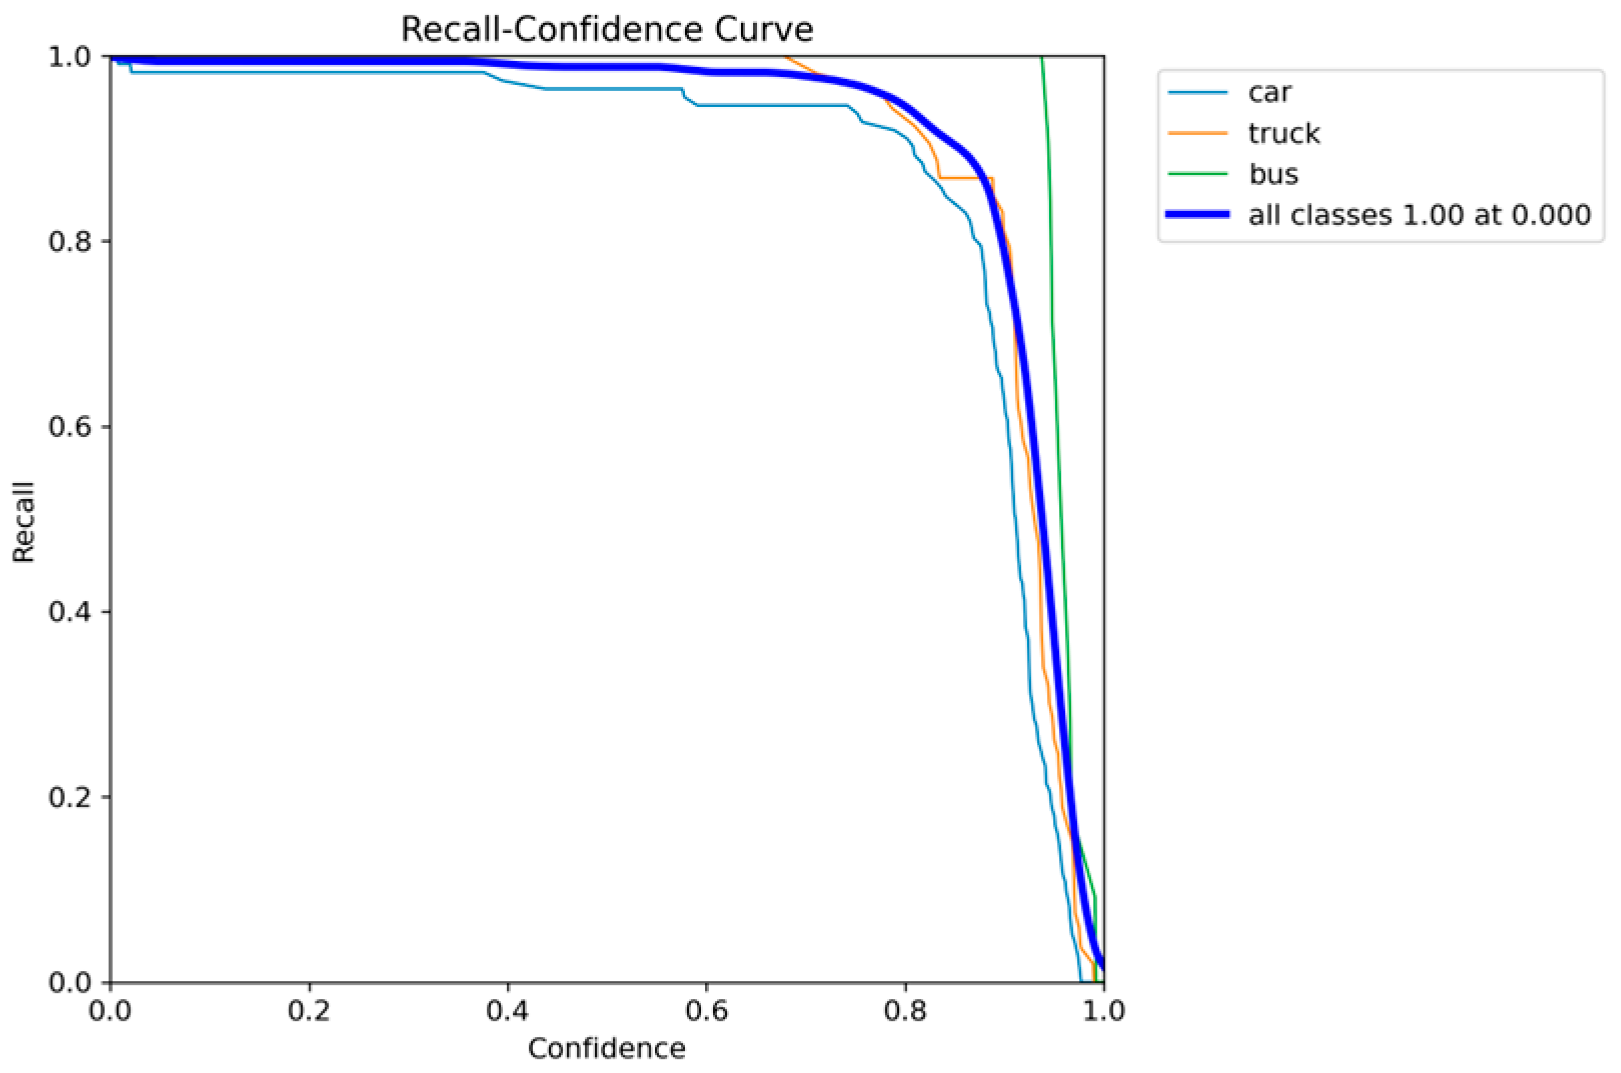
To comprehensively evaluate the detection performance of the model, this study employed multiple metrics, including the precision–recall (PR) curve, the F1 score–confidence interval curve, and curves showing the variations in recall and precision with respect to confidence levels. Results indicate that the precision–recall curve (Figure 5) demonstrates outstanding average precision (AP) across all vehicle categories: 0.976 for cars, 0.993 for trucks, and 0.995 for buses, with an overall mAP@0.5 reaching 0.988, highlighting the model’s strong object detection capability. The F1 score–confidence interval curve (Figure 6) shows that the model achieves its optimal F1 score of 0.97 at a confidence threshold of 0.7 and maintains high performance across a wide range of thresholds, reflecting strong robustness to confidence variations. The recall–confidence interval curve (Figure 7) further illustrates that the model sustains a high recall rate even at low confidence levels and remains stable at high thresholds, effectively reducing the risk of missed detections. The precision–confidence interval curve (Figure 8) shows that the model achieves a perfect precision score of 1.00 at a confidence threshold of 0.992 and maintains high precision across different confidence levels.
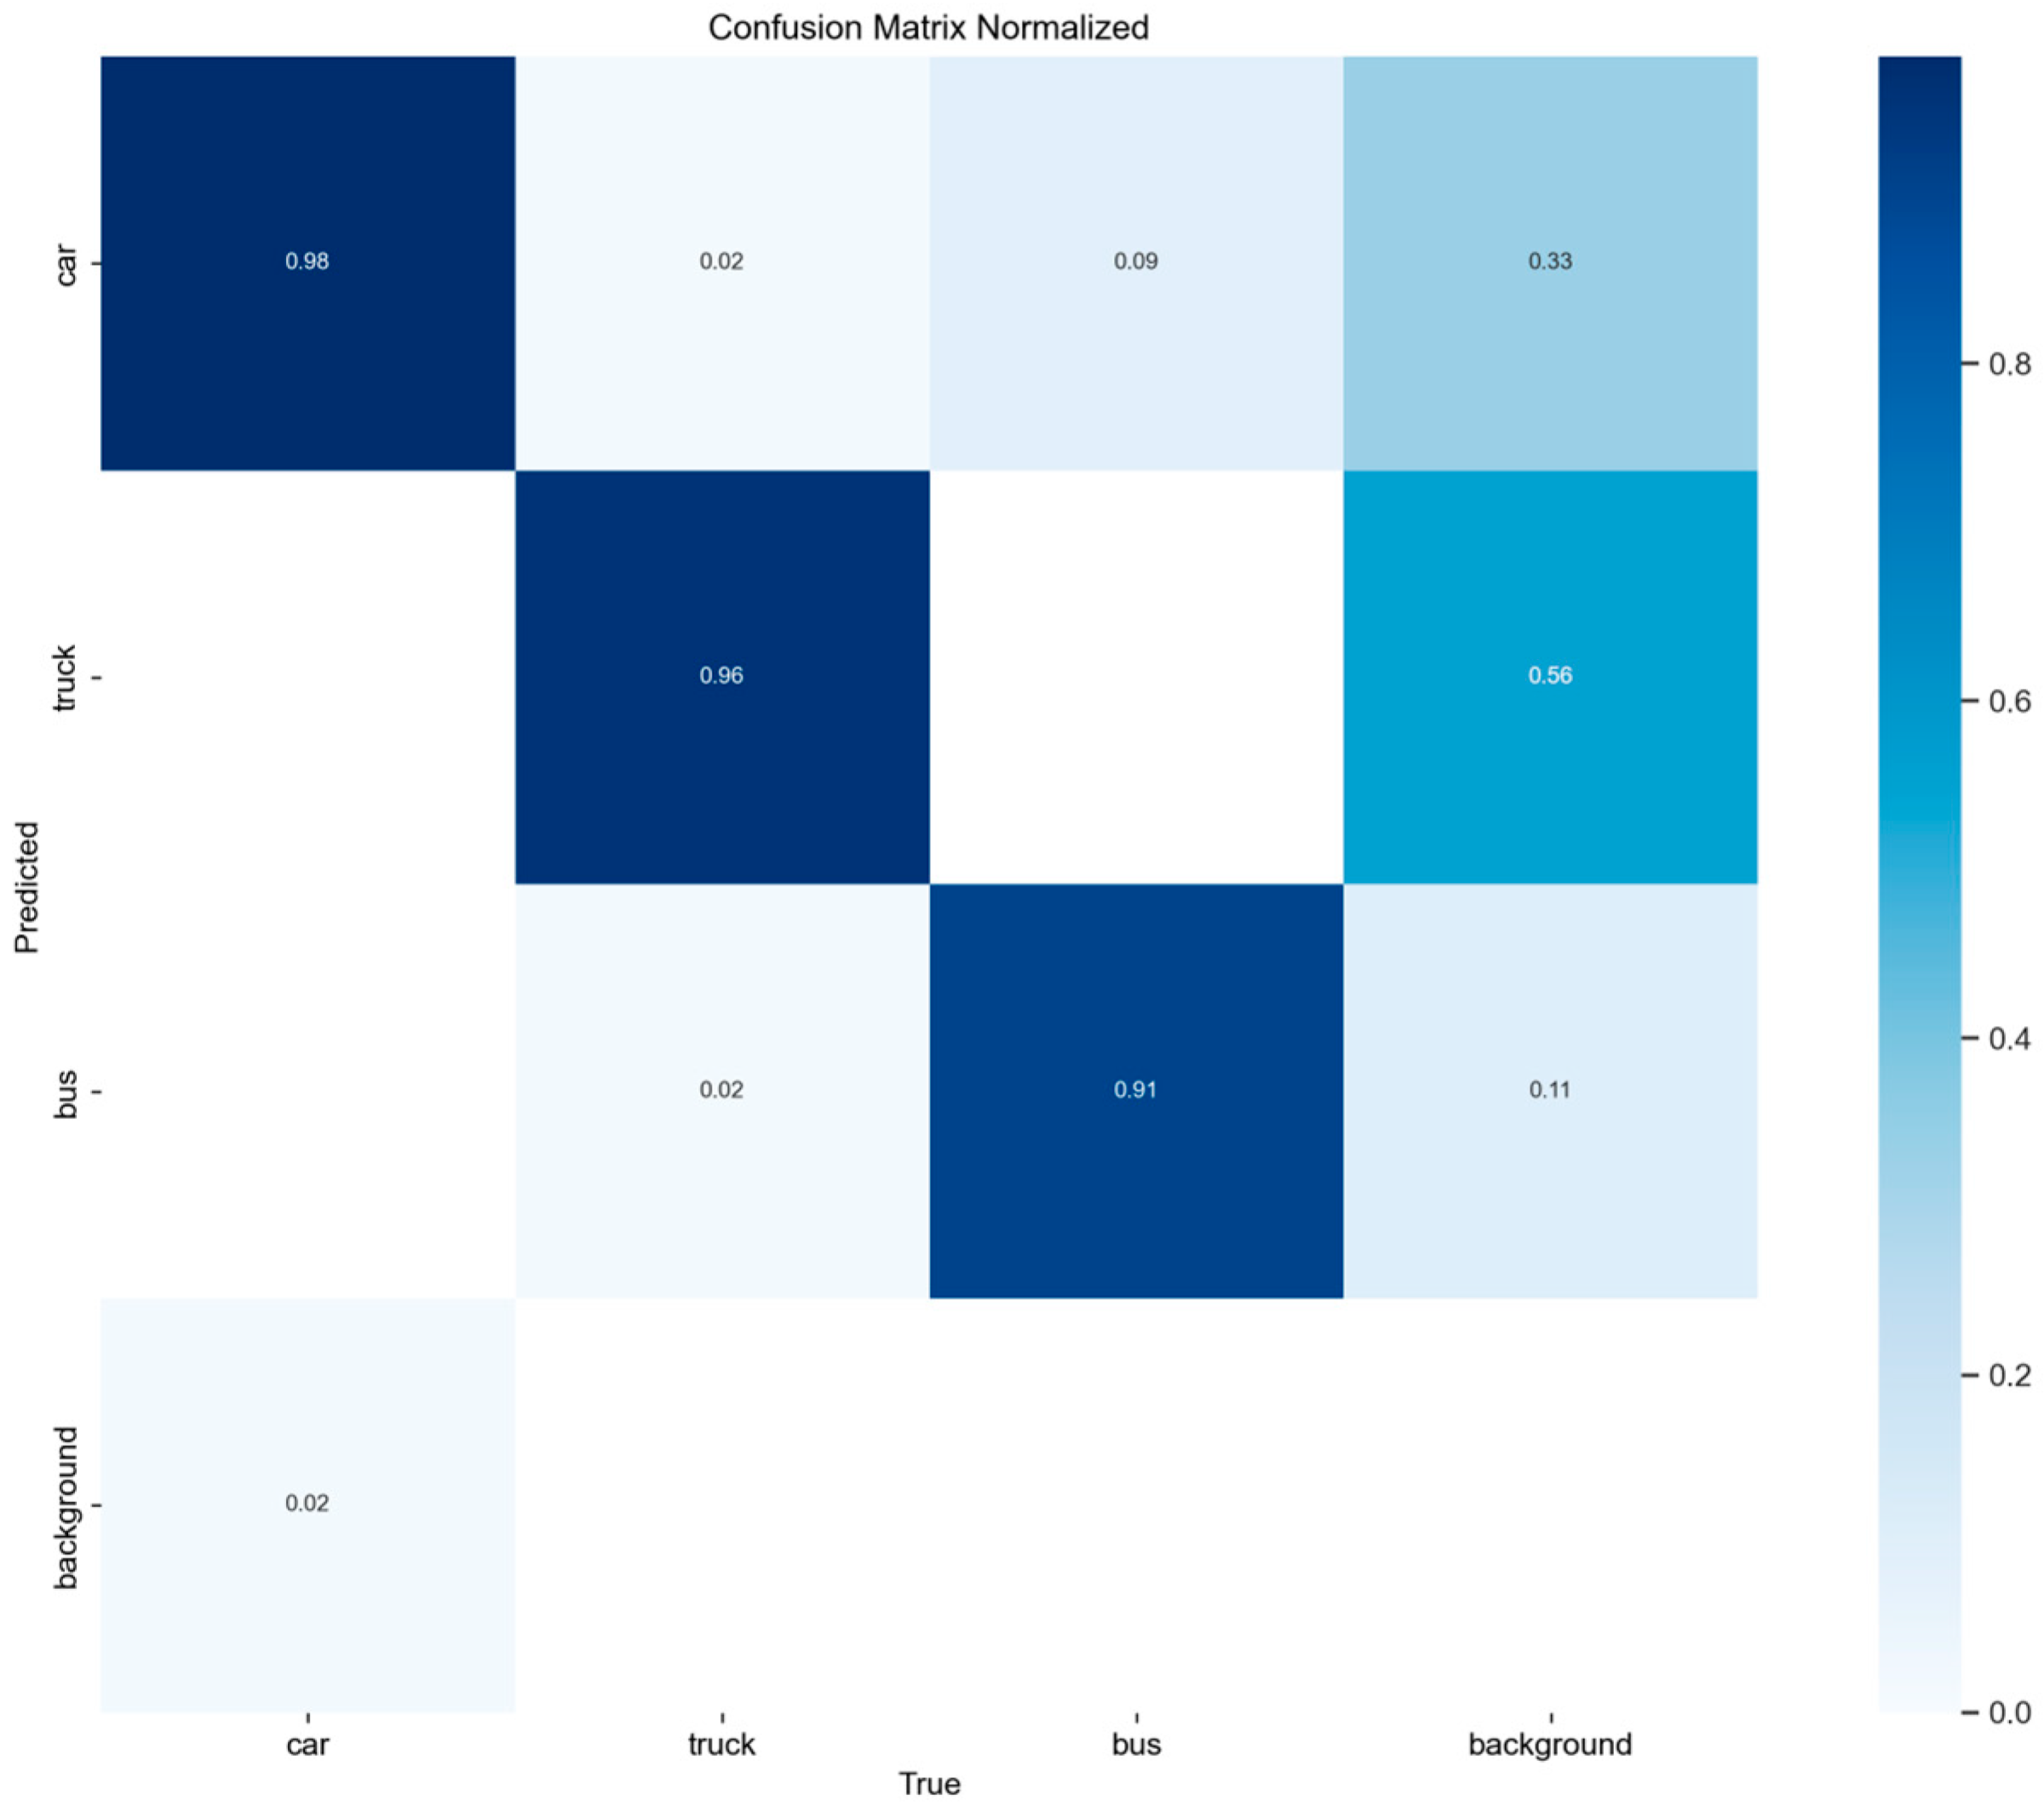
As shown in the normalized confusion matrix (Figure 9), the recognition accuracy for cars reaches 98%, for trucks 96%, and for buses 91%. These results demonstrate that the trained YOLOv8s model exhibits excellent classification performance in distinguishing different types of vehicles.
Based on all evaluation metrics, the tunnel vehicle recognition model built on YOLOv8s exhibits outstanding performance during accuracy verification. The model shows good convergence and generalization in the training phase and achieves excellent results in both classification accuracy and detection effectiveness.

3.2.2. Vehicle Speed Detection Accuracy

The ground truth vehicle speed data used in this study were obtained from a fixed radar speed measurement system deployed within the tunnel. This system, established by the local traffic management authority, offers high measurement accuracy (with an error margin generally within ±1 km/h) and can continuously record the instantaneous speed of passing vehicles without interfering with the traffic flow. Since radar-based speed detection is independent of lighting conditions and road surface markings, it is particularly well-suited for speed measurement in enclosed or complex environments such as tunnels. Therefore, the radar-measured speeds were adopted as the reference standard in this study for evaluating detection performance.
To assess the accuracy of the proposed vehicle speed detection method, the following four quantitative metrics were employed: average speed difference (ASD), deviation degree of vehicle speed (DDVS), vehicle speed stability (VST), and speed difference ratio (SDR). The formulas for these metrics are defined, as shown in Equations (25)–(28):
A S D = 1 n i = 1 n x i y i
D D V S = 1 n i = 1 n x i y i 2
V S T = D D V S A S D
S D R = n × A S D i = 1 n y i × 100 %
Here, x i represents the vehicle speed measured by the proposed system, while, y i denotes the ground truth speed obtained from the radar-based speed measurement system. A sample calculation is shown in Table 1.
In this study, ASD, DDVS, VST, and SDR were used as evaluation metrics. The experimental results are summarized in Table 2. The proposed vehicle speed detection algorithm achieved an average speed difference (ASD) of 2.54 km/h, a deviation degree of vehicle speed (DDVS) of 3.12, a vehicle speed stability (VST) of 1.22, and a speed difference ratio (SDR) of 2.9%. These results indicate that the system’s detected speeds closely match the ground truth radar-measured speeds, demonstrating both high accuracy and good stability.

3.2.3. Detection Timing Analysis

To further evaluate the real-time capability of the proposed YOLOv8s + DeepSORT system, we measured the average detection time during inference on representative test videos. The system achieved an average processing time of 0.0338 s per frame, corresponding to approximately 29.6 FPS on an NVIDIA RTX 4050 GPU (1080 p input resolution). Although the timing was obtained during practical video inference rather than in a dedicated model benchmarking stage, the results demonstrate that the proposed framework is capable of real-time vehicle detection and tracking in tunnel-like environments.

3.2.4. Ablation Study

To verify the necessity of each core module in our system, we conducted ablation experiments by systematically removing or replacing key components. Table 3 presents the results.
The ablation study reveals that (1) replacing DeepSORT with simple IoU-based tracking significantly degraded speed measurement performance, demonstrating the necessity of deep appearance features; (2) using YOLOv5s instead of YOLOv8s reduced detection mAP by 4.2% and increases ASD by 0.67 km/h; (3) removing the sliding window mechanism increased ASD by 62.2%, highlighting its critical role in temporal smoothing; (4) eliminating perspective geometric transformation resulted in the largest performance drop, with ASD increasing by 171.3%, confirming the importance of accurate spatial calibration in tunnel environments.

3.2.5. Algorithm Performance Comparison

To validate the effectiveness of the proposed YOLOv8s + DeepSORT system, we conducted a comprehensive comparison with state-of-the-art vehicle speed measurement methods, as summarized in Table 4. However, based on a literature review, we found that novel vehicle speed measurement methods specifically designed for tunnel environments have been relatively scarce over the past five years. Therefore, we selected comparable speed measurement methods from high-speed and urban road scenarios for this comparison.
Recent deep learning-based approaches have demonstrated significant improvements in vehicle speed estimation accuracy. The Enhanced YOLOv5s + DeepSORT method achieved an absolute speed error of 1–8 km/h with RMSE ranging from 2.06 to 9.28 km/h in highway and tunnel scenarios [17]. A YOLOv3 + DeepSORT approach combined with optical flow algorithms reported a MAE of 3.38 km/h and RMSE of 4.69 km/h [18]. Shaqib et al.’s YOLOv8-based system achieved comparable performance with MAE of 3.5 km/h and RMSE of 4.22 km/h in urban traffic scenarios [19]. Cvijetić et al. introduced a YOLO + 1D-CNN method using changing bounding box area (CBBA) features for speed estimation [21]. Arriffin et al. developed a video stream-based speed estimation model for automatic traffic flow analysis systems [20].
The proposed system demonstrates competitive performance with an average speed deviation (ASD) of 2.54 km/h, placing it among the top-performing methods in the literature. When compared with the YOLOv3 + DeepSORT method (MAE: 3.38 km/h) and the YOLOv8 detection system (MAE: 3.5 km/h), this approach shows improved accuracy with lower deviation metrics. The relatively low deviation degree of vehicle speed (DDVS) of 3.12 and vehicle speed stability (VST) of 1.22 indicate superior consistency compared to traditional approaches. The speed difference ratio (SDR) of 2.9% further confirms the system’s reliability for tunnel environments.
The superior performance of the proposed method can be attributed to several technical advantages: (1) YOLOv8s provides enhanced detection accuracy compared to earlier YOLO versions (YOLOv3, YOLOv5s), particularly for small and occluded objects common in tunnel scenarios; (2) DeepSORT’s deep appearance features and Kalman filtering ensure robust tracking under varying illumination conditions typical of tunnel environments; (3) the perspective geometric transformation combined with sliding-window approach effectively handles the unique spatial characteristics of tunnel monitoring; (4) the integration of multiple evaluation metrics (ASD, DDVS, VST, and SDR) provides a more comprehensive assessment of speed measurement reliability than single-metric approaches used in previous studies.

3.3. Analysis of Tunnel Traffic Operation Results

3.3.1. Detection Results

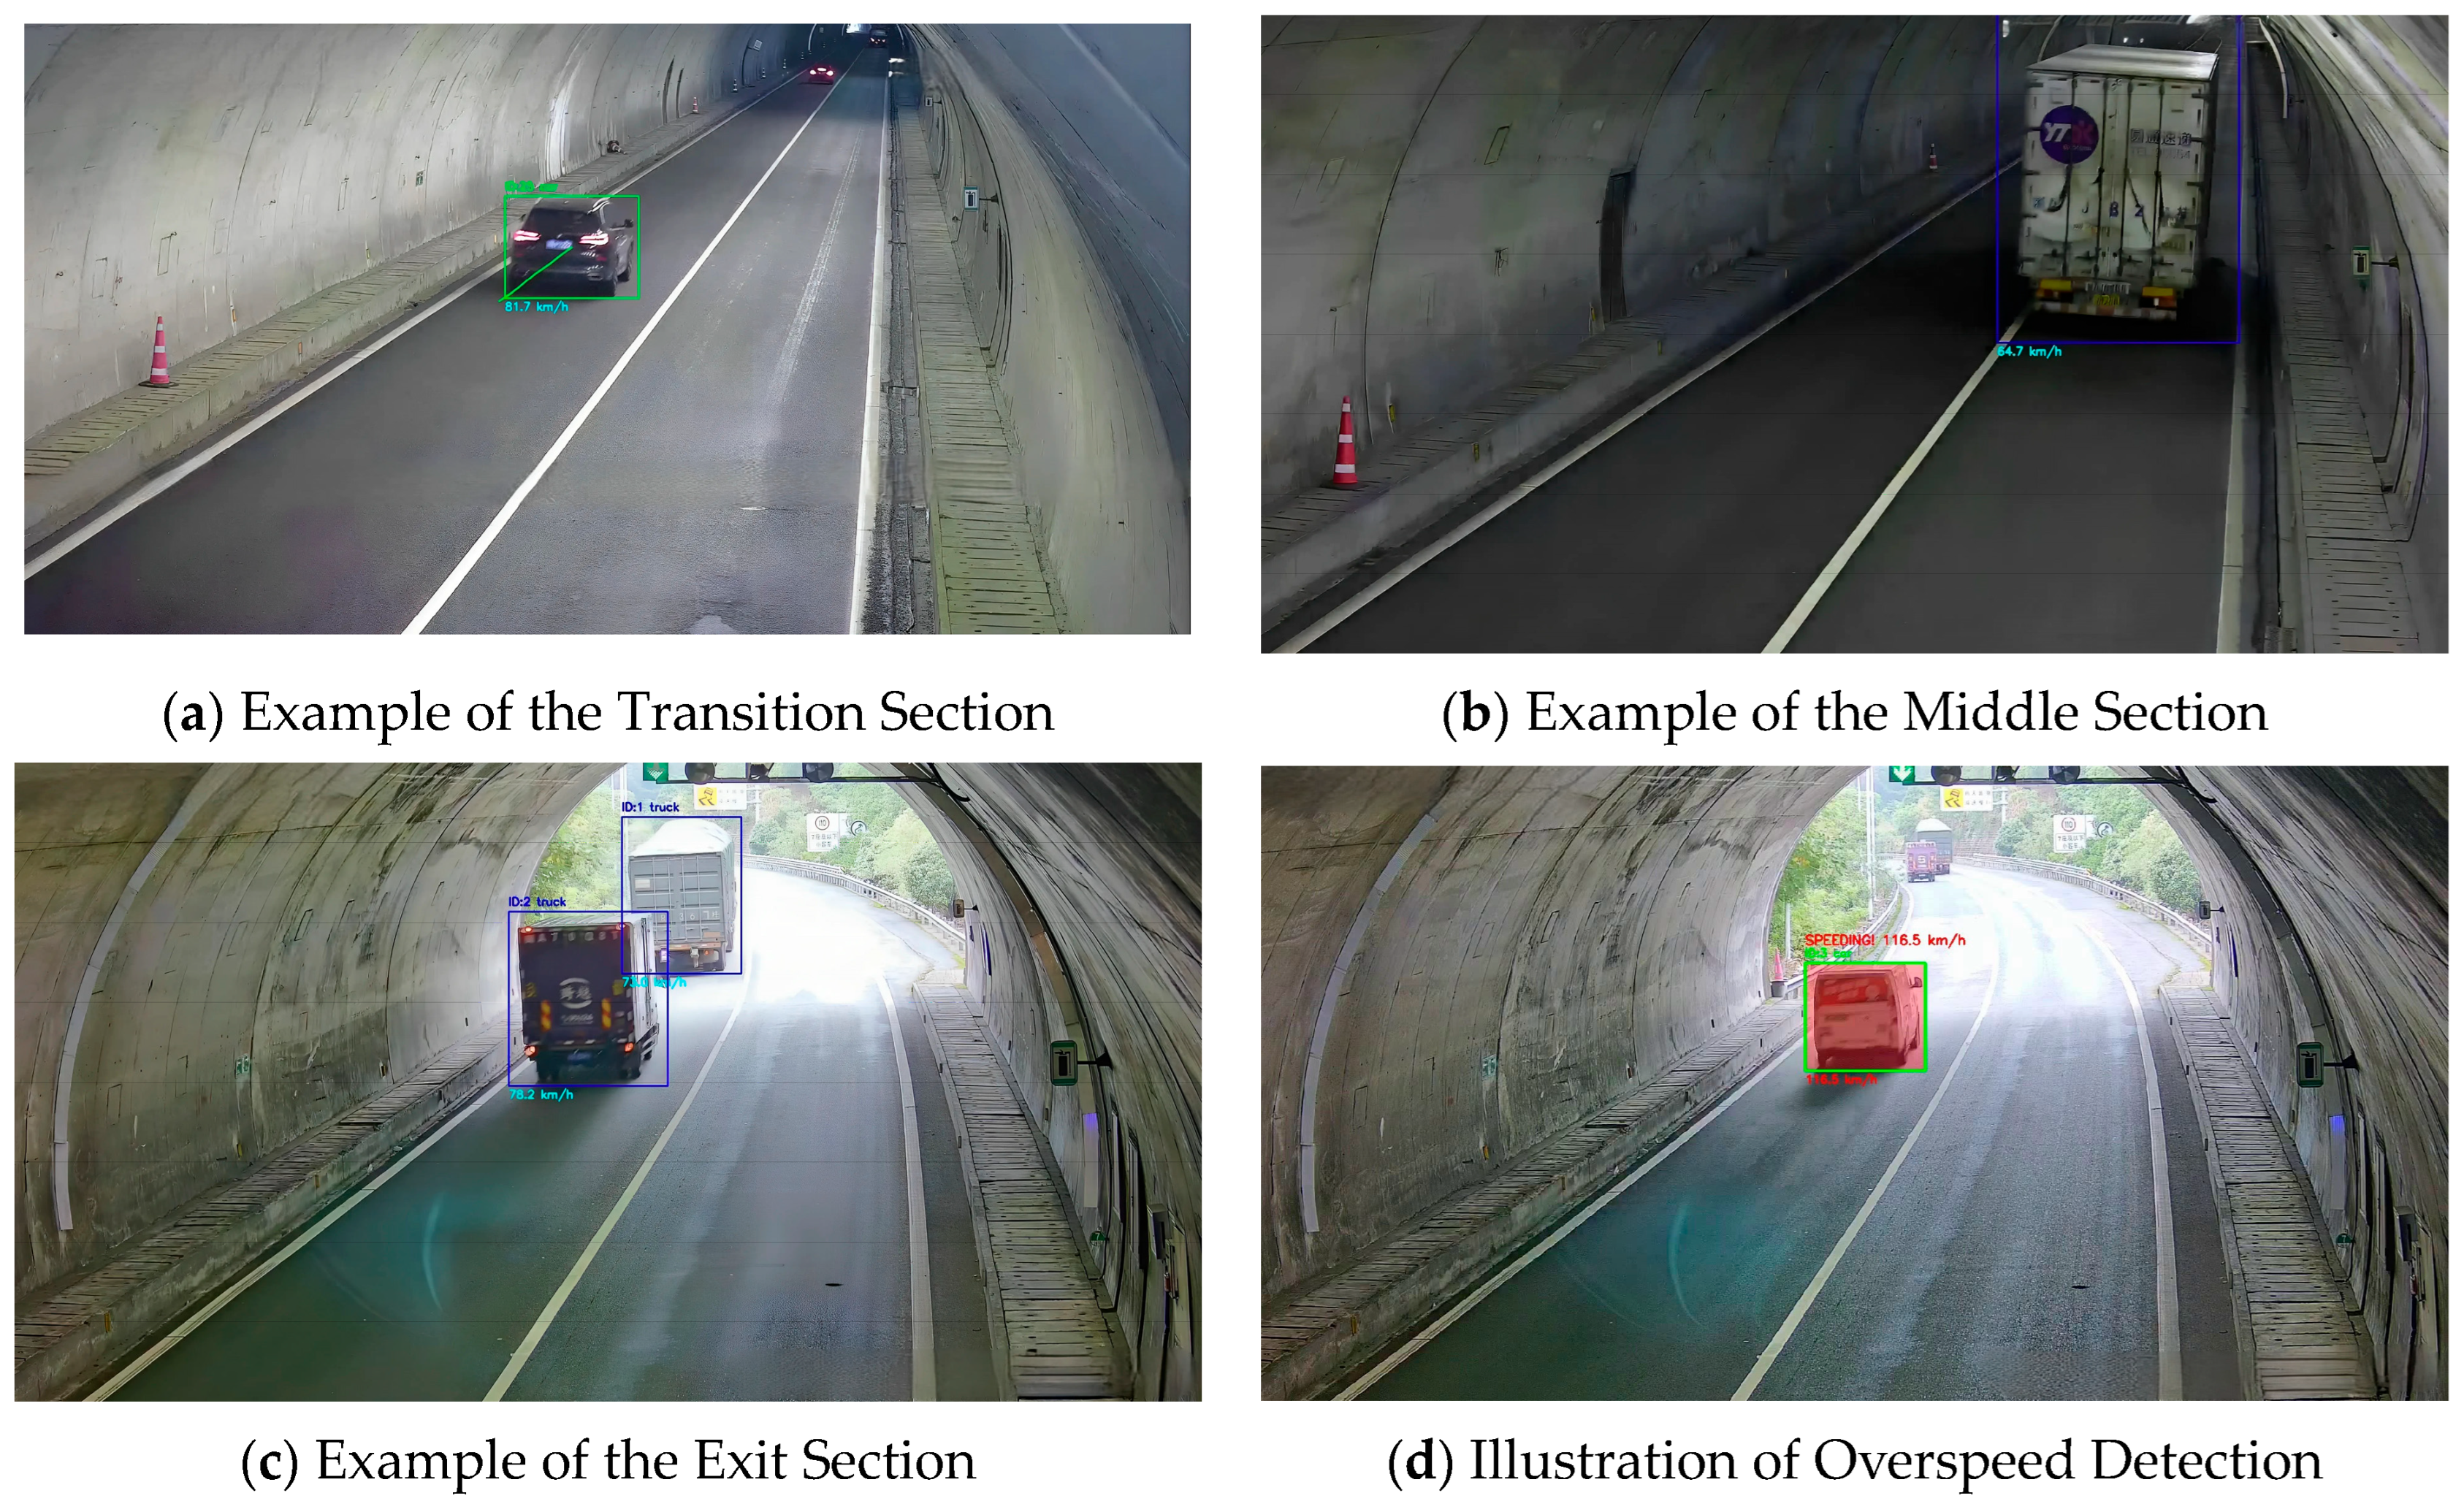
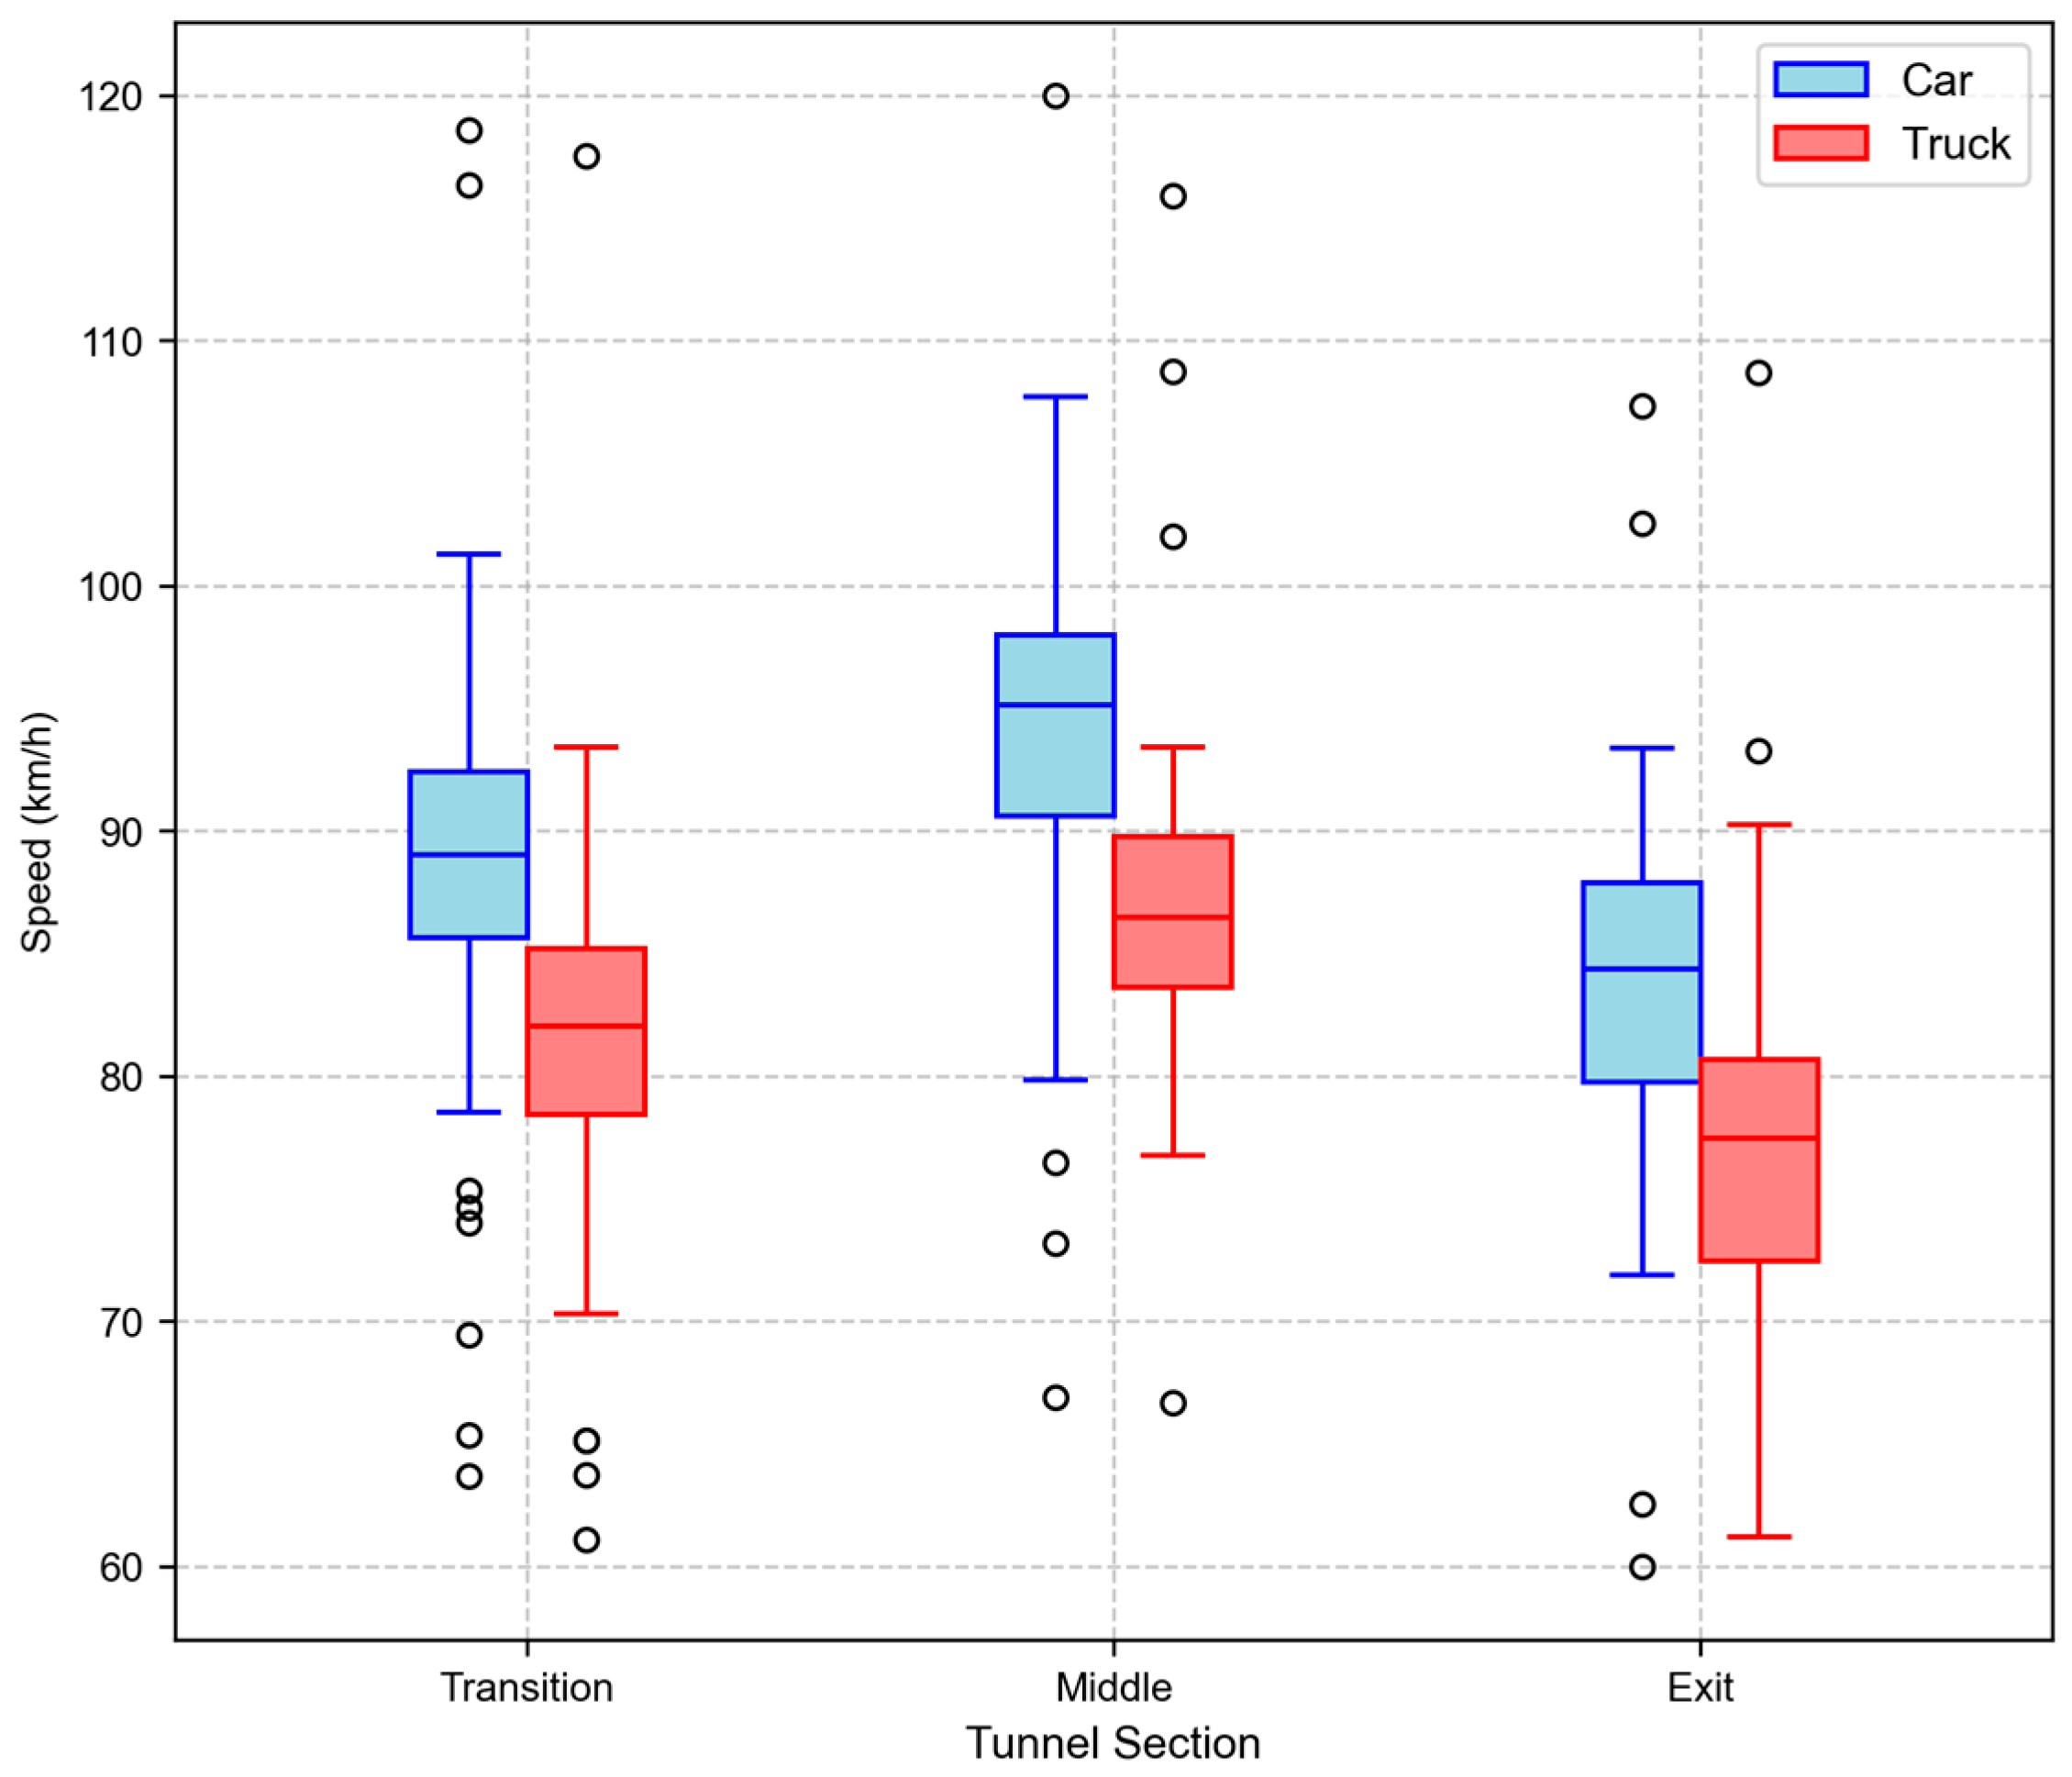
This study utilized vehicle data collected by the YOLOv8 + DeepSORT-based system in an expressway tunnel on 16 June 2025, from 9:00 to 10:30, covering three sections: the transition section, middle section, and exit section. Video detection was conducted on the traffic flow during this period. Since the number of buses detected was fewer than five, the analysis focused only on cars and trucks. Sample detection results are shown in Figure 10. Figure 11 presents box plots illustrating the speed distribution of cars and trucks in each tunnel section.
The box plot analysis reveals notable differences in the speed distributions of cars and trucks across different segments of the tunnel. In the transition section, the median speed of cars is 89.1 km/h, while that of trucks is 82.1 km/h. In the middle section, car speeds increase, with a median of 95.2 km/h, whereas truck speeds remain relatively stable at around 86.5 km/h. In the exit section, both vehicle types show a decrease in speed: car speeds drop to 84.4 km/h, and truck speeds to 77.5 km/h. Overall, cars consistently exhibit higher speeds than trucks across all segments. The middle section is identified as the section with the highest vehicle speeds, while the decline observed in the exit section likely reflects drivers’ tendency to decelerate as they approach the tunnel exit.

3.3.2. Speed Characteristics in Different Tunnel Sections

To accurately observe the speed characteristics across different sections of the tunnel, this study classified vehicles by type and extracted the 15th percentile ( V 15 ) and 85th percentile ( V 85 ) speeds at each observation point. Figure 12 illustrates the variation of these percentile speeds across the transition, middle, and exit sections.
For cars, the V 15 increased from 82.7 km/h in the transition section to 88.6 km/h in the middle section, then decreased to 78.1 km/h in the exit section. The V 85 showed a similar trend, rising from 95.3 km/h to 99.6 km/h, before dropping to 89.6 km/h. Trucks followed a comparable but less pronounced pattern: V 15 rose from 76.0 km/h to 81.7 km/h, then declined to 70.6 km/h; V 85 increased from 86.6 km/h to 91.0 km/h before falling to 83.5 km/h.
Vehicle speed exhibits an inverted U-shaped distribution pattern across the “transition section–middle section–exit section,” reflecting the complex influence mechanisms of the tunnel environment on driving behavior. In the transition section, vehicles enter a relatively enclosed tunnel space from an open road environment, and drivers need to adapt to environmental factors such as changes in lighting, a narrowed field of view, and spatial constraints. Data show that the V85 speeds for cars and trucks are 95.3 km/h and 86.6 km/h, respectively, which are 4.3 km/h and 4.4 km/h lower than those in the middle section. Upon entering the middle section, drivers have adapted to the tunnel environment, and their psychological tension is relieved to some extent. Coupled with the relatively stable traffic environment inside the tunnel, vehicle speeds reach their peak. The V85 speeds of cars and trucks reach 99.6 km/h and 91 km/h, respectively. Although these speeds exceed the typical driving speed on open roads, they align with the driving characteristics of expressways in China. In the exit section, as the tunnel exit approaches, drivers begin to prepare for readapting to the external environment. Additionally, the exit section of the Dahu Ling Tunnel connects to a curved road, resulting in a decrease in speed. The V85 speeds of cars and trucks drop to 89.6 km/h and 83.5 km/h, respectively, with reductions of 10 km/h and 6.5 km/h.

3.3.3. Speed Analysis Results and Discussion

Non-parametric statistical methods were selected due to the specific characteristics of tunnel traffic speed data. Traffic speed distributions often exhibit non-normal characteristics, including skewness caused by speed limits, driver behavior variations, and vehicle type heterogeneity. The Mann–Whitney U test and Kruskal–Wallis test are particularly suitable as they do not assume normality and use rank-based comparisons, making them robust to outliers commonly present in real-world traffic data. To verify the statistical significance of speed differences between different vehicle types and tunnel sections, non-parametric statistical analyses were conducted using the Mann–Whitney U test and the Kruskal–Wallis test, as shown in Table 5.
The results of the Mann–Whitney U test show that significant differences in speed exist between cars and trucks across all tunnel sections (p ≤ 0.05). In the transition section, the test statistic was 5291 (p = 8.34 × 10⁻¹²); in the middle section, it was 4286 (p = 2.51 × 10⁻¹¹); and in the exit section, it was 4848 (p = 1.57 × 10⁻⁹). All p-values are far below the 0.05 significance level, indicating extremely significant differences in speeds between cars and trucks across the tunnel sections.
The Kruskal–Wallis test results further reveal that, for both cars and trucks, there are significant differences in vehicle speeds across the transition, middle, and exit sections. The test statistic for cars was 111.86 (p = 5.13 × 10⁻²⁵), and for trucks was 52.76 (p = 3.50 × 10⁻¹²). These p-values confirm that speed differences among different tunnel sections are highly significant.
From the perspective of statistical distribution, the coefficient of variation for car speeds is significantly higher than that of trucks, indicating greater individual variability in speed choices among car drivers. There are more outliers in the car speed distribution, especially in the transition and middle sections, which may be related to some drivers’ speeding behavior or extremely cautious driving.
The truck speed distribution is relatively concentrated with a smaller interquartile range, indicating more consistent speed choices among truck drivers. This phenomenon may be associated with the professional characteristics of truck drivers, their extensive driving experience, and a deep understanding of vehicle performance. Additionally, the limited maneuvering space for trucks in the tunnel also somewhat constrains the range of speed variations.

4. Discussion

4.1. System Performance and Technical Advantages

The tunnel vehicle speed detection system based on YOLOv8 and DeepSORT proposed in this study demonstrates significant advantages in multiple aspects. In terms of detection accuracy, the YOLOv8s model achieved excellent classification performance in tunnel environments, with recognition accuracy rates of 98%, 96%, and 91% for vehicles, trucks, and buses, respectively, achieving an overall mAP@0.5 of 0.988, surpassing the 0.94 reported in previous tunnel monitoring studies [22]. These results indicate that YOLOv8s exhibits strong adaptability when handling special tunnel environments, such as lighting variations, complex backgrounds, and reflection interference. The 100% identification accuracy achieved for the truck category is of significant practical value for monitoring heavy-duty vehicles in tunnel traffic management. Compared to traditional detection systems, which typically achieve a heavy vehicle classification accuracy of 90–98% [23], this represents a substantial improvement, providing enhanced reliability for the supervision of heavy-duty vehicles in tunnel environments.
Confusion matrix analysis revealed the model’s discriminative capability differences among different categories. The confusion rate between the vehicle category and the background is only 0.27%, which is significantly lower than the 0.1–0.4 background confusion rates reported in related vehicle detection studies [24]. This indicates that the model effectively distinguishes vehicle targets from the complex tunnel background.
This study uses ASD, DDVS, VST, and SDR as evaluation metrics. The vehicle speed detection algorithm shows an average speed difference of 2.54 km/h from the true speed, a deviation degree of 3.12, a stability index of 1.22, and an average relative difference of 2.9%. The errors in vehicle speed detection may arise from several factors. Occlusion and overlapping vehicles can cause lost tracking, while lighting variations, such as headlights or reflections, may lead to inconsistent feature extraction. Limited frame rates may fail to capture rapid speed changes, and fixed camera angles or calibration errors can introduce perspective distortions. Additionally, larger or irregularly moving vehicles are harder to track consistently. Despite these errors, the results indicate that speed detection is relatively stable, with measured speeds close to actual vehicle speeds. Meanwhile, accurate speed data can help traffic management authorities monitor road conditions in real time, adjust signal timings and traffic organization strategies promptly, and improve road traffic efficiency. Future improvements could include multi-view cameras, adaptive feature extraction, higher frame rates, better calibration, and optimized tracking algorithms to enhance robustness.

4.2. Analysis of Multi-Vehicle Speed Behavior Characteristics

Through in-depth analysis of monitoring data from the Dahu Ling Tunnel, this study discovered significant differences in vehicle speed behavior among different vehicle types across various tunnel sections. The results indicate that vehicle speed characteristics in the tunnel exhibit notable differences by vehicle type and spatial distribution patterns. Cars consistently travel at significantly higher speeds than trucks across all sections, with an average speed difference of about 7–8 km/h, which is statistically highly significant (p < 0.001). Several factors explain this difference. First, vehicle performance characteristics are decisive: cars have superior acceleration, more flexible handling, and shorter braking distances, enabling them to better adapt to traffic flow changes in tunnel environments [25]. Second, driver behavior differs markedly: car drivers tend to adjust speeds based on personal judgment, while truck and bus drivers more strictly adhere to industry safety regulations and company management requirements [26].
Vehicle speeds follow an inverted U-shaped distribution pattern across the tunnel sections of transition, middle, and exit, reflecting the complex impact of the tunnel environment on driving behavior. In the transition section, drivers adapt to changes in lighting and spatial constraints, with V85 speeds of cars and trucks at 95 km/h and 87 km/h, respectively. Upon entering the middle section, after adaptation, speeds peak at 100 km/h for cars and 91 km/h for trucks. In the exit section, as drivers prepare to readjust to external strong light and a curved exit, speeds decrease again to 90 km/h for cars and 84 km/h for trucks. The initial acceleration phase corresponds to a driver’s attempt to maintain normal visibility and comfort under reduced luminance, while the peak speeds in the middle section reflect a temporary sense of environmental stability. The subsequent deceleration near the exit is a precautionary behavioral response to the sudden change in brightness and curvature, aligning with previous findings on visual adaptation and tunnel exit glare effects [27].
From a tunnel management perspective, this speed variation trend highlights several key implications. First, the spatial speed variation pattern suggests implementing variable speed limits to match observed natural speed patterns: slightly lower limits at entrance and exit sections where drivers are adapting to environmental changes, and optimized limits in the middle section where speeds naturally peak. Such approaches have been shown to improve safety by reducing speed variance and harmonizing traffic flow [28]. Second, understanding the behavioral differences between vehicle types can support differentiated management strategies, such as imposing stricter speed limits or warning thresholds for heavy vehicles in the mid-section where overspeeding risk peaks. Overall, by deepening the interpretation of the experimental data, the study not only confirms statistically significant variations among vehicle types but also elucidates the behavioral and management mechanisms underlying these differences, providing a theoretical and practical foundation for improving tunnel traffic safety and efficiency.

4.3. Practical Application Value and Limitation

From a practical application perspective, the system proposed in this study demonstrates significant engineering value. It enables 24 h automated monitoring, substantially reducing labor costs and management complexity compared to traditional manual surveillance methods. This improvement in cost-effectiveness is consistent with findings from Kim et al. in their study on tunnel automation [29]. The overspeed detection function, based on a fixed threshold of 100 km/h and visualized with red warning prompts, provides tunnel management with a straightforward and effective tool for identifying violations, representing a notable advancement over traditional enforcement approaches such as those reported by Berberan et al. [30]. Furthermore, the automatic screenshot capture and storage feature for abnormal events enhances the system’s practicality, offering valuable data support for subsequent traffic enforcement and safety analysis. From a system deployment perspective, the solution proposed in this study has good promotion prospects. The YOLOv8s model adopted by the system has relatively low computational complexity while ensuring detection accuracy, making it suitable for deployment on edge devices [31]. This characteristic enables the system to achieve rapid deployment on existing tunnel monitoring infrastructure without requiring large-scale hardware upgrades.
However, the system also presents certain limitations. Firstly, the accuracy of speed estimation heavily relies on the precision of the initial point calibration during perspective transformation. Calibration errors may introduce systematic biases in speed measurements—a limitation also highlighted in the study by Fernández Llorca et al. [32]. Secondly, the system remains sensitive to lighting conditions; extreme lighting scenarios such as strong reflections or deep shadows can affect detection performance. Additionally, the current overspeed detection threshold is fixed and does not accommodate dynamic adjustments based on varying weather conditions or traffic densities, which could limit adaptability in real-world deployments. Future work will incorporate targeted testing under these challenging scenarios and explore improvements such as low-light enhancement preprocessing or attention mechanism integration to enhance model robustness in extreme tunnel conditions.

5. Conclusions

This study addresses the practical needs of tunnel traffic monitoring by developing a real-time vehicle speed detection system based on YOLOv8 and DeepSORT, with the goal of improving the accuracy and robustness of vehicle detection, tracking, and speed estimation in tunnel environments. The system employs YOLOv8s to detect multiple vehicle categories, including cars, trucks, and buses, and integrates DeepSORT to generate stable trajectories across consecutive frames. Vehicle speed is then calculated using pixel-to-world coordinate mapping combined with sliding-window smoothing, enabling reliable speed estimation and speeding detection. Experimental results using surveillance video datasets from a highway tunnel demonstrate excellent performance in classification accuracy, with recognition accuracy rates of 98%, 96%, and 91% for cars, trucks, and buses, respectively. In the speed detection part, the estimated speed is close to the actual speed and exhibits high stability, with ASD, DDVS, VST, and SDR values of 2.54 km/h, 3.12, 1.22, and 2.9%, respectively. The results indicate that the system can operate stably under complex lighting and frequent occlusion conditions in tunnel environments, providing technical references for intelligent transportation system deployment and tunnel operation optimization.
The practical contributions of this study include the following:
(1) The system successfully implements a complete pipeline for real-time vehicle detection, tracking, and speed estimation, incorporating visual speeding alerts and anomalous event storage, providing an efficient tool for tunnel traffic safety management.
(2) Through analysis of the 15% and 85% characteristic percentile speeds and non-parametric statistical analysis, it clarifies the causes of speed differences between vehicle types and different tunnel segments, providing data support for formulating traffic management strategies such as graded speed limits and dynamic warnings.
(3) The proposed framework integrating computer vision and statistical modeling demonstrates strong scalability and can be extended to traffic flow analysis in other restricted road scenarios.
Despite achieving good results, this study still has certain limitations. On one hand, the system relies on the accuracy of the initial point calibration of the perspective transformation, and calibration errors may affect speed estimation accuracy. On the other hand, the dataset mainly comes from a single tunnel scenario and does not sufficiently cover traffic flow characteristics under diverse conditions, such as extreme weather and multiple tunnel types. Additionally, the overspeed detection threshold is relatively fixed and lacks adaptive adjustment to accommodate dynamic traffic flow and road environment changes.
Future research can further improve the system in the following aspects: introducing automatic calibration algorithms or multi-sensor fusion technologies to enhance the accuracy and robustness of speed estimation; expanding the dataset coverage to include tunnel surveillance data from multiple regions and weather conditions to enhance model generalization ability; exploring machine learning-based dynamic threshold adjustment strategies to make overspeed detection more adaptable to real-time traffic flow changes; and integrating vehicle-to-vehicle communication and vehicle-road coordination technologies to build a more intelligent tunnel traffic monitoring and warning system, supporting the development of autonomous driving and intelligent transportation.

Author Contributions

Conceptualization, H.M., X.W., J.T. and Y.Y.; methodology, H.M.; software, X.W. and J.T.; validation, H.M.; formal analysis, H.M.; investigation, X.W. and J.T.; resources, H.M. and Y.Y.; data curation, H.M.; visualization, J.T.; writing—original draft preparation, H.M. and X.W. writing—review and editing, Y.Y. All authors have read and agreed to the published version of the manuscript.

Funding

This research was supported by the Science and Technology Demonstration Project Fund of Fujian Provincial Department of Transportation. Project Approval No. FJJT-KJSF2021-01.

Data Availability Statement

The datasets generated and analyzed during the current study are available from the corresponding author upon reasonable request.

Conflicts of Interest

Authors Honglin Mu was employed by the company Nanping Wusha Expressway Co., Ltd. Author Xinyuan Wang and Junshan Tian were employed by the company Fujian Expressway Science & Technology Innovation Research Institute Co., Ltd. The remaining authors declare that the research was conducted in the absence of any commercial or financial relationships that could be construed as a potential conflict of interest.

References

  1. Krajewski, R.; Bock, J.; Kloeker, L.; Eckstein, L. The highd dataset: A drone dataset of naturalistic vehicle trajectories on german highways for validation of highly automated driving systems. In Proceedings of the 2018 21st International Conference on Intelligent Transportation Systems (ITSC), Honolulu, HI, USA, 4–7 November 2018; pp. 2118–2125. [Google Scholar] [CrossRef]
  2. Hu, W.; Chen, J.; Tian, Q.; Wang, C.; Zhang, Y. Analysis and Application of Highway Tunnel Risk Factors Based on Traffic Accident Data. In Proceedings of the 2024 7th International Symposium on Traffic Transportation and Civil Architecture (ISTTCA 2024), Tianjing, China, 21–23 June 2024; pp. 836–849. [Google Scholar] [CrossRef]
  3. Hu, Y.; Liu, H.; Zhu, T. Influence of spatial visual conditions in tunnel on driver behavior: Considering the route familiarity of drivers. Adv. Mech. Eng. 2019, 11, 1–9. [Google Scholar] [CrossRef]
  4. He, S.; Du, Z.; Mei, J.; Han, L. Driving behavior inertia in urban tunnel diverging areas: New findings based on task-switching perspective. Transp. Res. Part F Traffic Psychol. Behav. 2025, 109, 1007–1023. [Google Scholar] [CrossRef]
  5. Redmon, J.; Divvala, S.; Girshick, R.; Farhadi, A. You only look once: Unified, real-time object detection. In Proceedings of the IEEE Conference on Computer Vision and Pattern Recognition, Las Vegas, NV, USA, 26 June–1 July 2016; pp. 779–788. [Google Scholar] [CrossRef]
  6. Bilakeri, S.; Kotegar, K.A. A Review: Recent Advancements in Online Private Mode Multi-Object Tracking. IEEE Trans. Artif. Intell. 2025. Early Access. [Google Scholar] [CrossRef]
  7. Abdullah, A.; Amran, G.A.; Tahmid, S.A.; Alabrah, A.; AL-Bakhrani, A.A.; Ali, A. A deep-learning-based model for the detection of diseased tomato leaves. Agronomy 2024, 14, 1593. [Google Scholar] [CrossRef]
  8. He, Y.; Che, J.; Wu, J. Pedestrian multi-target tracking method based on YOLOv5 and person re-identification. Chin. J. Liq. Cryst. Disp. 2022, 37, 880–890. [Google Scholar] [CrossRef]
  9. Xu, H.; Chang, M.; Chen, Y.; Hao, D. Research on Influence of Vehicle Type on Traffic Flow Speed Under Target Detection. J. Comput. Eng. Appl. 2024, 60, 314–321. (In Chinese) [Google Scholar] [CrossRef]
  10. Costa, L.R.; Rauen, M.S.; Fronza, A.B. Car speed estimation based on image scale factor. Forensic Sci. Int. 2020, 310, 110229. [Google Scholar] [CrossRef] [PubMed]
  11. Tayeb, A.A.; Aldhaheri, R.W.; Hanif, M.S. Vehicle speed estimation using gaussian mixture model and kalman filter. Int. J. Comput. Commun. Control 2021, 16, 4211. [Google Scholar] [CrossRef]
  12. Ou, J.; Zeng, W.; Chen, S.; Lu, S. YOLO-DeepSORT Empowered UAV-based Traffic Behavior Analysis: A Novel Trajectory Extraction Tool for Traffic Moving Objects at Intersections. In Proceedings of the 2025 IEEE International Annual Conference on Complex Systems and Intelligent Science (CSIS-IAC), Shenzhen, China, 16–18 May 2025; pp. 1–6. [Google Scholar] [CrossRef]
  13. Kiran, M.J.; Roy, K. A video surveillance system for speed detection in vehicles. Int. J. Eng. Trends Technol. (IJETT) 2013, 4, 1437–1441. [Google Scholar]
  14. Tang, J.; Wang, W. Vehicle trajectory extraction and integration from multi-direction video on urban intersection. Displays 2024, 85, 102834. [Google Scholar] [CrossRef]
  15. Kaif, A.; Santosh, T.S.; AshokKumar, C.; Kumar, C.J. YOLOv8-Powered Driver Monitoring: A Scalable and Efficient Approach for Real-Time Distraction Detection. In Proceedings of the 2025 International Conference on Inventive Computation Technologies (ICICT), Honolulu, HI, USA, 14–16 March 2025; pp. 338–345. [Google Scholar] [CrossRef]
  16. Bewley, A.; Ge, Z.; Ott, L.; Ramos, F.; Upcroft, B. Simple online and realtime tracking. In Proceedings of the 2016 IEEE international conference on image processing (ICIP), Phoenix, AZ, USA, 25–28 September 2016; pp. 3464–3468. [Google Scholar] [CrossRef]
  17. Luo, Z.; Bi, Y.; Yang, X.; Li, Y.; Yu, S.; Wu, M.; Ye, Q. Enhanced YOLOv5s+ DeepSORT method for highway vehicle speed detection and multi-sensor verification. Front. Phys. 2024, 12, 1371320. [Google Scholar] [CrossRef]
  18. Sangsuwan, K.; Ekpanyapong, M. Video-based vehicle speed estimation using speed measurement metrics. IEEE Access 2024, 12, 4845–4858. [Google Scholar] [CrossRef]
  19. Shaqib, S.; Alo, A.P.; Ramit, S.S.; Rupak, A.U.H.; Khan, S.S.; Rahman, M.S. Vehicle Speed Detection System Utilizing YOLOv8: Enhancing Road Safety and Traffic Management for Metropolitan Areas. arXiv 2024, arXiv:2406.07710. [Google Scholar] [CrossRef]
  20. Arriffin, M.N.; Mostafa, S.A.; Khattak, U.F.; Jaber, M.M.; Baharum, Z.; Gusman, T. Vehicles Speed Estimation Model from Video Streams for Automatic Traffic Flow Analysis Systems. JOIV Int. J. Inform. Vis. 2023, 7, 295–300. [Google Scholar] [CrossRef]
  21. Cvijetić, A.; Djukanović, S.; Peruničić, A. Deep learning-based vehicle speed estimation using the YOLO detector and 1D-CNN. In Proceedings of the 2023 27th International Conference on Information Technology (IT), Žabljak, Montenegro, 15–18 February 2023; pp. 1–4. [Google Scholar] [CrossRef]
  22. Kim, J. Vehicle detection using deep learning technique in tunnel road environments. Symmetry 2020, 12, 2012. [Google Scholar] [CrossRef]
  23. Mosa, A.H.; Kyamakya, K.; Junghans, R.; Ali, M.; Al Machot, F.; Gutmann, M. Soft Radial Basis Cellular Neural Network (SRB-CNN) based robust low-cost truck detection using a single presence detection sensor. Transp. Res. Part C Emerg. Technol. 2016, 73, 105–127. [Google Scholar] [CrossRef]
  24. Geetha, A.S. Comparing yolov5 variants for vehicle detection: A performance analysis. arXiv 2024, arXiv:2408.12550. [Google Scholar] [CrossRef]
  25. Xu, J.; Lin, W.; Wang, X.; Shao, Y.-M. Acceleration and deceleration calibration of operating speed prediction models for two-lane mountain highways. J. Transp. Eng. Part A Syst. 2017, 143, 04017024. [Google Scholar] [CrossRef]
  26. Kim, D.-G.; Lee, C.; Park, B.-J. Use of digital tachograph data to provide traffic safety education and evaluate effects on bus driver behavior. Transp. Res. Rec. 2016, 2585, 77–84. [Google Scholar] [CrossRef]
  27. Xiao, J.; Liang, B.; Niu, J.a.; Qin, C. Study on the Glare Phenomenon and Time-Varying Characteristics of Luminance in the Access Zone of the East–West Oriented Tunnel. Appl. Sci. 2024, 14, 2147. [Google Scholar] [CrossRef]
  28. Abdulghani, A.; Lee, C. Differential variable speed limits to improve performance and safety of car-truck mixed traffic on freeways. J. Traffic Transp. Eng. (Engl. Ed.) 2022, 9, 1003–1016. [Google Scholar] [CrossRef]
  29. Kim, J.-R.; Yoo, H.-S.; Kwon, S.-W.; Cho, M.-Y. Integrated tunnel monitoring system using wireless automated data collection technology. In Proceedings of the 25th International Symposium on Automation and Robotics in Construction (ISARC2008), Vilnius, Lithuania, 26–29 June 2008; pp. 26–29. [Google Scholar]
  30. Berberan, A.; Machado, M.; Batista, S. Automatic multi total station monitoring of a tunnel. Surv. Rev. 2007, 39, 203–211. [Google Scholar] [CrossRef]
  31. Thatikonda, M. An Enhanced Real-Time Object Detection of Helmets and License Plates Using a Lightweight YOLOv8 Deep Learning Model. Master’s Thesis, Wright State University, Dayton, OH, USA, 2024. [Google Scholar]
  32. Fernández Llorca, D.; Hernández Martínez, A.; García Daza, I. Vision-based vehicle speed estimation: A survey. IET Intell. Transp. Syst. 2021, 15, 987–1005. [Google Scholar] [CrossRef]
Figure 1. System workflow diagram.
Iic 01 00010 g001
Figure 2. YOLOv8s network.
Iic 01 00010 g002
Figure 3. Example of lane line perspective transformation. Note: Perspective transformation based on four corresponding points (a–d in the original image mapped to a′–d′ in the bird’s-eye view).
Iic 01 00010 g003
Figure 4. Sample video frames used for detection. Note: Sample frame from the tunnel surveillance video datasets, annotated in YOLO format for model training.
Iic 01 00010 g004
Figure 5. Precision–recall curves.
Iic 01 00010 g005
Figure 6. F1 score–confidence interval curve.
Iic 01 00010 g006
Figure 7. Recall–confidence interval curve.
Iic 01 00010 g007
Figure 8. Precision–confidence interval curve.
Iic 01 00010 g008
Figure 9. Confusion matrix.
Iic 01 00010 g009
Figure 10. Sample Detection Results. Note: Detection results from the YOLOv8 + DeepSORT-based system in an expressway tunnel (16 June 2025, 09:00–10:30), covering the transition, middle, and exit sections. Only cars and trucks were analyzed due to the limited number of buses.
Iic 01 00010 g010
Figure 11. Box plot of vehicle speeds for cars and trucks in each tunnel section.
Iic 01 00010 g011
Figure 12. Characteristic percentile speed diagram.
Iic 01 00010 g012
Table 1. Sample results of vehicle speed detection.
No.System-Detected Speed (km/h)Radar-Measured Speed (km/h)Difference
(km/h)
ASDSDR
187.684.92.71.92 km/h2.21%
287.588.61.1
387.490.32.9
488.990.21.3
581.883.41.6
679.476.33.12.4 km/h2.86%
778.681.32.7
884.586.11.6
990.192.42.3
1086.688.92.3
Table 2. Evaluation results of vehicle speed detection.
IndicatorsASDDDVSVSTSDR
results2.54 km/h3.121.222.9%
Table 3. Ablation study.
ConfigurationDetection mAPASD (km/h)DDVS
Full system (YOLOv8s + DeepSORT + Perspective Transform + Sliding Window)98.8%2.543.12
YOLOv8s + Simple IoU tracking98.8%5.877.45
YOLOv5s + DeepSORT (baseline)94.6%3.214.08
YOLOv8s + DeepSORT (without sliding window)98.8%4.125.34
YOLOv8s + DeepSORT (without perspective transform)98.8%6.898.92
Table 4. Algorithm performance comparison.
MethodDetection AlgorithmTracking AlgorithmTest EnvironmentSpeed Accuracy MetricsYear
Enhanced YOLOv5s + DeepSORT [17] YOLOv5s + Swin TransformerDeepSORTHighway/TunnelAbsolute error: 1–8 km/h, RMSE: 2.06–9.28 km/h2024
YOLOv3 + DeepSORT [18] YOLOv3DeepSORT + Optical FlowRoad trafficMAE: 3.38 km/h, RMSE: 4.69 km/h2024
YOLOv8 Speed Detection [19] YOLOv8Tracking algorithmUrban trafficMAE: 3.5 km/h, RMSE: 4.22 km/h2024
Video Stream Estimation [20]Feature-based detectionVideo trackingAutomatic traffic flowSpeed Estimation Error: 20.86%, Average Percentage for Accuracy: 79.14% 2023
YOLO + 1D-CNN [21]YOLO detector1D-CNN with CBBA featuresRoad trafficSpeed Average Error: 2.76 km/h2023
This Study Proposed (YOLOv8s + DeepSORT)YOLOv8sDeepSORTExpressway tunnelASD: 2.54 km/h, DDVS: 3.12, VST: 1.22, SDR: 2.9%2025
Table 5. Results of non-parametric statistical analysis.
Non-Parametric TestGroupingStatisticp
Mann–Whitney UTransition (Car vs. Truck)5291<0.01
Middle (Car vs. Truck)4286<0.01
Exit (Car vs. Truck)4848<0.01
Kruskal–WallisCar (Transition vs. Middle vs. Exit)111.8581<0.01
Truck (Transition vs. Middle vs. Exit)52.75877<0.01
Disclaimer/Publisher’s Note: The statements, opinions and data contained in all publications are solely those of the individual author(s) and contributor(s) and not of MDPI and/or the editor(s). MDPI and/or the editor(s) disclaim responsibility for any injury to people or property resulting from any ideas, methods, instructions or products referred to in the content.