Article

Research on the Mechanism of the Impact of Population Aging in the Yangtze River Delta Urban Agglomeration on Economic Growth

School of Management, Shanghai University of Engineering Science, Shanghai 201620, China
*
Author to whom correspondence should be addressed.
Reg. Sci. Environ. Econ. 2025, 2(3), 25; https://doi.org/10.3390/rsee2030025
Submission received: 1 July 2025 / Revised: 5 August 2025 / Accepted: 14 August 2025 / Published: 18 August 2025

Abstract

In the context of the deep transformation of population structure and the coordinated advancement of high-quality development, exploring the mechanism of the impact of aging on economic growth has become a major issue related to the sustainable development of China. This study takes the 41 cities of the Yangtze River Delta urban agglomeration as a sample, using the population and economic census data from 2000 to 2020. It comprehensively applies an improved Solow model, GIS spatial analysis, spatial econometric models, and mediation effect tests to arrive at the following findings: (1) There is a significant asynchrony between economic growth and population aging in the Yangtze River Delta urban agglomeration. Economic growth has shifted from high-speed to high-quality development, while the aging process is accelerating and becoming more aged. (2) Population aging in the Yangtze River Delta has a nonlinear positive impact on economic growth. The intensity of this impact shows a characteristic of “strong-weak-strong,” with the first aging rate threshold being 11.63% and the second being 17.53%. (3) There is significant spatial autocorrelation between population aging and economic growth in the Yangtze River Delta urban agglomeration. The overall direction of the effect shows a spatial distribution pattern of “positive in the south and negative in the north.” The deepening of population aging in neighboring areas promotes local economic growth. (4) Labor productivity and optimization of the living environment constitute the core transmission pathways. Together, they account for more than 80% of the contribution and serve as the key mechanism for transforming aging pressures into growth momentum. This research provides practical guidance for solving the “rich” and “aging” contradictions in the Yangtze River Delta. It also offers a universal theoretical framework and a Chinese solution for aging economies worldwide to address the risk of growth stagnation.

1. Introduction

As one of the most dynamic, open, and innovative regions regarding China’s economic development, the Yangtze River Delta urban agglomeration, which covers 4% of the country’s land area, is home to 16% of the nation’s permanent population. In 2023, its total GDP surpassed CNY 30 trillion, accounting for more than 24% of the national total (Data source: National Bureau of Statistics of China. https://www.stats.gov.cn/xxgk/sjfb/zxfb2020/202412/t20241223_1957823.html (accessed on 2 June 2025)). However, with the accelerated population transition process, the Yangtze River Delta is undergoing profound and complex aging changes. In 2020, the proportion of the population aged 60 and above in the region exceeded 20%, which is higher than the national average of 18.7%, and the elderly dependency ratio rose to 21.7% (Data source: National Health Commission of China, 2020 National Aging Development Report. https://www.nhc.gov.cn/lljks/c100157/202110/b365898ae2a4406d91e1b1ecd10ca911.shtml (accessed on 2 June 2025)). At the same time, the region exhibits distinct regional characteristics.
First, there is a significant asynchronous relationship between economic development and aging. On one hand, economically developed areas such as Shanghai and southern Jiangsu are experiencing the “rich but aging” phenomenon, while, on the other hand, some cities in northern Anhui are facing the “aging before becoming rich” challenge. This contradictory pattern is notably different from the combination of a higher aging rate and lower per capita GDP in the Northeast, or the relatively low aging rate and higher per capita GDP in the Pearl River Delta. Second, the levels of aging within the region vary greatly, with the spatial gradient far exceeding that of other major urban agglomerations such as the Beijing–Tianjin–Hebei region and Chengdu–Chongqing. Third, as part of the national strategy, the Yangtze River Delta integration is promoting the deep development of systems such as social security and medical insurance, with its level of regional collaboration leading the country.
Therefore, the Yangtze River Delta, as a typical region for study, is of significant representational value. It helps reveal the internal mechanisms through which population aging affects economic growth and provides a crucial entry point for addressing the challenge of coordinating the “rich” and “old” in the region. The conclusions of this research will also provide important reference points for similar regions in China and globally.
Based on this, this study takes the 41 cities at or above the prefecture level in the Yangtze River Delta as research units, integrating urban panel data from 2000 to 2020. This study explores the impact of population aging on economic growth from different perspectives, including the improved Solow model, spatial effects, and mediation effects. First, using urban panel data from 2000 to 2020, under the framework of the Solow economic growth theory, this study develops a regression model based on the Cobb–Douglas production function to reveal the relationship between the output, capital, labor, technological progress, and population aging in the Yangtze River Delta’s three provinces and one city. Second, by utilizing the geographical detector, this study identifies the determining factors of population aging’s effects on economic growth, as well as the interactions that effect it, constructing a geographically weighted regression model and a spatial Durbin model to reveal the spatial effects of population aging on economic growth in 2000 and 2020. Third, this study investigates the mediation effect of population aging on economic growth in the Yangtze River Delta through housing conditions and labor productivity using panel data from 2000 to 2020. The potential marginal contributions of this paper are as follows: (1) It breaks through traditional linear or single-turning-point perceptions by constructing a “dynamic threshold-space heterogeneity-double mediation” integrated analytical framework. For the first time, it clarifies the “strong-weak-strong” three-phase non-linear characteristics of aging in the Yangtze River Delta and reveals the spatially heterogeneous effects and spillover mechanisms of “southern positive, northern negative.” (2) It precisely identifies labor productivity and residential environment optimization as the core transmission paths, quantifying their joint contribution as being over 80%. This challenges previous generalized descriptions of mediation mechanisms and clarifies the key mechanism through which aging pressure is transformed into growth momentum. (3) Based on the typical “rich and aging coexistence” in the Yangtze River Delta, this paper, incorporating the integration background of the region, proposes differentiated regional policies and spatial coordination solutions. It also provides a new approach based on Chinese practices for the study of aging economies globally.

2. Literature Review

The impact mechanism of population aging on economic growth is a core issue at the intersection of economics and demography, with numerous studies having been conducted by domestic and international scholars on the subject. These studies can be summarized into the following viewpoints:
(1) Population aging suppresses economic growth: Some scholars theoretically argue that population aging has a negative impact on economic growth [1,2,3]. Empirical studies have also confirmed that population aging hinders economic growth [4,5,6]. For example, Bloom et al. calculated that population aging indeed led to a decline in economic growth rates. In a counterfactual scenario, the global per capita GDP growth rate from 1960 to 2005 would have decreased from 1.84% to 1.75%. The per capita GDP growth rate in OECD countries would have fallen from 2.8% to 2.1%, with Singapore and Hong Kong experiencing some of the largest declines [7]. Zheng Wei’s study predicted the potential impact of China’s aging population on economic growth and found that its negative effect would be significantly higher than the global average and the OECD average [8]. Hu Angang, using the Solow model and empirical data, also confirmed that both population aging and population growth have adverse effects on economic growth [9]. Du Yang, using panel data from 122 countries over 25 years, found that only when aging reaches a certain threshold does it negatively affect economic growth, and its impact is considerable. China falls into this rapidly aging group, where economic growth would slow by an average of 1.07 percentage points annually [10].
(2) Population aging promotes economic growth: Fougère et al. argued that an increase in life expectancy provides more opportunities for human capital investment, which mitigates the negative impact of population aging on the economy [11]. Prettner suggested that the negative impact of population aging is not significant. Even though declining fertility rates have some negative effects on economic growth, an increasing life expectancy has a positive impact on economic growth, and, in the long term, the latter outweighs the former [12]. Wu C used data from Chinese listed companies from 2011 to 2018 and employed an industry and year fixed-effects regression model to control for unobserved heterogeneity, conducting a formal causal mediation analysis. The analysis showed that population aging significantly increases labor productivity. Specifically, for each 1 percentage point increase in the old-age dependency ratio, labor productivity at the enterprise level increases by 1.47% [13]. Cai Fang believed that population aging would trigger a substitution of human capital investment for physical capital investment, which would benefit economic growth [14]. Wang Wei’s study found that population aging stimulates demand for consumption, accelerates human capital accumulation, and forces enterprises to replace labor with capital and technology to cope with rising labor costs, promoting industrial upgrading and economic growth [15].
(3)The non-linear relationship between population aging and economic growth: As early as 1995, Yu Xuejun predicted that 2020–2025 would be a transitional period for China’s population aging. Before this period, the benefits of aging would outweigh the disadvantages, but afterward, many “benefits” would gradually turn into “disadvantages,” with negative impacts surpassing positive ones, which aligns with further research by other scholars [16,17]. Li Jun introduced population aging variables into the Solow growth model and theoretically demonstrated that population aging could have positive, negative, or neutral effects on economic growth, with related policy choices affecting the effects of population aging [18]. Liu Wen, using China, Japan, and Korea as samples, and Qi Hongqian, using data from 31 Chinese provinces, both found that the impact of population aging on the economy follows an inverted U-shaped curve, with the turning point being around 10% [19,20]. Recent studies have incorporated spatial factors into their study of the mechanism of population aging’s impact on economic growth, revealing new findings: population aging has significant spillover effects on economic growth across regions; the increase in the working-age population in neighboring regions is beneficial to local economic growth; the elderly dependency ratio significantly promotes local economic growth; the impact of population aging on economic growth varies according to the aging level, aging speed, and aging structure; and population aging significantly promotes high-quality local economic development, but may have a negative impact on the surrounding regions’ high-quality development [21,22,23,24]. These studies suggest that population aging is a multidimensional phenomenon, and its effects on economic growth may differ across regions and dimensions [25].
Some scholars have also studied specific mechanisms and proposed paths to mitigate the impact of aging [26,27]. Maestas N’s study suggests that population aging will slow down U.S. economic growth. For every 10% increase in the proportion of people aged 60 and above, the GDP per capita decreases by 5.5%. One-third of the decrease is due to slower employment growth, and two-thirds is due to slower growth in labor productivity [28]. Yue Liu’s research found that population aging significantly suppresses economic growth, mainly by affecting the overall upgrading of the industrial structure and the rationalization and optimization of industries [29]. Jones C.I. believes that population decline may lead to economic stagnation but that, with timely implementation of optimal policies, sustainable growth in both the population and living standards can be achieved. Population policy is crucial to the economic growth outlook of a country [30]. Chen Yanbin’s research found that the application of artificial intelligence can mitigate the impact of population aging on economic growth by enhancing the intelligence and automation of production activities, increasing capital returns, and improving total factor productivity. Its effect is significantly better than delaying retirement [31].
In summary, most Chinese scholars believe that population aging suppresses economic growth, but there is still some divergence, with studies primarily focusing on the national level and lacking research at the provincial and municipal levels. Therefore, this study integrates existing research and employs the improved Solow model, the fixed-effect panel model, spatial econometric models, and mediation effect analysis to systematically analyze the mechanism of population aging’s impact on economic growth in the Yangtze River Delta urban agglomeration, providing insights into how to address the “rich” and “old” issues in the region.

3. Research Design

3.1. Model Construction

Current research on the relationship between population aging and economic growth mostly relies on traditional static models, such as the Solow model [32]. This model typically assumes that economic growth is driven by technological progress and capital accumulation and does not fully consider the long-term and dynamic effects of population aging on the economy. Traditional static models focus more on economic performance at a specific point in time, which makes it difficult to capture the multiple effects of demographic changes on economic development and their stage-specific characteristics. Therefore, this study introduces a dynamic perspective and proposes an improved economic growth model that can examine the impact of aging on economic growth over a longer time span. This new framework not only reveals the non-linear relationship between population aging and economic growth but also identifies changes in this relationship at different stages of development. As the aging process deepens, the mechanisms influencing economic growth will also change accordingly.

3.1.1. Basic Model Setting

Under the traditional Solow model framework, the total production function uses the Cobb–Douglas form. The basic production function is as follows:
Y ( t ) = F ( K , A , L ) = K ( t ) α [ A ( t ) L ( t ) ] 1 α
where Y ( t ) is the total output, K ( t ) is the capital stock, A ( t ) is the technology level, L ( t ) is the labor force, α is the capital-output elasticity, 0 < α < 1 , and t is the time.

3.1.2. Improved Solow Model Setup

The aging index is introduced as an important variable that affects production efficiency, constructing an expanded Cobb–Douglas production function:
Y ( t ) = K ( t ) α [ A ( t ) L ( t ) ] 1 α e β θ ( t )
where θ ( t ) represents the aging degree at time ( t ), usually measured by the proportion of the elderly population, and β is the impact coefficient of aging on production efficiency. When β > 0, aging promotes the improvement of production efficiency; when β < 0, aging suppresses production efficiency.
The total population ( N ( t ) ) is decomposed into the working-age population ( L ( t ) ) and the elderly population ( O ( t ) ), with the growth rates of the working-age population and the elderly population being represented as follows:
L ( t ) L ( t ) = n ( t ) = n 0 γ θ ( t )
O ( t ) O ( t ) = m ( t ) = m 0 + δ θ ( t )
where n 0 is the initial growth rate of the working-age population, m 0 is the initial growth rate of the elderly population, and γ and δ are adjustment parameters, reflecting the feedback effects of aging on the growth of different age groups.
Considering the impact of aging on the savings rate, the savings rate is set as a function of the aging index:
s ( t ) = s 0 η θ ( t )
where s 0 is the initial savings rate and η is the coefficient representing the impact of aging on the savings rate. The capital accumulation equation is modified as follows:
K ( t ) = s ( t ) Y ( t ) δ K K ( t )
where δ K is the capital depreciation rate.
Define per capita capital as k ( t ) = K ( t ) A ( t ) L ( t ) and per capita output as y ( t ) = Y ( t ) A ( t ) L ( t ) , then the production function is as follows:
y ( t ) = k ( t ) α e β θ ( t )
Taking the derivative and substituting it into the capital accumulation equation, we get the following:
k ( t ) = s ( t ) k ( t ) α e β θ ( t ) n ( t ) + g + δ K k ( t )
Based on the improved Solow model theoretical framework, the following baseline panel econometric model is constructed:
ln y i t = β 0 + β 1 θ i t + β 2 ln s ( θ i t ) + β 3 ln n ( θ i t ) + g + δ K + β 4 ln H i t + β 5 ln A i t + μ i + λ t + ε i t
where y i t represents economic growth; θ i t represents the aging in region (i) at time (t); s ( θ i t ) represents the savings rate; n ( θ i t ) + g + δ K represents the effective depreciation rate; H i t represents human capital; A i t represents technological innovation; and β represents the parameters to be estimated.

3.2. Construction and Explanation of the Indicator System

3.2.1. Dependent Variable

This study takes “economic growth” as the core dependent variable. Different from the simple measurement of the GDP’s scale, the indicator system constructed in this study follows a four-dimensional analytical framework of “economic activity, economic inclusiveness, economic coordination, and economic sustainability,” aiming to comprehensively capture the dual impact of population aging on both the quantity and quality of regional economic growth. The data are sourced from the “China City Statistical Yearbook,” and the specific indicators and their explanations are shown in Table 1.

3.2.2. Explanatory Variables

In this study, population aging is taken as the core explanatory variable. Following the method of Li and Chen, an indicator system is constructed from three dimensions: scale, structure, and speed [33]. The scale of the elderly population is calculated by the number of individuals aged 60 and above, and the aging rate is measured as the proportion of the elderly population (aged 60 and above) to the total population. At the same time, drawing on the research philosophy of Wu Cangping’s social gerontology, the elderly population is further subdivided: individuals aged 60–69 are defined as “young elderly” (referred to as “Qinglao”); those aged 70–79 are defined as “middle-aged elderly” (referred to as “Zhonglao”); and those aged 80–89 are defined as “old elderly” (referred to as “Laolao”) [34]. The specific indicators and explanations are shown in Table 2.

3.2.3. Mediating Variables

This study selects living conditions and labor productivity as mediating variables. Living conditions are measured comprehensively using data from the 5th to 7th population censuses, including indicators such as the “average number of rooms per household,” “per capita housing area,” “percentage of households with kitchens,” “percentage of households with tap water,” “percentage of households with toilets,” and “percentage of households with bathing facilities.” Labor productivity (EFF) measures the input-output efficiency of labor factors, which is calculated as the ratio of GDP to the total number of employed individuals at the end of the year.

3.2.4. Control Variables

To accurately explore the mechanism of how population aging affects economic growth, several related control variables are selected. According to the Solow model, economic growth is driven by capital and labor, with capital being further divided into physical capital and technological capital. Therefore, this study selects the total social fixed-asset investment (in CNY ten thousand), the number of patent authorizations, the number of employed persons (in ten thousand persons), the average years of education, and the Gini coefficient as control variables. Descriptive statistics of the main variables are shown in Table 3.

3.3. Research Methods

3.3.1. Comprehensive Measurement Method

This study adopts a combination of the analytic hierarchy process (AHP) and the entropy method to assign weights both subjectively and objectively. This approach compensates for the reliance on experience in the AHP and the dependency on data in the entropy method, thus enhancing the scientific and rational nature of the indicator weights.
In 1970, Saaty proposed the analytic hierarchy process (AHP), a method that decomposes complex problems into a goal, a criterion, and alternative layers through a hierarchical structure model [35]. It combines qualitative and quantitative analysis to systematically solve multi-objective decision-making problems. The core of the AHP lies in quantifying the decision-maker’s subjective judgment through pairwise comparison matrices and calculating the weights of elements at each level based on the matrix’s eigenvectors. The consistency of the matrix is then tested to ensure logical validity.
Pairwise comparisons are made for elements within the same level using a 1–9 scale to quantify their relative importance, which constitutes the construction of judgment matrix A = [aij]n×n, which satisfies the following equation:
a i j = 1 a j i , a i i = 1 ( i , j = 1 , 2 , 3 , , n )
By solving the matrix’s largest eigenvalue λ max and the corresponding eigenvector w , the normalized weight vector is obtained as follows:
A w = λ max w
Calculate the consistency ratio (CR) to verify the logical rationality of the judgment matrix:
C I = λ max n n 1
C R = C I R I
where C I is the consistency index and R I is the random consistency index (obtained from the table). If C R < 0.10, the matrix is considered to have acceptable consistency; otherwise, the judgment matrix needs to be adjusted again.
The entropy method is an objective weight assignment method based on Shannon’s concept of information entropy [36]. It is widely used in multi-criteria comprehensive evaluation. The core idea is to determine the weight by calculating the dispersion of indicator data: if the dispersion of an indicator is high (information entropy is low), the amount of information it contains is larger, and, thus, it should be given a higher weight; conversely, it will have a lower weight if the opposite is true.
Let the original data matrix be X = [xij]m×n, where m is the number of samples and n is the number of indicators. To avoid dimension differences, the range normalization method is used to standardize the positive and negative data separately:
d i j = x i j min x i j max x i j min x i j max x i j x i j max x i j min x i j
Since the standardized data may result in zero values, the data are shifted by 1 unit:
y i j = d i j + 1
Convert the standardized data yij into the proportion pij:
p i j = y i j i = 1 m y i j
Calculate the entropy value ej of the j-th indicator:
e j = 1 ln ( m ) i = 1 m γ i j
where γ i j = p i j ln p i j . Then, calculate the coefficient of variation of the j-th indicator. The larger the coefficient of variation, the higher the indicator’s ability to differentiate the evaluation results:
δ j = 1 e j
The final determination of the weight wj is conducted as follows:
w j = δ j j = 1 n δ j
This paper combines the above methods to obtain the weight of the evaluation index system for economic growth and population aging in the Yangtze River Delta, and calculates the comprehensive score of the economic growth and population aging levels in the region.

3.3.2. Bidirectional Fixed-Effects Panel Regression Model

This paper mainly uses the bidirectional fixed-effects model to explore the impact of population aging on economic growth. We first introduce the fixed-effects model:
y i t = β 0 + β x i t + α i + ε i t
where y i t is the core dependent variable in this paper, representing economic growth, with the subscript i indicating the cross-sectional dimension and t representing time; x i t is the core independent variable, representing population aging; α i represents the unobservable individual effect that does not vary over time; ε i t is the error term; and β 0 is the intercept term. The above model is a one-way fixed-effects model that only considers individual effects and does not account for time effects, which is also known as the “individual fixed effects” model. The fixed-effects model treats α i as part of the parameters to be estimated. In this case, the correlation between α i and x i t will not affect the estimation of β .
By adding time-varying effects λ t (which vary over time but do not vary across individuals) to the right-hand side of the one-way fixed-effects model, we construct the “bidirectional fixed effects model,” which controls for both individual and time factors’ impacts on the model. This results in the following model:
y i t = β 0 + β x i t + λ t + α i + ε i t
where λ t controls for unobservable policy or economic shocks, whose impact on different individuals is the same at the same time. This study uses city panel data from three cross-sectional time points: 2000, 2010, and 2020. A two-way fixed-effects model is employed to control for city-specific characteristics that do not change over time (such as geographic location and cultural traditions) and global time trends (such as national policy shocks). Although the data from different time points may exhibit temporal correlation, the fixed effects have already eliminated individual autocorrelation [37].

4. Analysis of the Current Situation

4.1. Analysis of the Current Economic Situation in the Yangtze River Delta Urban Agglomeration

4.1.1. Analysis of Economic Scale

As a core indicator for measuring the regional economic scale and development level, the spatio-temporal distribution characteristics of the GDP are a crucial entry point for analyzing the radiation effects of core cities and the mechanisms of collaborative development. The Yangtze River Delta (YRD) urban agglomeration, as the most economically active region in China, exhibits highly representative spatio-temporal evolution and development trajectories in terms of its total GDP.
From 2000 to 2020, the spatio-temporal pattern of the total GDP in the YRD urban agglomeration showed significant circle-layered evolution characteristics, forming a typical spatial structure of “taking Shanghai, southern Jiangsu, and northern Zhejiang as the core, with values decreasing layer by layer outward.” Specifically, in the economic landscape of the YRD urban agglomeration in 2000, cities with a GDP exceeding CNY 100 billion were still scarce. Only six cities—Shanghai, Nanjing, Hangzhou, Suzhou, Wuxi, and Ningbo—surpassed the CNY 100 billion threshold. Among them, Shanghai led far ahead with an economic aggregate of CNY 450 billion, having become the only “400-billion-yuan-level” city in the region. By 2010, the regional economy achieved leapfrog growth, with as many as 26 cities entering the CNY 100 billion GDP club. The six early leading cities all exceeded the CNY 500 billion threshold, and Shanghai further consolidated its leading position with an economic volume of over CNY 1.7 trillion. By 2020, the economic strength of the YRD urban agglomeration reached a new height: except for Huangshan and Chizhou in Anhui province, all other cities had joined the CNY 100 billion GDP club, and a number of CNY one trillion GDP powerhouse cities had emerged. On top of the original six cities, Hefei and Nantong also successfully joined this echelon (Figure 1).
Over two decades, the YRD urban agglomeration has achieved a historic leap from being led by a few central cities to a full-region economy through the radiation-driven effects of core cities and regional collaborative development. This layered structure, with core regions as growth poles and gradual diffusion, not only demonstrates the economic capacity advantages of central cities but also reflects the continuous enhancement of radiation effects in the process of regional economic integration. It can provide demonstrations for national regional coordinated development.

4.1.2. Analysis of Economic Level

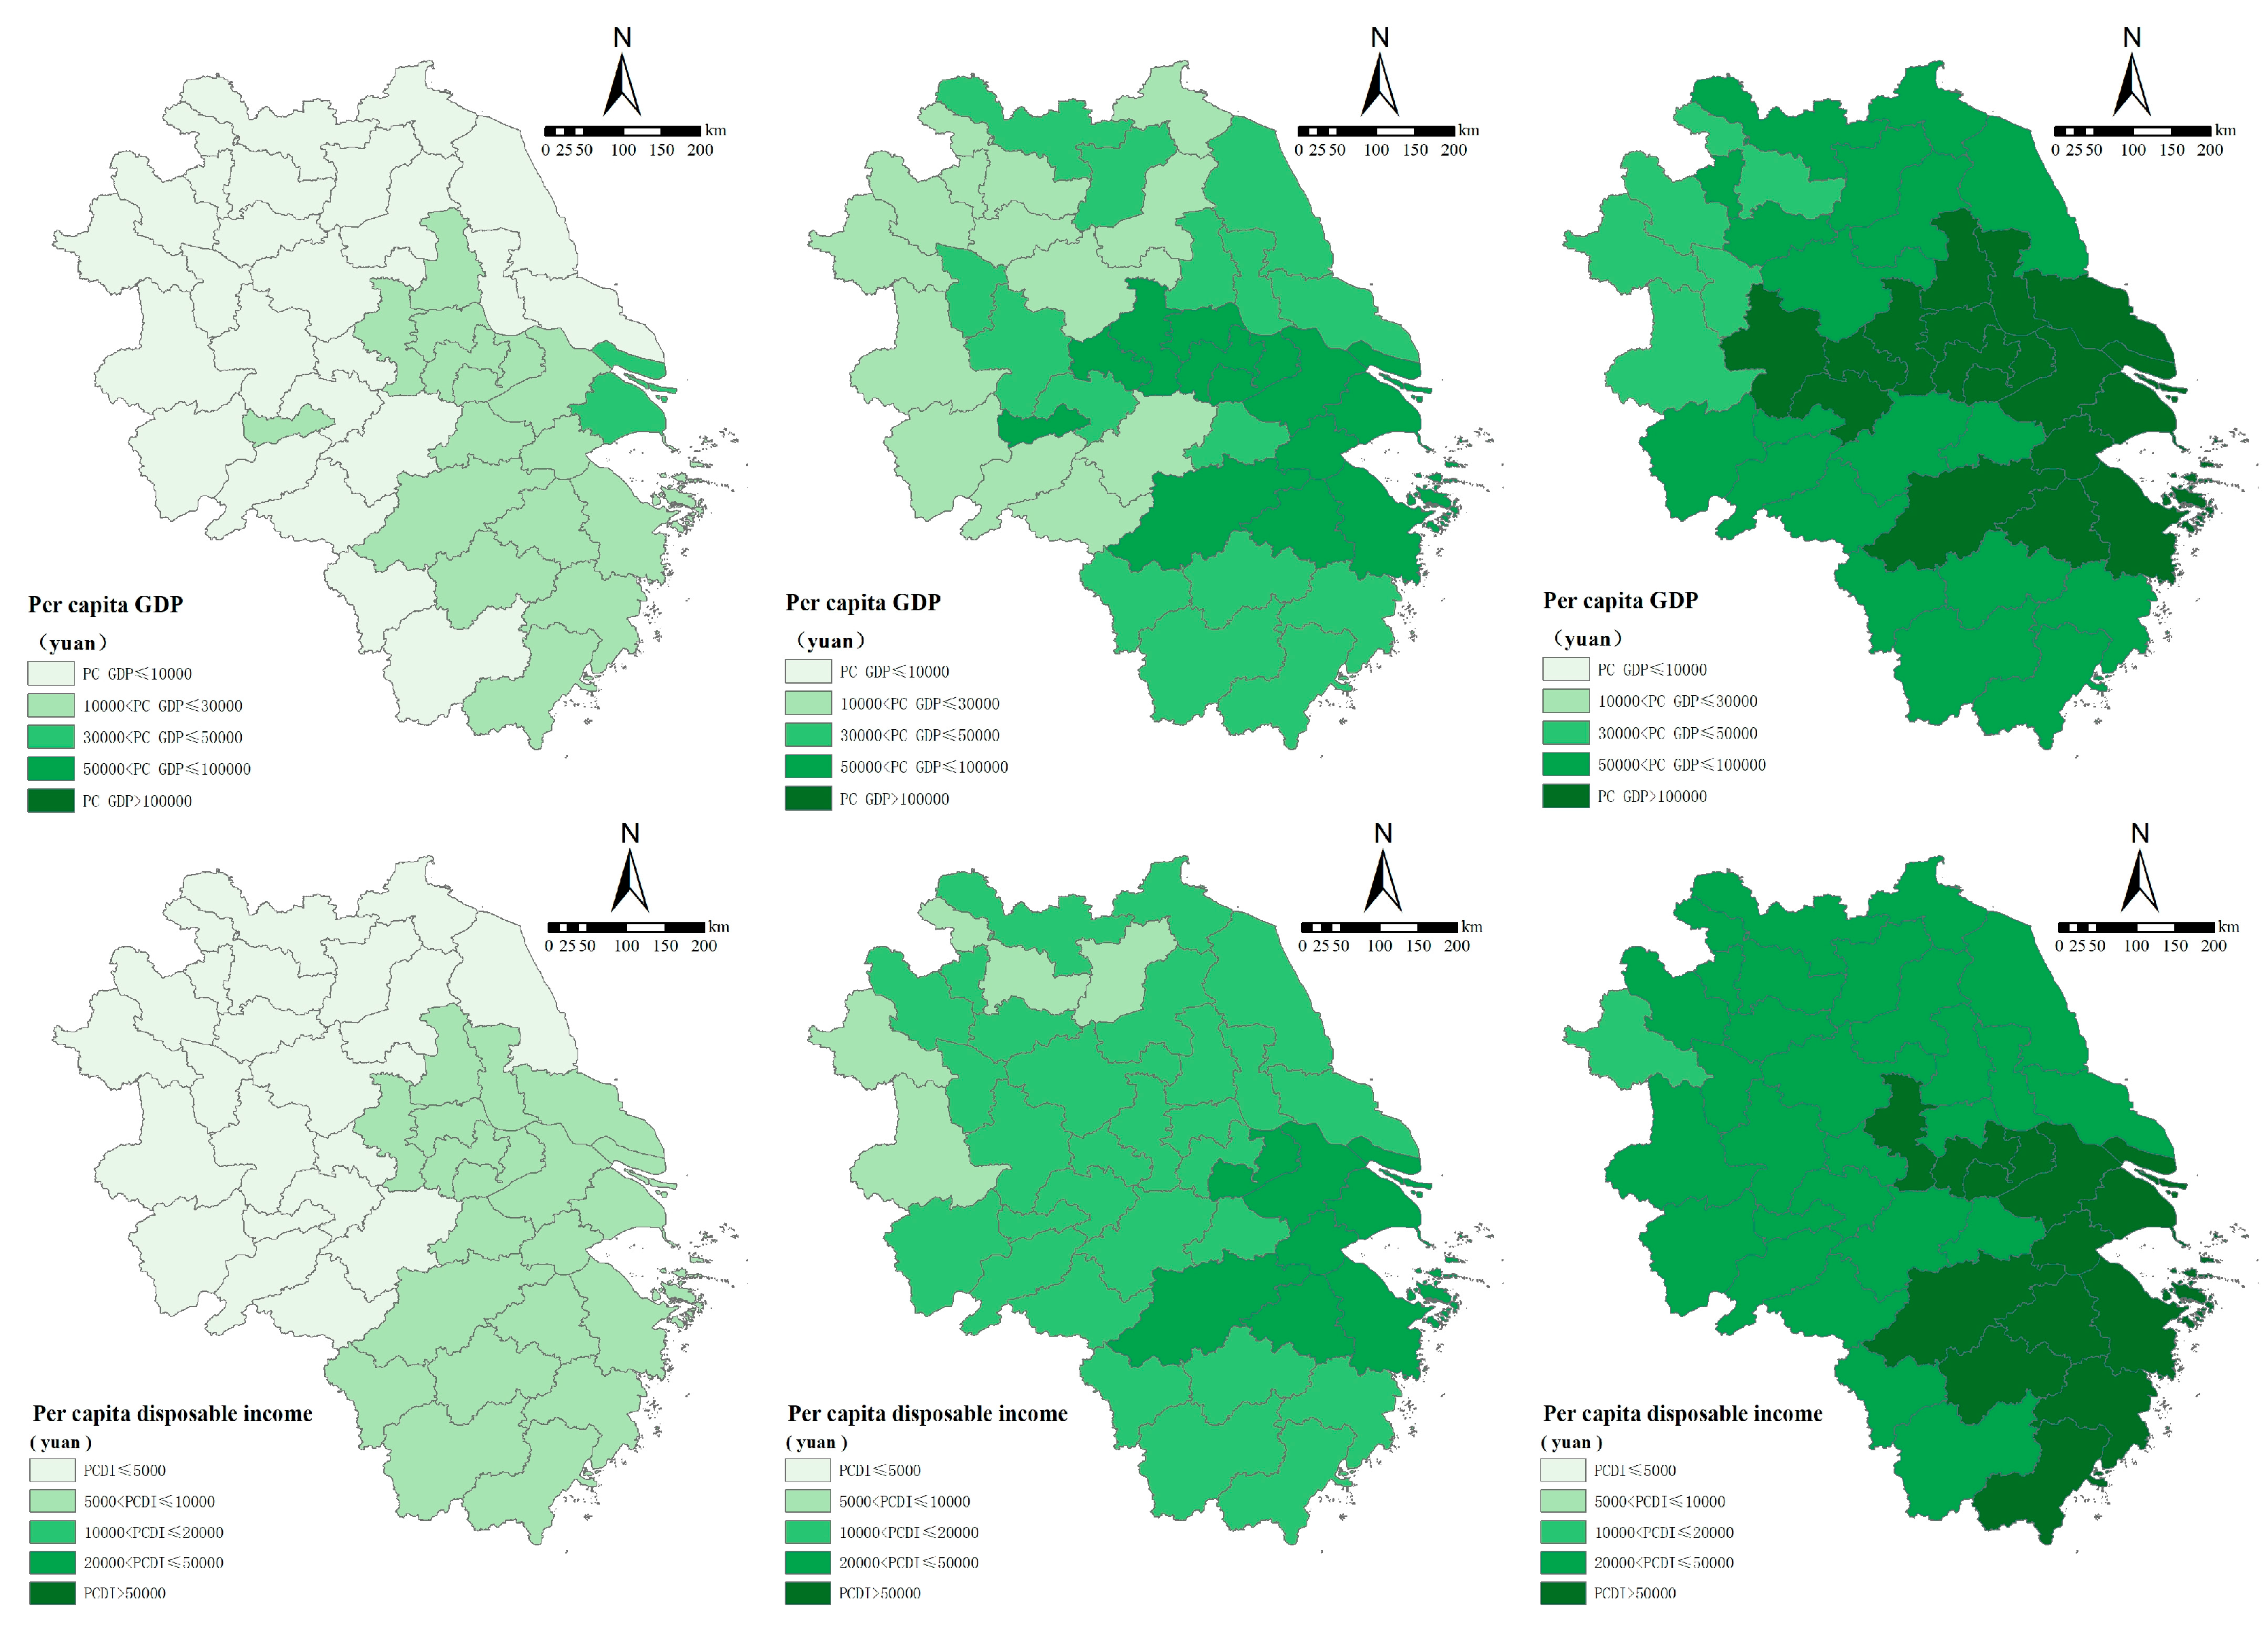
While the total GDP can intuitively reflect the scale of development, it is difficult to accurately characterize people’s well-being and quality of life. Therefore, this section uses the per capita GDP and per capita disposable income of urban and rural residents as indicators to deeply analyze the evolution characteristics of the development quality in the Yangtze River Delta urban agglomeration from 2000 to 2020 from the perspectives of the individual economic level and income distribution (Figure 2).
From the perspective of per capita economic output, the Yangtze River Delta urban agglomeration showed a significant gradient differentiation pattern in 2000: more than half of the cities had a per capita GDP of less than CNY 10,000, and these were mainly concentrated in Anhui, central-northern Jiangsu, and western Zhejiang; only 17 cities exceeded the CNY 10,000 threshold, with Shanghai leading with an absolute advantage of CNY 34,000. By 2010, the regional economic quality had achieved leapfrog improvement, with all cities exceeding the CNY 10,000 mark. The high-value areas were concentrated in pre-developed regions such as southern Jiangsu, Shanghai, and northern Zhejiang, where Suzhou and Wuxi surpassed Shanghai, reaching CNY 93,000 and CNY 92,000, respectively. By 2020, the per capita GDP of the Yangtze River Delta urban agglomeration had achieved another key breakthrough, with all regions exceeding the CNY 30,000 threshold. The overall regional per capita GDP reached CNY 92,000, and a number of cities with a per capita GDP exceeding CNY 100,000 emerged, concentrated in Shanghai, central-southern Jiangsu, northern Zhejiang, and eastern Anhui. Among them, Wuxi, Nanjing, Suzhou, and Shanghai all exceeded CNY 150,000.
In terms of the per capita disposable income of urban and rural residents, the Yangtze River Delta urban agglomeration in 2000 showed a clear dividing line of “high in the southeast and low in the northwest.” The regional average disposable income was CNY 5240, with 20 cities having a per capita disposable income of more than CNY 5000 (accounting for about half of the region), but no city exceeded CNY 10,000. Shanghai ranked first with an income level of CNY 8600. By 2010, with the acceleration of regional integration, the regional average disposable income increased significantly to CNY 15,000, with only four cities—Fuyang, Liuan, Suzhou, and Suqian—failing to exceed CNY 10,000. Eight cities had a per capita disposable income exceeding CNY 20,000, namely Shanghai, Suzhou, Ningbo, Shaoxing, Hangzhou, Jiaxing, Wuxi, and Zhoushan, forming a high-income agglomeration belt along the Shanghai–Nanjing and Shanghai–Hangzhou–Ningbo development axes. By 2020, the overall regional income level had reached a new stage, with only Fuyang failing to exceed CNY 20,000 and 13 cities having a per capita disposable income of more than CNY 50,000. Compared with the per capita GDP, the overall distribution shifted southward: within Zhejiang province, only Quzhou, Lishui, and Huzhou did not reach CNY 50,000. Shanghai continued to lead with CNY 72,000, about CNY 10,000 ahead of Suzhou in second place.
Overall, the spatio-temporal evolution of the two indicators reflects the transformation of the Yangtze River Delta from a “scale expansion” to a “quality improvement” development stage. High-quality economic development is not just about pursuing total quantity growth but also about focusing on people’s income growth and regional balance.

4.1.3. Analysis of Economic Structure

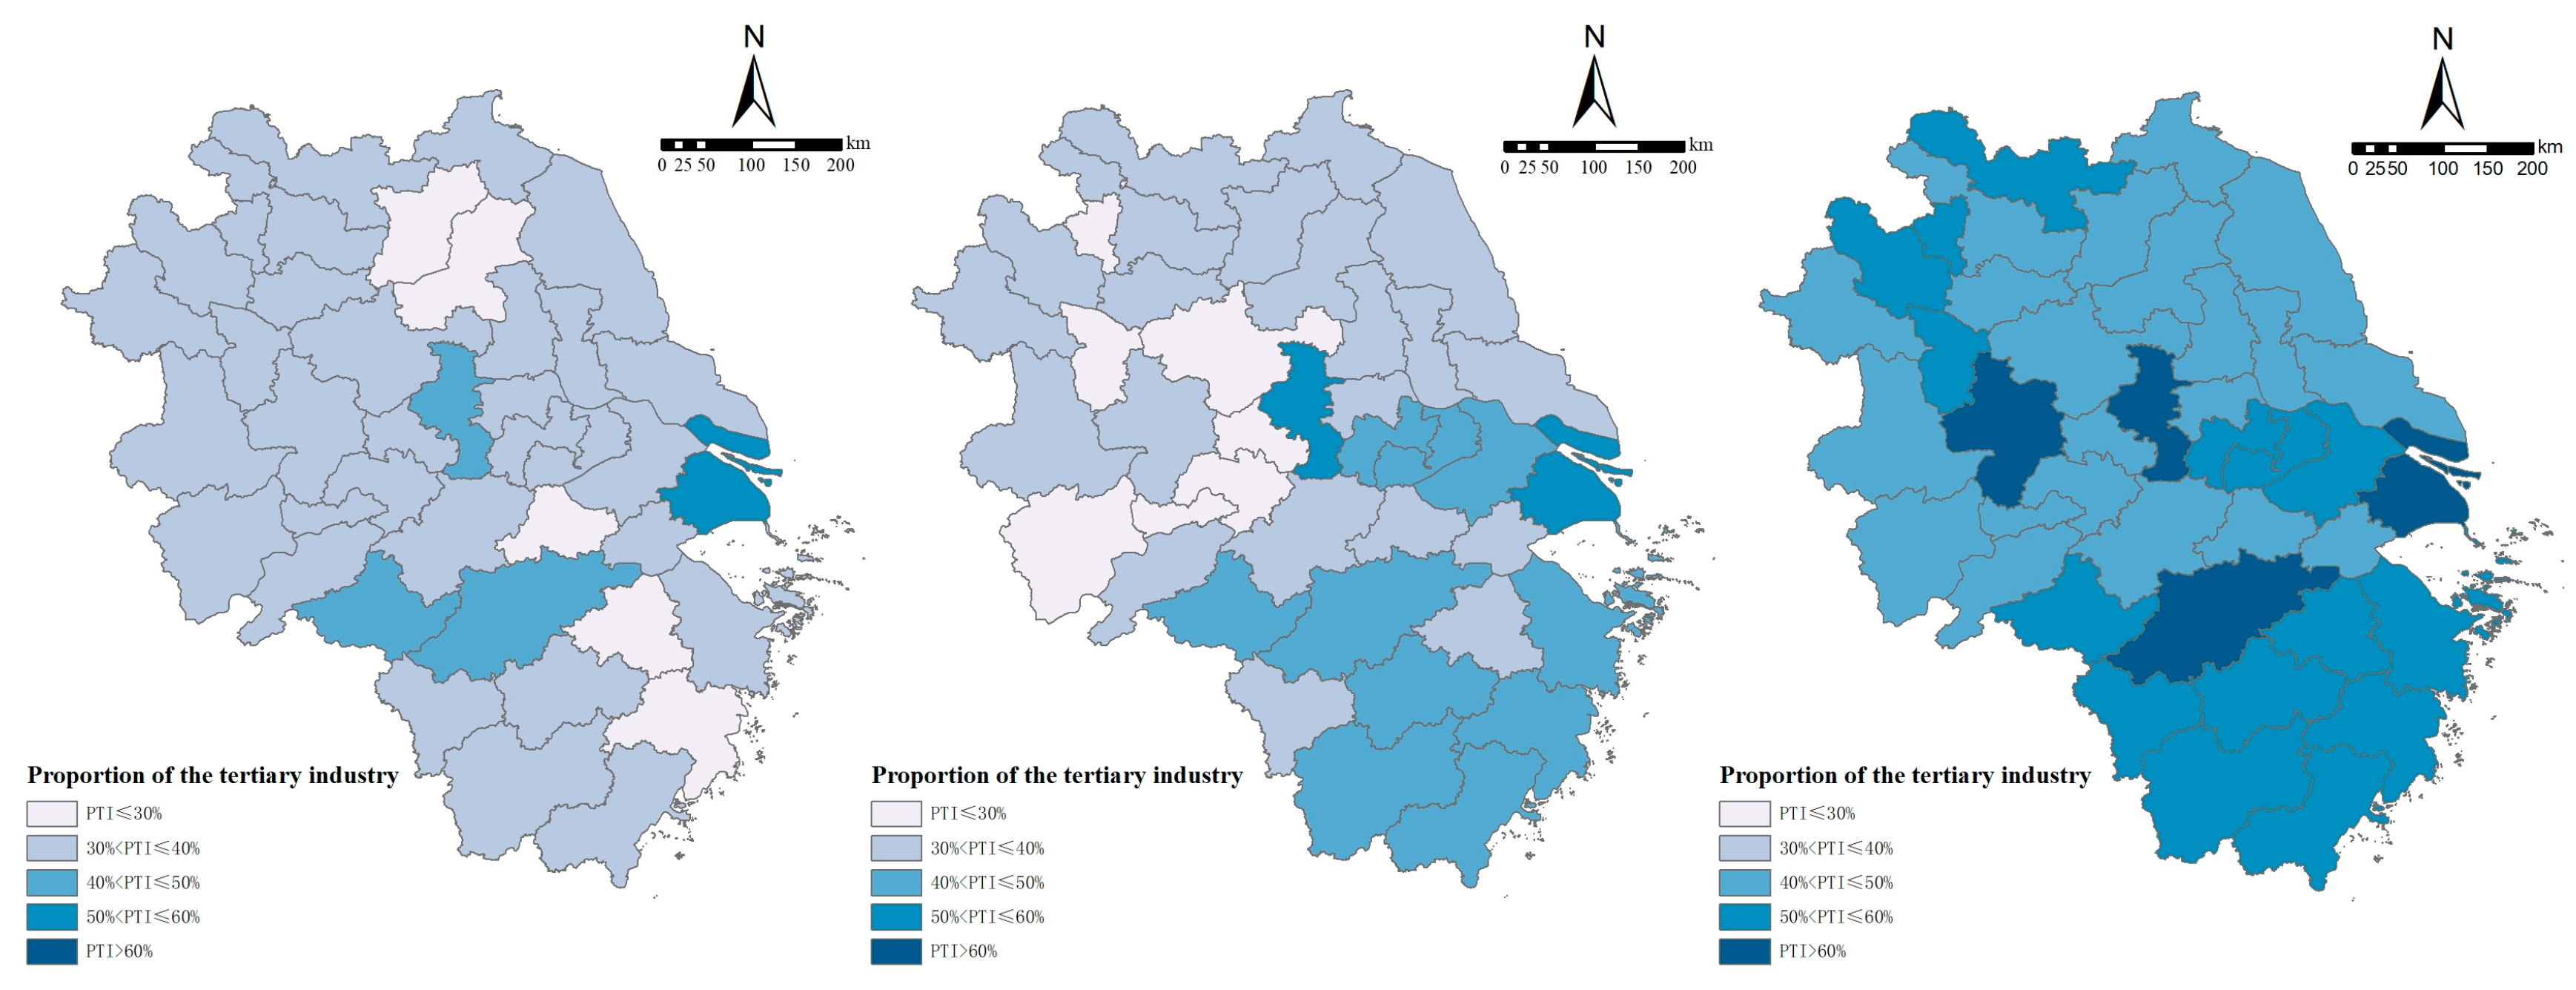
The optimization of industrial structure also reflects the regional economic development model. Figure 3 shows the changes in the proportion of tertiary industry in the Yangtze River Delta urban agglomeration from 2000 to 2020, intuitively reflecting the transformation process of the Yangtze River Delta urban agglomeration from an industry-dominated model to a service-oriented model. In 2000, the development of the tertiary industry in the Yangtze River Delta urban agglomeration was generally in its infancy, with a regional average of 35%. The industrial structure showed an olive-shaped distribution of “large in the middle, small at both ends”, with most cities being in the 30–40% range. Five manufacturing hubs in Taizhou, Shaoxing, and Huzhou, in Zhejiang and Suqian, and Huai’an, in Jiangsu, relied on the secondary industry to drive the economy due to being in the early stage of industrial agglomeration, and the proportion of tertiary industry was less than 30%. Five cities, including Shanghai, Huangshan, Nanjing, Hangzhou, and Hefei, exceeded 40%, among which Shanghai, with the advantages of modern service industries such as finance and trade, became the only city exceeding 50%, initially showing the service economy characteristics of central cities.
By 2010, the overall proportion of tertiary industry in the region slightly increased to 37%, and the spatial pattern showed a differentiated feature of “south rising and north stable”. Most cities with active private economies in southern Zhejiang relied on the development of commercial and trade services, and the proportion of tertiary industry exceeded 40%. As the provincial capital, Nanjing, relying on the concentration of scientific and educational resources and economic development, became the second city with a proportion of tertiary industry exceeding 50%. The growth rate at this stage was relatively slow, mainly constrained by the fact that the Yangtze River Delta as a whole was in the peak period of industrialization. Strong manufacturing cities such as Suzhou and Wuxi still took secondary industry as their mainstay, delaying the process of regional industrial structure upgrading.
By 2020, the development of the tertiary industry in the Yangtze River Delta ushered in a fundamental optimization and upgrading, and the overall proportion of the region broke through the service economy threshold of 50%. The proportion of tertiary industry in all cities exceeded 40%, with all cities completely getting rid of the single structure dominated by industry. The division of labor and cooperation of financial and shipping services in Shanghai, digital economic services in Hangzhou, scientific and technological innovation services in Nanjing, and high-end services in Hefei constituted the driving engine for regional industrial upgrading, so that the proportion of tertiary industry in the four cities reached more than 60%, with Shanghai having exceeded 70%. This change not only benefits from the acceleration of service industry factor flow by the Yangtze River Delta integration policy, but also from the agglomeration development of service industries after the “cage-for-bird” transformation of manufacturing industries in central cities.

4.1.4. Analysis of Economic Growth

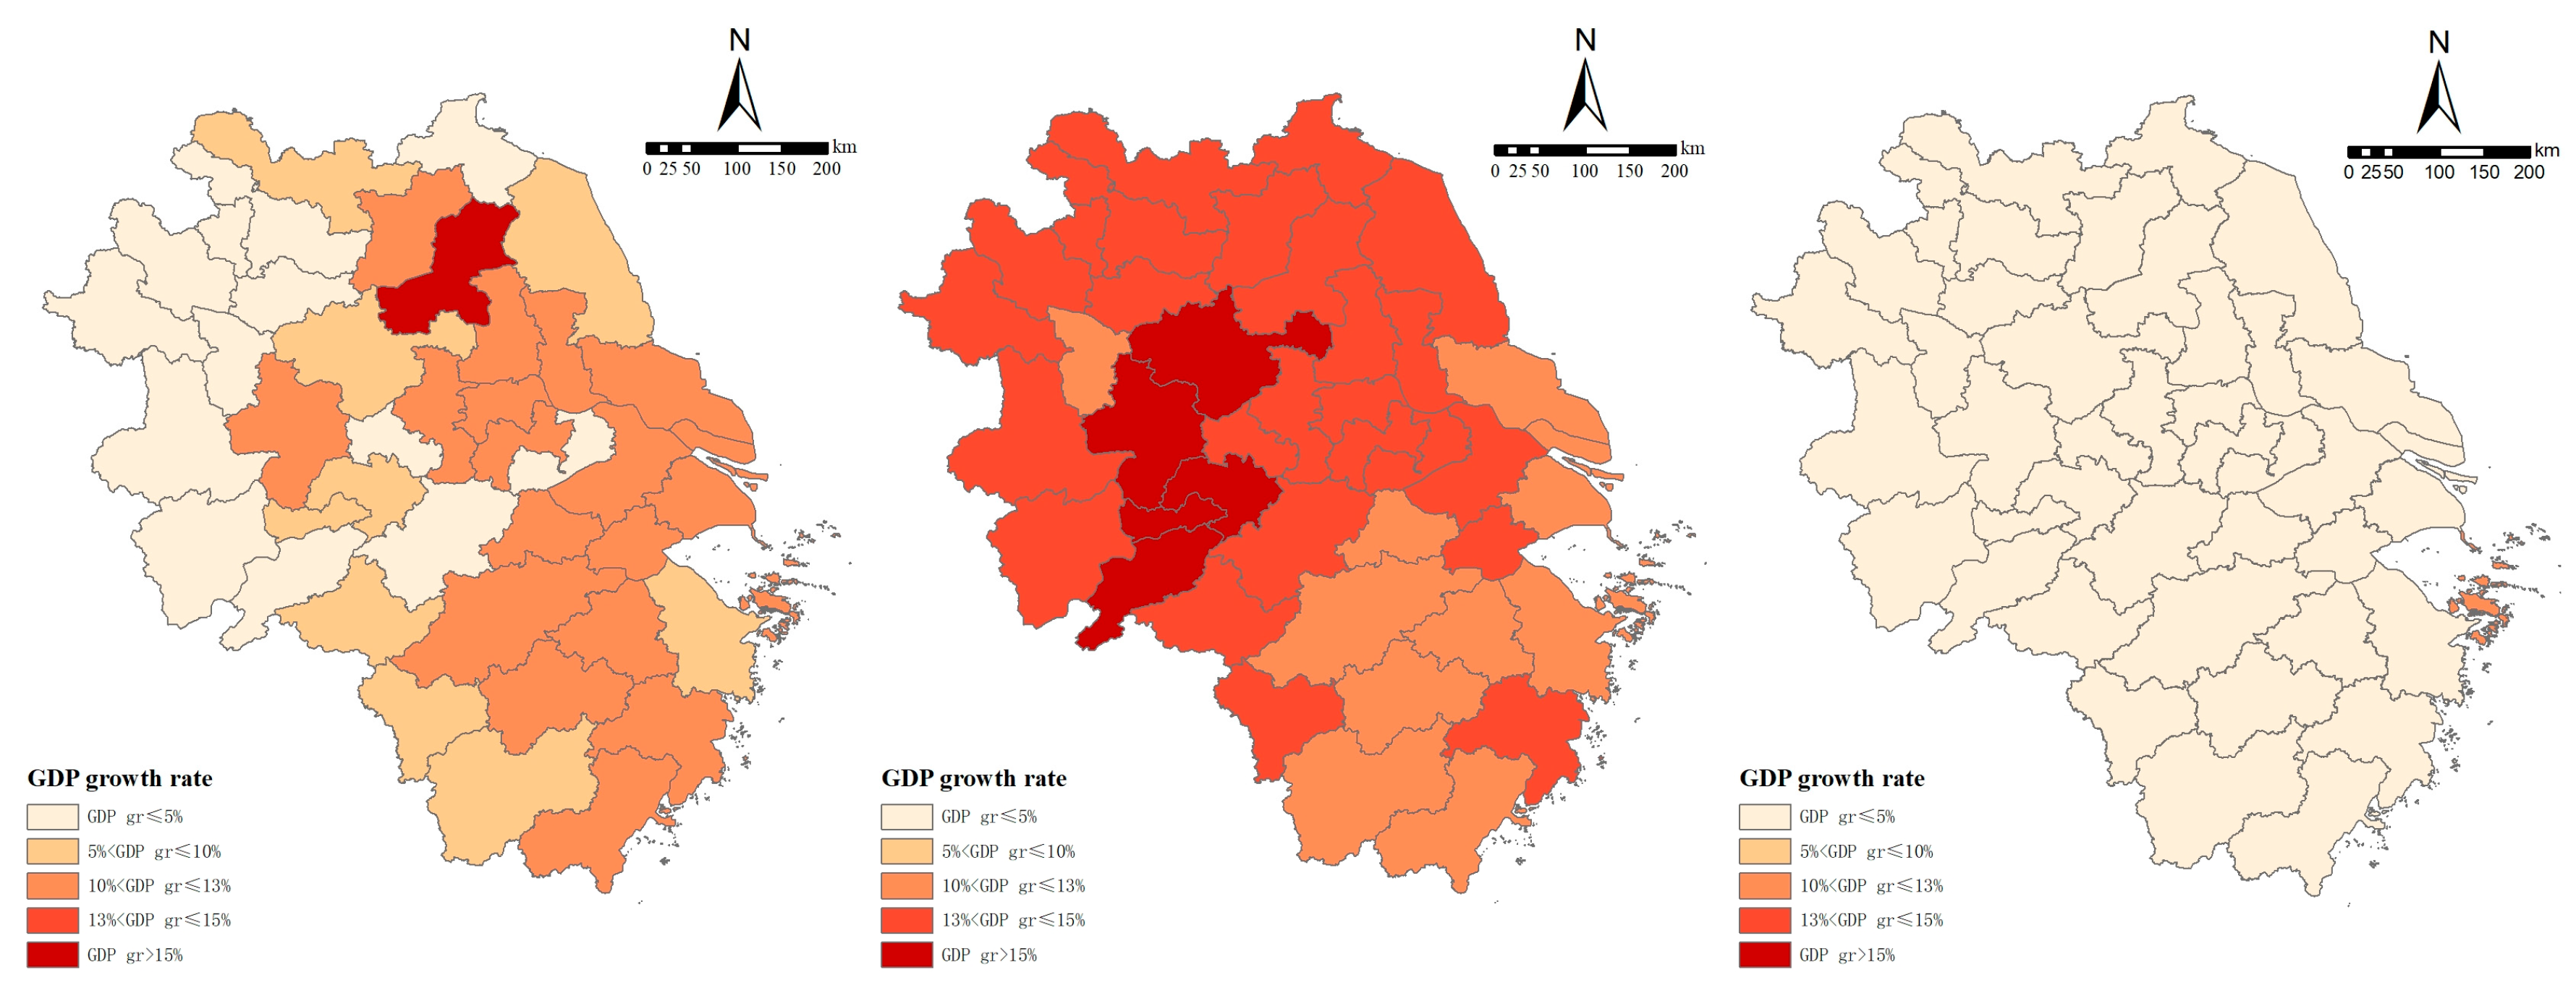
As a core dynamic indicator for measuring economic vitality and development stages (Figure 4), the spatio-temporal evolution of GDP growth rates can not only reveal the migration trajectory of regional growth poles but also reflect the interactive influence of the macroeconomic environment and development strategies.
In 2000, the economic growth rates of the Yangtze River Delta urban agglomeration showed a significant differentiation pattern: the overall regional growth rate was 5%, with 19 cities achieving growth of more than 10% and Huai’an in Jiangsu leading the region with 15.1%. At that time, most cities in Anhui were still in the early stage of industrialization. Huangshan and Chizhou were dominated by tourism, while northern Anhui cities such as Suzhou and Fuyang relied on agricultural economies, with almost no modern manufacturing. During the acceleration period of national market-oriented reforms, traditional industries were doubly impacted by price fluctuations and low efficiency. Meanwhile, as a major labor-exporting province, Anhui saw a one-way flow of capital, technology, and other factors to core regions, which caused local “industrial hollowing-out” and led to negative growth in eight cities.
The year 2010 ushered in an explosive growth period, with the regional average growth rate surging to 13.6%, showing the characteristics of “universal high speed, with the northwest faster than the southeast.” All cities had growth rates exceeding 10%, and seven cities had GDP growth rates exceeding 15%, all of which are located in Anhui province. This explosive growth was mainly due to the national “4 trillion yuan” investment plan implemented after 2008. As the central and western cities represent the core manufacturing region of the Yangtze River Delta, large-scale infrastructure construction and industrial upgrading investments activated the growth potential of these cities. The planning and construction of urban circles such as the Nanjing Metropolitan Circle and Hangzhou Metropolitan Circle promoted the radiation of resources to surrounding areas. Cities such as Hefei, Wuhu, Chuzhou, and Ma’anshan undertook industrial transfers from southern Jiangsu and northern Zhejiang, achieving breakthrough growths in speed.
By 2020, the growth rate pattern had undergone a fundamental transformation, with the regional average significantly slowing to 3.8% and the entire region falling within the low-to-medium growth range of 1–5%, except for Zhoushan City, which reached 12%. This phenomenon stems from the national policy oriented toward high-quality economic development, as China’s economy has entered a new normal of “growth rate shifting and structural adjustment.”

4.2. Analysis of the Current Situation of Population Aging in the Yangtze River Delta Urban Agglomeration

4.2.1. Analysis of the Scale of Population Aging

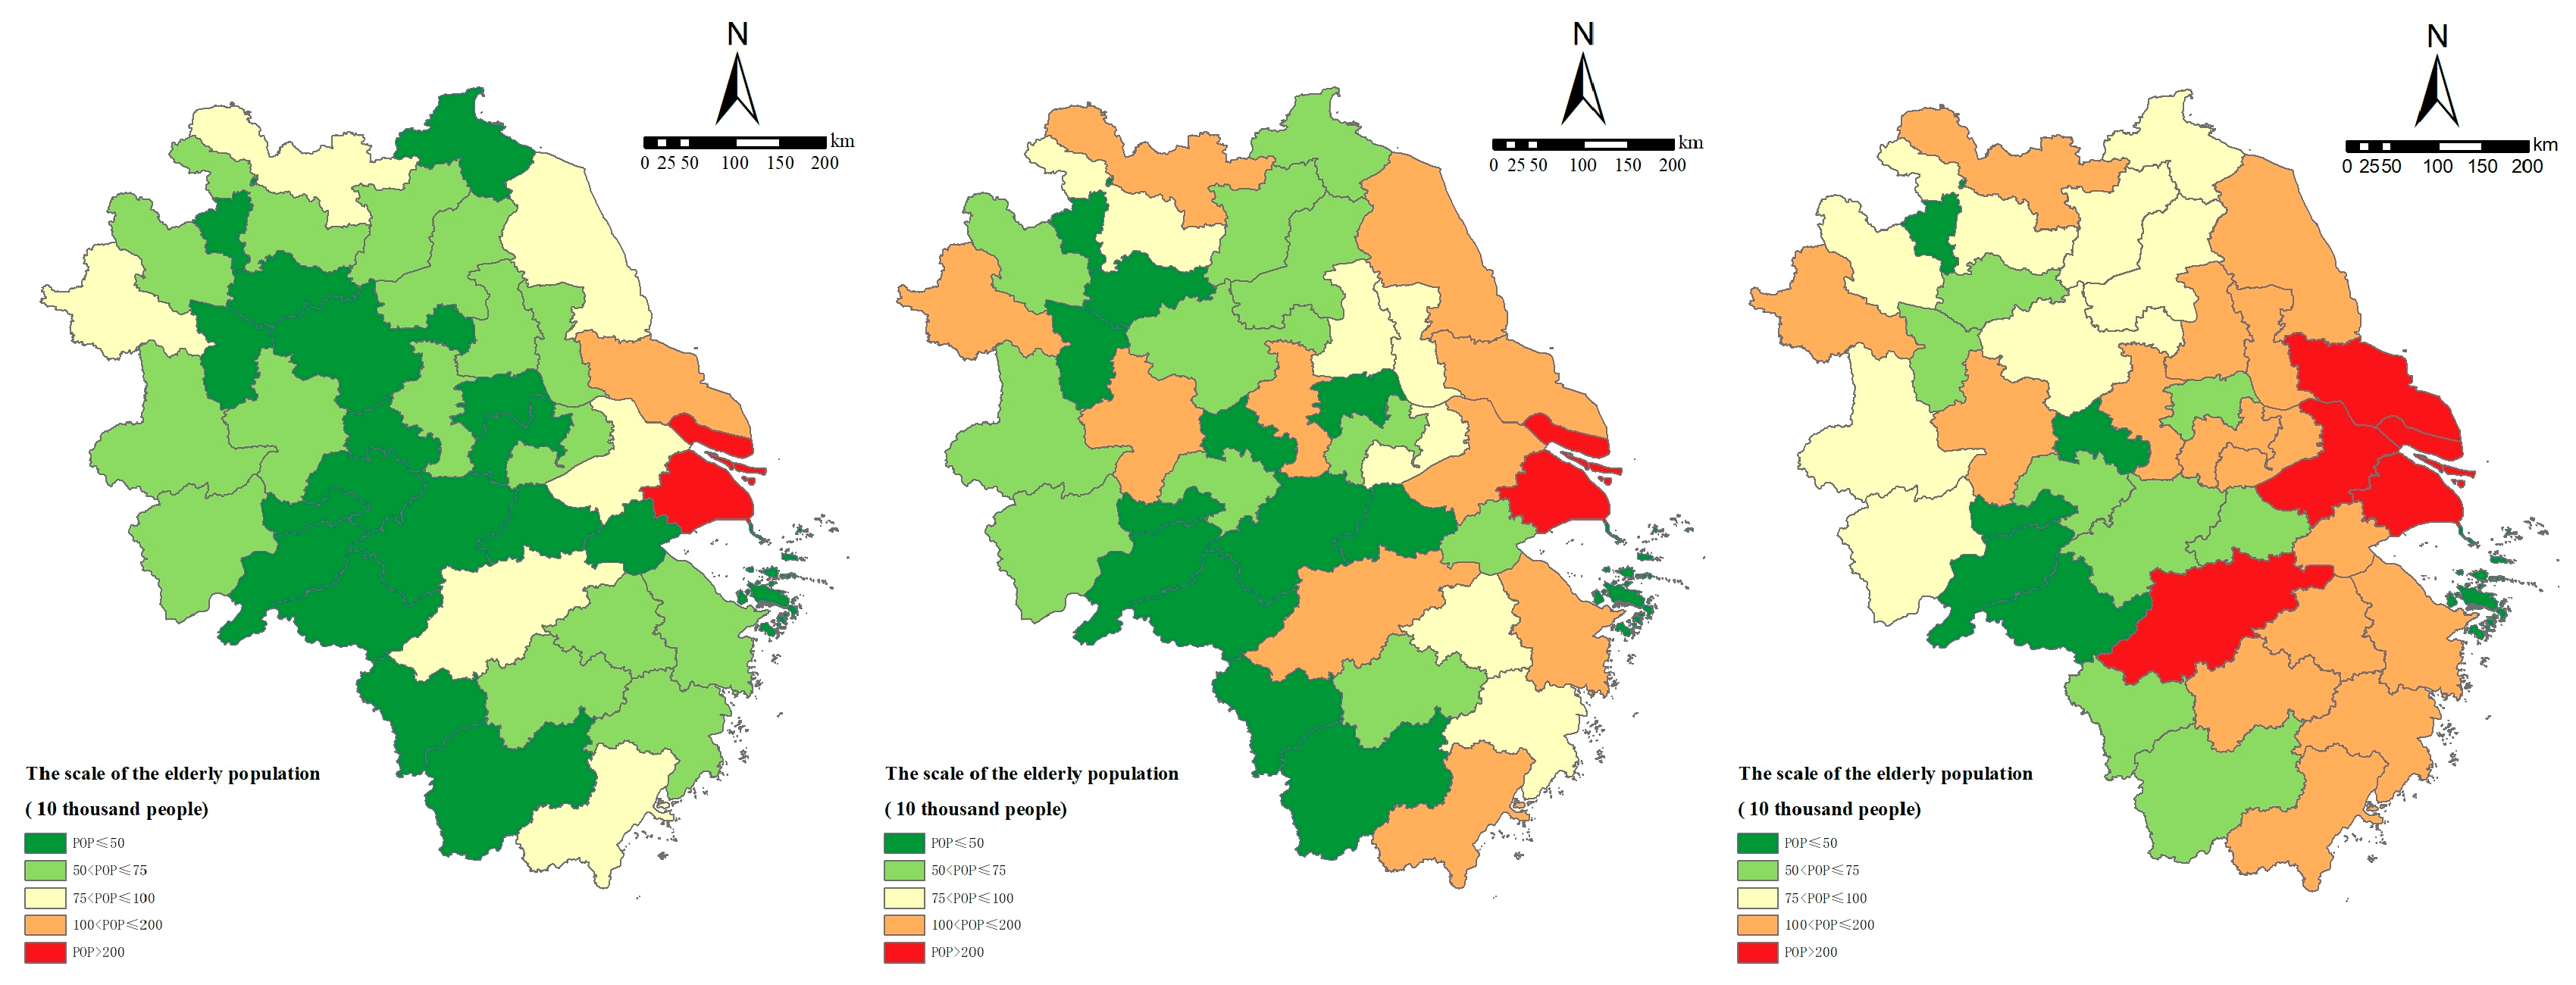
Population aging, as an important accompanying phenomenon in regional economic and social development, reflects deep changes in the labor supply and consumption structure through its scale evolution and spatial distribution. As one of the most prominent regions in China’s urbanization and aging process, the spatiotemporal changes of the elderly population in the Yangtze River Delta urban agglomeration provide a typical sample for analyzing the coupling mechanism between economic development and population structure transformation (Figure 5).
In 2000, the total elderly population in the Yangtze River Delta was 23 million, showing an initial pattern of more in the east and less in the west. Eighteen cities had an elderly population of less than 500,000, and these were mainly distributed in central-southern Anhui and western Zhejiang. These areas had a small elderly population base due to their late economic development and obvious labor outflow. Fifteen cities had an elderly population between 500,000 and 750,000. Shanghai and Nantong, as the first cities to exhibit an aging society, became the only two “million-level elderly population cities,” with Shanghai reaching 2.4 million. This was closely related to the large population base in the core area of the Yangtze River Delta and the improvement of life expectancy.
By 2010, the total elderly population in the Yangtze River Delta had grown to 32 million. The number of cities with an elderly population of less than 500,000 decreased to 13, and these were mainly concentrated in western Anhui and southwestern Zhejiang. The number of million-level elderly population cities surged to 11, including Suzhou, Xuzhou, Yancheng, Hangzhou, and other cities, and Shanghai had exceeded 3 million.
By 2020, the total elderly population in the Yangtze River Delta further rose to 47 million. Only 14 cities had an elderly population of less than 750,000, and these were mostly concentrated in southwestern Anhui and western Zhejiang. The number of cities with more than 1 million elderly people had increased to 19, and these were mainly distributed in the coastal economic belt of Jiangsu, Zhejiang, and Shanghai. Among them, the number of people aged 60 and above in Shanghai exceeded 5 million.
From the evolution trajectory of 2000–2020, it can be seen that the expansion of the elderly population in the YRD is significantly correlated with economic gradient development: the early aging characteristics of core cities are directly related to the decline in fertility rate and the improvement of medical standards during the industrialization process; the mid-term expansion of million-level cities reflects the population structure transformation driven by regional economic integration; the formation of the coastal agglomeration belt in the later period highlights the spatial differentiation of aging caused by the west-to-east flow of labor. The more developed coastal areas have a larger elderly population, but they also have stronger capabilities in allocating elderly care resources. In contrast, marginal areas such as Anhui and western Zhejiang, although they have a smaller elderly population, face the development pressure of “aging before getting rich”.

4.2.2. Analysis of the Structure of Population Aging

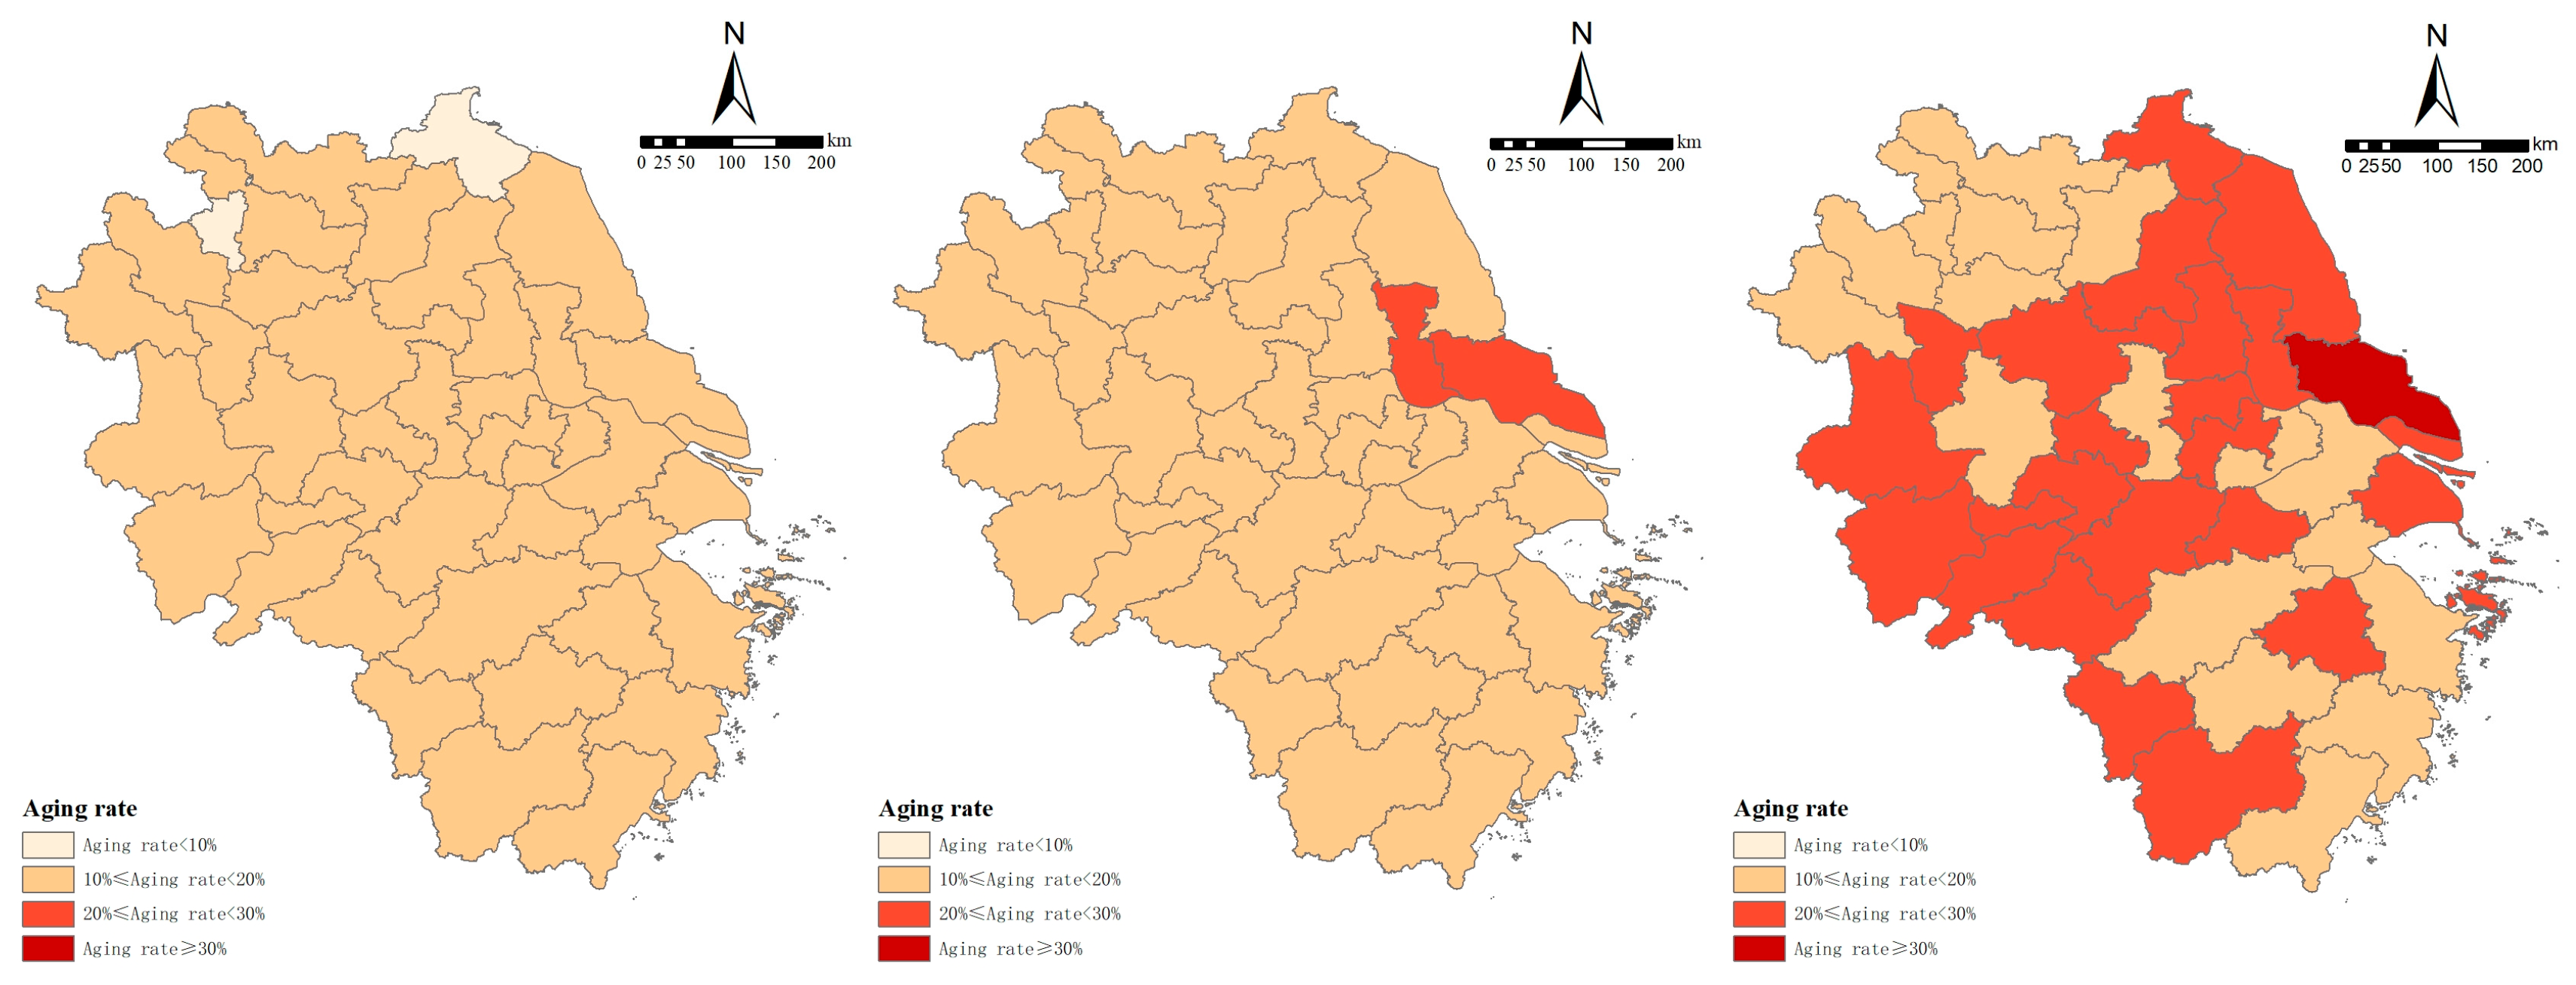
For the Yangtze River Delta, analyzing the dynamic changes in the aging rate from 2000 to 2020 helps reveal the level of economic development, population mobility trends, and the aging process from the perspective of population structure transformation, providing a scientific basis for differentiated responses to aging challenges. Internationally, a country or region is considered to have become an aging society when the proportion of the population aged 60 and above exceeds 10% or the proportion of the population aged 65 and above exceeds 7%. Therefore, this section classifies the population aging status (P) of the Yangtze River Delta into four stages based on the proportion of the population aged 60 and above in the total population: non-aging when P < 10%; mild aging when 10% ≤ P < 20%; moderate aging when 20% ≤ P < 30%; and severe aging when P ≥ 30%.
In 2000, the aging rate in the Yangtze River Delta was 12%, and the area was generally in the mild aging stage (Figure 6). Except for Lianyungang and Huaibei, which had not yet become aging societies due to high natural population growth rates and not-yet-intensified labor outflow, all other cities were in the mild aging stage of 10–20%. Shanghai and Nantong, as the first industrialized cities in the region, had aging rates approaching 20% due to low fertility rates and life expectancy, which indicated the early emergence of “aging before getting rich”.
By 2010, the regional aging rate rose to 15%, with the region officially entering the transitional stage from mild to moderate aging. Nantong and Taizhou took the lead, exceeding 20% and thus becoming the first cities with moderate aging, which was closely related to the long-term low fertility rate in central Jiangsu and the concentration of young labor in Shanghai and southern Jiangsu.
By 2020, the aging rate had surged to 21%, which marked that the entire region had become a moderately aging society. A total of 24 cities entered the moderate aging stage, and these were mainly distributed in Shanghai, most of Jiangsu, southwestern Anhui, and western Zhejiang. Among them, Nantong City in Jiangsu had an aging rate of 31%, having entered a severe aging society. The premature aging in the core areas is directly related to the low fertility rate in the early industrialization period and the aging of young migrant populations; the rapid rise in the aging rate in marginal areas is more due to the passive increase in the aging rate caused by population outflow. Such regions with rapidly increasing aging rates and relatively weak economies may face challenges of “aging before getting rich” and the loss of demographic dividends.

4.2.3. Analysis of the Speed of Population Aging

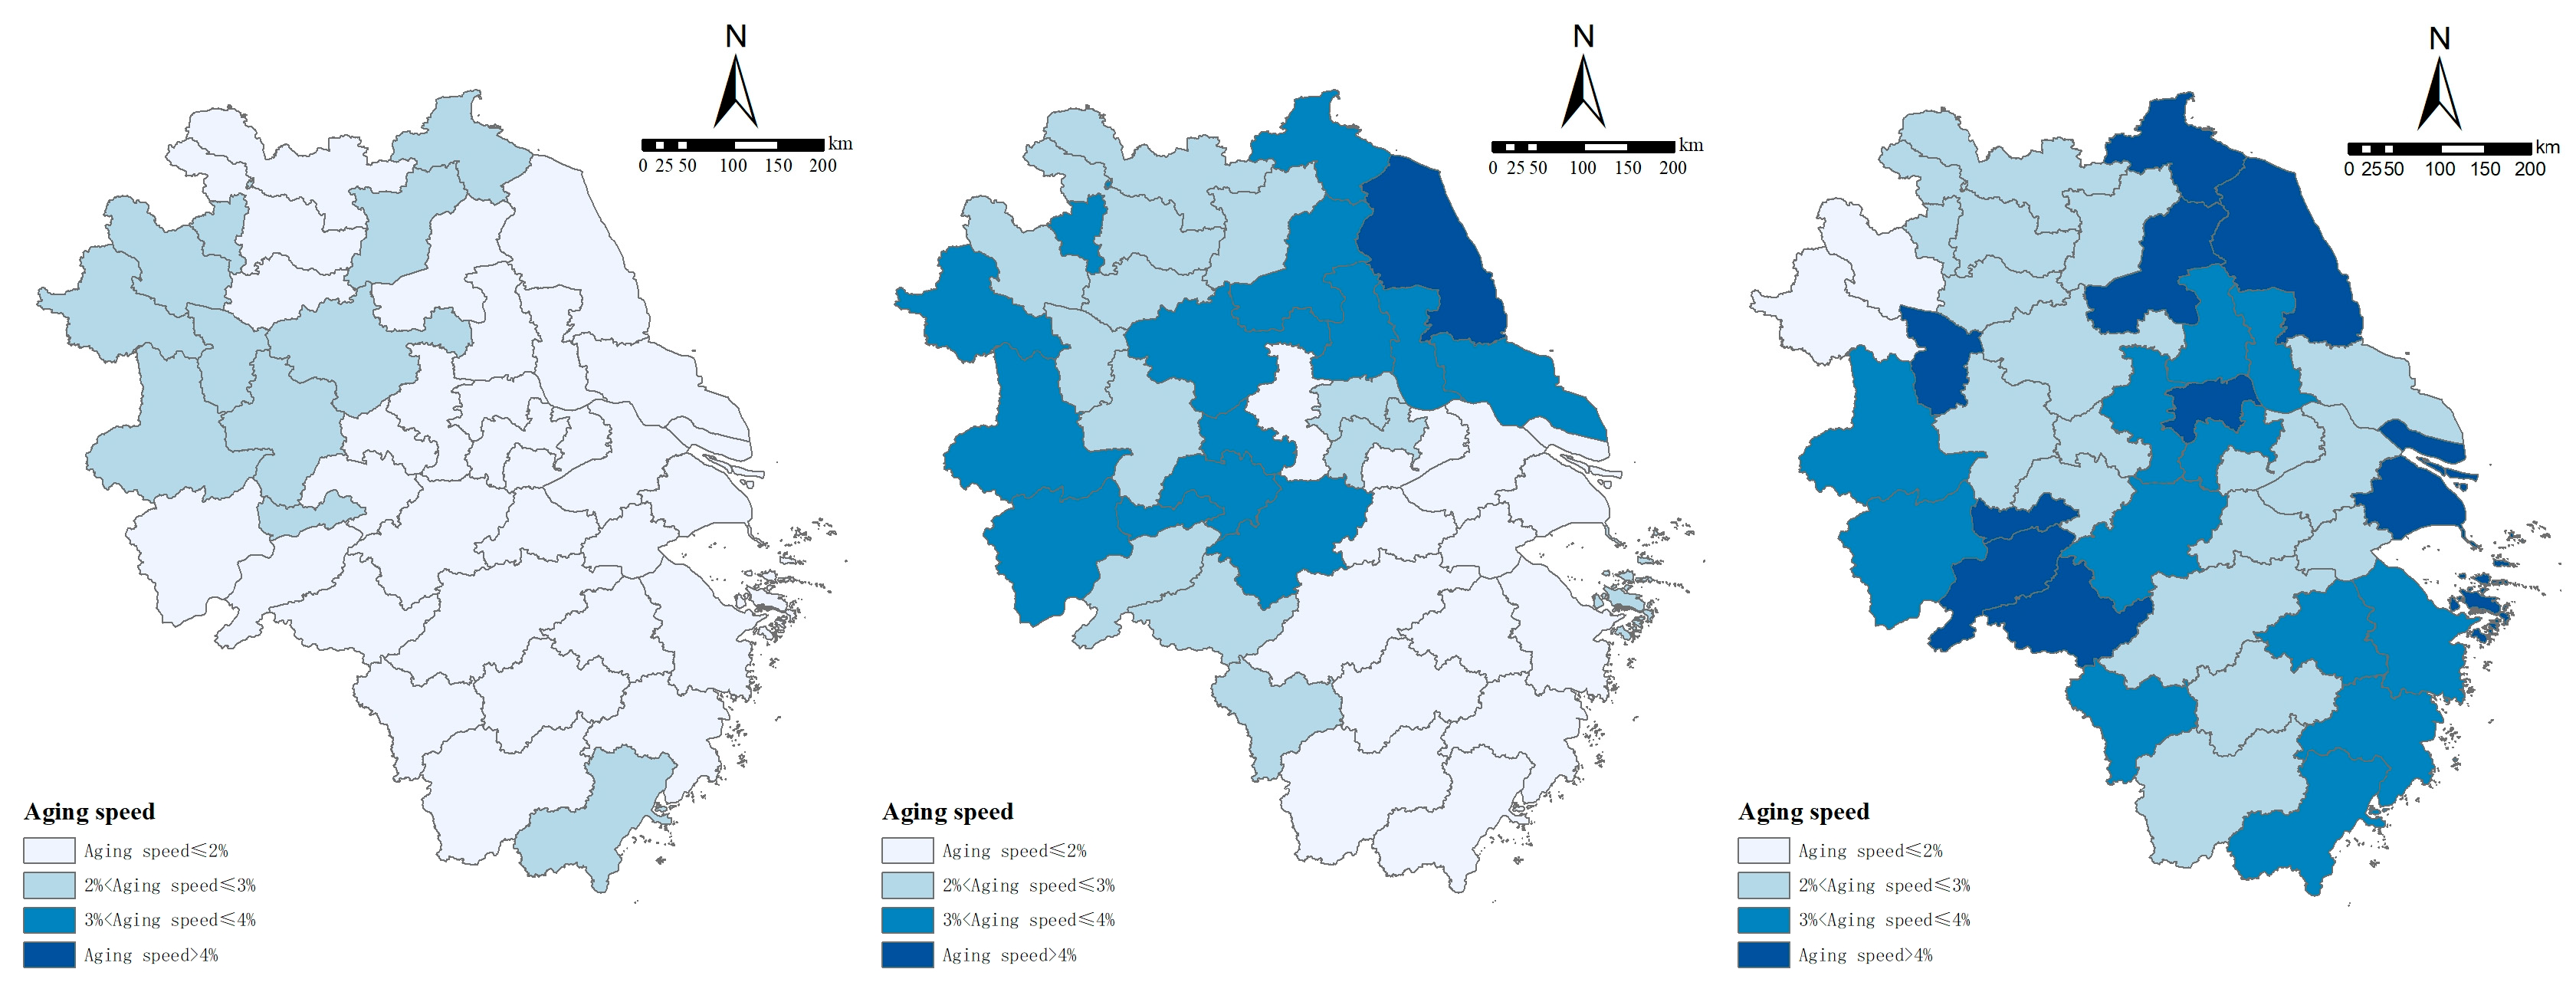
The speed of population aging can reveal the pace of regional population structure transformation. Figure 7 shows the speed of population aging in the Yangtze River Delta urban agglomeration from 2000 to 2020.
In 2000, the overall growth rate of aging in the Yangtze River Delta urban agglomeration was approximately 2%, with 11 regions having a growth rate higher than 2%. These regions were mainly concentrated in Anhui province and the two northern Jiangsu cities, primarily due to labor outflow in these areas during the early industrialization stage, which relatively increased the speed of aging.
By 2010, the overall aging growth rate in the Yangtze River Delta urban agglomeration rose to approximately 2.4%, with 15 regions having a growth rate higher than 3%. These were mainly concentrated in central-northern Jiangsu and eastern-western Anhui, with Yancheng City experiencing the fastest growth at 4%. In Zhejiang province, the active private economy attracted a large number of migrant workers, significantly suppressing the speed of aging, so most areas remained in the low-growth zone below 2%.
By 2020, aging had accelerated across the entire region, with an average growth rate of 3.3%. Ten cities had a growth rate exceeding 4%, and these were mainly located in Shanghai, northern Jiangsu, and southwestern Anhui. Shanghai’s rapid growth was driven by the deep aging of its registered population and the aging of its migrant population’s age structure. In northern Jiangsu and southwestern Anhui, long-term labor outflow exacerbated “age structure hollowing-out,” causing the growth rate of the proportion of the elderly population to far exceed the natural population growth rate.
It is worth noting that, during this period, the GDP growth rate of the Yangtze River Delta had declined to 3.8%, while the speed of aging reached a 20-year peak, which formed an asynchronous development trend of “economic slowdown alongside aging acceleration.” This asynchrony is essentially the inevitable result of “economic growth following industrial cycle laws, while population aging follows generational replacement laws”.

5. Benchmark Regression

5.1. Single Indicator

To explore the mechanism through which population aging affects different dimensions of economic growth, this section uses three-phase data on population aging and economic growth from 2000 to 2020. The indicators of aging scale, structure, and speed are incorporated into a two-way fixed-effects panel regression model to investigate the impact mechanisms of the aging scale, structure, and speed on the GDP, per capita GDP, residents’ disposable income, and GDP growth rate. For the aging scale, two indicators are selected: the size of the elderly population and elderly population density; for the aging structure, four indicators are used: the aging rate, elderly dependency ratio, longevity coefficient, and proportion of younger elderly; and for the speed of aging, the change rate of the aging rate is employed. The benchmark regression results are shown in Table 4.
In terms of the mechanism of the impact of population aging on the GDP, both the size and density of the elderly population passed the 1% significance test, with coefficients of 0.970 and 0.319, respectively, which indicates a significant positive effect on the total GDP. This effect may benefit from the economic effects of elderly population agglomeration in core cities: the concentration of elderly populations in cities such as Shanghai and Nanjing has spurred the development of specialized consumer markets for elderly care services and healthcare, boosting economic output. The longevity coefficient passed the 1% significance level with a coefficient of 0.614, which suggests that the longevity coefficient has a significant positive effect on the total GDP. This reflects that, as the population of those aged 80 and above grows, their demand for high-end elderly care services such as medical nursing, rehabilitation, and aging-friendly home renovations has increased significantly, thereby generating a “silver economy”.
It is worth noting that the impacts of the aging rate and elderly dependency ratio were not significant. As a relative indicator, the aging rate is heavily influenced by regional economic disparities: high aging rates coexist with strong economies in core cities, while low aging rates in marginal cities correspond to low economic bases, which dilutes the overall correlation. The non-significant negative effect of the elderly dependency ratio may be due to the gradual improvement of the social security system in the Yangtze River Delta, which has alleviated some family care burdens and weakened the direct impact of traditional dependency pressures on the total economic output. In addition, the speed of aging was significant at the 10% level with a coefficient of −0.700, which indicates that excessive aging can inhibit economic aggregate growth in the short term due to a shrinking labor supply and surging social security expenditures.
Regarding the mechanism of impact of population aging on the per capita GDP, the size of the elderly population passed the 1% significance level with a coefficient of −1.737. As they are non-working-age individuals, the expansion of the elderly population directly increases the denominator (total population), while the silver economy they bring is less than the economic output of working-age populations, which leads to a decrease in the per capita GDP. The elderly population density passed the 1% significance level with a coefficient of 1.766, which indicates a significant positive effect on the per capita GDP. This suggests that, in core areas with high urbanization levels, the agglomeration effect of high-quality public services and industrial resources can effectively enhance the per capita output. The aging rate passed the 1% significance level with a coefficient of 8.337. This result may seem contradictory to traditional theory, but actually reflects the special development path of the Yangtze River Delta’s core areas: cities such as Shanghai and Suzhou have successfully offset the impact of declining labor quantities through technological progress and industrial upgrading. The elderly dependency ratio passed the 1% significance level with a coefficient of −3.492, which indicates that the traditional elderly care model of relying on children still has a negative impact on per capita wealth accumulation. The longevity coefficient, the proportion of younger elderly, and the speed of aging were all significantly negative, which suggests that increased elderly care costs brought by more long-lived seniors inhibit the per capita GDP.
Concerning the mechanism of impact of population aging on urban and rural residents’ disposable income, the elderly population density passed the 5% significance level with a coefficient of 0.599, which is consistent with the logic that “high density corresponds to high economic levels”—cities with concentrated elderly populations often have more complete income distribution systems and social security institutions. The aging rate passed the 1% significance level with a coefficient of 6.761, which is also related to the higher pension and property income of elderly groups in core areas. The elderly dependency ratio passed the 1% significance level with a coefficient of −5.379, indicating that, in marginal areas with insufficient social security coverage, increased family care burdens squeeze the actual purchasing power of disposable income. The proportion of younger elderly passed the 1% significance level with a coefficient of −0.664, suggesting that the rise in the proportion of younger elderly has not released the expected “silver workforce” dividend but instead has had a negative impact on resident income due to low employment participation and social security pressures.
In terms of the mechanism of impact of population aging on the GDP growth rate, the elderly population density passed the 10% significance level with a coefficient of −0.841, and the aging rate passed the 1% significance level with a coefficient of −7.454, both indicating that mature economies with high aging levels tend to experience slower growth due to rising labor costs and a diminishing marginal efficiency of capital. The elderly dependency ratio passed the 1% significance level with a coefficient of 5.436, and the proportion of younger elderly passed the 10% significance level with a coefficient of 0.724, revealing that rising elderly dependency ratios drive technological innovation and younger elderly supplement labor gaps through employment participation or intergenerational care, indirectly supporting economic growth rates.
For control variables, fixed-asset investment and the number of patent authorizations were significantly positive for the GDP, per capita GDP, and residents’ disposable income, reflecting the driving role of physical capital accumulation and technological progress on economic scale and quality. Their significant negative effects on the GDP growth rate align with the law of diminishing marginal returns to investment. The number of social employees was significantly positive only for residents’ disposable income, as expanded employment directly increases the household wage income, demonstrating the direct pull of labor quantity on current income. The average education years was significantly positive only for the total GDP, as education enhances human capital to promote technological innovation and production efficiency, with its long-term cumulative effects more significantly impacting total economic growth. The Gini coefficient was significantly negative for the GDP, per capita GDP, residents’ disposable income, and GDP growth rate (at least passing the 5% significance test), indicating that income inequality inhibits economic performance by suppressing consumer demand and social stability.

5.2. Composite Indicators

The previous analysis of the mechanism of impact of population aging on economic growth levels was based on a single indicator for both the dependent and independent variables. However, in the actual economic operation and process of population aging, there are complex interrelations among various factors. In this case, explaining this impact with a single indicator may not be accurate enough. Therefore, this study, based on the indicator system constructed in Table 1 and Table 2, uses the entropy method to determine weights and performs a comprehensive measurement of population aging and economic growth levels. The composite score of the economic growth level is taken as the dependent variable, while the composite score of the population aging level is taken as the independent variable, and the model is analyzed. The regression results are shown in Table 5.
Table 5 reports the regression results of the impact of population aging on economic growth in the Yangtze River Delta cities under different model specifications. Models (1) and (2) are mixed OLS regressions, corresponding to situations with and without control variables, respectively. Models (3) and (4) are fixed-city and -year two-way fixed-effects models. The results show that, regardless of whether control variables are included, the impact of the aging level on economic growth is significant at the 1% significance level, which indicates that the baseline regression model has strong robustness. Further comparison of the models’ fit shows that the R2 of model (4) reaches 0.973, which is higher than the 0.891 of the mixed OLS, and the F-statistic is 473.4, which is significantly higher than the 167.9 of the mixed OLS model. This indicates that the two-way fixed-effects model has the best explanatory power among all models. Therefore, the regression results of model (4) are used as the core basis for analysis in this section.
In terms of core explanatory variables, after isolating these confounding factors, the net effect of population aging on economic growth is clearly presented: the regression coefficient for the level of population aging in the Yangtze River Delta city region is 0.428, and it is significant at the 1% level. This indicates that, for every 1-unit increase in the aging level, the comprehensive economic growth score rises significantly by 0.428 units. This result breaks the traditional belief that “aging inevitably hampers economic growth” and shows that, in the Yangtze River Delta region, population aging has a significant positive impact on economic growth through mechanisms such as improvements in labor quality, human capital accumulation, and industrial upgrading.
The traditional view of the negative impact of aging is largely based on the national average, focusing on linear mechanisms like the shrinking labor supply and rising social security expenditures. However, these assumptions often rely on the premise that the economy is in a stage of slow technological progress, has a simple industrial structure, and has insufficient human capital accumulation. In contrast, the Yangtze River Delta, as one of China’s most economically dynamic and innovative regions, exhibits a more complex transformation in the interaction between aging and economic growth.
From a mechanism perspective, population aging in the Yangtze River Delta transforms into a positive driver of economic growth through multiple channels. First, the aging process forces the industrial structure to upgrade toward technology- and knowledge-intensive industries. Faced with rising labor costs, enterprises in the Yangtze River Delta accelerate automation and intelligent transformation, driving the manufacturing industry from “labor-driven” to “technology-driven.” This transformation not only mitigates the negative effects of a shrinking workforce but also creates new growth space through improvements in total factor productivity. Second, the relatively high level of human capital accumulation in the region allows the elderly population to continue participating in the production process. In core cities like Shanghai, Suzhou, and Hangzhou, the elderly have higher education levels and longer life expectancies. Through flexible retirement systems, reemployment mechanisms, and volunteer services, their wealth of professional experience and industry insights becomes a productive resource, forming a silver-haired human capital dividend. Third, the “silver economy” driven by aging has become a new growth pole. The elderly population’s demand for healthcare, rehabilitation care, age-friendly products, and smart elderly services has led to rapid expansion in related industries, forming a complete industry chain from product research and development to service supply. This not only boosts consumption but also nurtures new economic growth points. Fourth, the well-developed social security system and regional collaboration mechanisms in the Yangtze River Delta have alleviated the negative impact of aging. Through institutional innovations such as cross-region settlement of medical insurance and coordinated pension resource allocation, the three provinces and one city have reduced the public service pressure brought by aging, making their economic growth less constrained by traditional pension burdens.
The regression results of control variables also contain rich economic implications. The coefficient of social fixed-asset investment is 0.092, significant at the 1% level, indicating that, as a traditional driver of economic growth, fixed-asset investment still has a sustained positive driving effect on the economy of the Yangtze River Delta. Through expanding the production scale and improving infrastructure, it provides a solid foundation for economic growth. The coefficient of the Gini coefficient is −0.111 and is negatively significant at the 5% level, suggesting that reducing income inequality has a positive effect on economic growth. This aligns with the economic logic that “expansion of the middle-income group promotes the upgrading of the consumer market.” A more balanced income distribution can effectively boost aggregate social demand and drive economic growth. The coefficient of patent grants is 0.166 and is positively significant at the 5% level, reflecting the important role of innovation outcomes in driving economic growth in the Yangtze River Delta. Technological innovation has become the core driving force for high-quality economic development. The regression result for the number of employed persons varies between models. In the two-way fixed-effects model, the coefficient is positive but not significant, while, in the mixed OLS regression, the coefficient is negative and significant at the 1% level. This contradiction may arise from the control of city-specific heterogeneity in the fixed-effects model. After removing time-invariant city characteristics, the expansion of the labor force size may weaken its impact on economic growth. Additionally, due to factors like rising labor costs and higher skill requirements in the Yangtze River Delta, the mixed OLS model may show a negative relationship between labor quantity and economic growth. The coefficient of education level is 0.122 and is positively significant at the 1% level, fully reflecting the strong promoting effect of human capital accumulation on economic growth. Higher education levels not only directly improve labor productivity but also enhance innovation ability, promote technological absorption, and optimize the employment structure, providing sustainable endogenous power for economic growth in the Yangtze River Delta.
Overall, the regression results of model (4) not only verify the special promoting effect of population aging on economic growth in the Yangtze River Delta but also reveal the complex mechanisms of impact of multi-dimensional factors such as investment, income distribution, innovation, labor structure, and human capital on regional economic development.

5.3. Endogeneity Treatment

In the previous benchmark regression, the positive effect of population aging in the Yangtze River Delta on economic growth has been verified. However, there may be endogeneity issues. Specifically, one is reverse causality: economic growth may increase the level of population aging through improvements in medical conditions, extended life expectancy, etc.; the second is omitted variables: although city and year fixed-effects were controlled for and control variables were added in the previous regression, economic growth may still be influenced by other unobserved factors. To address this, this section introduces the number of healthcare professionals in health institutions as an instrumental variable to mitigate the endogeneity problem of the model (Table 6). The rationale for this choice is as follows: the allocation of health resources is significantly related to population aging, and a sufficient number of medical professionals can improve health levels and extend life expectancy, directly increasing the aging level and thus meeting the “relevance” requirement for instrumental variables; the number of healthcare professionals is more determined by regional medical planning, historical healthcare resource distribution, and other exogenous policy factors, and does not have reverse causality with the current level of economic growth, meeting the “exogeneity” requirement for instrumental variables. Model (1) presents the two-way fixed-effect regression result with the number of healthcare professionals as the instrumental variable. The result shows that the Kleibergen–Paap rk LM statistic passes the 10% significance test, indicating no identification problem; the Kleibergen–Paap rk Wald F statistic value exceeds the 10% critical value, suggesting no weak instrument problem. After addressing endogeneity, the coefficient of the effect of population aging on economic growth rises to 0.917 and is significant at the 1% level. This result is significantly higher than the coefficient from the benchmark regression, suggesting that the benchmark model may have underestimated the effect due to endogeneity. The instrumental variable approach, by severing the reverse causality chain and controlling for omitted variables, more accurately captures the true promoting effect of population aging on economic growth. As the number of medical professionals increases and regional aging intensifies, the accumulation of human capital and the effective supply of labor improve, further positively driving economic growth.
To further verify the robustness of the endogeneity treatment, this study adopts a method from Gu Hongming [22] and selects the proportion of the population aged 65 and above as an instrumental variable in model (2). This indicator is highly correlated with the endogenous explanatory variable, “aging level,” and, as a lagging population structure indicator, it is less affected by reverse economic growth impacts, satisfying the relevance and exogeneity requirements for an instrumental variable. The model passes both the identification test and the weak instrument test. The effect of population aging on economic growth is significant at the 5% level, with a coefficient of 0.236. Although this coefficient is lower than the estimate when the number of healthcare professionals is used as the instrumental variable, the sign remains consistent and statistically significant, indicating that the positive effect of population aging on economic growth is stable across different instrument choices. This result reflects the reliability of the endogeneity treatment and suggests that the mechanism through which population aging affects economic growth may vary depending on the perspective of the selected instrumental variable. However, the core conclusion remains unchanged, which further reinforces the robustness of the finding that population aging in the Yangtze River Delta has a positive effect on economic growth.

5.4. Robustness Check

To further enhance the robustness of the model, this section conducts robustness checks. In model (1) in Table 7, the dependent variable is replaced with urban and rural residents’ disposable income instead of the composite economic growth indicator. Model (2) replaces the independent variable, using the aging rate (the proportion of the population aged 65 and above) instead of the composite population aging indicator. Model (3) changes the estimation method by applying the maximum likelihood method. Model (4) involves trimming the data by 5% at both ends and replacing the initial values. The results show that all four models pass the 5% significance test, and they are consistent with the baseline regression model, with only slight fluctuations in coefficient size. This indicates that the baseline regression model is robust, and that population aging in the Yangtze River Delta region does indeed promote economic growth.

5.5. Heterogeneity Analysis

5.5.1. Threshold Effect Analysis

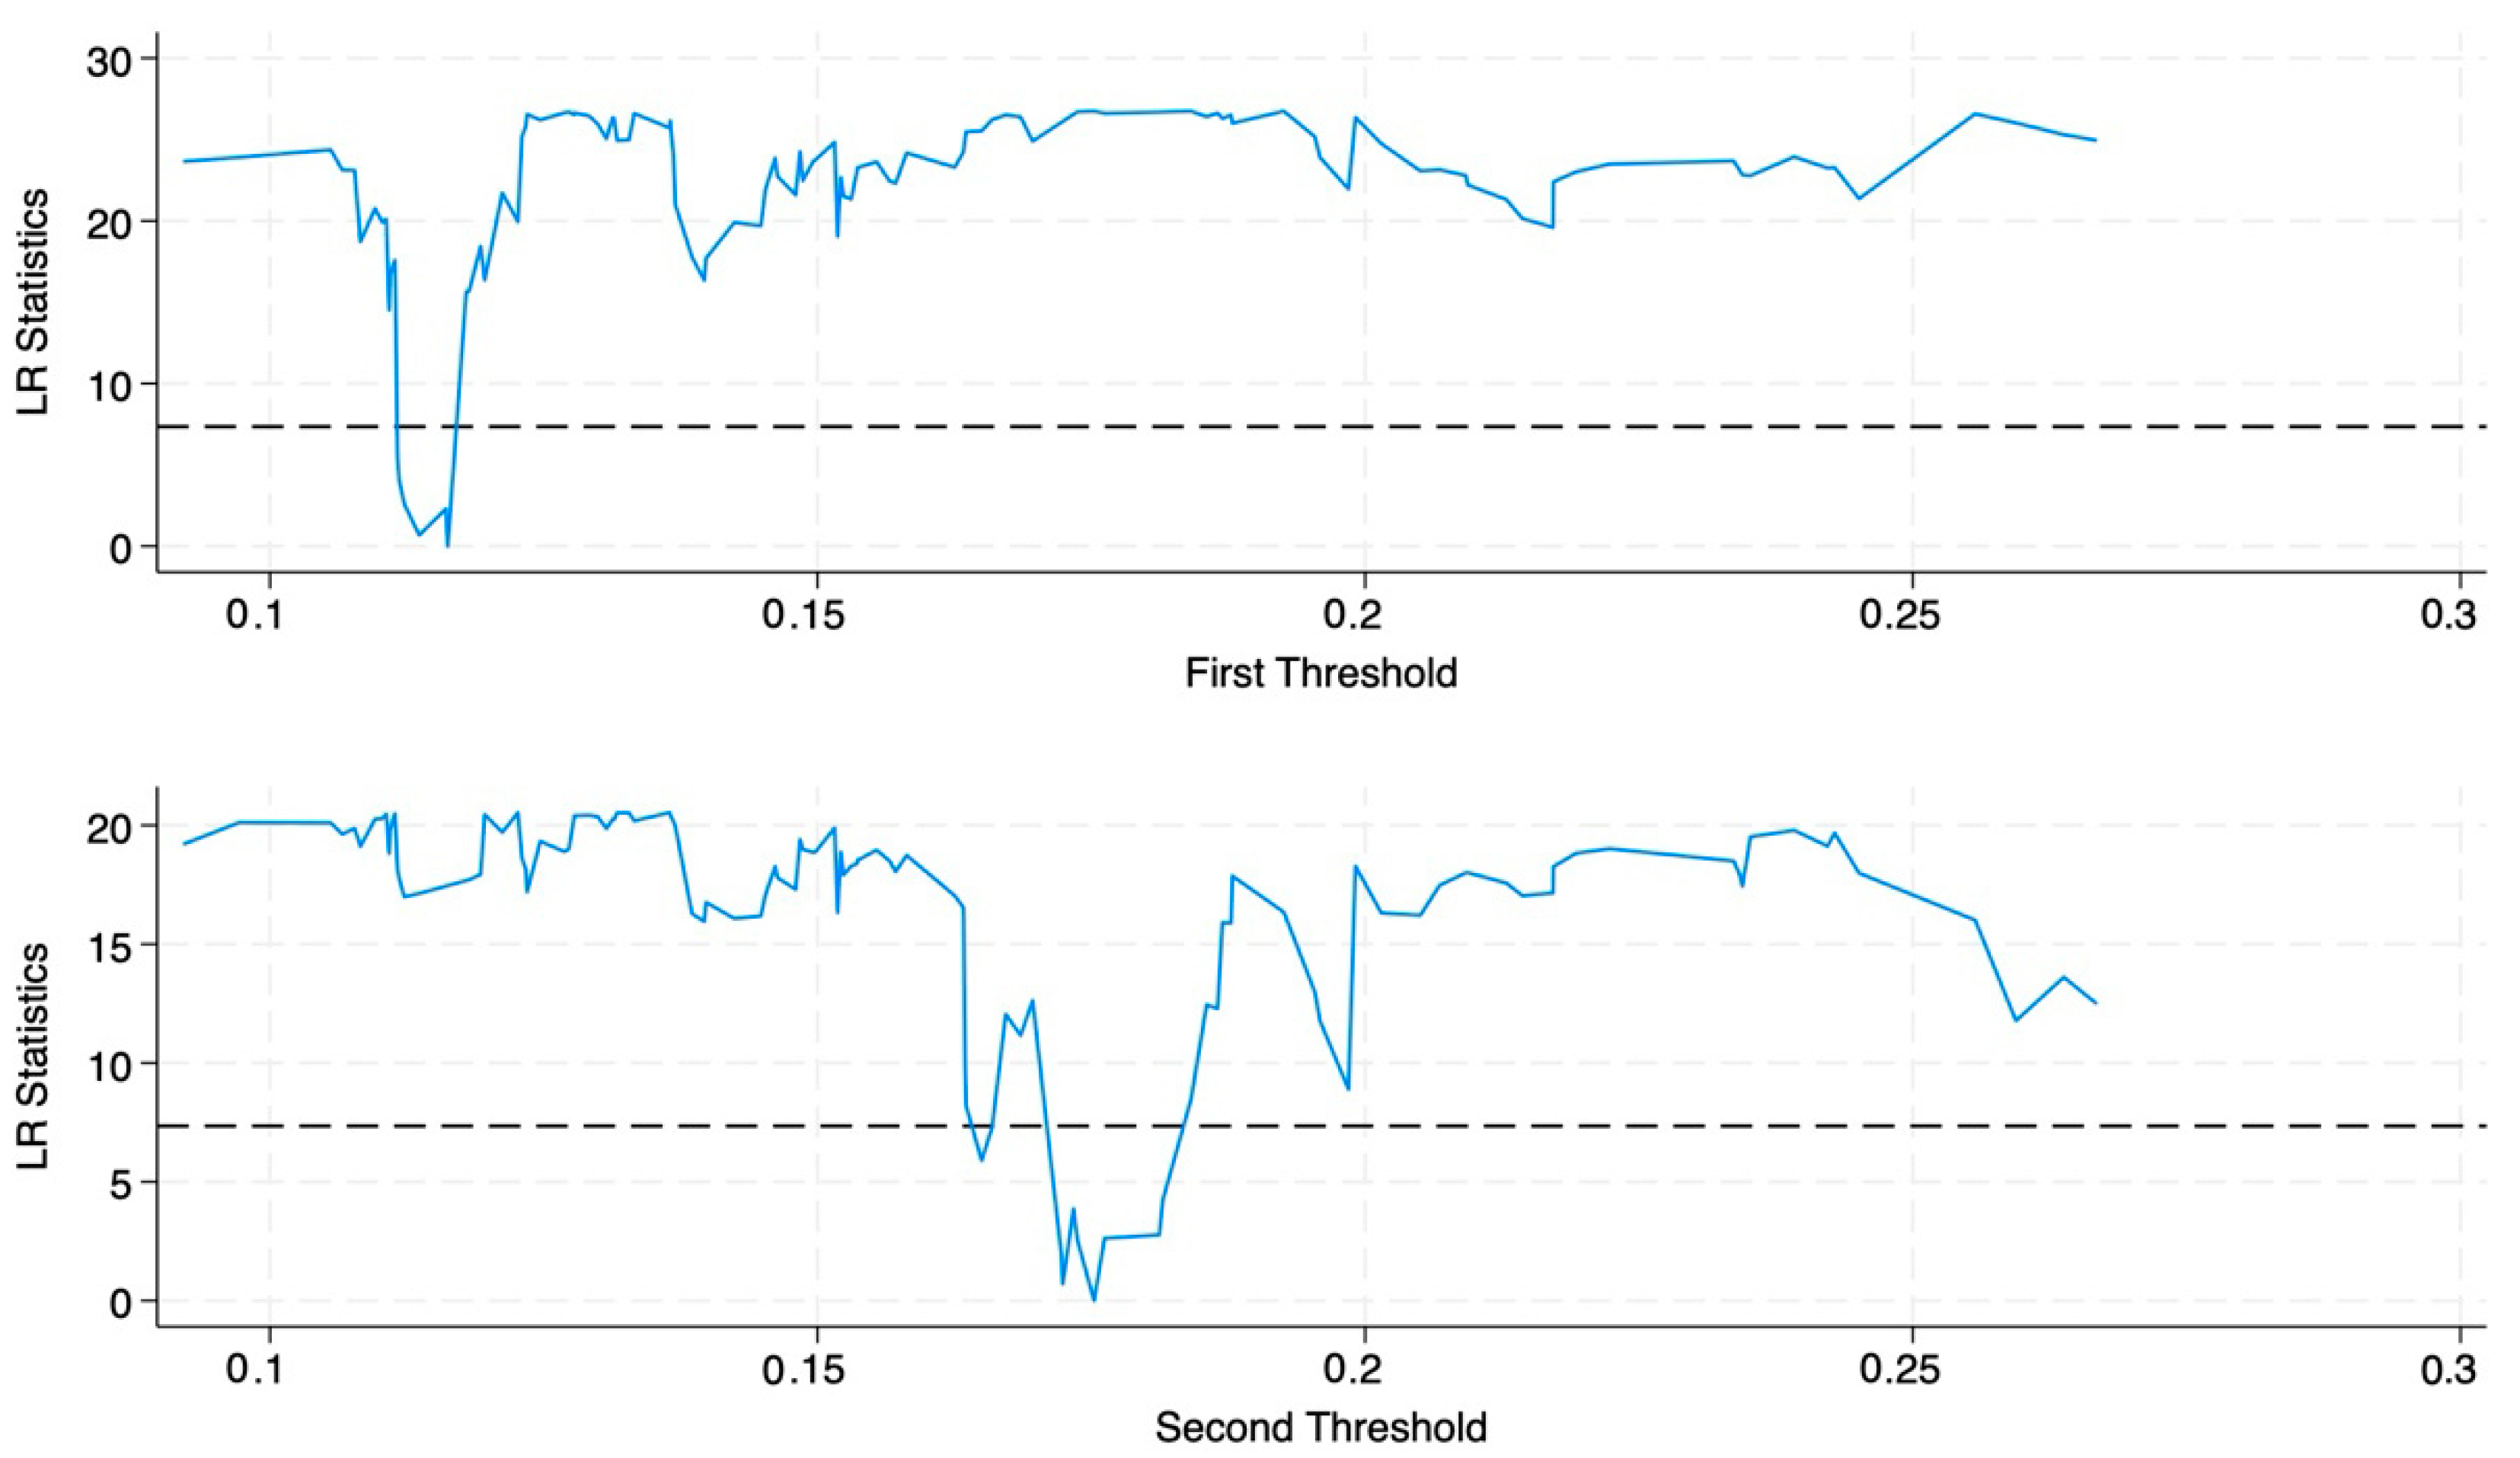
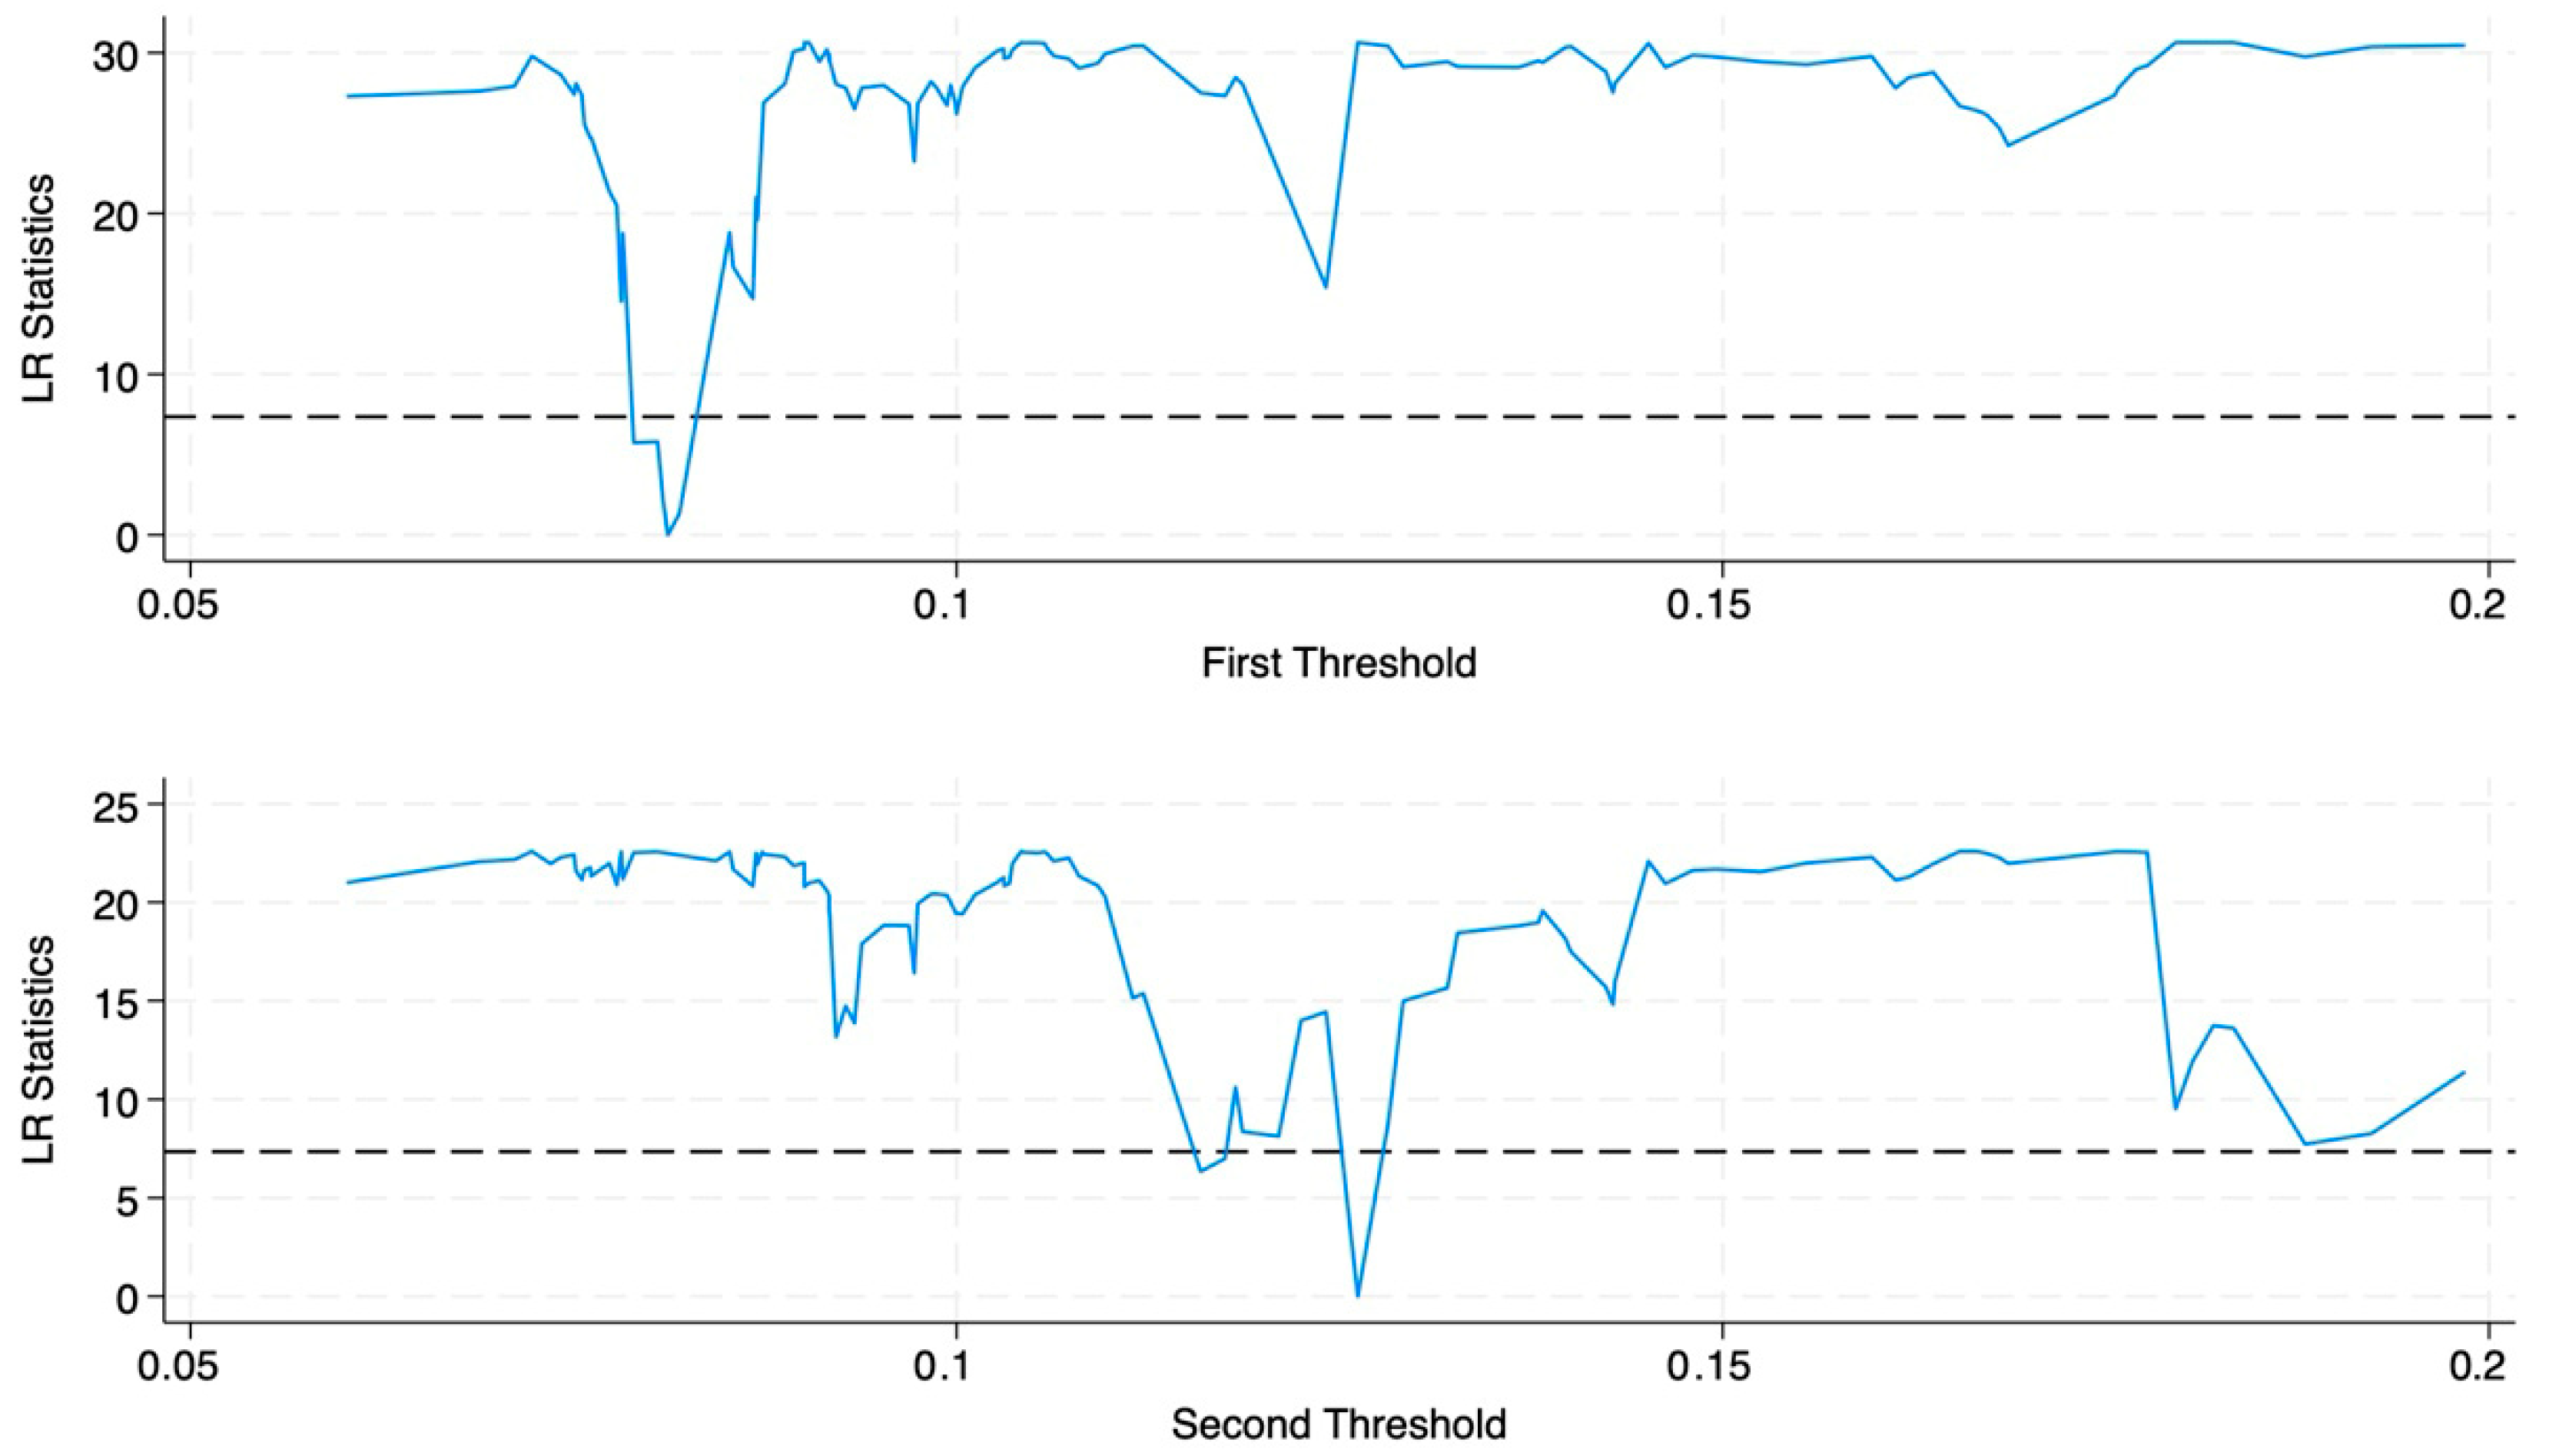
To further explore the nonlinear relationship between population aging and economic growth in the Yangtze River Delta, this section tests the existence of threshold effects and determines the number of thresholds. Table 8 presents the tests and threshold values using the proportion of the population aged 60 and above and the proportion aged 65 and above as threshold variables. The results show that the single thresholds of both variables passed the significance test at the 1% level, and the dual thresholds passed the 5% significance test. However, the F-statistic for the triple threshold did not pass the significance test, indicating that the model has dual thresholds. Regarding the threshold values, the first threshold for the population aged 60 and above, as a proportion of the total population, is 11.63% and the second threshold is 17.53%. For the population aged 65 and above, the first threshold is 8.12% and the second threshold is 12.62%. Combining the LR test statistics in Figure 8 and Figure 9, it is found that the LR values corresponding to the threshold estimates are significantly smaller than the critical value of 7.35, so it can be concluded that the threshold estimates are real and valid.
After confirming the significant nonlinear relationship between population aging and economic growth through strict threshold effect tests, the threshold value of the proportion of the population aged 60 and above was incorporated into the baseline regression model to further analyze the economic impact mechanisms at different stages of aging (Table 9).
This study shows that, when the proportion of the population aged 60 and above is below 11.63%, the aging process significantly promotes economic growth, with a coefficient of 0.442 at the 1% confidence level. During this stage, the elderly population dividend released in the early stages of aging plays a role, as the demand for industries such as healthcare and eldercare services surges with the expanding elderly population, stimulating the consumption market and increasing participation in social production due to the wealth of experience of the elderly, and thereby injecting vitality into economic growth. When the proportion is between 11.63% and 17.53%, the positive effect of aging on economic growth weakens, with the coefficient decreasing to 0.180 at the 10% significance level. In this phase, the negative effects of aging begin to emerge, with issues such as reduced labor supply and increased social security burdens gradually becoming prominent and counteracting some of the positive driving effects, which leads to a decline in the aging elasticity of economic growth. However, when the proportion exceeds 17.53%, the coefficient rises to 0.282 and passes the 1% significance test. This may be due to the deepening of aging forcing policy adjustments and technological innovations. The government increases support for the eldercare industry and companies accelerate their intelligent transformation to fill the labor gap, which stimulates new sources of economic growth and strengthens the role of aging in promoting economic growth. The robustness test using the proportion of the population aged 65 and above as a threshold variable yields results that are consistent with the above conclusions, further confirming the strong stability and reliability of the nonlinear mechanism of impact of population aging on economic growth.

5.5.2. Sub-Sample Analysis

Considering the significant differences in the aging process and economic development stages among the four provinces and cities in the Yangtze River Delta, this section conducts a sub-sample regression analysis on Anhui, Jiangsu, and Zhejiang (Shanghai is not included due to insufficient sample size) in order to reveal the regional heterogeneity of the impact of population aging on economic growth.
The regression results in Table 10 show that the effect of population aging on economic growth in Anhui province does not pass the significance test. This may be closely related to the current economic development characteristics of the province: As a relatively underdeveloped province in the Yangtze River Delta, Anhui has long faced pressure of labor outflow, with a large number of working-age laborers migrating to economic hubs like Jiangsu, Zhejiang, and Shanghai. This has led to more “passive aging” in the region, where the aging population has a counteracting effect on economic growth, resulting in no significant impact.
In contrast, the regression results for Jiangsu show a significant positive effect of population aging on the economic growth at the 5% significance level, with a coefficient of 0.513. This is closely linked to the province’s high economic development level and optimized industrial structure. As a manufacturing powerhouse in the Yangtze River Delta, Jiangsu has faced labor cost increases earlier. The aging population has accelerated the transition of the labor market to a “quality-oriented” one, forcing enterprises to increase their investments in human capital and technological innovation. This has driven industry to upgrade toward high-end manufacturing and modern services. At the same time, Jiangsu’s comprehensive social security system and health services have effectively improved the health participation capacity of the elderly workforce, thus significantly promoting economic growth through human capital accumulation and industrial structure optimization.
The regression results for Zhejiang show a significant positive effect of population aging on economic growth at the 10% significance level, with a coefficient of 0.369. As a major province for private and digital economies, Zhejiang has a notable feature of clustered development of small- and medium-sized enterprises, high innovation vitality, and efficient technology transformation. Population aging has driven enterprises to accelerate their automation and intelligent upgrades to address the marginal decline in the labor force. Meanwhile, Zhejiang’s per capita disposable income has long been among the highest in the country, and the consumption structure upgrade under aging has opened new space for economic growth. This has allowed the positive effects of aging to be manifested under the dual support of innovation-driven growth and consumption upgrading.
The differences in the regression results across the three provinces reflect that the mechanism by which aging impacts economic growth diverges with changes in regional development levels, industrial structures, and labor market characteristics. They also provide empirical evidence that supports differentiated responses to population aging within the Yangtze River Delta: underdeveloped areas need to prioritize solving the dual constraints of labor outflow and lagging industrial transformation, while more developed areas can leverage their advantages in human capital and technological innovation to turn aging into a structural driving force for high-quality economic development.

6. Spatial Econometric Analysis

In the context of economic globalization, the impact of population aging on economic growth is no longer solely a matter of time scales. The economies of countries or regions have become interconnected through the flow of factors such as labor, capital, and technology. This flow influences the aging process and presents different mechanisms of impact on economic growth. Therefore, this study incorporates spatial factors into the model, making the mechanisms through which population aging affects economic growth more persuasive.

6.1. Spatial Autocorrelation Test

The presence of spatial autocorrelation is a prerequisite for conducting spatial econometric analysis. Therefore, this study calculates the Moran’s I index to test the spatial autocorrelation between population aging and economic growth in the Yangtze River Delta. The Moran’s I index was proposed by British statistician Patrick Moran in 1950. The index has a range of [−1, 1]. A positive index indicates a positive correlation, meaning regions with similar attributes tend to cluster together; a negative index indicates a negative correlation, where regions with different attributes tend to cluster together; an index of 0 suggests no spatial autocorrelation.
This study constructs geographical inverse distance and economic distance spatial weight matrices based on latitude and longitude and per capita GDP, respectively, to test whether there is spatial autocorrelation between population aging and economic growth in the Yangtze River Delta. The Moran’s index calculation results for the aging level are shown in Table 11. The results show that, except for the economic growth in 2000 under the geographical distance matrix, which did not pass the significance test, the global Moran’s index of economic growth and population aging in all years passed the 1% significance test for both the geographical inverse distance and economic distance spatial weight matrices. Moreover, the Moran’s indices were positive, indicating a significant positive spatial correlation between economic growth and population aging in the period from 2000 to 2020. The increase in economic growth and population aging in a region has a significant positive spatial spillover effect on neighboring regions. Additionally, the Moran’s index under the economic distance matrix is significantly higher than that under the geographical distance matrix, which indicates that the spatial autocorrelation between economic growth and population aging in the Yangtze River Delta is primarily driven by economic connections, rather than pure geographical proximity [38].

6.2. Geographically Weighted Regression Model

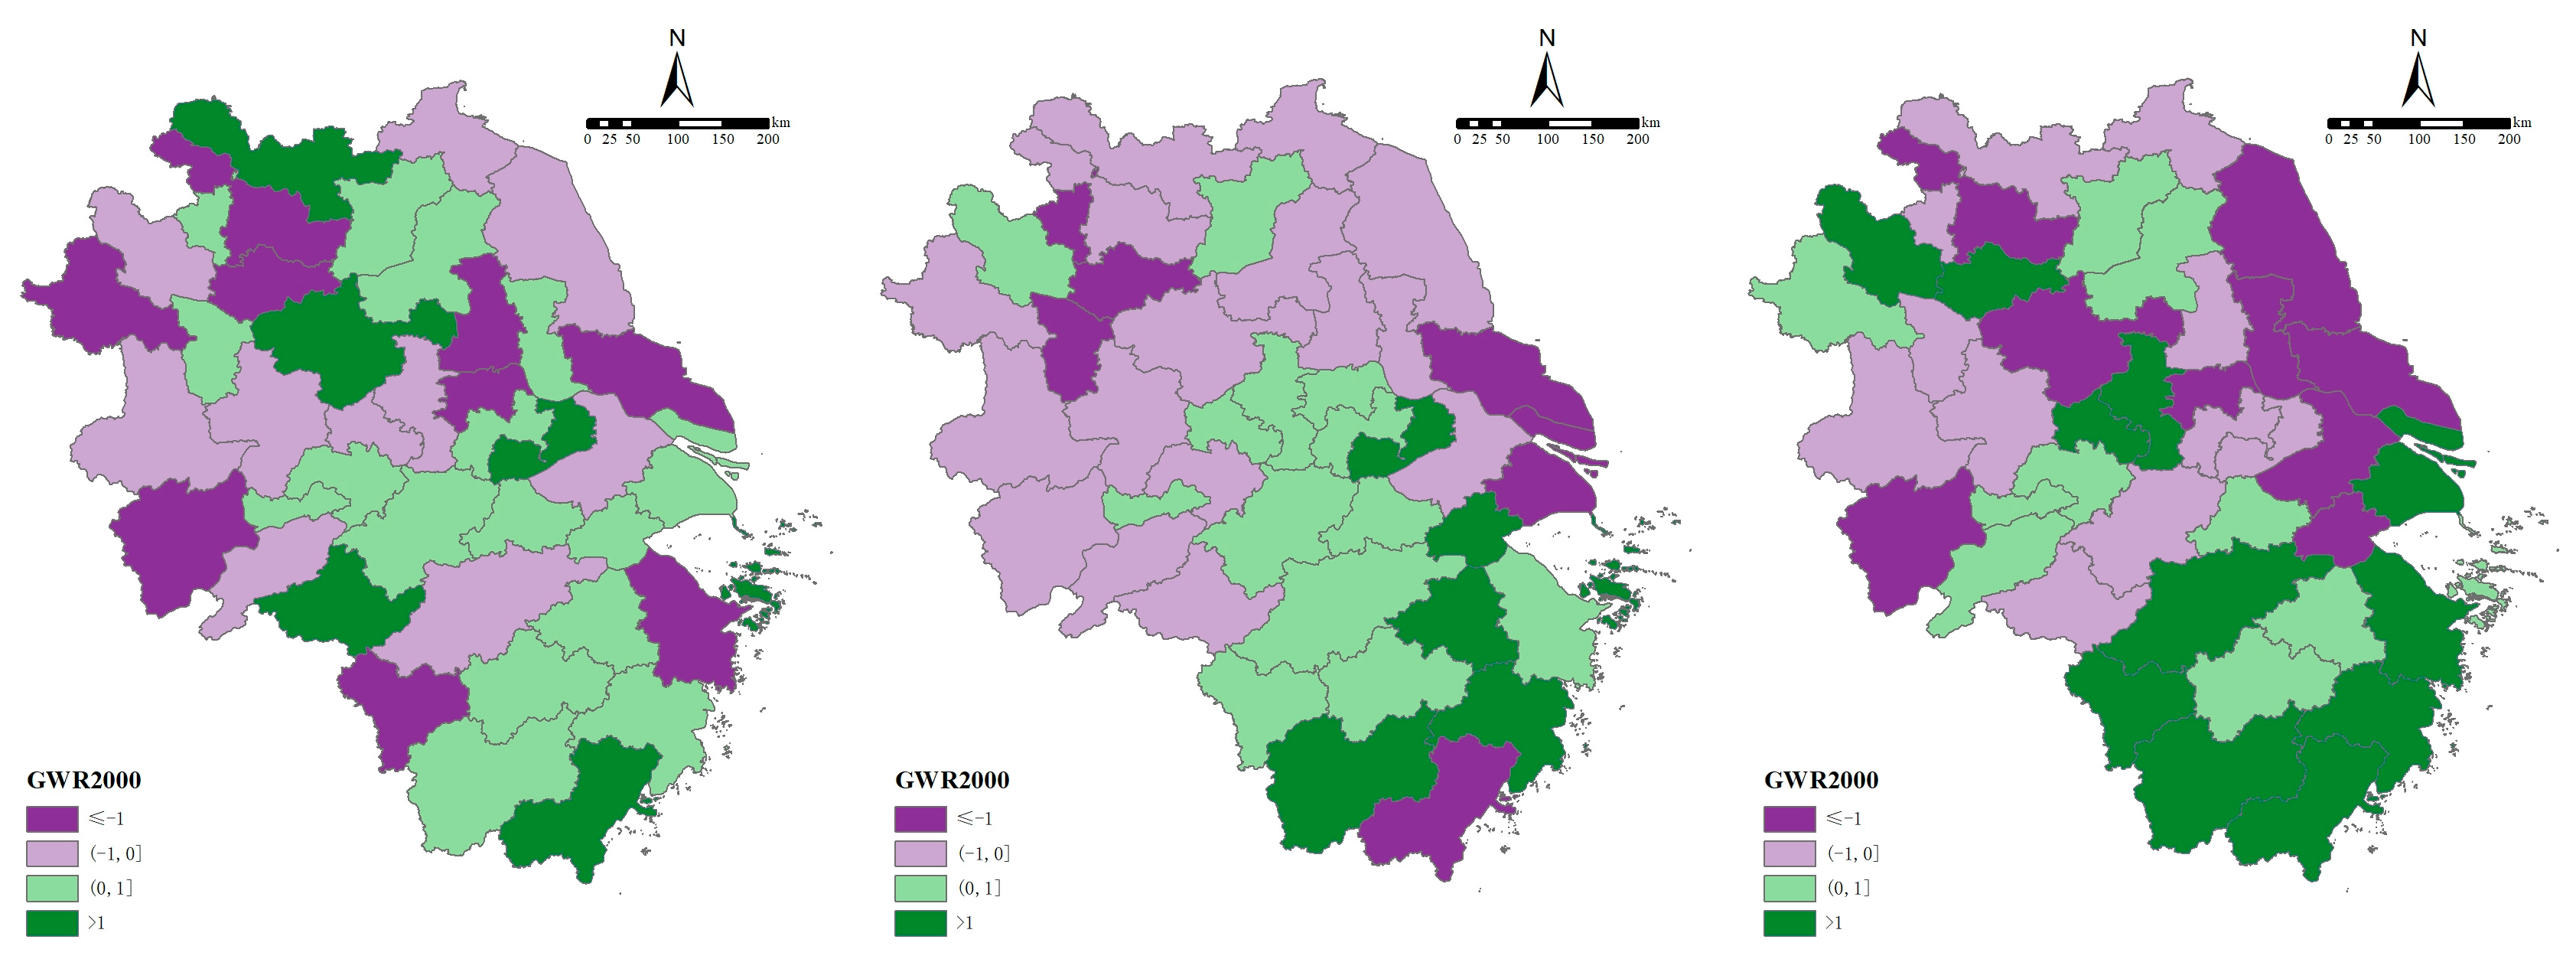
As previously confirmed, there is significant spatial autocorrelation between economic growth and population aging in the Yangtze River Delta. To further capture the spatial heterogeneity of the impact of population aging on economic growth across different prefecture-level cities in the region, this section introduces the geographically weighted regression (GWR) model for analysis. The GWR model, as a local regression method that considers spatial non-stationarity, allows regression coefficients to dynamically adjust with spatial location, enabling a detailed depiction of the spatial differences in the relationship between explanatory and dependent variables. Compared to traditional global regression models, it is more suitable for analyzing economic phenomena with spatial heterogeneity.
Table 12 and Figure 10 present the results of the geographically weighted regression of the impact of population aging on economic growth in the Yangtze River Delta from 2000 to 2020. It can be observed that the adjusted R2 values in 2000, 2010, and 2020 are 0.3656, 0.8797, and 0.9345, respectively, and that the AIC statistic remains at a relatively low level, which indicate that the model’s fit to spatial heterogeneity improves over time, with its explanatory power gradually increasing, and makes it suitable for GWR analysis. This study divides the regression coefficients into four intervals: coefficients less than or equal to −1 are defined as significantly inhibitive; [−1, 0] as mildly inhibitive; [0, 1] as mildly promotive; and greater than 1 as significantly promotive. As a result, these coefficients reveal the spatial differentiation of impact intensity.
From the spatial distribution pattern, it can be seen that the impact of population aging on economic growth exhibits significant differentiation, with an overall pattern of “positive in the south, negative in the north.” Most prefecture-level cities in Anhui and Jiangsu have shown inhibitive effects over the years, particularly in 2020, where significant inhibitive areas emerged in central and northern Jiangsu. This is closely related to the region’s industrial structure, which is dominated by traditional manufacturing—population aging leads to a decrease in the labor force, and the lagging industrial transformation makes it difficult for businesses to offset rising labor costs through technological progress, thus exerting a negative impact on economic growth. In contrast, most cities in Zhejiang have shown a promotive effect over the years, which peaked in 2020. This is attributed to Zhejiang’s active private economy and developed digital economy, where aging has forced enterprises to accelerate their intelligent transformation and invest in human capital, while also creating new economic growth points such as the elderly care services and health industries. Shanghai’s impact effect shows a transition over time of “promotion-inhibition-significant promotion”, which warrants further reflection: In 2000, as the core city of the Yangtze River Delta, Shanghai’s high human capital and industrial agglomeration offset the negative effects of aging through technological advantages, which resulted in mild promotion. By 2010, as the aging process accelerated, rising labor costs and the outflow of some traditional industries combined, leading to significant short-term suppression of economic growth. However, by 2020, through the transition to high-end services and technological innovation industries, Shanghai leveraged the advantages of elderly human resources and a mature social security system, transforming aging pressures into a driving force for human capital optimization and industrial upgrading, which ultimately resulted in a significant promotion effect.
It can be seen that, in economically underdeveloped regions that rely on the quantity of labor, aging tends to create an inhibitive effect due to “getting old before getting rich” and lagging industrial transformation. In contrast, economically developed and innovation-driven regions can transform aging into a structural driving force for economic growth through technological progress, industrial upgrading, and tapping into elderly human resources. The results of the geographically weighted regression not only confirm the significant spatial heterogeneity of the impact of population aging on economic growth within the Yangtze River Delta but also provide key insights for formulating differentiated regional coordination policies.

6.3. Spatial Durbin Model

The previous research has shown that the relationship between population aging and economic growth in the Yangtze River Delta region exhibits significant spatial autocorrelation. In this context, traditional econometric models, which assume the independence of observations, are no longer suitable because they fail to capture spatial spillover effects and spatial heterogeneity. Therefore, this paper introduces spatial econometric models. The test of spatial autocorrelation in the previous section indicates that the model based on the economic distance weight matrix has stronger explanatory power. Thus, the spatial econometric analysis in this section is conducted based on the economic distance spatial weight matrix.
To select an appropriate spatial econometric model, model suitability tests are conducted. First, an LM test is performed on the regression results. The test results show that both LM-error and LM-lag pass the significance test. Then, by observing the robust LM test, it can be seen that robust LM-error is not significant, while robust LM-lag is significant at the 10% level. This suggests that the spatial Durbin model may be suitable for this study. Further, an LR test is performed on the regression results. The LR-lag and LR-error pass the 1% significance test, which indicates that the spatial Durbin model is superior to both the spatial lag model and the spatial error model. Lastly, in the Wald test, the Wald-lag and Wald-error also pass the 1% significance test, which proves that the spatial Durbin model cannot be simplified into either the spatial error model or the spatial lag model.
Considering that this study analyzes specific urban characteristics, the fixed-effects model is more appropriate. The test results also confirm that the two-way fixed-effects model is superior to the one-way fixed-effects model, as it can reduce potential estimation bias caused by regional differences and time factors. Therefore, this paper adopts the two-way fixed-effects spatial Durbin model for estimation (see Table 13 for results).
In Table 14, model (1) and model (2) report the main effects and spatial lag effects of the spatial Durbin model, respectively. It can be seen that, after incorporating spatial factors, the impact of population aging on economic growth has changed. The main effect passes the 1% significance level test, but the coefficient is −1.990, indicating that local population aging has a suppressive effect on local economic growth, which contrasts with the baseline regression results. The core reason for this lies in the fact that the spatial Durbin model captures the complex relationship between interregional factor flows and competition. Local population aging may lead to a reduction in labor supply and an increased social security burden, forcing traditional labor-intensive industries to relocate, while high-end talent may also cluster in neighboring regions due to rising living costs caused by aging. This, in turn, has a direct suppressive effect on local economic growth. The spatial lag effect also passes the 1% significance level test, with a coefficient of 2.001, indicating that the aging population in neighboring regions can promote local economic growth through the spatial spillover mechanism. This could be due to two factors: first, aging in neighboring regions drives their industrial structure to upgrade towards technology-intensive sectors, which brings along technological spillovers and high-end service industry radiation and which can enhance local productivity; second, the expansion of the demand for elderly care and medical services in neighboring regions can stimulate local related industries through regional trade networks, thereby promoting economic growth.
According to the research by Le Sage and Pace [39,40], the regression coefficients in Table 14 do not accurately measure the spatial spillover effects between variables. Therefore, this paper further uses partial differential decomposition to break down the impact of population aging on economic growth into direct, indirect, and total effects. Models (3), (4), and (5) in Table 14 show the direct, indirect, and total effects of population aging on economic growth in the Yangtze River Delta. The results show that, although the direct effect is positive, it is not significant, reflecting that, after controlling for spatial interactions, the direct impact of local aging may be diluted through internal urban adjustments. On the other hand, the indirect effect passes the 1% significance level test, with a coefficient of 1.025, indicating that the positive spillover effect of aging in neighboring regions on local economic growth is significant. This is highly consistent with the close economic ties and factor flows in the Yangtze River Delta region. For example, aging cities in Jiangsu, Zhejiang, and other places experience a division between their labor networks and those of surrounding small- and medium-sized cities, which drives the economic growth of the latter. The total effect is also significant at the 1% level, with a coefficient of 1.071, indicating that, although local aging may have some suppressive effects on the local economy, the positive spatial interactive effects such as technological spillovers, industrial collaboration, and consumption demand in regional areas ultimately lead to an overall promotion of economic growth in the Yangtze River Delta. This result is consistent with the baseline regression and not only reveals the complex mechanisms of aging’s impact from a spatial perspective but also confirms that, under the background of regional integration in the Yangtze River Delta, the aging process in neighboring areas can be transformed into new drivers of local economic growth through spatial interaction mechanisms. This provides a more multidimensional perspective for understanding the impact of population aging on regional economies.

7. Further Analysis

To further explore the transmission mechanisms through which population aging affects economic growth, this study draws upon the methods used by Baron, Wen Zhonglin, and Jiang Ting. To avoid the endogeneity issues associated with the traditional “three-step method,” a “two-step method” is employed for mediation effect analysis. This method is supported by rigorous testing as well as theoretical evidence and evidence from the literature to ensure the robustness of the mediation effect [41,42,43]. In this section, labor productivity and living conditions are introduced as two mediating variables for analysis.
First, we examine the mediation effect of labor productivity. In model (1) of Table 15, the estimated result for the impact of aging on labor productivity shows a coefficient of 0.716, which is significant at the 1% level. Model (2) presents the estimated result for the impact of labor productivity on economic growth, with a coefficient of 0.222, which is also significant at the 1% level. This preliminarily suggests that labor productivity plays a mediating role in the mechanism through which population aging affects economic growth. The Sobel test shows that the indirect effect of labor productivity as a mediating variable is 0.159 and passes the significance test at the 1% level. The results of the bootstrap test are consistent, with the 95% confidence interval not including 0. This indicates that labor productivity plays a “partial mediation” role, and a simple calculation shows that the proportion of the mediation effect is 34.12% (Table 16). Population aging first promotes technological innovation and leverages the experience advantages of elderly labor, which increases labor productivity and indirectly contributes to economic growth.
Next, we examine the mediating effect of living conditions. Model (3) in Table 15 represents the estimated result of the effect of aging on living conditions, with a coefficient of 1.187, which is significant at the 1% level. Model (4) represents the estimated result of the effect of living conditions on economic growth, with a coefficient of 0.149, which is also significant at the 1% level. This preliminarily suggests that living conditions play a mediating role in the mechanism through which population aging affects economic growth. The Sobel test shows that the indirect effect coefficient of the mediating variable, living conditions, is 0.177 and passes the 1% significance test. The bootstrap test yields the same result, with its 95% confidence interval not including 0, indicating that living conditions play a “partial mediation” role, accounting for 47.45% of the mediating effect (Table 16). This result reflects that population aging drives regions to increase their investments in housing quality upgrades, elderly care facilities, and other improvements to living environments. After the formation of a high-quality living environment, economic growth is driven through attracting high-end talent, promoting the development of related industries, and increasing consumer demand.
In conclusion, labor productivity and living conditions, as mediating variables, reveal the specific paths through which population aging promotes economic growth from the perspectives of labor efficiency improvement and regional environment optimization (Figure 11). The former reflects improvements in supply-side factor quality, while the latter reflects demand-side infrastructure upgrades. Together, they contribute to a positive parallel mediating effect (“Parallel mediation effect” is a specific form of mediation analysis, referring to the situation where multiple mediator variables independently mediate the relationship between the independent variable (X) and the dependent variable (Y) simultaneously, with no direct causal relationships between these mediator variables (i.e., they are parallel and do not affect each other), each individually transmitting the effect of the independent variable on the dependent variable.), with the total mediation effect being c-c′ = a1b1 + a2b2 = 0.3359 and thus forming the core mechanism of aging and economic growth in the Yangtze River Delta and providing a dual-track optimization path for policy design.

8. Conclusions and Implications

8.1. Conclusions

This study uses the Solow model, GIS spatial analysis, and empirical models to explore the mechanism of impact of population aging on economic growth in the Yangtze River Delta urban agglomeration, which leads to the following conclusions.
First, there is a significant asynchrony between economic growth and population aging in the Yangtze River Delta. The region’s economy is large, with a high per capita level and an optimized structure, and transitioning from rapid growth to high-quality development. However, the aging population is large, with a deepening degree of aging and an accelerating growth trend. Some areas face pressures of “rich but aging” and “aging before becoming rich.”
Second, population aging in the Yangtze River Delta has a significant promoting effect on economic growth and exhibits a threshold effect. The impact of population aging on economic growth presents a “strong to weak to strong” pattern, with the first aging rate threshold being 11.63% and the second being 17.53%. From a provincial perspective, population aging in the Jiangsu and Zhejiang provinces has a significant positive impact on economic growth, while in Anhui, this effect is not significant.
Third, there is significant spatial autocorrelation between population aging and economic growth in the Yangtze River Delta, with differences in the effects of aging on economic growth across cities. The overall spatial distribution shows a “positive in the south and negative in the north” pattern. Neighboring areas with deeper aging will promote local economic growth.
Fourth, population aging in the Yangtze River Delta affects economic growth through two mediating variables: labor productivity and living conditions. Both play a significant “partial mediation” role, accounting for 34.12% and 47.45% of the total economic growth, respectively. Together, they exert a positive parallel mediation effect, with a parallel mediation effect value of 0.3359.

8.2. Implications

Based on the above research conclusions, the following implications and strategies are proposed.
First, strengthen regionally differentiated policies to address the asynchronous challenges of aging. Given the coexistence of “rich but aging” and “aging before becoming rich” and the asynchronous nature of economic growth and aging in the Yangtze River Delta, precise regional policies should be implemented. Economically developed cities should focus on high-quality development and the transformation of aging resources to accelerate industrial upgrading and the cultivation of the silver economy. In contrast, less developed areas should promote both industrial leapfrogging and the enhancement of the pension security system to bridge the “aging before becoming rich” gap by undertaking industrial transfers and improving the accessibility of public services and to ensure coordinated development across the region. This differentiated path is equally applicable to similar regions globally: developed economies can focus on technological substitution, while developing regions need to guard against the risks of labor force shrinkage.
Second, deepen the promotion of the experiences of Jiangsu and Zhejiang and activate growth drivers in Anhui. Given the significant positive impact of aging on economic growth in Jiangsu and Zhejiang, effective paths for industrial adaptation, human capital optimization, and the absorption of elderly dividends through technological innovation should be systematically distilled to create replicable models. For regions like Anhui, where the effect is not significant, attempts to elicit breakthroughs in industrial structural bottlenecks should focus on cultivating high-value-added industries, improving talent return policies, and enhancing vocational training to improve labor quality and productivity in or order to transform aging pressure into human capital.
Third, establish a cross-domain collaborative mechanism to release positive spatial spillover effects. Leveraging the spatial autocorrelation of aging and economic growth and the “positive in the south and negative in the north” pattern, administrative barriers should be broken, and the cross-regional optimization of factors should be promoted. A shared platform for elderly care resources and the labor market should be established to encourage technology and capital from aging areas to radiate to surrounding regions in order to support northern cities in undertaking elderly care industry support and extending the industrial chain. Through innovations such as social security interoperability and medical insurance settlement across regions, reasonable migration and consumption potential of the elderly population should be promoted, which would strengthen the collaborative network of “aging to promote growth” in neighboring areas.
Fourth, precisely target the dual core levers of labor productivity and living conditions. Focused interventions should be implemented on these two key mediating channels. Regarding labor productivity, “age-friendly” technological innovations should be promoted, flexible retirement and elderly skill upgrading programs should be implemented, and the value of elderly experience should be developed. Regarding living conditions, the construction of age-friendly communities and integrated health and wellness complexes should be accelerated, the smart health and elderly care industry should be developed, and the professional level of elderly care services should be improved. Simultaneously, efforts should be made to facilitate the synergy between these two factors, such as attracting aging technical talent to high-quality residential communities in industrial parks, optimizing the “living-production” environment linkage, and maximizing the parallel mediation effect. In land-scarce areas (such as Singapore), residential environment optimization should focus on vertical aging-friendly transformation, whereas, in areas with abundant land, both spatial expansion and functional upgrades can be considered to achieve dual-path optimization.

Author Contributions

Conceptualization, C.L. and X.L.; methodology, C.L. and X.L.; software, X.L.; validation, C.L. and X.L.; formal analysis, X.L.; investigation, X.L.; resources, C.L. and X.L.; data curation, X.L.; writing—original draft preparation, X.L.; writing—review and editing, C.L. and X.L.; visualization, X.L.; supervision, C.L.; project administration, C.L.; funding acquisition, C.L. All authors have read and agreed to the published version of the manuscript.

Funding

Shanghai Philosophy and Social Science Planning General Project (2023ZSH002)—“Research on the Mechanism of Population Aging in the Yangtze River Delta Urban Agglomeration on Economic Growth”.

Data Availability Statement

The data of this study are derived from the census data of the National Bureau of Statistics of China, which are publicly available. The website is https://www.stats.gov.cn/sj/pcsj/ (accessed on 2 June 2025).

Conflicts of Interest

The authors declare no conflicts of interest. The funders had no role in the design of the study; in the collection, analyses, or interpretation of data; in the writing of the manuscript; or in the decision to publish the results.

References

  1. Wang, W. Population Aging, Fertility Policy Adjustment, and China’s Economic Growth. China Econ. Q. 2017, 16, 67–96. [Google Scholar]
  2. Mu, H.Z.; Han, Z.B. Economic Growth Expectations and Realization Path in China During the Period of Rapid Growth of the Elderly Population. Popul. Econ. 2021, 6, 1–21. [Google Scholar]
  3. Liu, G.B.; Du, Y.H. Research on the Impact of Population Aging on County-level Economy. J. Popul. Stud. 2015, 37, 77–86. [Google Scholar]
  4. Lindh, T.; Malmberg, B. Age structure effects and growth in the OECD 1950–1990. J. Popul. Econ. 1999, 12, 431–449. [Google Scholar] [CrossRef]
  5. Faruqee, H.; Mühleisen, M. Population aging in Japan: Demographic shock and fiscal sustainability. Jpn. World Econ. 2003, 15, 185–210. [Google Scholar] [CrossRef]
  6. Qi, C.J. Analysis of the Impact of Population Aging on Economic Growth. China Popul. Sci. 2010, 54–65. [Google Scholar]
  7. Bloom, D.E.; Canning, D.; Fink, G. Implications of population ageing for economic growth. Oxf. Rev. Econ. Policy 2010, 26, 583–612. [Google Scholar] [CrossRef]
  8. Zheng, W.; Lin, S.J.; Chen, K. The Characteristics and Trends of Population Aging in China and Its Potential Impact on Economic Growth. Quant. Econ. Tech. Econ. Res. 2014, 31, 3–20+38. [Google Scholar]
  9. Hu, A.; Liu, S.L.; Ma, Z.G. Population Aging, Population Growth, and Economic Growth: Empirical Evidence from China’s Provincial Panel Data. Popul. Res. 2012, 36, 14–26. [Google Scholar]
  10. Du, Y.; Feng, Y.G. The Impact of Rapid Population Aging on Economic Growth. Econ. Res. 2021, 56, 71–88. [Google Scholar]
  11. Fougère, M.; Mérette, M. Population ageing and economic growth in seven OECD countries. Econ. Model. 1999, 16, 411–427. [Google Scholar] [CrossRef]
  12. Prettner, K. Population aging and endogenous economic growth. J. Popul. Econ. 2013, 26, 811–834. [Google Scholar] [CrossRef]
  13. Wu, C.; Cao, Y.; Xu, H. How Population Aging Drives Labor Productivity: Evidence from China. Sustainability 2025, 17, 5046. [Google Scholar] [CrossRef]
  14. Cai, F. Population Transition, Demographic Dividend, and Economic Growth Sustainability: A Discussion on How Full Employment Can Promote Economic Growth. Popul. Res. 2004, 28, 2. [Google Scholar]
  15. Wang, W.; Liu, Y.F.; Peng, D. Research on the Industrial Structure Upgrading Effect of Population Aging. China Ind. Econ. 2015, 11, 47–61. [Google Scholar]
  16. Yu, X.J. The Impact of Population Aging on Economic Development: Is It Positive or Negative? Popul. Res. 1995, 19, 1–6. [Google Scholar]
  17. Liu, Q.Z.; He, Q. Population Aging, Economic Growth, and Fiscal Policy. Econ. Q. 2013, 12, 119–134. [Google Scholar]
  18. Li, J. The Economic Balanced Growth Path under Population Aging Conditions. Quant. Econ. Tech. Econ. Res. 2006, 8, 11–21. [Google Scholar]
  19. Liu, W.; Zhang, Q. The “Inverse U” Effect of Population Aging on Human Capital Investment: Theoretical Mechanisms and a Comparison of China, Japan, and South Korea. China Population, Resour. Environ. 2017, 27, 39–51. [Google Scholar] [CrossRef]
  20. Qi, H.Q.; Yan, H.C. Has Population Aging Suppressed China’s Economic Growth? Econ. Rev. 2018, 6, 28–40. [Google Scholar]
  21. Wang, Y. Spatial Econometric Analysis of the Impact of China’s Population Aging on Economic Growth. Soc. Sci. Res. 2015, 5, 73–78. [Google Scholar]
  22. Gu, H.M.; Guo, C.; Zhang, W.D. The Impact of Population Aging on High-Quality Economic Development: Empirical Evidence from China’s Urban Panel Data. Macroecon. Res. 2023, 6, 101–112. [Google Scholar]
  23. He, D.M.; Liu, P. Population Aging, Manufacturing Transformation and Upgrading, and High-Quality Economic Development: Based on the Mediating Effect Model. Econ. Manag. Res. 2020, 41, 3–20. [Google Scholar]
  24. Fu, J.H.; Cao, X.C. The Impact of Population Aging on High-Quality Economic Development in China. Explor. Econ. Issues 2021, 6, 44–55. [Google Scholar]
  25. Jiang, X.Q.; Du, P. Analysis of the Impact of Population Aging on China’s Sustainable Economic Development. Mark. Popul. Anal. 2000, 2, 1–8. [Google Scholar]
  26. Peng, X.Z.; Hu, Z. Population Aging from the Perspective of Public Policy. Chin. Soc. Sci. 2011, 3, 121–138+222–223. [Google Scholar]
  27. Li, J.B.; Yuan, X. How to Revitalize the Demographic Dividend Again: From Labor Force Participation Rate to Labor Productivity—The Realization Path of the Demographic Dividend Transformation. Explor. Discuss. 2020, 2, 131–139+160. [Google Scholar]
  28. Maestas, N.; Mullen, K.J.; Powell, D. The effect of population aging on economic growth, the labor force, and productivity. Am. Econ. J. Macroecon. 2023, 15, 306–332. [Google Scholar] [CrossRef]
  29. Liu, Y.; Chen, L.; Lv, L.; Failler, P. The impact of population aging on economic growth: A case study on China. Aims Math. 2023, 8, 10468–10485. [Google Scholar] [CrossRef]
  30. Jones, C.I. The end of economic growth? Unintended consequences of a declining population. Am. Econ. Rev. 2022, 112, 3489–3527. [Google Scholar] [CrossRef]
  31. Chen, Y.B.; Lin, C.; Chen, X.L. Artificial Intelligence, Aging, and Economic Growth. Econ. Res. 2019, 54, 47–63. [Google Scholar]
  32. Solow, R.M. Technical Change and the Aggregate Production Function. Rev. Econ. Stat. 1957, 39, 312–320. [Google Scholar] [CrossRef]
  33. Li, C.; Liu, Z.P.; Li, X.; Huang, Y. Construction and Application of a Composite Indicator System for Measuring Population Aging. Stat. Decis. 2023, 39, 59–64. [Google Scholar]
  34. Wu, C.P. Social Gerontology; China Renmin University Press: Beijing, China, 1999. [Google Scholar]
  35. Saaty, T.L. The analytic hierarchy process (AHP). J. Oper. Res. Soc. 1980, 41, 1073–1076. [Google Scholar]
  36. Shannon, C.E. A mathematical theory of communication. Bell Syst. Tech. J. 1948, 27, 379–423. [Google Scholar] [CrossRef]
  37. Wooldridge, J.M. Econometric Analysis of Cross Section and Panel Data; MIT Press: Cambridge, MA, USA, 2010. [Google Scholar]
  38. Fujita, M.; Krugman, P.R.; Venables, A. The Spatial Economy: Cities, Regions, and International Trade; MIT Press: Cambridge, MA, USA, 2001; pp. 120–130. [Google Scholar]
  39. Le Sage, J.; Pace, R.K. Introduction to spatial econometrics. J. Reg. Sci. 2010, 5, 1014–1015. [Google Scholar] [CrossRef]
  40. Shao, S.; Fan, M.T.; Yang, L. Economic Structure Adjustment, Green Technological Progress, and China’s Low-Carbon Transition Development: An Empirical Investigation Based on the Overall Technological Frontier and Spatial Spillover Effects. Manag. World 2022, 38, 46–69+4–10. [Google Scholar]
  41. Baron, R.M.; Kenny, D.A. The moderator–mediator variable distinction in social psychological research: Conceptual, strategic, and statistical considerations. J. Personal. Soc. Psychol. 1986, 51, 1173. [Google Scholar] [CrossRef] [PubMed]
  42. Wen, Z.L.; Ye, B.J. Mediation Effect Analysis: Progress in Methods and Models. Adv. Psychol. Sci. 2014, 5, 731–745. [Google Scholar] [CrossRef]
  43. Jiang, T. Mediation Effect and Moderation Effect in Causal Inference Empirical Research. China Ind. Econ. 2022, 5, 100–120. [Google Scholar]
Figure 1. Total GDP of the Yangtze River Delta urban agglomeration from 2000 to 2020 (figure source: drawn by the author).
Rsee 02 00025 g001
Figure 2. Per capita GDP and disposable income of urban and rural residents in the Yangtze River Delta urban agglomeration from 2000 to 2020 (figure source: drawn by the author).
Rsee 02 00025 g002
Figure 3. Proportion of tertiary industry in the Yangtze River Delta urban agglomeration from 2000 to 2020 (figure source: drawn by the author).
Rsee 02 00025 g003
Figure 4. GDP growth rates of the Yangtze River Delta urban agglomeration from 2000 to 2020 (figure source: drawn by the author).
Rsee 02 00025 g004
Figure 5. Size of the population aged 60 and above in the Yangtze River Delta urban agglomeration (figure source: drawn by the author).
Rsee 02 00025 g005
Figure 6. Aging rate of the Yangtze River Delta urban agglomeration from 2000 to 2020 (figure source: drawn by the author).
Rsee 02 00025 g006
Figure 7. Speed of population aging in the Yangtze River Delta urban agglomeration from 2000 to 2020 (figure source: drawn by the author).
Rsee 02 00025 g007
Figure 8. LR test with the proportion of population aged 60 and above as the threshold variable (figure source: drawn by the author).
Rsee 02 00025 g008
Figure 9. LR test with the proportion of population aged 65 and above as the threshold variable (figure source: drawn by the author).
Rsee 02 00025 g009
Figure 10. Geographically weighted regression results of the Yangtze River Delta urban agglomeration (figure source: drawn by the author).
Rsee 02 00025 g010
Figure 11. Parallel mediation effect path (*** p < 0.01; figure source: drawn by the author).
Rsee 02 00025 g011
Table 1. Economic growth indicator system.
First-Level IndicatorsSecond-Level IndicatorsUnit of MeasurementAttribute
Economic ActivityGDP TotalCNY 100 millionPositive
Fiscal Revenue DensityCNY 100 million/km2Positive
Per Capita Retail Sales of Social Consumer GoodsCNY 10,000/personPositive
Economic SharingPer Capita GDPCNYPositive
Disposable Income of Urban and Rural ResidentsCNYPositive
Average Wage of EmployeesCNYPositive
Economic CoordinationProportion of Tertiary Industry%Positive
Urbanization Rate%Positive
Year-end Balance of Household DepositsCNYPositive
Economic SustainabilityGDP Growth Rate%Positive
Per Capita Industrial Sulfur Dioxide EmissionTon/10,000 peopleNegative
Green Space Coverage Rate%Positive
Table source: Compiled by the author.
Table 2. Population aging indicator system.
First-Level IndicatorsSecond-Level IndicatorsUnit of MeasurementIndicator Description
ScaleElderly Population Scale10,000 peoplePopulation aged 60 and above
Young-Elderly Scale10,000 peopleNumber of young elderly aged 60–69
Middle-Elderly Scale10,000 peopleNumber of middle elderly aged 70–79
Old-Elderly Scale10,000 peopleNumber of elderly aged 80 and above
Elderly Population Densitypersons/km2Population aged 60 and above per square kilometer
StructureAging Rate%Population aged 60 and above/total population
Elderly Dependency Ratio%Population aged 65 and above/population aged 15–64
Longevity Coefficient%Population aged 80 and above/population aged 60 and above
Proportion of Children in Total Population%Population aged 0–14/total population
Old-Age to Child Ratio%Population aged 60 and above/population aged 0–14
Child Dependency Ratio%Population aged 0–14/population aged 15–64
SpeedChange Rate of Aging Rate%Annual growth rate of the aging rate
Table source: compiled by the author.
Table 3. Descriptive statistics of variables.
TypeVarNameMeanSDMinMedianMax
Dependent VariablesGDP Total3010.314910.47654.891301.7338,701.00
Fiscal Revenue Density3.879.4400.011.2287.91
Per Capita Retail Sales of Social Consumer Goods1.801.6470.101.147.73
Per Capita GDP48,882.3342,105.4242594.0037,359.001.66 × 105
Disposable Income of Urban and Rural Residents20,154.5017,016.7752989.0013,815.0072,232.00
Average Wage of Employees47,992.3638,587.2615479.0036,593.681.75 × 105
Proportion of Tertiary Industry41.359.39623.3639.5273.15
Urbanization Rate53.0019.103.0056.0089.00
Year-end Balance of Household Deposits5.47 × 1071.51 × 1081.56 × 1051.31 × 1071.45 × 109
GDP Growth Rate7.597.294−39.809.9018.20
Per Capita Industrial Sulfur Dioxide Emission250.04498.8112.0958.072961.28
Green Space Coverage Rate92.56611.0749.0040.046814.00
Independent VariablesPopulation Aged 60 and Above8.41 × 1056.94 × 1051.28 × 1057.02 × 1055.82 × 106
Young-Elderly Population (60–69 years old)4.57 × 1053.87 × 10571,551.003.78 × 1053.41 × 106
Middle-Elderly Population (70–79 years old)2.71 × 1052.05 × 10544,053.002.22 × 1051.57 × 106
Old-Elderly Population (80 years old and above)1.13 × 1051.08 × 10510,440.0086,943.008.36 × 105
Elderly Population Density223.60443.52118.70113.273626.82
Aging Rate16.004.609.0015.0031.00
Elderly Dependency Ratio17.006.009.0014.0036.00
Longevity Coefficient13.002.706.0013.0019.00
Proportion of Children (0–14 years old) in Total Population17.004.608.0016.0028.00
Old-Age to Child Ratio79.0041.0025.0069.00232.00
Child Dependency Ratio24.007.7010.0022.0045.00
Aging Speed3.001.000.002.005.00
Control VariablesTotal Investment in Fixed Assets1.45×1071.64×10791,316.009.04×1067.25×107
Number of Patent Authorizations1548.933765.8320.00214.0029,340.00
Average Years of Education8.541.0636.598.6211.50
Number of Social Employees66.06101.3267.1034.81745.24
Gini Coefficient0.370.0710.140.390.51
Mediating VariablesLabor Productivity4.43 × 1053.23 × 1059469.124.37 × 1052.08 × 106
Living Conditions0.600.1970.090.630.95
Table source: compiled by the author.
Table 4. Benchmark regression results of single indicators.
(1)(2)(3)(4)
GDPPer Capita GDPResident Disposable IncomeGDP Growth Rate
Senior Population Size0.970 ***−1.737 ***−0.1510.752
(0.089)(0.322)(0.245)(0.514)
Senior Population Density0.319 ***1.766 ***0.599 **−0.841 *
(0.113)(0.400)(0.278)(0.477)
Aging Rate0.3358.337 ***6.761 ***−7.454 ***
(0.300)(1.251)(0.925)(2.077)
Elderly Dependency Ratio−0.159−3.492 ***−5.379 ***5.436 ***
(0.177)(0.857)(0.682)(1.476)
Longevity Coefficient0.614 ***−2.358 **−1.1060.088
(0.169)(0.992)(0.691)(0.756)
Proportion of Young-Old 0.034−0.690 **−0.664 **0.724 *
(0.061)(0.296)(0.252)(0.375)
Aging Speed−0.700 *−6.880 ***−1.7464.041 **
(0.406)(1.305)(1.216)(1.579)
Fixed-asset investment0.098 ***0.442 ***0.137 *−0.273 **
(0.020)(0.080)(0.071)(0.125)
Number of patent authorizations0.188 ***0.445 ***0.135 *−0.243 ***
(0.035)(0.146)(0.076)(0.076)
Number of social employees0.0060.2020.290 ***0.054
(0.049)(0.128)(0.056)(0.104)
Average education years0.089 **0.237−0.0980.140
(0.034)(0.174)(0.117)(0.128)
Gini coefficient−0.076 **−0.270 **−0.375 ***−0.552 ***
(0.036)(0.110)(0.091)(0.183)
idYesYesYesYes
yearYesYesYesYes
N123123123123
r20.9900.9680.9850.667
* p < 0.1, ** p < 0.05, *** p < 0.01; table source: compiled by the author.
Table 5. Results of the benchmark regression for composite indicators.
(1)(2)(3)(4)
Mixed OLSMixed OLSFEFE
aging1.021 ***0.373 ***0.738 **0.428 ***
(0.063)(0.075)(0.273)(0.134)
Investment 0.155 *** 0.092 ***
(0.038) (0.032)
gini −0.114 −0.111 **
(0.071) (0.054)
patent 0.219 *** 0.166 **
(0.056) (0.075)
employee −0.179 *** 0.070
(0.040) (0.044)
edu 0.223 *** 0.122 **
(0.039) (0.050)
_cons0.039 **0.122 ***0.0450.105 ***
(0.017)(0.028)(0.045)(0.031)
city YESYES
year YESYES
N123123123123
r2_a0.6850.8910.9190.973
F265.864167.973185.459473.398
** p < 0.05, *** p < 0.01; table source: compiled by the author.
Table 6. Instrumental variable regression results.
(1)(2)
Technical PersonnelAging 65+
aging0.917 ***0.236 **
(0.134)(0.116)
Control variableYESYES
cityYESYES
yearYESYES
LM statistic5.175 *24.019 ***
Wald F statistic22.39107.37
(19.93)(16.38)
Sargan--
N123123
r2_a0.9430.956
F273.43376.25
* p < 0.1, ** p < 0.05, *** p < 0.01; table source: compiled by the author.
Table 7. Robustness check.
(1)(2)(3)(4)
Disposable Income of ResidentsEcoEcoEco
aging0.630 *** 0.375 ***0.163 **
(0.175) (0.081)(0.072)
aging rate 0.595 **
(0.223)
Investment0.0920.112 ***0.145***0.075 *
(0.061)(0.038)(0.036)(0.041)
gini−0.801 ***−0.148 **−0.058−0.069
(0.092)(0.062)(0.067)(0.055)
patent0.1330.189 *0.336 ***0.211 **
(0.088)(0.096)(0.068)(0.094)
employee0.336 ***0.044−0.239 ***0.181 **
(0.089)(0.058)(0.044)(0.072)
edu0.1040.185 ***0.230 ***0.121 ***
(0.110)(0.063)(0.039)(0.041)
N123123123123
r2_a0.9700.970 0.979
F323.376440.733 582.841
sigma_u 0.020 ***
sigma_e 0.034 ***
* p < 0.1, ** p < 0.05, *** p < 0.01; table source: compiled by the author.
Table 8. Threshold effect test.
ModelThreshold Variable (Aging Rate 60+)Threshold Variable (Aging Rate 65+)
F-Valuep-ValueThreshold ValueF-Valuep-ValueThreshold Value
Single threshold42.29 ***0.00330.116349.37 ***0.00000.0812
Double thresholds22.40 **0.02670.175324.64 **0.02000.1262
Triple thresholds7.300.8300-28.590.1133-
** p < 0.05, *** p < 0.01; table source: compiled by the author.
Table 9. Panel threshold effect regression results.
(1)(2)
60+65+
Investment0.105 ***0.092 ***
(0.029)(0.026)
gini−0.071 *−0.069
(0.041)(0.044)
patent0.174 ***0.187 ***
(0.052)(0.040)
employee0.0360.022
(0.033)(0.030)
edu0.110 **0.101 **
(0.042)(0.039)
0._cat#c.aging0.442 ***0.408 ***
(0.132)(0.133)
1._cat#c.aging0.180 *0.147
(0.106)(0.101)
2._cat#c.aging0.282 ***0.295 ***
(0.102)(0.081)
_cons0.121 ***0.128 ***
(0.026)(0.027)
N123123
r2_a0.9830.984
F471.979556.753
* p < 0.1, ** p < 0.05, *** p < 0.01; table source: compiled by the author.
Table 10. Regional heterogeneity analysis.
(1)(2)(3)
Anhui ProvinceJiangsu ProvinceZhejiang Province
aging0.1940.513 **0.369 *
(0.115)(0.230)(0.170)
chowtest1.93 **
Control variableYESYESYES
cityYESYESYES
yearYESYESYES
N483933
r2_a0.9840.9700.984
F8729.506511.0612692.834
* p < 0.1, ** p < 0.05; table source: compiled by the author.
Table 11. Global Moran’s I Index.
Geographical DistanceEconomic Distance
Ecop-ValueAgingp-ValueMoran’s Ip-ValueMoran’s Ip-Value
20000.00570.15710.16050.0000 ***0.99370.0000 ***0.99810.0000 ***
20100.16210.0000 ***0.11230.0000 ***0.99770.0000 ***0.99730.0000 ***
20200.12720.0000 ***0.13440.0000 ***0.99850.0000 ***0.99720.0000 ***
*** p < 0.01; Table source: Compiled by the author.
Table 12. Geographically weighted regression test.
YearR2R2-AdjustedAICc
20000.46080.3653−175.24723
20100.90080.8797−198.43979
20200.94300.9345−170.29894
Table source: compiled by the author.
Table 13. Model suitability test.
Measurement MethodInspection StandardStatistic
LM testLM-error60.779 ***
LM-lag62.718 ***
Robust-LM-error1.783
Robust-LM-lag3.722 *
LR testLR-Lag77.80 ***
LR-Error78.97 ***
Wald testWald-Lag722.17 ***
Wald-Error42.36 ***
Fixed effects of SDMH0: ind nestedin both51.85 ***
H0: time nestedin both171.95 ***
* p < 0.1, *** p < 0.01; table source: compiled by the author.
Table 14. Spatial Durbin model regression results and effect decomposition.
(1)(2)(3)(4)(5)
VariablesMainWxLR_DirectLR_IndirectLR_Total
aging−1.990 ***2.001 ***0.0451.025 ***1.071 ***
(−5.47)(5.48)(0.57)(6.42)(6.54)
investment−0.478 ***0.481 ***0.0080.246 ***0.253 ***
(−4.55)(4.56)(0.32)(5.84)(5.77)
gini0.382 *−0.382 *0.090 **−0.137 *−0.047
(1.95)(−1.95)(1.99)(−1.65)(−0.59)
patent0.489 **−0.488 **0.223 ***−0.1280.096
(2.03)(−2.02)(3.89)(−1.31)(1.64)
employee−0.1500.1510.0190.0700.089
(−0.61)(0.62)(0.33)(0.69)(1.21)
edu0.351 ***−0.350 ***0.138 ***−0.112 **0.027
(5.64)(−5.60)(3.32)(−2.19)(0.33)
rho0.989 ***
(428.81)
cityYESYESYESYESYES
yearYESYESYESYESYES
Observations123123123123123
R-squared0.9060.9060.9060.9060.906
Number of id4141414141
* p < 0.1, ** p < 0.05, *** p < 0.01; table source: compiled by the author.
Table 15. Mediating effect regression results.
(1)(2)(3)(4)
VariablesProductivityEcoHousingEco
productivity 0.222 *** 0.149 ***
(0.036) (0.032)
aging0.716 ***0.308 ***1.187 ***0.196 **
(0.170)(0.071)(0.203)(0.079)
Control variableYESYESYESYES
cityYESYESYESYES
yearYESYESYESYES
Observations123123123123
R-squared0.6410.9100.6660.908
F37.35176.7941.46173.61
** p < 0.05, *** p < 0.01; table source: compiled by the author.
Table 16. Mediating effect Sobel test and bootstrap test.
Sobel TestEstimated CoefficientStandard Errorp95% Confidence IntervalProportion of Mediating Effect
productivityIndirect effect0.1590.0460.001-34.12%
direct effect0.3080.0710.000--
housingIndirect effect0.1770.0480.000-47.45%
direct effect0.1960.0790.013--
Bootstrap TestEstimated CoefficientStandard Errorp95% Confidence IntervalProportion of Mediating Effect
productivityIndirect effect0.1590.0710.024[0.0204,0.2969]34.12%
direct effect0.3080.0880.000[0.1360,0.4791]-
housingIndirect effect0.1770.0570.002[0.0646,0.2899]47.45%
direct effect0.1960.0990.047[0.0027,0.3894]-
Table source: compiled by the author.
Disclaimer/Publisher’s Note: The statements, opinions and data contained in all publications are solely those of the individual author(s) and contributor(s) and not of MDPI and/or the editor(s). MDPI and/or the editor(s) disclaim responsibility for any injury to people or property resulting from any ideas, methods, instructions or products referred to in the content.