Abstract
(1) Background: Alterations in brain functional connectivity (FC) precede clinical symptoms of Alzheimer’s disease (AD) by decades, presenting opportunities for early diagnosis. However, conventional FC analyses measure correlations between brain regions and do not provide insights into directional, causal interactions. Causal functional connectivity (CFC), which infers directed interactions between regions, addresses this limitation. This study aims to identify disrupted CFC networks in AD compared to cognitively normal (CN) individuals. (2) Methods: The recently developed Time-aware PC (TPC) algorithm was employed to infer directed CFC from functional magnetic resonance imaging (fMRI) data. These results were compared with traditional correlation-based FC obtained via sparse partial correlation. Network-based Statistics (NBS) for directed networks was used to identify altered CFC sub-networks, with corrections for multiple comparisons applied at the 5% significance level. (3) Results: Key causal networks, including the inferior frontal gyrus, superior temporal gyrus, middle temporal gyrus, and cerebellum, showed significantly reduced strength in AD compared to CN (p = 0.0299; NBS corrected). Instead of detecting disruptions at the level of individual edges, this study identifies network-level alterations, revealing systemic disruptions in brain connectivity. (4) Conclusions: This study demonstrates the utility of CFC analysis in uncovering network-level disruptions in AD. The identified disrupted networks align with published medical literature and provide a framework for future studies with larger datasets.
1. Introduction
Alzheimer’s disease (AD), a major cause of dementia globally, is marked by a gradual deterioration in cognitive abilities, including impairments with working memory, episodic memory, and attention/executive function [1,2]. Such cognitive function deficits in AD are believed to be due to abnormality in functional connectivity between different regions of the brain and neurodegeneration [3,4,5]. Evidence from many anatomical and functional studies suggest that AD is a “disconnection syndrome” [6,7,8]. For example, anatomically, AD is known to be characterized by progressive diffuse cortical atrophy, primarily located in the mesial-temporal regions [9,10]. At the same time, studies of functional connectivity (FC), which measures the degree of temporal synchrony between the activity of different brain regions, have found evidence of disrupted functional connectivity between brain regions [11,12,13].
Functional connectivity (FC) studies have extensively shown disruptions in key networks, such as the default mode network (DMN), salience network, and executive control network in AD [14,15,16]. These disruptions are associated with cognitive decline, including memory deficits and executive dysfunction, which are hallmarks of AD. However, conventional FC analyses focus on statistical correlations between regions, which provide valuable insights into synchrony but fail to capture the directionality of interactions or the flow of information between brain regions [17,18]. This limitation hinders understanding the mechanisms driving network-level disruptions in AD.
Several FC analyses measure the degree of statistical association between signals from different brain regions, in other words, associative FC (AFC) [19,20,21]. However, AFC is inherently limited because it does not account for the directionality and causality of information flow between regions [18,22]. In contrast, causal functional connectivity (CFC) extends beyond associations and addresses these gaps by capturing the direction and strength of causal interactions between brain regions. CFC can answer questions such as: Which brain regions act as drivers or receivers of disrupted network activity in AD? How do disruptions in one region influence downstream effects on others? These insights are critical to advancing our understanding of AD as a “disconnection syndrome”.
CFC represents the functional connectivity between brain regions using a directed graph [18,23]. The nodes of this graph represent brain regions, directed edges between the nodes represent causal relationships between the brain regions, and the weights of these edges measure the strength of these causal connections. Yet, there are very few studies that explore causality in functional connectivity [17]. In this paper, we aim to obtain CFC sub-networks that exhibit significant alteration in AD.
Functional magnetic resonance imaging (fMRI) is a widespread technique to record activity of different brain regions [24,25,26]. It measures the Blood Oxygen Level Dependent (BOLD) signal from different brain regions. Studies in functional connectivity have popularly used fMRI data to obtain functional connectivity [27,28,29]. While previous studies, such as Biswas and Sripada [13], performed edge-wise comparisons of CFC in AD, these methods lack the ability to evaluate network-level changes comprehensively. In contrast, this study uses network-based statistics (NBS) to identify altered CFC sub-networks, allowing for the detection of systemic changes in AD.
In this paper, we use fMRI recordings to obtain CFC for each individual subject. We infer the CFC from fMRI data using the recently developed Time-aware Peter-Clark (PC) algorithm [22]. The Time-aware PC algorithm infers causality in neural interactions instead of correlation, in a model-free non-parametric manner, computes whole brain-wide interactions, incorporates multi-regional interactions, and its utility has been demonstrated in fMRI data [13]. We then use network-based statistics (NBS) to obtain CFC subnetworks that significantly alter between the subjects with AD and cognitively normal (CN) subjects, while correcting for multiple comparisons [30,31,32]. Unlike previous studies that performed edge-wise comparisons [13], NBS allows us to identify network-level alterations by detecting clusters of altered edges, enhancing the biological interpretability of the results.
In summary, our contributions in this paper are as follows: (a) applying the TPC algorithm to calculate whole-brain CFC for each subject, (b) comparing CFC with AFC computed using sparse partial correlation for an example subject, (c) identifying CFC sub-networks with altered connectivity in subjects with AD compared to CN using NBS at a 5% level of significance, and (d) interpreting altered CFC sub-networks in the context of AD using domain-specific (neuropathological) knowledge. Our findings align with existing medical literature and demonstrate the potential of the TPC algorithm for computing whole-brain CFC from fMRI data, and offering prognostic and diagnostic insights.
2. Materials and Methods
2.1. Participants
We obtained the resting-state fMRI data of participants and their demographic information from the Alzheimer’s Disease Neuroimaging Initiative database (http://adni.loni.usc.edu/ (accessed on 15 August 2023)). This study includes 75 participants, comprising 41 individuals who are cognitively normal (CN) and 34 individuals with Alzheimer’s disease (AD).
A summary of the demographic and medical information of the participants is provided in Table 1. Participants with AD are found to have a significantly lower score on the Mini-Mental State Examination (MMSE) compared to cognitively normal participants. Participants among the CN and AD groups do not significantly differ in age ( in Kruskal-Wallis test), gender ( in Chi-Squared test), and years of education ( in Kruskal-Wallis test). The MMSE scores differed significantly between the CN and AD groups as expected ( in Kruskal-Wallis test).

Table 1.
Overview of demographic details and Mini-Mental State Examination (MMSE) scores for cognitively normal (CN) and Alzheimer’s disease (AD) participants. The second and third columns present group characteristics, mean ± SD. The fourth column displays the p-values indicating the statistical significance of differences between groups. A Chi-squared test was used to evaluate differences in sex, while age, education, and MMSE were compared using a non-parametric Kruskal-Wallis analysis of variance.
2.2. Image Acquisition
Scanner from Philips Medical Systems was used to acquire the fMRI images. The imaging procedure utilized an echo planar imaging (EPI) sequence with a magnetic field strength of . The repetition time (TR) was set to , the echo time (TE) was , and the flip angle was configured at . The acquisition matrix dimensions were , producing comprising per volume. Each slice had a thickness of , corresponding to a voxel size of .
2.3. fMRI Preprocessing
Functional MRI preprocessing was performed using the CONN toolbox (version 21a), which runs in conjunction with Statistical Parametric Mapping (SPM12), which are cross-platform softwares based on MATLAB version R2023a [33,34]. The default preprocessing pipeline in the CONN toolbox (version 21a) was utilized, which follows a series of sequential steps. These include functional realignment and unwarping to correct for subject motion, centering the functional data at coordinates for alignment, slice-timing correction with interleaved acquisition order, and outlier detection using the Artifact Detection and Removal Tool. The data was segmented into gray matter, white matter, and cerebrospinal fluid, normalized to the standard Montreal Neurological Institute (MNI) space, and smoothed using an 8mm Gaussian kernel (full-width at half maximum). The preprocessing also involved detrending and bandpass filtering (0.001–0.1 Hz) to mitigate low-frequency drift and physiological noise. Additionally, the first four time points were excluded to remove any artifacts.
For extracting regions of interest (ROIs), the preprocessed resting-state fMRI data was parcellated using the automated anatomical labeling (AAL) atlas [35]. A detailed list of the regions within the AAL atlas, including their abbreviations and full names, is provided in Appendix A. This parcellation scheme has been widely recognized for its suitability in functional connectivity studies [36]. The average voxel time series within each ROI was computed to generate the corresponding time series.
2.4. Functional Connectivity Analyses
2.4.1. Associative FC
We employed Sparse Partial Correlation to obtain AFC from fMRI time series data [37,38,39]. The sparse partial correlation regularizes partial correlation with a graphical LASSO penalty, whose regularization parameters were selected by cross-validation [40]. We implemented this approach using the scikit-learn library in Python version 3.11, a widely-used toolkit for machine learning and data analysis [41].
2.4.2. Causal FC
In this study, CFC is estimated using the Time-aware PC (TPC) algorithm, a recently developed approach for inferring CFC from neural time-series data [22,42]. The TPC algorithm applies the Directed Markov Property to a time series context, modeling causal interactions as an unrolled Directed Acyclic Graph (DAG) that captures both spatial and temporal relationships in the time series. In this unrolled DAG, nodes represent regions of interest at specific times, and edges indicate directional causal influences between these nodes. Directional causal influence between nodes is established based on conditional independence relationships derived from neural activity at different time points. Using iterative conditional independence tests, the algorithm ensures that each causal edge represents a statistically significant direct interaction, rather than an indirect association mediated by other regions [22,23].
To estimate the CFC, the TPC algorithm first transforms time-series data into sequential variables with a maximum time lag ( in this case) and then utilizes the Peter-Clark (PC) algorithm to estimate the unrolled DAG between (neuron, time) tuples. The unrolled DAG is then rolled back to construct a CFC network between neurons (see Figure 1). A complete version of the algorithm that is not used here and applicable for large number of recordings over time includes a subsampling step that further ensures robust edges. The Python package timeawarepc is used for implementing this approach. This method allows for the analysis of complex, multivariate interactions, does not require specific parametric equations for neural dynamics, and supports whole-brain CFC estimation, accommodating the BOLD signal’s temporal delays and feedback loops [13]. In particular, our approach is well-suited for fMRI data as it accommodates the relatively low temporal resolution of the BOLD signal and allows for the identification of both across-time and contemporaneous interactions within the brain network [13].
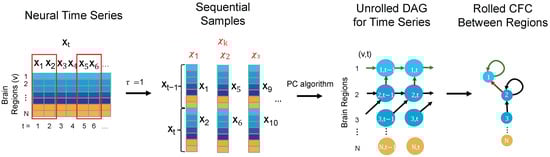
Figure 1.
The steps illustrating the TPC algorithm for inferring CFC from neural time-series data are as follows: First, the time-series data is reorganized into sequential samples, accounting for the maximum interaction delay, ( in this case). The Peter-Clark (PC) algorithm is then applied to these samples to estimate an unrolled directed acyclic graph (DAG) that satisfies the Directed Markov Property. Finally, the unrolled DAG is converted into a rolled CFC graph representing connections between different brain regions.
For comparison, various CFC approaches address different aspects of modeling neural causality [22]. For example, Granger Causality (GC) typically assumes a linear relationship between variables in its standard form, although more recent adaptations allow for non-linear and non-parametric extensions. Dynamic Causal Modeling (DCM) relies on strictly well-defined mechanistic biological models and compares competing models based on their evidence from data. In contrast, both PC and TPC are non-parametric and do not assume specific parametric equations for the neural dynamics. However, PC is designed for static variables and operates under the constraint of a directed acyclic graph (DAG) structure over neurons, making it unsuitable for modeling across-time relationships. TPC, in contrast, extends PC to the time-series setting, allowing it to capture both across-time and contemporaneous relationships. It models parent-child interactions between neurons as functional dependencies over time and can incorporate contemporaneous interactions that arise when neural interactions are faster than the sampling rate—capabilities that GC and PC lack. Another advantage of the TPC algorithm is its ability to model self-loops, which represent feedback mechanisms in neural activity, while the PC algorithm typically enforces a DAG structure that excludes such loops [22]. Although GC provides valuable insights into dynamic interactions, its interpretation of causality is based on predictability rather than definitive causal inference. DCM infers causal flow by estimating coupling parameters between hidden neural states, but its relevance to true causality depends on the accuracy of the competing models being compared [43]. In summary, TPC extends directed probabilistic graphical modeling to time-series data, providing a probabilistic framework for causal inference, in a manner that is predictive of the effects of interventions, such as neuron ablation or neuromodulation.
2.5. Alterations of CFC Edges in Alzheimer’s Disease
NBS is a popular non-parametric statistical method for identifying inter-group differences in large brain networks while controlling for multiple comparisons [30,31,32,44,45,46]. It is a method for controlling the FWER when a large number of univariate tests are conducted over the connections in the network. NBS method outputs the connected components in the brain network that exhibit inter-group difference and a corresponding FWER-corrected p-value for each such component. The FWER-corrected p-values are calculated for each component using permutation testing. We used 10,000 random permutations for the permutation tests. For implementation, we used the dNBS Toolbox in MATLAB which extends NBS for directed networks (https://www.nitrc.org/projects/nbs/ (accessed on 18 February 2024)) [30]. In the implementation of NBS, we used a primary threshold of 1.8 and FWER corrected significance level of 0.05. At that significance level, the critical threshold of cluster size was 6. For finding altered sub-networks between CN and AD groups, NBS considers the direction of each connection in the whole CFC among subjects in CN and AD groups. We outlined detailed steps of implementing NBS in Appendix B.
We applied NBS to the subject-specific CFCs estimated by TPC, to identify connected components of the CFC that are altered in strength for subjects with AD compared to the CN.
3. Results
3.1. Subject-Specific CFC
Figure 2 shows the AFC obtained by sparse partial correlation and CFC obtained by TPC for an example subject who is CN. The AFC (top row) revealed an extensive associative network, as evidenced by dense symmetric adjacency matrix and dense undirected graphical representations. The CFC is expected to be a directed subgraph of the AFC, reflecting the overall structure observed in the AFC. The general connectivity patterns in the CFC derived using the TPC algorithm are consistent with those in the AFC, as visualized in their respective adjacency matrices (refer to Figure 2, left column). Yet, at a detailed level, TPC results in a directed graph with an asymmetric adjacency matrix where of its edges are unidirectional, thus capturing directional interaction between regions through its edges. In comparison, the AFC yields an undirected graph having a symmetric adjacency matrix, thus not identifying any directional interactions. Furthermore, we quantify the sparsity level of a graph by the proportion of edges in the graph out of all possible edges, i.e., all possible edges between 116 brain regions. The sparsity level of the AFC graph is (2442 edges) whereas the sparsity level of the CFC graph is (165 edges). Thus, in contrast to the dense AFC graph, the CFC obtained by TPC results in a sparse graph. Such a sparsity in the CFC graph is desirable because the CFC identifies directeional edges whereas the AFC is unable to identify directional edges, CFC reduces spurious edges from the AFC, and the connections in the CFC are filtered by conditional dependence tests in the TPC algorithm thereby reducing noise [22].
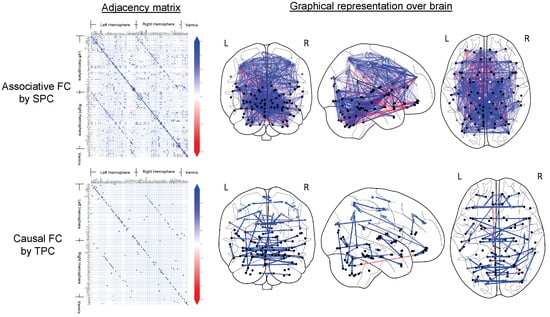
Figure 2.
The CFC for a representative cognitively normal (CN) subject, as inferred using the TPC algorithm, is illustrated. The resulting CFC is displayed as an adjacency matrix in the left column, where each non-zero element indicates a directed connection from region i to region j. Directed graph edges visually represent the CFC on the Frontal, Axial, and Lateral brain views (columns 2 through 4). Nodes correspond to the central points of brain regions, with lighter gray indicating superficial regions and darker gray denoting deeper ones, as defined by the AAL brain atlas. Additionally, brain regions are marked for the Left (L) and Right (R) hemispheres and the Vermis (V).
3.2. Altered CFC Sub-Networks in AD
Figure 3 shows the significantly altered (; NBS corrected) CFC sub-networks in AD compared to CN. In the implementation of NBS, t-statistic thresholds of 0.1 to 3.1 in steps of 0.1 were tried out. Among those, thresholds of 1.8, 2.2 and 2.3 yielded altered sub-networks at level of significance. At each of these thresholds, a sparse thresholded adjacency matrix is obtained (Figure 3-left row). A subset of the thresholded edges is outputted by NBS as an altered sub-network at level of significance. Figure 3 shows the altered sub-network’s adjacency matrix representation (2nd column from left) as well as graphical representation (3rd to 5th columns from left) on brain schematics.
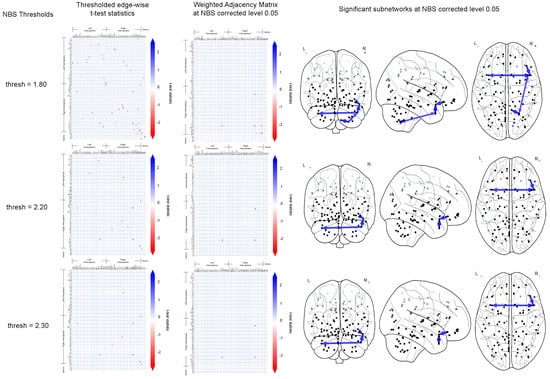
Figure 3.
This figures shows the significantly altered sub-networks obtained by NBS implemented on the CFC outcome of TPC. For NBS test-statistics thresholds of 1.8, 2.2 and 2.3 (top to bottom), the thresholded edge-wise t-test statistics (left column) and the result of the NBS corrected sub-network are shown: weighted adjacency matrix representation (2nd column from left), graphical representation on brain schematics on the Frontal, Axial and Lateral brain maps (3rd to 5th columns from left).
3.3. Brain Regions in the Altered CFC Sub-Networks
Table 2 presents the CFC edges within altered sub-networks that show higher average strength in cognitively normal (CN) individuals compared to Alzheimer’s disease (AD) subjects, with significance corrected at the 5% level using NBS. The identified brain regions align with findings from existing medical literature referenced in the table. No sub-networks with lower average strength in CN compared to AD reached significance at the 5% threshold after NBS correction.
Table 2.
CFC edges in significantly altered CFC sub-networks with greater weight in CN compared to AD group at NBS corrected level of significance. The sub-networks are obtained at different NBS’s t-statistic thresholds: (a) , (b) and (c) yielding altered sub-networks with p-values of , and respectively. The identified source brain regions correspond to those reported in the literature (right column) as being affected in Alzheimer’s disease (AD).
4. Discussion
In this study, we identified whole-brain CFC sub-networks that differ between AD and CN individuals using resting-state fMRI data. The analysis employed the TPC algorithm, a recent approach that utilizes directed graphical modeling of time-series data for CFC estimation. First, subject-specific CFCs were generated using TPC and compared to AFCs obtained through sparse partial correlation. We then used the CFC results from TPC to further investigate changes in CFC sub-networks associated with AD. In this regard, we used NBS to obtain CFC sub-networks that alter in AD compared to CN subjects at level of significance, while correcting for multiple comparisons in those sub-networks. The brain regions within those altered sub-networks were consistent with medical literature regarding areas affected by AD.
Our findings align with the growing body of literature that highlights AD as a “disconnection syndrome”, characterized by both structural and functional network disrupti- ons [6,7,8]. These disruptions are closely associated with patterns of neurodegeneration, as well as the deposition of pathological tau and amyloid-beta proteins, which have been shown to preferentially affect specific brain networks. For instance, the inferior frontal gyrus and the temporal pole: middle temporal gyrus—prominent regions in our results—are part of the default mode network (DMN), which is one of the earliest and most severely affected networks in AD [14,16,53]. Our findings of altered CFC sub-networks involving these regions support the hypothesis that functional network disruptions in AD are closely tied to neurodegenerative changes and the progression of tau and amyloid pathology.
Figure 3 and Table 2 show CFC sub-networks with edge weights higher in AD than in CN, which aligns with findings reported in the literature. The absence of CFC sub-networks with weight of edges in AD lower than that in CN supports the notion of AD as a syndrome of disrupted functional and causal connectivity [6,7,8]. This aligns with studies showing that tau pathology spreads in a network-dependent manner, disrupting connectivity along established anatomical pathways [54,55].
In Table 2, the brain regions of the Inferior frontal gyrus (Inferior frontal gyrus, pars orbitalis Right → Temporal pole: superior temporal gyrus Right) and Temporal pole: middle temporal gyrus (Temporal pole: middle temporal gyrus Right → Temporal pole: superior temporal gyrus Right, Temporal pole: middle temporal gyrus Right → Temporal pole: middle temporal gyrus Left) are prominent within sub-networks where CFC weights are lower in AD compared to CN individuals. The Inferior frontal gyrus is associated with attentional control [56] and language processing [57] and has been reported as a region affected in AD [47,48]. The temporal pole: middle temporal gyrus, another region in Table 2, is considered to be important in word memory and meaning [58,59,60,61,62,63,64,65]. It has been reported to be impacted by AD [49,50]. Also present in Table 2(a) is the Cerebellum (Lobule VIII of cerebellar hemisphere Right → Temporal pole: middle temporal gyrus Right, Lobule IX of cerebellar hemisphere Right → Lobule VIII of cerebellar hemisphere Right, Lobule VIII of cerebellar hemisphere Right → Lobule IX of cerebellar hemisphere Right), which plays an essential role in motor control and perception [66,67,68], and has been reported to be impacted by AD [51,52].
The involvement of the cerebellum in the altered sub-networks is noteworthy. While traditionally associated with motor control, recent studies have highlighted the cerebellum’s role in higher-order cognitive processes such as attention and language [69,70]. In fact, emerging evidence suggests that the cerebellum is impacted by amyloid deposition and tau pathology in AD, particularly in later stages of the disease [51,52,71].
Our findings highlight the potential utility of interpreting altered causal sub-networks in Alzheimer’s Disease. Specifically, this approach enables the identification of regions that serve as causal drivers of network disruptions, such as the inferior frontal gyrus and temporal pole, which are critical for memory and attention [72,73]. This knowledge provides a foundation for future early diagnostic biomarkers and can inform neuromodulation therapies targeting network hubs (Fox et al., 2014). Moreover, understanding the direction of interactions rather than mere correlations offers a mechanistic perspective on disease progression, supporting the development of personalized treatment strategies [74]. Ultimately, our approach can be scaled to larger datasets and longitudinal studies, enhancing its utility for tracking disease progression and evaluating the efficacy of targeted interventions [75].
Overall, by identifying altered causal functional connectivity (CFC) sub-networks, this study contributes to understanding the directional flow of information in affected networks and suggests the potential utility of CFC in studying AD-related connectivity changes. Future studies integrating multi-modal imaging, such as structural MRI and PET imaging of tau and amyloid, will be critical for further elucidating the relationship between functional disruptions and pathological changes in AD.
Conclusions
In this study, we applied the TPC algorithm to estimate whole-brain CFC from resting-state fMRI data, a novel approach compared to traditional correlation-based methods. Using NBS, we identified significant alterations in causal sub-networks between AD and CN subjects, moving beyond earlier edge-wise comparisons to detect network-level disruptions. Our analysis revealed that key regions, such as the inferior frontal gyrus and temporal pole, exhibit reduced CFC strength in AD, consistent with the literature on neurodegenerative network disruptions. By comparing CFC to AFC, we demonstrated that causal inference provides richer insights by capturing the directional flow of neural interactions.
The use of NBS strengthened the analysis by identifying clusters of altered connections at the sub-network level after correcting for multiple comparisons, underscoring the robustness of the findings. These results highlight the novelty of using whole-brain CFC analysis to understand AD-related disruptions and demonstrate the potential of the TPC algorithm for detecting complex, multivariate brain interactions. This research contributes to the growing body of work on causal connectivity and presents CFC as a promising biomarker for early diagnosis and monitoring of AD progression. Future studies with larger, longitudinal datasets could enhance the generalizability of these results and further investigate the temporal dynamics of causal connectivity changes.
Author Contributions
R.B.: Conceptualization, Data curation, Formal analysis, Investigation, Methodology, Software, Validation, Visualization, Writing—original draft, Writing—review & editing. S.S.: Conceptualization, Investigation, Supervision, Writing—review & editing. All authors have read and agreed to the published version of the manuscript.
Funding
R.B. was funded by the Department of Electrical and Computer Engineering, University of Washington, Seattle, through pre-doctoral teaching assistantships for the duration of this work. This funding source had no role in the study design, data collection, analysis, or interpretation, nor in the writing of the manuscript or the decision to submit it for publication.
Institutional Review Board Statement
Not applicable.
Informed Consent Statement
Not applicable.
Data Availability Statement
The data used in this study is publicly available and can be accessed through the Alzheimer’s Disease Neuroimaging Initiative (ADNI) website: https://adni.loni.usc.edu (accessed on 15 August 2023).
Conflicts of Interest
The authors declare no conflicts of interest.
Appendix A. Automated Anatomical Labeling (AAL) Atlas
The regions in the AAL atlas along with their abbreviated, short and full names are listed in Table A1.
Table A1.
Names of regions in the AAL Atlas.
Table A1.
Names of regions in the AAL Atlas.
| No | Abbr. Name | Short Name | Full Region Name |
|---|---|---|---|
| 1 | PreCG_L | Precentral_L | Precentral gyrus Left |
| 2 | PreCG_R | Precentral_R | Precentral gyrus Right |
| 3 | SFG_L | Frontal_Sup_L | Superior frontal gyrus, dorsolateral Left |
| 4 | SFG_R | Frontal_Sup_R | Superior frontal gyrus, dorsolateral Right |
| 5 | SFGorb_L | Frontal_Sup_Orb_L | Superior frontal gyrus, pars orbitalis Left |
| 6 | SFGorb_R | Frontal_Sup_Orb_R | Superior frontal gyrus, pars orbitalis Right |
| 7 | MFG_L | Frontal_Mid_L | Middle frontal gyrus Left |
| 8 | MFG_R | Frontal_Mid_R | Middle frontal gyrus Right |
| 9 | MFGorb_L | Frontal_Mid_Orb_L | Middle frontal gyrus, pars orbitalis Left |
| 10 | MFGorb_R | Frontal_Mid_Orb_R | Middle frontal gyrus, pars orbitalis Right |
| 11 | IFGoperc_L | Frontal_Inf_Oper_L | Inferior frontal gyrus, opercular part Left |
| 12 | IFGoperc_R | Frontal_Inf_Oper_R | Inferior frontal gyrus, opercular part Right |
| 13 | IFGtriang_L | Frontal_Inf_Tri_L | Inferior frontal gyrus, triangular part Left |
| 14 | IFGtriang_R | Frontal_Inf_Tri_R | Inferior frontal gyrus, triangular part Right |
| 15 | IFGorb_L | Frontal_Inf_Orb_L | Inferior frontal gyrus, pars orbitalis, Left |
| 16 | IFGorb_R | Frontal_Inf_Orb_R | Inferior frontal gyrus, pars orbitalis, Right |
| 17 | ROL_L | Rolandic_Oper_L | Rolandic operculum Left |
| 18 | ROL_R | Rolandic_Oper_R | Rolandic operculum Right |
| 19 | SMA_L | Supp_Motor_Area_L | Supplementary motor area Left |
| 20 | SMA_R | Supp_Motor_Area_R | Supplementary motor area Right |
| 21 | OLF_L | Olfactory_L | Olfactory cortex Left |
| 22 | OLF_R | Olfactory_R | Olfactory cortex Right |
| 23 | SFGmedial_L | Frontal_Sup_Medial_L | Superior frontal gyrus, medial Left |
| 24 | SFGmedial_R | Frontal_Sup_Medial_R | Superior frontal gyrus, medial Right |
| 25 | SFGmedorb_L | Frontal_Med_Orb_L | Superior frontal gyrus, medial orbital Left |
| 26 | SFGmedorb_R | Frontal_Med_Orb_R | Superior frontal gyrus, medial orbital Right |
| 27 | REC_L | Rectus_L | Gyrus rectus Left |
| 28 | REC_R | Rectus_R | Gyrus rectus Right |
| 29 | INS_L | Insula_L | Insula Left |
| 30 | INS_R | Insula_R | Insula Right |
| 31 | ACC_L | Cingulum_Ant_L | Anterior cingulate & paracingulate gyri Left |
| 32 | ACC_R | Cingulum_Ant_R | Anterior cingulate & paracingulate gyri Right |
| 33 | MCC_L | Cingulum_Mid_L | Middle cingulate & paracingulate gyri Left |
| 34 | MCC_R | Cingulum_Mid_R | Middle cingulate & paracingulate gyri Right |
| 35 | PCC_L | Cingulum_Post_L | Posterior cingulate gyrus Left |
| 36 | PCC_R | Cingulum_Post_R | Posterior cingulate gyrus Right |
| 37 | HIP_L | Hippocampus_L | Hippocampus Left |
| 38 | HIP_R | Hippocampus_R | Hippocampus Right |
| 39 | PHG_L | ParaHippocampal_L | Parahippocampal gyrus Left |
| 40 | PHG_R | ParaHippocampal_R | Parahippocampal gyrus Right |
| 41 | AMYG_L | Amygdala_L | Amygdala Left |
| 42 | AMYG_R | Amygdala_R | Amygdala Right |
| 43 | CAL_L | Calcarine_L | Calcarine fissure and surrounding cortex Left |
| 44 | CAL_R | Calcarine_R | Calcarine fissure and surrounding cortex Right |
| 45 | CUN_L | Cuneus_L | Cuneus Left |
| 46 | CUN_R | Cuneus_R | Cuneus Right |
| 47 | LING_L | Lingual_L | Lingual gyrus Left |
| 48 | LING_R | Lingual_R | Lingual gyrus Right |
| 49 | SOG_L | Occipital_Sup_L | Superior occipital gyrus Left |
| 50 | SOG_R | Occipital_Sup_R | Superior occipital gyrus Right |
| 51 | MOG_L | Occipital_Mid_L | Middle occipital gyrus Left |
| 52 | MOG_R | Occipital_Mid_R | Middle occipital gyrus Right |
| 53 | IOG_L | Occipital_Inf_L | Inferior occipital gyrus Left |
| 54 | IOG_R | Occipital_Inf_R | Inferior occipital gyrus Right |
| 55 | FFG_L | Fusiform_L | Fusiform gyrus Left |
| 56 | FFG_R | Fusiform_R | Fusiform gyrus Right |
| 57 | PoCG_L | Postcentral_L | Postcentral gyrus Left |
| 58 | PoCG_R | Postcentral_R | Postcentral gyrus Right |
| 59 | SPG_L | Parietal_Sup_L | Superior parietal gyrus Left |
| 60 | SPG_R | Parietal_Sup_R | Superior parietal gyrus Right |
| 61 | IPG_L | Parietal_Inf_L | Inferior parietal gyrus, excluding supramargina... |
| 62 | IPG_R | Parietal_Inf_R | Inferior parietal gyrus, excluding supramargina... |
| 63 | SMG_L | SupraMarginal_L | SupraMarginal gyrus Left |
| 64 | SMG_R | SupraMarginal_R | SupraMarginal gyrus Right |
| 65 | ANG_L | Angular_L | Angular gyrus Left |
| 66 | ANG_R | Angular_R | Angular gyrus Right |
| 67 | PCUN_L | Precuneus_L | Precuneus Left |
| 68 | PCUN_R | Precuneus_R | Precuneus Right |
| 69 | PCL_L | Paracentral_Lobule_L | Paracentral lobule Left |
| 70 | PCL_R | Paracentral_Lobule_R | Paracentral lobule Right |
| 71 | CAU_L | Caudate_L | Caudate nucleus Left |
| 72 | CAU_R | Caudate_R | Caudate nucleus Right |
| 73 | PUT_L | Putamen_L | Lenticular nucleus, Putamen Left |
| 74 | PUT_R | Putamen_R | Lenticular nucleus, Putamen Right |
| 75 | PAL_L | Pallidum_L | Lenticular nucleus, Pallidum Left |
| 76 | PAL_R | Pallidum_R | Lenticular nucleus, Pallidum Right |
| 77 | THA_L | Thalamus_L | Thalamus Left |
| 78 | THA_R | Thalamus_R | Thalamus Right |
| 79 | HES_L | Heschl_L | Heschl’s gyrus Left |
| 80 | HES_R | Heschl_R | Heschl’s gyrus Right |
| 81 | STG_L | Temporal_Sup_L | Superior temporal gyrus Left |
| 82 | STG_R | Temporal_Sup_R | Superior temporal gyrus Right |
| 83 | TPOsup_L | Temporal_Pole_Sup_L | Temporal pole: superior temporal gyrus Left |
| 84 | TPOsup_R | Temporal_Pole_Sup_R | Temporal pole: superior temporal gyrus Right |
| 85 | MTG_L | Temporal_Mid_L | Middle temporal gyrus Left |
| 86 | MTG_R | Temporal_Mid_R | Middle temporal gyrus Right |
| 87 | TPOmid_L | Temporal_Pole_Mid_L | Temporal pole: middle temporal gyrus Left |
| 88 | TPOmid_R | Temporal_Pole_Mid_R | Temporal pole: middle temporal gyrus Right |
| 89 | ITG_L | Temporal_Inf_L | Inferior temporal gyrus Left |
| 90 | ITG_R | Temporal_Inf_R | Inferior temporal gyrus Right |
| 91 | CERCRU1_L | Cerebellum_Crus1_L | Crus I of cerebellar hemisphere Left |
| 92 | CERCRU1_R | Cerebellum_Crus1_R | Crus I of cerebellar hemisphere Right |
| 93 | CERCRU2_L | Cerebellum_Crus2_L | Crus II of cerebellar hemisphere Left |
| 94 | CERCRU2_R | Cerebellum_Crus2_R | Crus II of cerebellar hemisphere Right |
| 95 | CER3_L | Cerebellum_3_L | Lobule III of cerebellar hemisphere Left |
| 96 | CER3_R | Cerebellum_3_R | Lobule III of cerebellar hemisphere Right |
| 97 | CER4_5_L | Cerebellum_4_5_L | Lobule IV, V of cerebellar hemisphere Left |
| 98 | CER4_5_R | Cerebellum_4_5_R | Lobule IV, V of cerebellar hemisphere Right |
| 99 | CER6_L | Cerebellum_6_L | Lobule VI of cerebellar hemisphere Left |
| 100 | CER6_R | Cerebellum_6_R | Lobule VI of cerebellar hemisphere Right |
| 101 | CER7b_L | Cerebellum_7b_L | Lobule VIIB of cerebellar hemisphere Left |
| 102 | CER7b_R | Cerebellum_7b_R | Lobule VIIB of cerebellar hemisphere Right |
| 103 | CER8_L | Cerebellum_8_L | Lobule VIII of cerebellar hemisphere Left |
| 104 | CER8_R | Cerebellum_8_R | Lobule VIII of cerebellar hemisphere Right |
| 105 | CER9_L | Cerebellum_9_L | Lobule IX of cerebellar hemisphere Left |
| 106 | CER9_R | Cerebellum_9_R | Lobule IX of cerebellar hemisphere Right |
| 107 | CER10_L | Cerebellum_10_L | Lobule X of cerebellar hemisphere Left |
| 108 | CER10_R | Cerebellum_10_R | Lobule X of cerebellar hemisphere Right |
| 109 | VER1_2 | Vermis_1_2 | Lobule I, II of vermis |
| 110 | VER3 | Vermis_3 | Lobule III of vermis |
| 111 | VER4_5 | Vermis_4_5 | Lobule IV, V of vermis |
| 112 | VER6 | Vermis_6 | Lobule VI of vermis |
| 113 | VER7 | Vermis_7 | Lobule VII of vermis |
| 114 | VER8 | Vermis_8 | Lobule VIII of vermis |
| 115 | VER9 | Vermis_9 | Lobule IX of vermis |
| 116 | VER10 | Vermis_10 | Lobule X of vermis |
Appendix B. The Network-Based Statistics (NBS) Method
For comparing the CFCs between two groups, NBS initially calculates a Generalized Linear Model based statistic to score each connection. These scores are then subjected to a primary threshold, leading to the selection of suprathreshold links with scores surpassing this threshold. The thresholding is done separately for positive and negative scores, identifying connected components where individuals with CN exhibit notably higher or lower connectivity strength than those with AD. Various primary thresholds were evaluated in the range of 0.1 to 3 in steps of 0.1, and fixed at 1.8 which is the lowest in the range yielding significance at family wise error rate (FWER) level 0.05. Although the primary threshold impacts method sensitivity, yet FWER control is ensured regardless of the chosen thres- hold [30]. Subsequently, components within the suprathreshold link set are identified, and their sizes are recorded. To establish component significance, a non-parametric permutation test is conducted. In each permutation, subjects are randomly reassigned to CN and AD groups. Independent scores are computed for each link, and the size of the largest connected component among suprathreshold links is noted. This process is reiterated 10,000 times to generate a null distribution of the pseudo size of the connected component. Ultimately, the corrected p-value for a connected component of size M is determined based on the proportion of permutations where the largest connected component size exceeds M. The NBS method is implemented in the dNBS Toolbox in MATLAB which extends NBS for directed networks (https://www.nitrc.org/projects/nbs/ (accessed on 18 February 2024)) [30].
References
- de LaCoste, M.C.; White, C.L., III. The role of cortical connectivity in Alzheimer’s disease pathogenesis: A review and model system. Neurobiol. Aging 1993, 14, 1–16. [Google Scholar] [CrossRef]
- Christensen, H.; Griffiths, K.; MacKinnon, A.; Jacomb, P. A quantitative review of cognitive deficits in depression and Alzheimer-type dementia. J. Int. Neuropsychol. Soc. 1997, 3, 631–651. [Google Scholar] [CrossRef] [PubMed]
- Gomez-Isla, T.; Hyman, B. Connections and cognitive impairment in Alzheimer’s disease. In Connections, Cognition and Alzheimer’s Disease; Springer: Berlin/Heidelberg, Germany, 1997; pp. 149–166. [Google Scholar]
- Perry, R.J.; Hodges, J.R. Attention and executive deficits in Alzheimer’s disease: A critical review. Brain 1999, 122, 383–404. [Google Scholar] [PubMed]
- Delbeuck, X.; Van der Linden, M.; Collette, F. Alzheimer’disease as a disconnection syndrome? Neuropsychol. Rev. 2003, 13, 79–92. [Google Scholar] [CrossRef]
- Geschwind, N. Disconnexion syndromes in animals and man. Brain 1965, 88, 585. [Google Scholar] [CrossRef] [PubMed]
- Bozzali, M.; Padovani, A.; Caltagirone, C.; Borroni, B. Regional grey matter loss and brain disconnection across Alzheimer disease evolution. Curr. Med. Chem. 2011, 18, 2452–2458. [Google Scholar] [CrossRef] [PubMed]
- Brier, M.R.; Thomas, J.B.; Ances, B.M. Network dysfunction in Alzheimer’s disease: Refining the disconnection hypothesis. Brain Connect. 2014, 4, 299–311. [Google Scholar] [CrossRef] [PubMed]
- Yao, Z.; Zhang, Y.; Lin, L.; Zhou, Y.; Xu, C.; Jiang, T.; Initiative, A.D.N. Abnormal cortical networks in mild cognitive impairment and Alzheimer’s disease. PLoS Comput. Biol. 2010, 6, e1001006. [Google Scholar]
- Amlien, I.; Fjell, A. Diffusion tensor imaging of white matter degeneration in Alzheimer’s disease and mild cognitive impairment. Neuroscience 2014, 276, 206–215. [Google Scholar] [PubMed]
- Wang, K.; Liang, M.; Wang, L.; Tian, L.; Zhang, X.; Li, K.; Jiang, T. Altered functional connectivity in early Alzheimer’s disease: A resting-state fMRI study. Hum. Brain Mapp. 2007, 28, 967–978. [Google Scholar] [PubMed]
- Zhao, J.; Du, Y.H.; Ding, X.T.; Wang, X.H.; Men, G.Z. Alteration of functional connectivity in patients with Alzheimer’s disease revealed by resting-state functional magnetic resonance imaging. Neural Regen. Res. 2020, 15, 285–292. [Google Scholar] [PubMed]
- Biswas, R.; Sripada, S. Causal functional connectivity in Alzheimer’s disease computed from time series fMRI data. Front. Comput. Neurosci. 2023, 17, 1251301. [Google Scholar] [CrossRef]
- Buckner, R.L.; Snyder, A.Z.; Shannon, B.J.; LaRossa, G.; Sachs, R.; Fotenos, A.F.; Sheline, Y.I.; Klunk, W.E.; Mathis, C.A.; Morris, J.C.; et al. Molecular, structural, and functional characterization of Alzheimer’s disease: Evidence for a relationship between default activity, amyloid, and memory. J. Neurosci. 2005, 25, 7709–7717. [Google Scholar] [CrossRef] [PubMed]
- Sheline, Y.I.; Raichle, M.E.; Snyder, A.Z.; Morris, J.C.; Head, D.; Wang, S.; Mintun, M.A. Amyloid plaques disrupt resting state default mode network connectivity in cognitively normal elderly. Biol. Psychiatry 2010, 67, 584–587. [Google Scholar] [CrossRef] [PubMed]
- Greicius, M.D.; Srivastava, G.; Reiss, A.L.; Menon, V. Default-mode network activity distinguishes Alzheimer’s disease from healthy aging: Evidence from functional MRI. Proc. Natl. Acad. Sci. USA 2004, 101, 4637–4642. [Google Scholar] [PubMed]
- Reid, A.T.; Headley, D.B.; Mill, R.D.; Sanchez-Romero, R.; Uddin, L.Q.; Marinazzo, D.; Lurie, D.J.; Valdés-Sosa, P.A.; Hanson, S.J.; Biswal, B.B.; et al. Advancing functional connectivity research from association to causation. Nat. Neurosci. 2019, 1, 1751–1760. [Google Scholar]
- Biswas, R.; Shlizerman, E. Statistical Perspective on Functional and Causal Neural Connectomics: A Comparative Study. Front. Syst. Neurosci. 2022, 16, 817962. [Google Scholar] [CrossRef] [PubMed]
- Sheline, Y.I.; Raichle, M.E. Resting state functional connectivity in preclinical Alzheimer’s disease. Biol. Psychiatry 2013, 74, 340–347. [Google Scholar]
- Brier, M.R.; Thomas, J.B.; Fagan, A.M.; Hassenstab, J.; Holtzman, D.M.; Benzinger, T.L.; Morris, J.C.; Ances, B.M. Functional connectivity and graph theory in preclinical Alzheimer’s disease. Neurobiol. Aging 2014, 35, 757–768. [Google Scholar]
- Briels, C.T.; Schoonhoven, D.N.; Stam, C.J.; de Waal, H.; Scheltens, P.; Gouw, A.A. Reproducibility of EEG functional connectivity in Alzheimer’s disease. Alzheimer’s Res. Ther. 2020, 12, 68. [Google Scholar]
- Biswas, R.; Shlizerman, E. Statistical perspective on functional and causal neural connectomics: The Time-Aware PC algorithm. PLoS Comput. Biol. 2022, 18, 1–27. [Google Scholar] [CrossRef]
- Spirtes, P.; Glymour, C.N.; Scheines, R.; Heckerman, D. Causation, Prediction, and Search; MIT Press: Cambridge, MA, USA, 2000. [Google Scholar]
- Logothetis, N.K.; Pauls, J.; Augath, M.; Trinath, T.; Oeltermann, A. Neurophysiological investigation of the basis of the fMRI signal. Nature 2001, 412, 150–157. [Google Scholar] [CrossRef] [PubMed]
- Smith, S.M. Overview of fMRI analysis. Br. J. Radiol. 2004, 77, S167–S175. [Google Scholar] [CrossRef]
- Logothetis, N.K. What we can do and what we cannot do with fMRI. Nature 2008, 453, 869–878. [Google Scholar] [CrossRef]
- Van Den Heuvel, M.P.; Pol, H.E.H. Exploring the brain network: A review on resting-state fMRI functional connectivity. Eur. Neuropsychopharmacol. 2010, 20, 519–534. [Google Scholar] [CrossRef] [PubMed]
- Rogers, B.P.; Morgan, V.L.; Newton, A.T.; Gore, J.C. Assessing functional connectivity in the human brain by fMRI. Magn. Reson. Imaging 2007, 25, 1347–1357. [Google Scholar] [CrossRef] [PubMed]
- Kim, B.H.; Ye, J.C. Understanding graph isomorphism network for rs-fMRI functional connectivity analysis. Front. Neurosci. 2020, 14, 545464. [Google Scholar] [CrossRef]
- Zalesky, A.; Fornito, A.; Bullmore, E.T. Network-based statistic: Identifying differences in brain networks. Neuroimage 2010, 53, 1197–1207. [Google Scholar] [CrossRef] [PubMed]
- Zhan, Y.; Yao, H.; Wang, P.; Zhou, B.; Zhang, Z.; An, N.; Ma, J.; Zhang, X.; Liu, Y. Network-based statistic show aberrant functional connectivity in Alzheimer’s disease. IEEE J. Sel. Top. Signal Process. 2016, 10, 1182–1188. [Google Scholar] [CrossRef]
- Zhan, C.; Chen, H.J.; Gao, Y.Q.; Zou, T.X. Functional network-based statistics reveal abnormal resting-state functional connectivity in minimal hepatic encephalopathy. Front. Neurol. 2019, 10, 33. [Google Scholar] [CrossRef] [PubMed]
- Nieto-Castanon, A.; Whitfield-Gabrieli, S. CONN Functional Connectivity Toolbox: RRID SCR_009550, Release 21; Hilbert Press: Boston, MA, USA, 2021; Available online: https://www.nitrc.org/projects/conn (accessed on 18 February 2024).
- Friston, K.J.; Holmes, A.P.; Worsley, K.J.; Poline, J.P.; Frith, C.D.; Frackowiak, R.S. Statistical parametric maps in functional imaging: A general linear approach. Hum. Brain Mapp. 1994, 2, 189–210. [Google Scholar] [CrossRef]
- Tzourio-Mazoyer, N.; Landeau, B.; Papathanassiou, D.; Crivello, F.; Etard, O.; Delcroix, N.; Mazoyer, B.; Joliot, M. Automated anatomical labeling of activations in SPM using a macroscopic anatomical parcellation of the MNI MRI single-subject brain. Neuroimage 2002, 15, 273–289. [Google Scholar] [CrossRef]
- Arslan, S.; Ktena, S.I.; Makropoulos, A.; Robinson, E.C.; Rueckert, D.; Parisot, S. Human brain mapping: A systematic comparison of parcellation methods for the human cerebral cortex. Neuroimage 2018, 170, 5–30. [Google Scholar] [CrossRef] [PubMed]
- Banerjee, O.; Ghaoui, L.E.; d’Aspremont, A. Model selection through sparse maximum likelihood estimation for multivariate Gaussian or binary data. J. Mach. Learn. Res. 2008, 9, 485–516. [Google Scholar]
- Pervaiz, U.; Vidaurre, D.; Woolrich, M.W.; Smith, S.M. Optimising network modelling methods for fMRI. Neuroimage 2020, 211, 116604. [Google Scholar] [CrossRef] [PubMed]
- Schmittmann, V.D.; Jahfari, S.; Borsboom, D.; Savi, A.O.; Waldorp, L.J. Making large-scale networks from fMRI data. PLoS ONE 2015, 10, e0129074. [Google Scholar] [CrossRef]
- Meinshausen, N.; Bühlmann, P. High-dimensional graphs and variable selection with the lasso. Ann. Stat. 2006, 34, 1436–1462. [Google Scholar] [CrossRef]
- Pedregosa, F.; Varoquaux, G.; Gramfort, A.; Michel, V.; Thirion, B.; Grisel, O.; Blondel, M.; Prettenhofer, P.; Weiss, R.; Dubourg, V.; et al. Scikit-learn: Machine learning in Python. J. Mach. Learn. Res. 2011, 12, 2825–2830. [Google Scholar]
- Biswas, R.; Mukherjee, S. Consistent causal inference from time series with PC algorithm and its time-aware extension. Stat. Comput. 2024, 34, 14. [Google Scholar] [CrossRef]
- Friston, K.J.; Harrison, L.; Penny, W. Dynamic causal modelling. Neuroimage 2003, 19, 1273–1302. [Google Scholar] [CrossRef] [PubMed]
- Olivito, G.; Cercignani, M.; Lupo, M.; Iacobacci, C.; Clausi, S.; Romano, S.; Masciullo, M.; Molinari, M.; Bozzali, M.; Leggio, M. Neural substrates of motor and cognitive dysfunctions in SCA2 patients: A network based statistics analysis. Neuroimage Clin. 2017, 14, 719–725. [Google Scholar]
- De Schipper, L.J.; Hafkemeijer, A.; Van der Grond, J.; Marinus, J.; Henselmans, J.M.; Van Hilten, J.J. Altered whole-brain and network-based functional connectivity in Parkinson’s disease. Front. Neurol. 2018, 9, 419. [Google Scholar]
- Zhu, L.; Dang, G.; Wu, W.; Zhou, J.; Shi, X.; Su, X.; Ren, H.; Pei, Z.; Lan, X.; Lian, C.; et al. Functional connectivity changes are correlated with sleep improvement in chronic insomnia patients after rTMS treatment. Front. Neurosci. 2023, 17, 1135995. [Google Scholar]
- Eliasova, I.; Anderkova, L.; Marecek, R.; Rektorova, I. Non-invasive brain stimulation of the right inferior frontal gyrus may improve attention in early Alzheimer’s disease: A pilot study. J. Neurol. Sci. 2014, 346, 318–322. [Google Scholar]
- Cajanus, A.; Solje, E.; Koikkalainen, J.; Lötjönen, J.; Suhonen, N.M.; Hallikainen, I.; Vanninen, R.; Hartikainen, P.; de Marco, M.; Venneri, A.; et al. The association between distinct frontal brain volumes and behavioral symptoms in mild cognitive impairment, Alzheimer’s disease, and frontotemporal dementia. Front. Neurol. 2019, 10, 1059. [Google Scholar]
- Harasty, J.A.; Halliday, G.M.; Kril, J.; Code, C. Specific temporoparietal gyral atrophy reflects the pattern of language dissolution in Alzheimer’s disease. Brain 1999, 122, 675–686. [Google Scholar] [PubMed]
- Convit, A.; De Asis, J.; De Leon, M.; Tarshish, C.; De Santi, S.; Rusinek, H. Atrophy of the medial occipitotemporal, inferior, and middle temporal gyri in non-demented elderly predict decline to Alzheimer’s disease. Neurobiol. Aging 2000, 21, 19–26. [Google Scholar] [PubMed]
- Joachim, C.L.; Morris, J.H.; Selkoe, D.J. Diffuse senile plaques occur commonly in the cerebellum in Alzheimer’s disease. Am. J. Pathol. 1989, 135, 309. [Google Scholar] [PubMed]
- Jacobs, H.I.; Hopkins, D.A.; Mayrhofer, H.C.; Bruner, E.; van Leeuwen, F.W.; Raaijmakers, W.; Schmahmann, J.D. The cerebellum in Alzheimer’s disease: Evaluating its role in cognitive decline. Brain 2018, 141, 37–47. [Google Scholar]
- Seeley, W.W.; Crawford, R.K.; Zhou, J.; Miller, B.L.; Greicius, M.D. Neurodegenerative diseases target large-scale human brain networks. Neuron 2009, 62, 42–52. [Google Scholar] [CrossRef] [PubMed]
- Braak, H.; Braak, E. Neuropathological stageing of Alzheimer-related changes. Acta Neuropathol. 1991, 82, 239–259. [Google Scholar] [CrossRef]
- Raj, A.; Kuceyeski, A.; Weiner, M. A network diffusion model of disease progression in dementia. Neuron 2012, 73, 1204–1215. [Google Scholar] [CrossRef]
- Hampshire, A.; Chamberlain, S.R.; Monti, M.M.; Duncan, J.; Owen, A.M. The role of the right inferior frontal gyrus: Inhibition and attentional control. Neuroimage 2010, 50, 1313–1319. [Google Scholar] [PubMed]
- Rota, G.; Sitaram, R.; Veit, R.; Erb, M.; Weiskopf, N.; Dogil, G.; Birbaumer, N. Self-regulation of regional cortical activity using real-time fMRI: The right inferior frontal gyrus and linguistic processing. Hum. Brain Mapp. 2009, 30, 1605–1614. [Google Scholar] [CrossRef]
- Luria, A.R. The Working Brain: An Introduction to Neuropsychology; Tang Long University: Hanoi, Vietnam, 1976. [Google Scholar]
- Benson, D.F. Aphasia, alexia, and agraphia. Arch. Neurol. 1980, 37, 604. [Google Scholar]
- Ojemann, G.; Mateer, C. Human language cortex: Localization of memory, syntax, and sequential motor-phoneme identification systems. Science 1979, 205, 1401–1403. [Google Scholar]
- Damasio, H.; Damasio, A.R. The anatomical basis of conduction aphasia. Brain 1980, 103, 337–350. [Google Scholar] [CrossRef]
- Frackowiak, R.; Pozzilli, C.; Legg, N.d.; Du Boulay, G.; Marshall, J.; Lenzi, G.L.; Jones, T. Regional cerebral oxygen supply and utilization in dementia. A clinical and physiological study with oxygen-15 and positron tomography. Brain A J. Neurol. 1981, 104, 753–778. [Google Scholar] [CrossRef]
- Mesulam, M.M. Large-scale neurocognitive networks and distributed processing for attention, language, and memory. Ann. Neurol. Off. J. Am. Neurol. Assoc. Child Neurol. Soc. 1990, 28, 597–613. [Google Scholar]
- Demonet, J.; Wise, R.; Frackowiak, R. Language functions explored in normal subjects by positron emission tomography: A critical review. Hum. Brain Mapp. 1993, 1, 39–47. [Google Scholar]
- Gazzaniga, M.S. Language and the cerebral hemispheres. Discuss. Neurosci. 1993, 10, 106–108. [Google Scholar]
- Paulin, M.G. The role of the cerebellum in motor control and perception. Brain Behav. Evol. 1993, 41, 39–50. [Google Scholar] [CrossRef]
- Akshoomoff, N.A.; Courchesne, E. A new role for the cerebellum in cognitive operations. Behav. Neurosci. 1992, 106, 731. [Google Scholar] [CrossRef] [PubMed]
- Botez, M.I.; Botez, T.; Elie, R.; Attig, E. Role of the cerebellum in complex human behavior. Ital. J. Neurol. Sci. 1989, 10, 291–300. [Google Scholar] [CrossRef] [PubMed]
- Buckner, R.L. The cerebellum and cognitive function: 25 years of insight from anatomy and neuroimaging. Neuron 2013, 80, 807–815. [Google Scholar] [CrossRef]
- Stoodley, C.J. The cerebellum and cognition: Evidence from functional imaging studies. Cerebellum 2012, 11, 352–365. [Google Scholar] [CrossRef] [PubMed]
- Wegiel, J.; Wisniewski, H.M.; Dziewiatkowski, J.; Badmajew, E.; Tarnawski, M.; Reisberg, B.; Mlodzik, B.; De Leon, M.J.; Miller, D.C. Cerebellar atrophy in Alzheimer’s disease—Clinicopathological correlations. Brain Res. 1999, 818, 41–50. [Google Scholar] [CrossRef] [PubMed]
- Bassett, D.S.; Sporns, O. Network neuroscience. Nat. Neurosci. 2017, 20, 353–364. [Google Scholar] [CrossRef]
- Smith, S.M.; Miller, K.L.; Salimi-Khorshidi, G.; Webster, M.; Beckmann, C.F.; Nichols, T.E.; Ramsey, J.D.; Woolrich, M.W. Network modelling methods for FMRI. Neuroimage 2011, 54, 875–891. [Google Scholar] [CrossRef]
- Friston, K.J. Functional and effective connectivity: A review. Brain Connect. 2011, 1, 13–36. [Google Scholar] [CrossRef]
- Damoiseaux, J.S.; Prater, K.E.; Miller, B.L.; Greicius, M.D. Functional connectivity tracks clinical deterioration in Alzheimer’s disease. Neurobiol. Aging 2012, 33, 828-e19. [Google Scholar] [CrossRef]


Disclaimer/Publisher’s Note: The statements, opinions and data contained in all publications are solely those of the individual author(s) and contributor(s) and not of MDPI and/or the editor(s). MDPI and/or the editor(s) disclaim responsibility for any injury to people or property resulting from any ideas, methods, instructions or products referred to in the content. |
© 2025 by the authors. Licensee MDPI, Basel, Switzerland. This article is an open access article distributed under the terms and conditions of the Creative Commons Attribution (CC BY) license (https://creativecommons.org/licenses/by/4.0/).