1. Introduction
Every ship is subject to international regulations designed by the International Maritime Organization (IMO) to reduce its environmental impact, especially in terms of greenhouse gas emissions.
One of the main regulatory tools is the Energy Efficiency Design Index (EEDI), which applies to newly built ships. This index sets a maximum limit on carbon dioxide (CO
2) emissions per ton of cargo carried per nautical mile, thereby incentivizing the design of more energy-efficient ships [
1].
For ships already in operation, the IMO has introduced the Energy Efficiency Index for Existing Ships (EEXI). Mandatory as of 2023, this index makes it possible to assess the energy efficiency of ships built before the entry into force of the EEDI and through measures such as limiting engine power or improving hull design, ships can be adapted to comply with the new regulations [
2,
3].
In addition, the Energy Efficiency Operational Indicator (EEOI), which measures the actual energy efficiency during ship operation, is used. Although its use is voluntary, it is a tool that allows shipping companies to monitor and optimize fleet energy efficiency, as it is based on actual data on fuel consumption, distance travel, and cargo carried [
4].
Another key measure is the Carbon Intensity Indicator (CII), which measures the amount of CO
2 emitted per ton of cargo transported per nautical mile. This indicator, also mandatory from 2023, ranks ships annually on a scale from A to E, the latter being the lowest. Those that obtain lower classifications are obliged to submit improvement plans with the aim of achieving continuous emission reductions [
2,
5].
Finally, the Ship Energy Efficiency Management Plan (SEEMP) is a mandatory document that sets out how each ship will manage its energy efficiency. This plan is divided into several parts: Part I contains general efficiency strategies; Part II, mandatory for ships over 5000 gross tonnage, includes emissions monitoring and reporting; and Part III, introduced together with the CII, details corrective actions and continuous improvement based on the rating obtained [
6,
7,
8].
However, it is important to note that an uncontrolled increase in energy efficiency in the shipping sector could cause the energy rebound effect, also known as the Jevons paradox. This occurs when an improvement in energy efficiency does not translate into energy savings but can instead result in a net increase in consumption. This is because energy efficiency, by reducing the cost of service, can increase demand [
9].
In this context of increasing regulation, the sector has not only focused its efforts on improving the energy efficiency of ships but has also begun to explore cleaner alternatives to traditional fossil fuels, highlighting methane, methanol, ammonia, and hydrogen as new generation fuels [
10].
LNG, composed primarily of methane, has emerged as one of the most relevant transition solutions for the decarbonization of shipping. Its use as fuel allows to significantly reduce emissions of sulfur oxides (SO
x) by almost 100%, nitrogen oxides (NO
x) by up to 85%, and CO
2 by approximately 20% compared to traditional fossil fuels [
11].
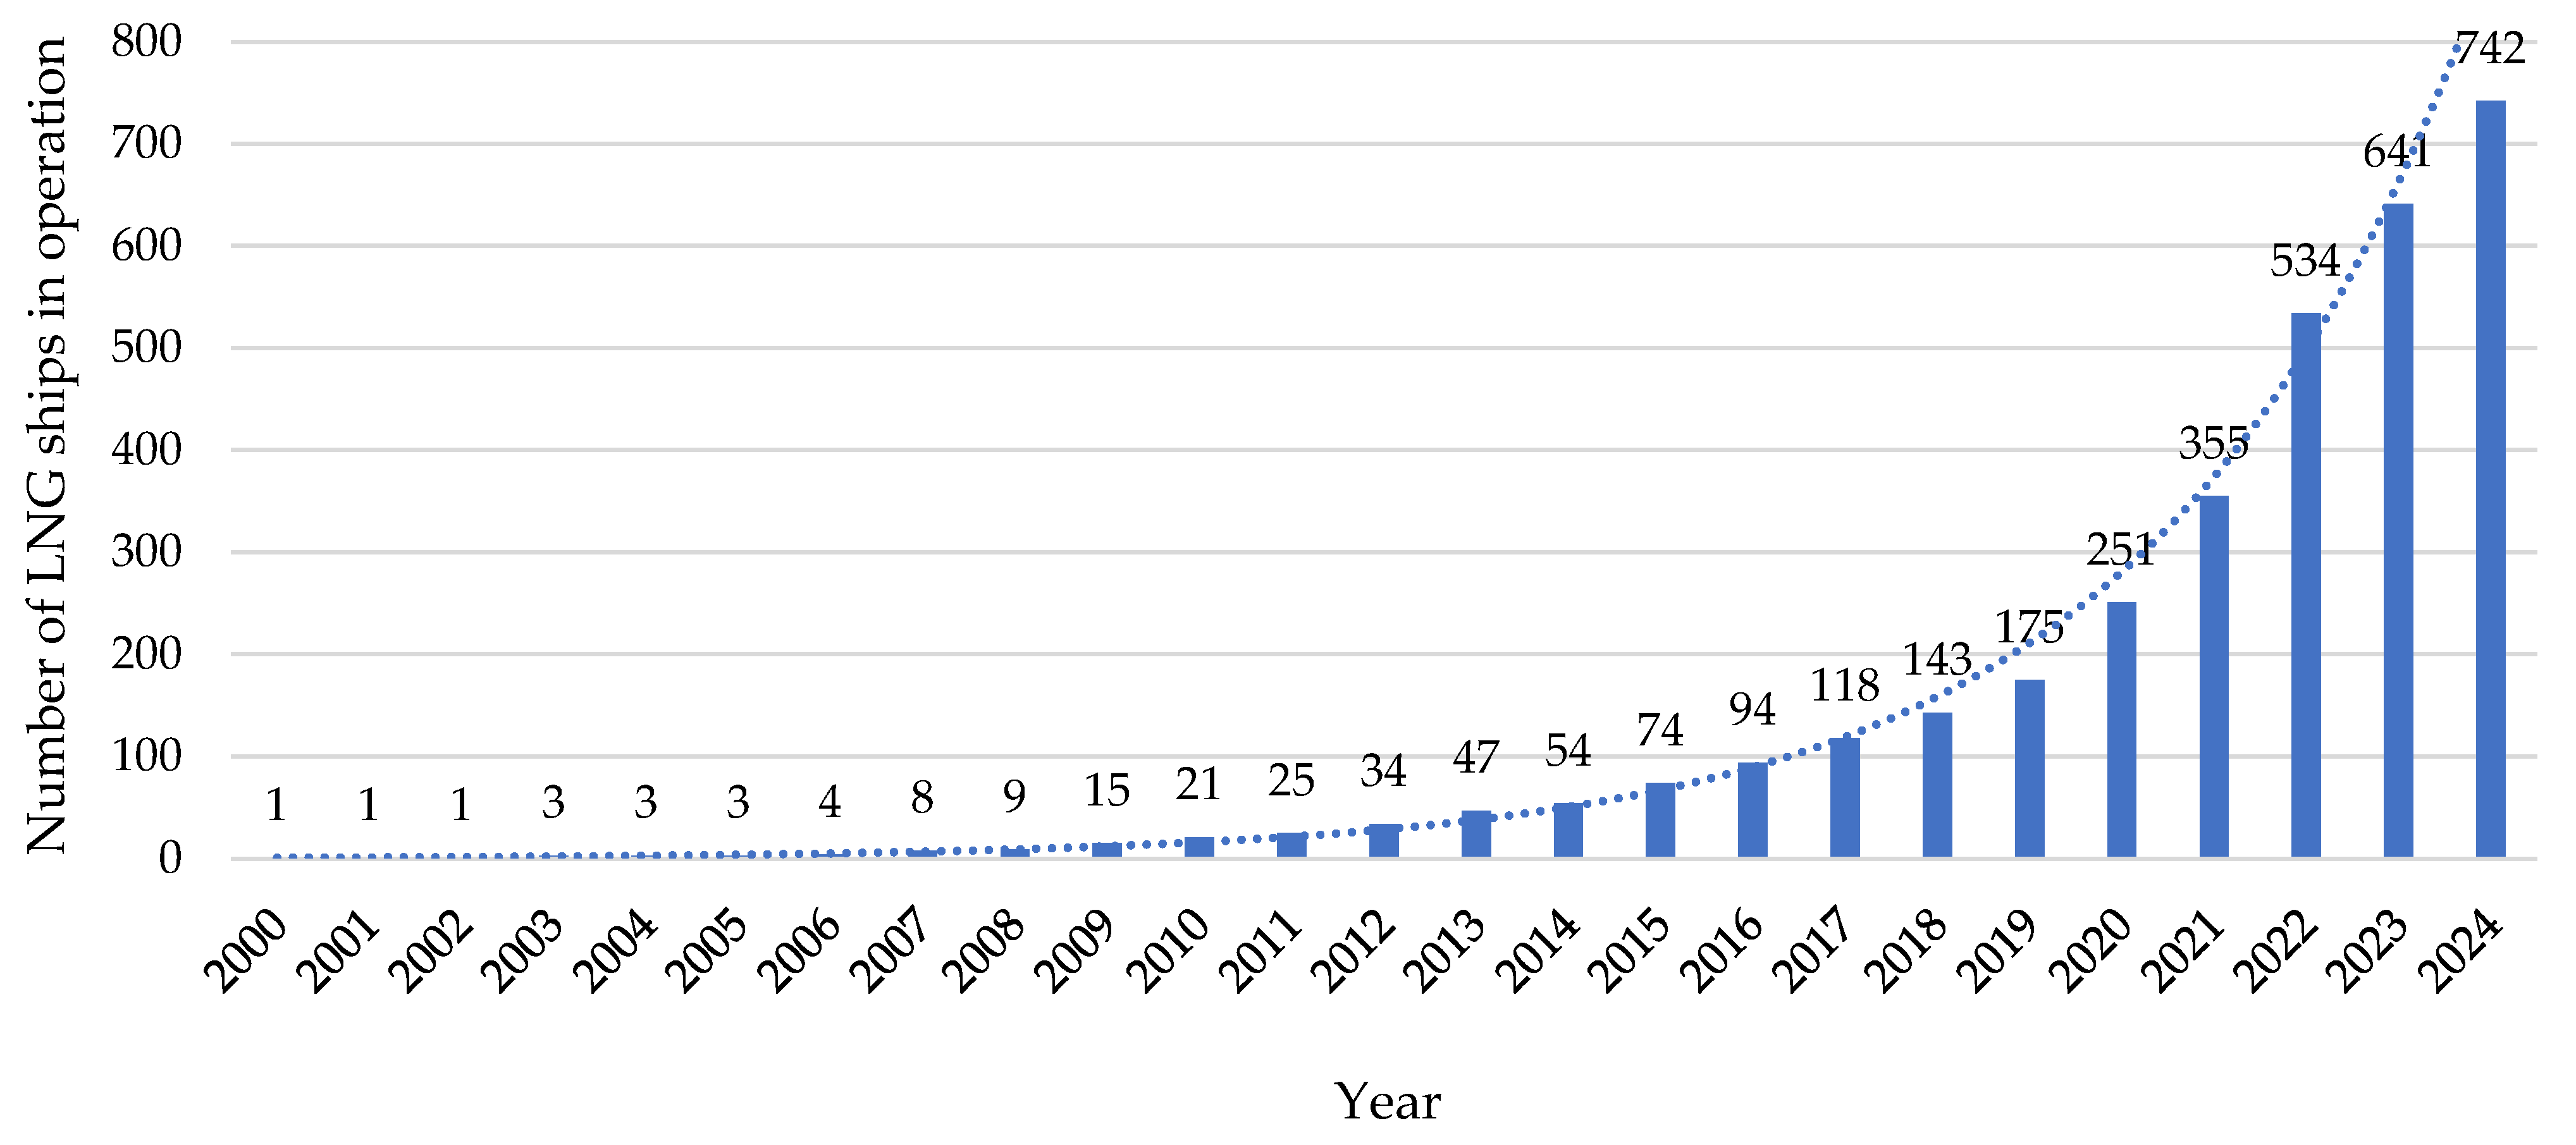
At the end of 2024, there were 742 LNG-powered vessels in operation, and based on the order book, this figure is expected to double by the end of the decade, with another four hundred on order. Over the past 25 years, the LNG market has consistently demanded vessels, as can be seen in
Figure 1 [
12].
Based on current order books, the gap between LNG supply and demand is expected to widen over the next five years. To address this challenge, measures such as the European Union (EU)’s “Fit for 55” legislative package are in place, which requires a broad network of ports to have LNG bunkering infrastructure to anticipate an increase in the availability of this fuel at European ports [
13].
In 2024, global LNG trade grew by 2.4%, reaching 411.24 million tons (MT), connecting 22 exporting countries with 48 importing markets. This growth occurred despite weak spot market demand toward the end of the year, thanks to the expansion of liquefaction capacity and increased exports from key producers such as the United States, Russia, Indonesia, and Australia. The Asia–Pacific region consolidated its position as the main exporting region, with 138.91 MT, followed by the Middle East with 94.25 MT and North America, which reached 88.64 MT after an increase of 4.11 MT year-on-year [
14].
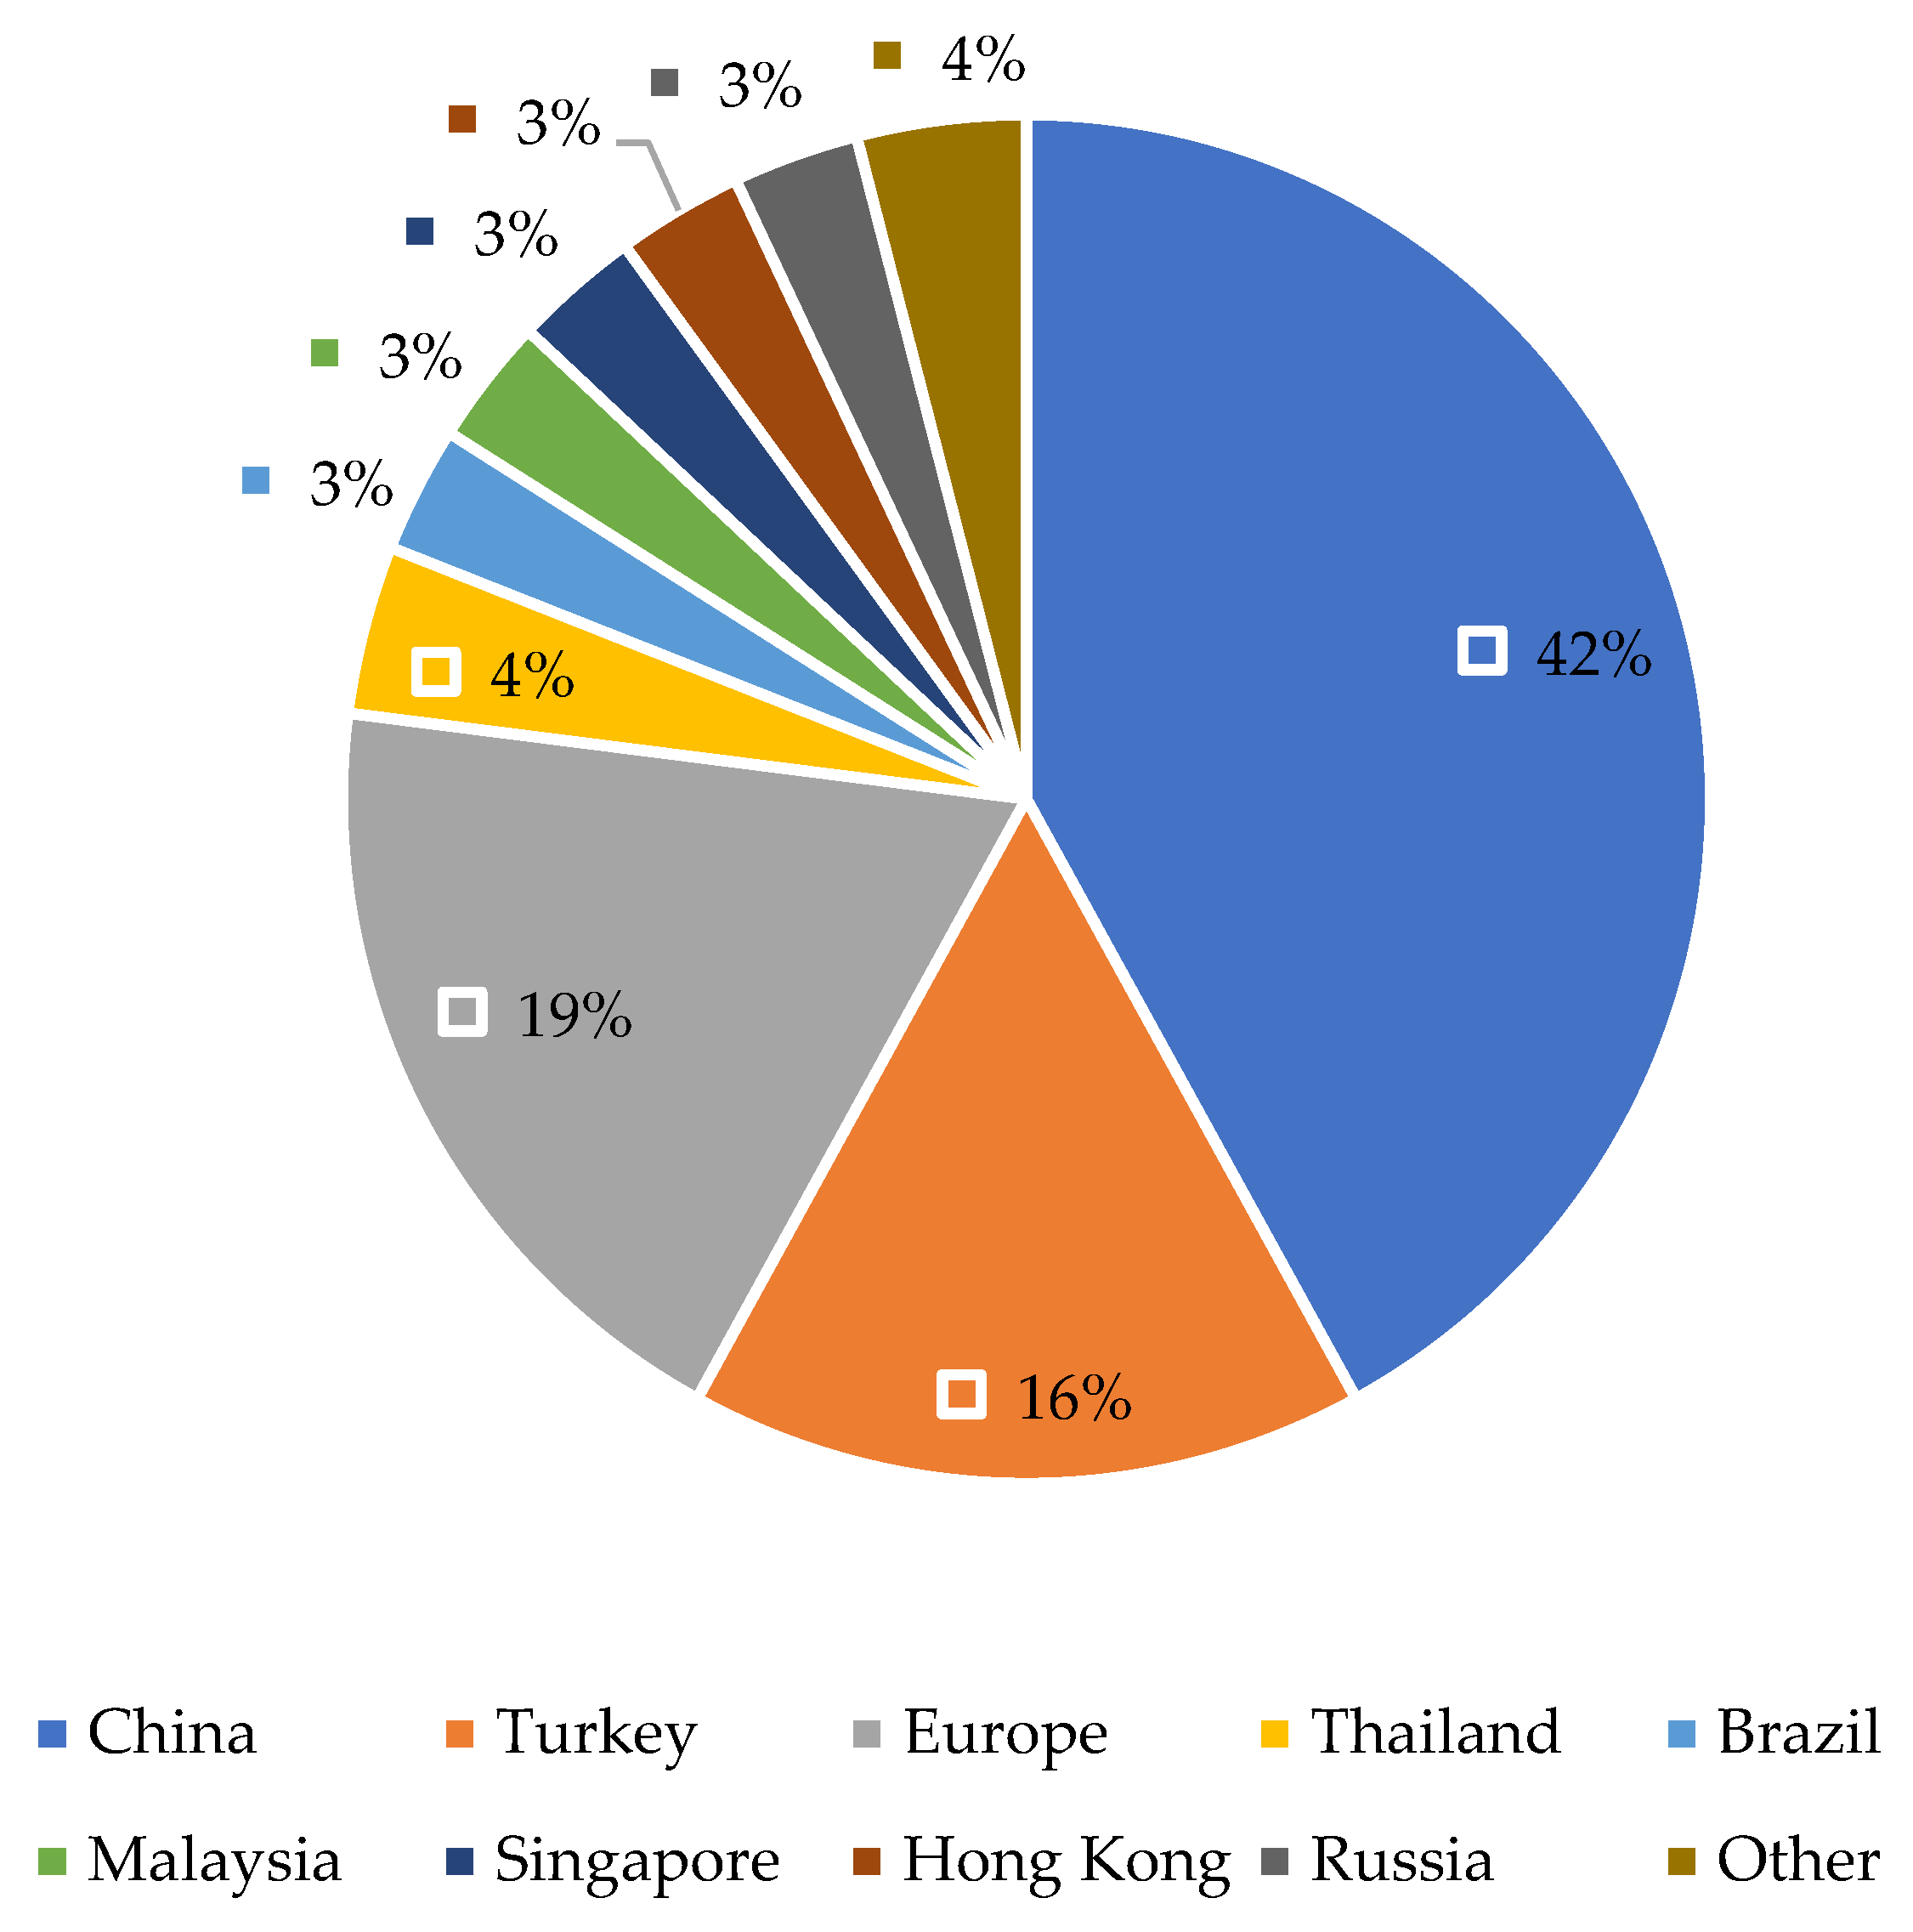
Regarding imports, represented in
Figure 2, Asia also led the growth in the last year with a year-over-year increase of 12.48 MT, reaching a total of 117.97 MT. The Asia–Pacific followed, increasing its imports by 9.77 MT to 165.09 MT. In contrast, European imports fell significantly, with a year-over-year decrease of 21.22 MT, reaching 100.07 MT. The United Kingdom recorded the largest individual decrease, with a fall of 6.48 MT, reaching 8.03 MT. France reduced its imports by 3.75 MT, Spain by 3.49 MT, and the Netherlands by 2.98 MT compared to 2023 [
14].
With all this market activity, global natural gas liquefaction capacity reached a total of 495 million tons per year in 2024, a 1.3% increase compared to the previous year. One of the highest figures in the history of this type of market [
15].
This not only demonstrates the importance of the LNG market but also demonstrates that methane is currently the leading fuel for the decarbonization of the marine sector and is expected to do so until at least 2035 [
16,
17,
18].
The incorporation of emerging technologies is redefining the landscape of methane storage in port environments. Hence, this article proposes a prospective look at the sector, highlighting the need to develop a clear methodology for calculating heat transfer in these facilities.
Natural gas is considered a transitional energy source towards a more sustainable system, although it is criticized that its infrastructure may divert resources from renewable energies. In this context, Floating Storage and Regasification Units (FSRUs) stand out for their flexibility and lower cost, which reduce the risk of obsolete investments. LNG is transported by sea at −163 °C and regasified at destination, a process that can be conducted in land-based facilities or in FSRUs. The latter integrate all the necessary equipment on a floating platform, making it especially useful in regions with infrastructure constraints or changing demands [
19].
It also highlights research into advanced cryogenic systems with the intention of improving the BOG ratios generated. The use of LNG as a fuel requires a thorough understanding of how its composition changes during prolonged storage, as it has been observed that pressure increases faster when there is less initial liquid and that the calorific value of LNG decreases by 8% after 33 days of storage [
20].
Another novelty is the implementation of digital twins to monitor and perform calculations of various stages of system operation, which is essential to improve its operation. Since heat transfer phenomena, vaporization and gas displacement take place during storage, the implementation of a digital twin on the system facilitates real-time control, failure prediction, and data-driven decision making, integrating technologies such as the Internet of Things (IoT), Big Data, or Artificial Intelligence (AI) [
21].
Both the order book and the implementation of these innovative technologies have been accompanied by an evolution in wholesale gas prices, which are summarized in
Table 1.
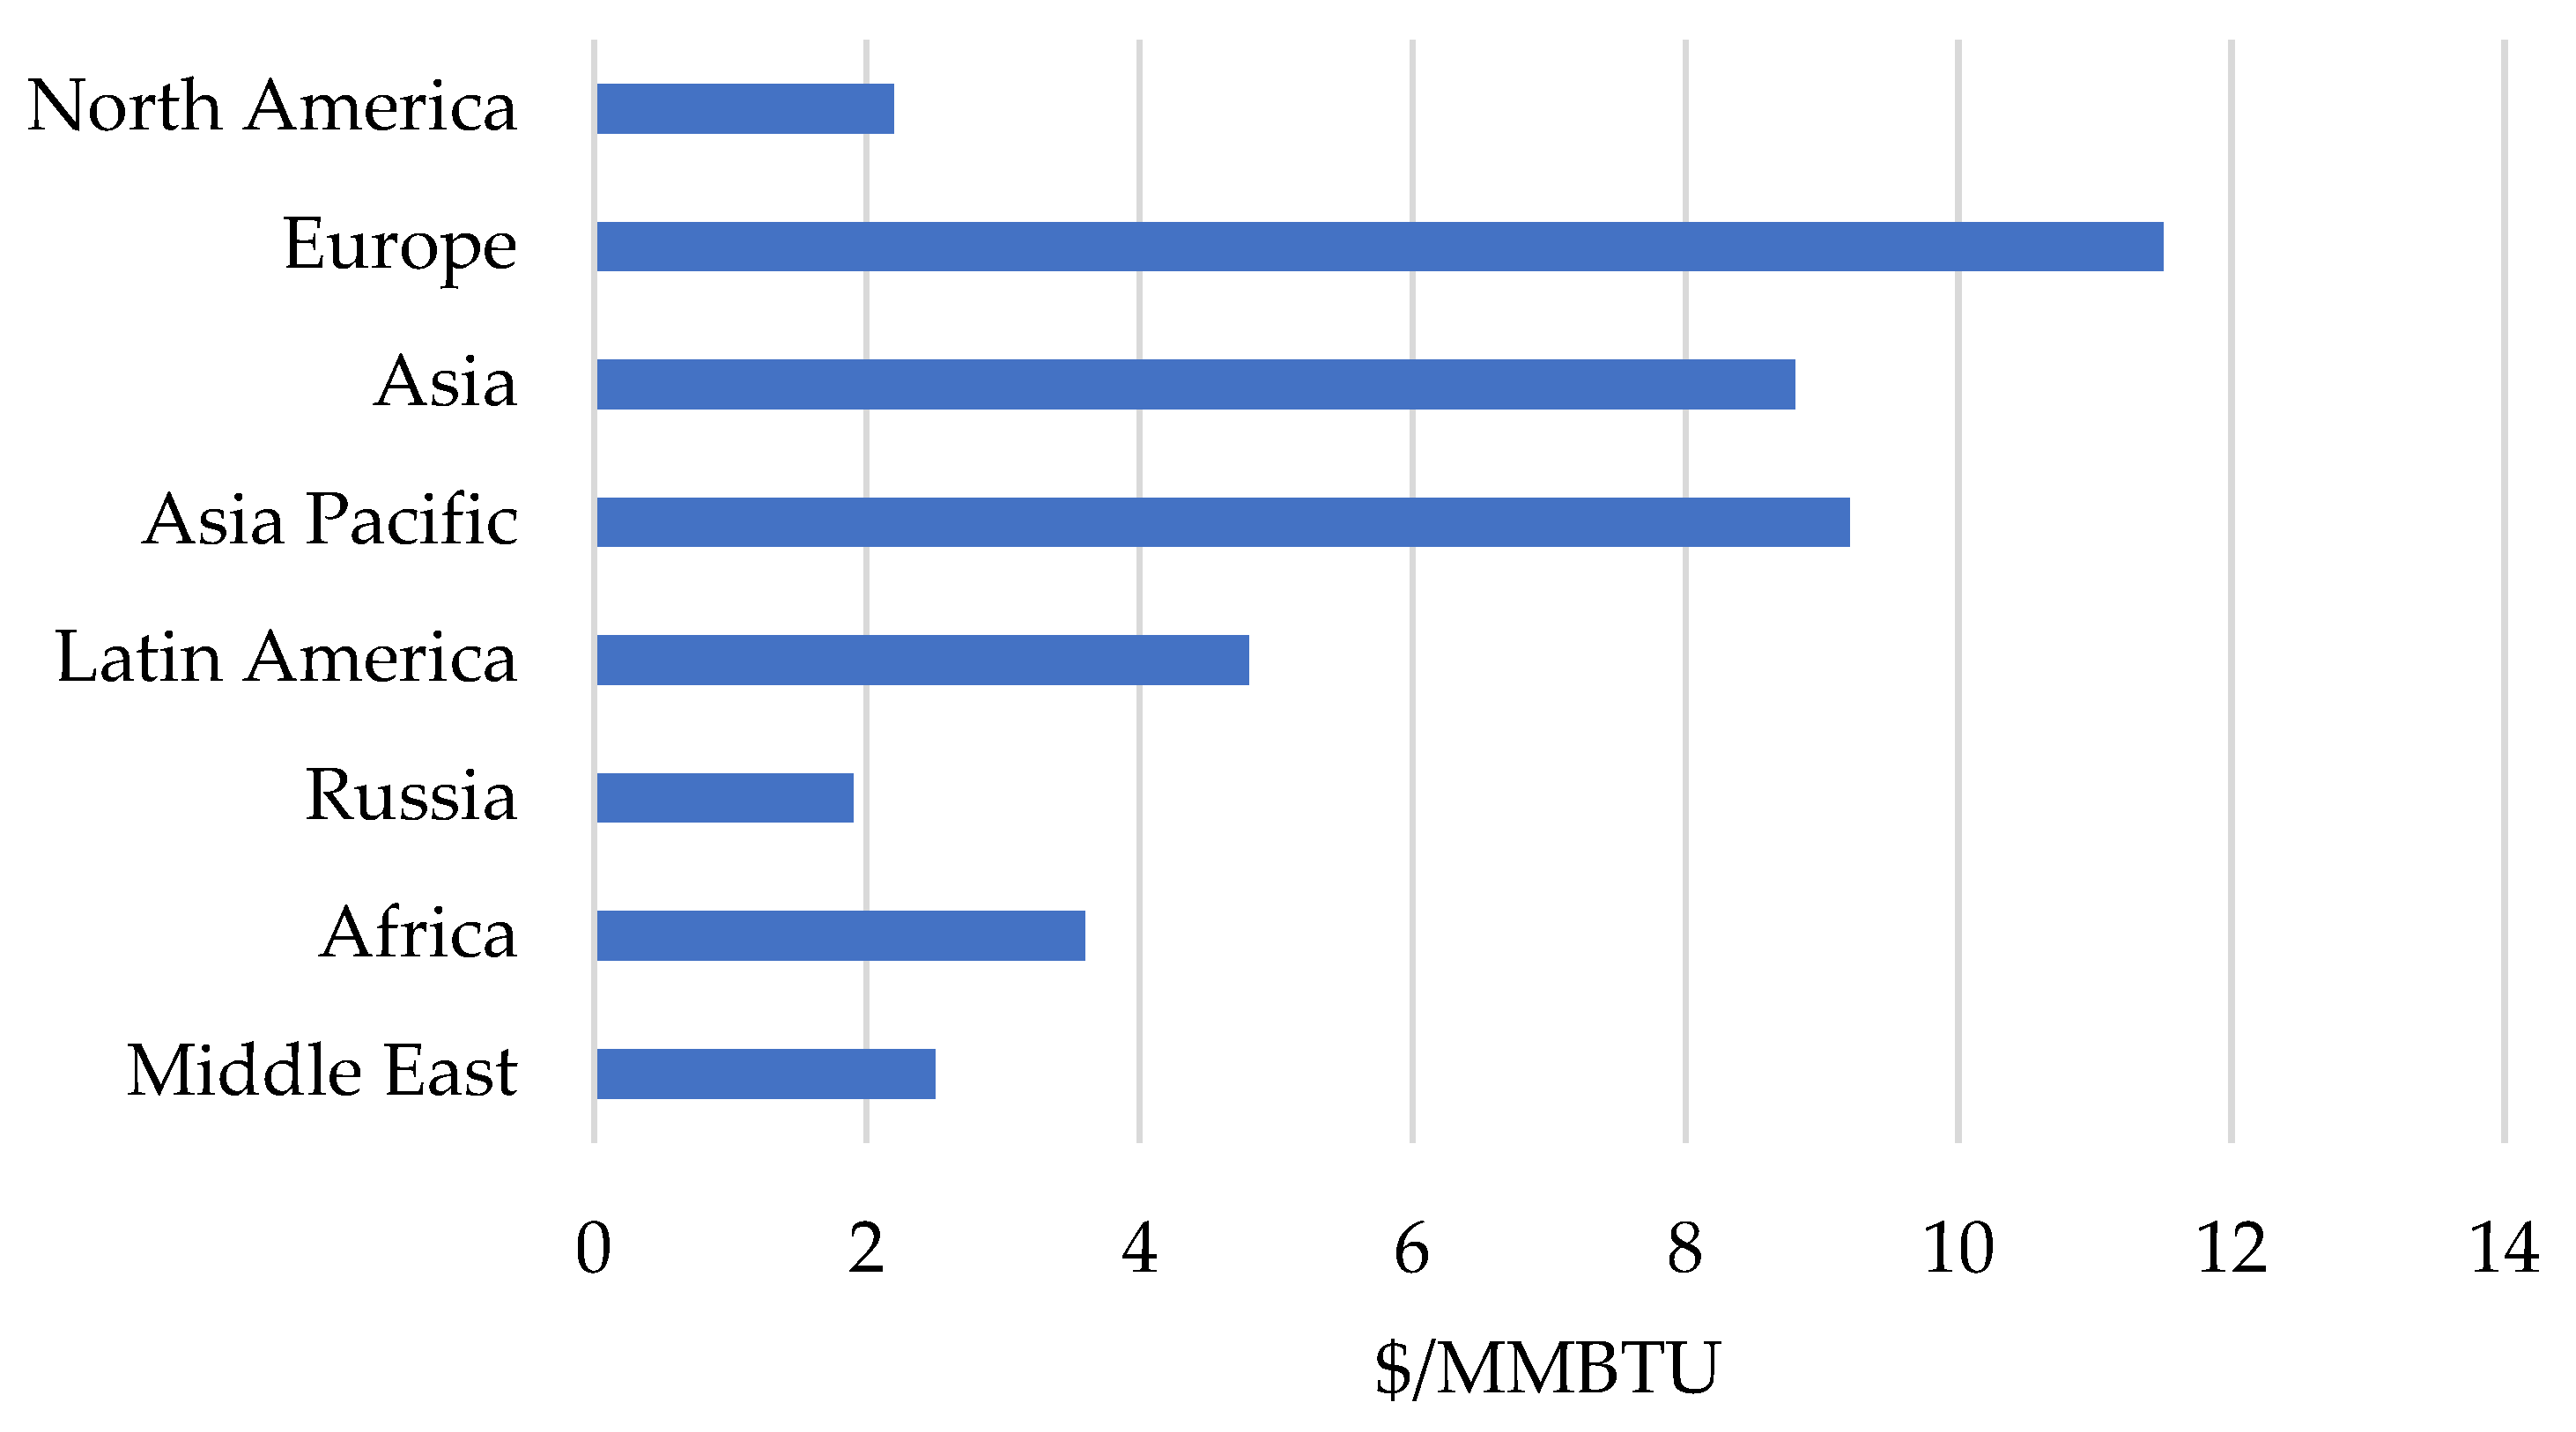
According to
Figure 3, in 2024, wholesale natural gas prices showed large variability at the global level, reflecting both market conditions and the prevailing pricing mechanisms in each region [
22].
Europe was positioned as the region with the highest prices, reaching an average of USD 11.52 per MMBTU (Million British Thermal Units), due to its strong exposure to spot prices. In contrast, the Asia–Pacific and Asia recorded more moderate prices of USD 9.19 and USD 8.76 per MMBTU, respectively, thanks to the predominance of the OPE mechanism, which dampens market fluctuations.
In North America and Russia, prices were notably lower, even below those observed in Latin America, Africa, and the Middle East, reflecting both the abundance of resources and the competitive dynamics of the market.
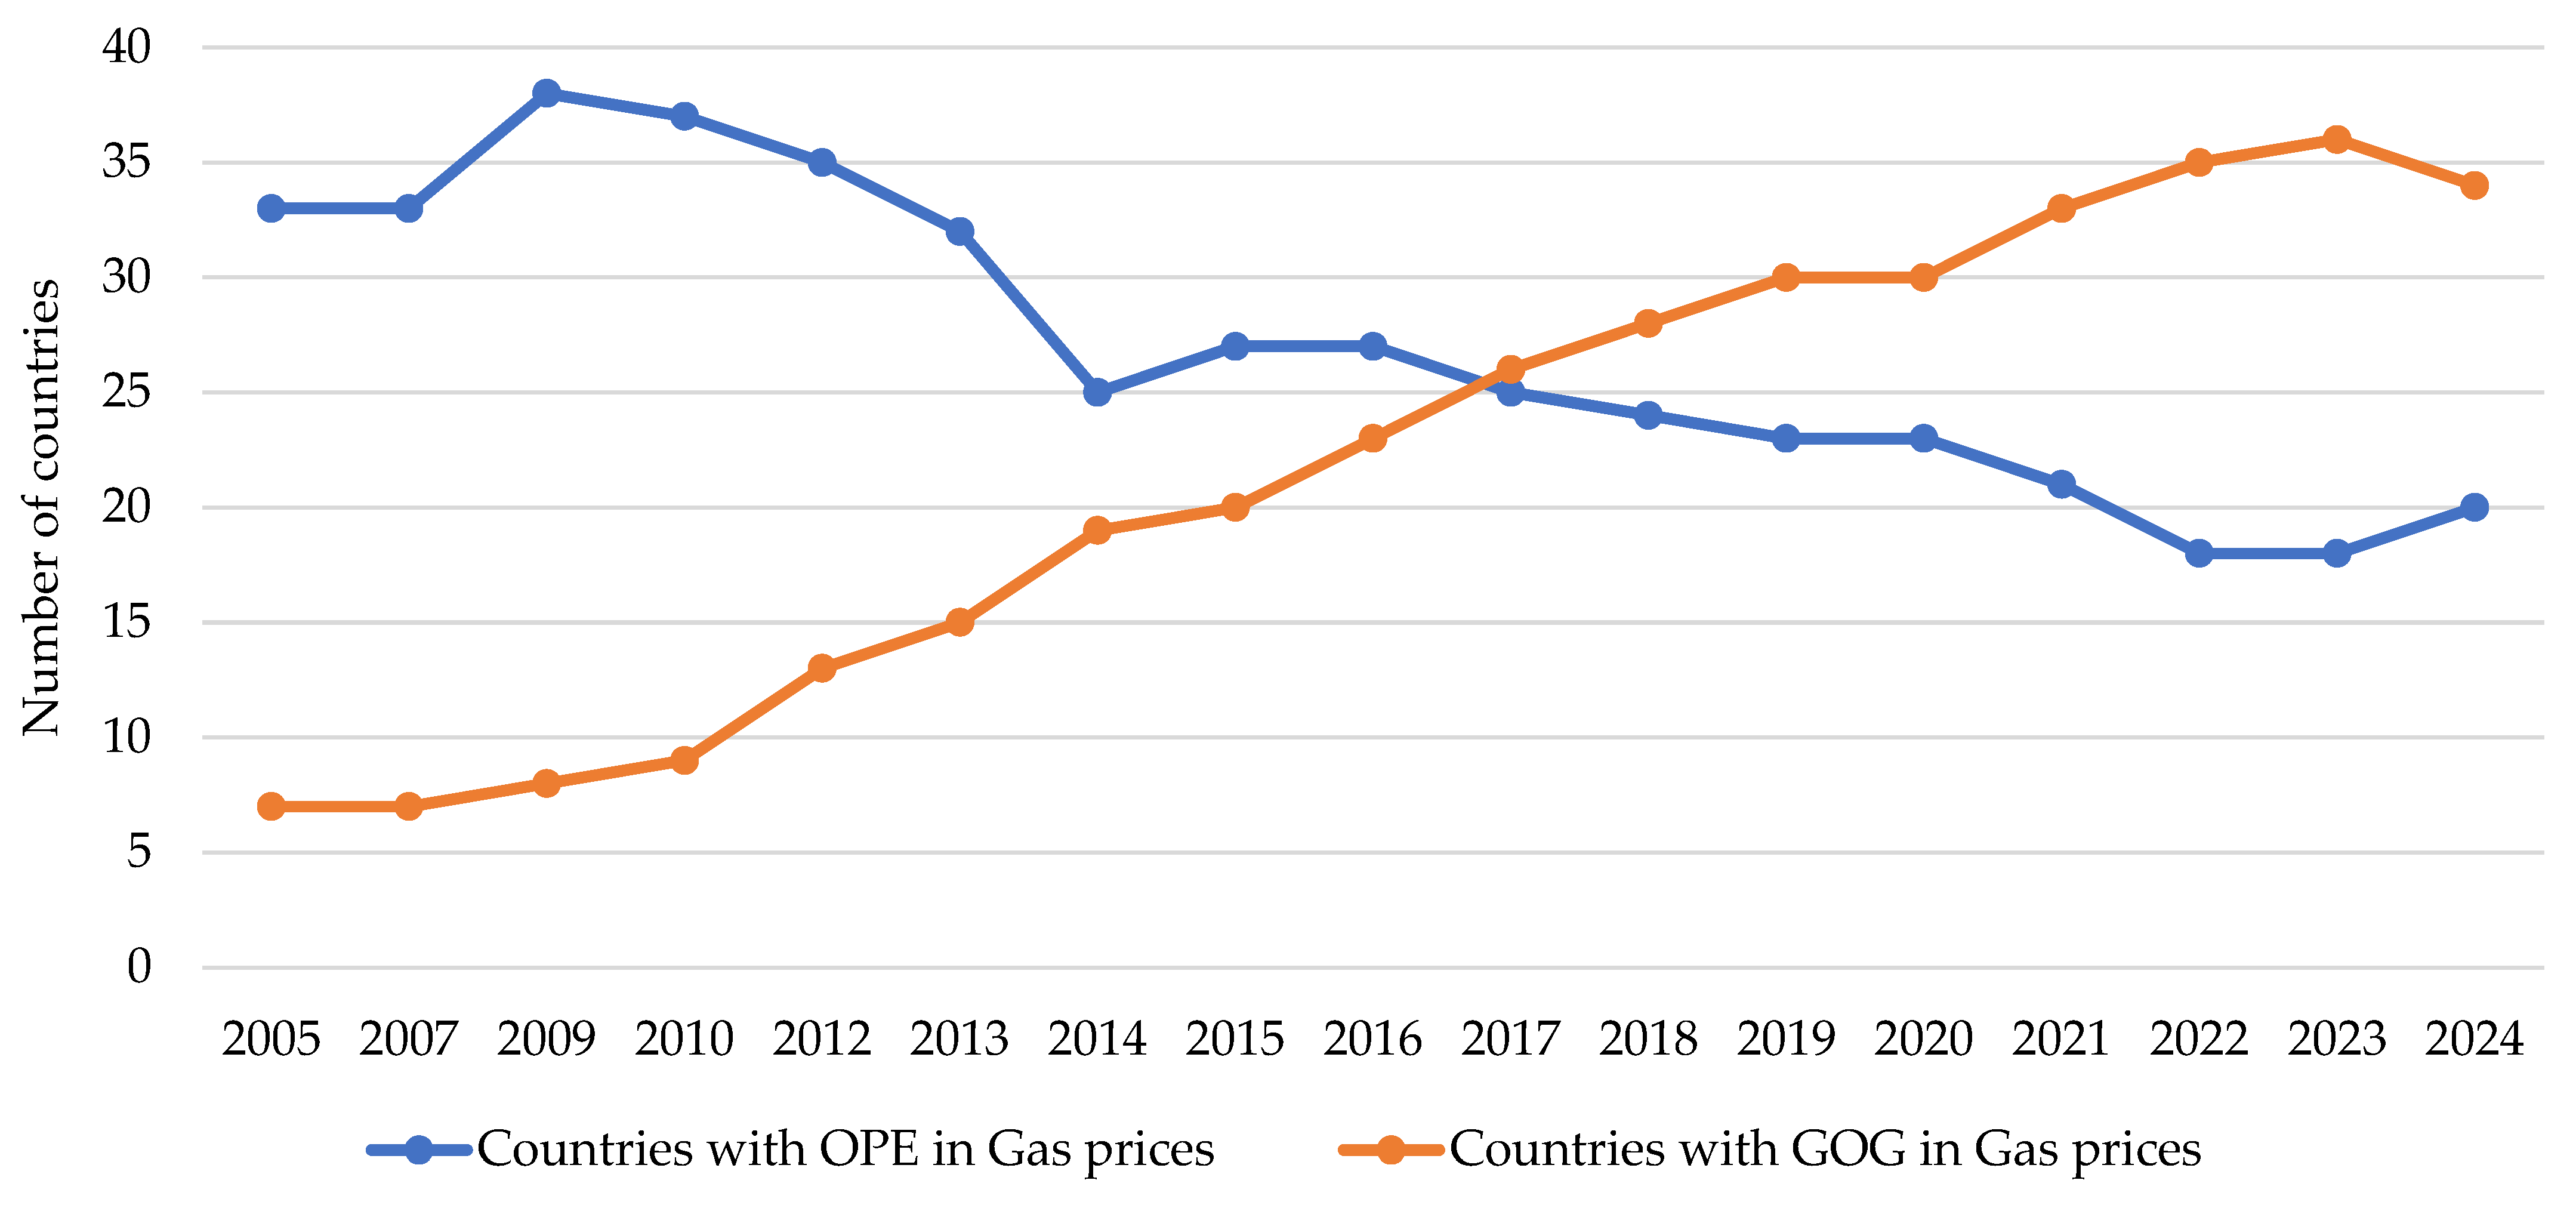
Assessing the historical context over a period like that in
Figure 1, between 2005 and 2024, the number of markets with GOG-based gas prices has grown, showing further price convergence until 2020, although this was reduced between 2021 and 2023 by rising prices in Europe, partially recovering in 2024 with the fall in spot prices shown in
Figure 4 [
22].
Since 2013, the number of markets in which most of the gas consumed is priced using the GOG mechanism has grown steadily. In the early years, this group was too small and volatile to allow robust statistical analysis, but from that year onwards, the sample became large and stable enough to calculate a representative coefficient of variation. This coefficient, which measures the relative dispersion of prices, remained consistently below the average of all countries with market-related prices and even approached the level of convergence observed in countries with EPO prices until 2020.
This behavior reflected an increasing integration of GOG markets into the global system, driven by the expansion of gas HUBs, the development of LNG trading, and the liberalization of national markets.
However, between 2021 and 2022, this trend reversed. The global energy crisis, triggered by the Russian invasion of Ukraine and the resulting disruption of gas supplies to Europe, caused an abrupt spike in GOG prices, especially in European HUBs. This widened the convergence gap with the OPE countries, whose prices, being indexed to oil, reacted more slowly and with less volatility.
In 2023, although spot prices remained high, the situation began to stabilize. However, the difference between the GOG and OPE groups remained.
2. Operation of a Typical Installation
Natural gas is extracted from underground reservoirs and undergoes a treatment process to remove impurities such as water, carbon dioxide, and heavy metals. The treated gas can then be distributed either through the onshore pipeline network or be transported to a liquefaction plant, where it is cooled to −163 °C, liquefying it to reduce its volume and facilitate long-distance transport by ship [
23].
Upon arrival at its destination, the LNG is unloaded at regasification terminals, where it is converted from liquid to gas and introduced into the distribution network. Typically, the onshore gas system consists of a core network, secondary transmission networks, distribution networks, storage facilities, and other complementary facilities [
24].
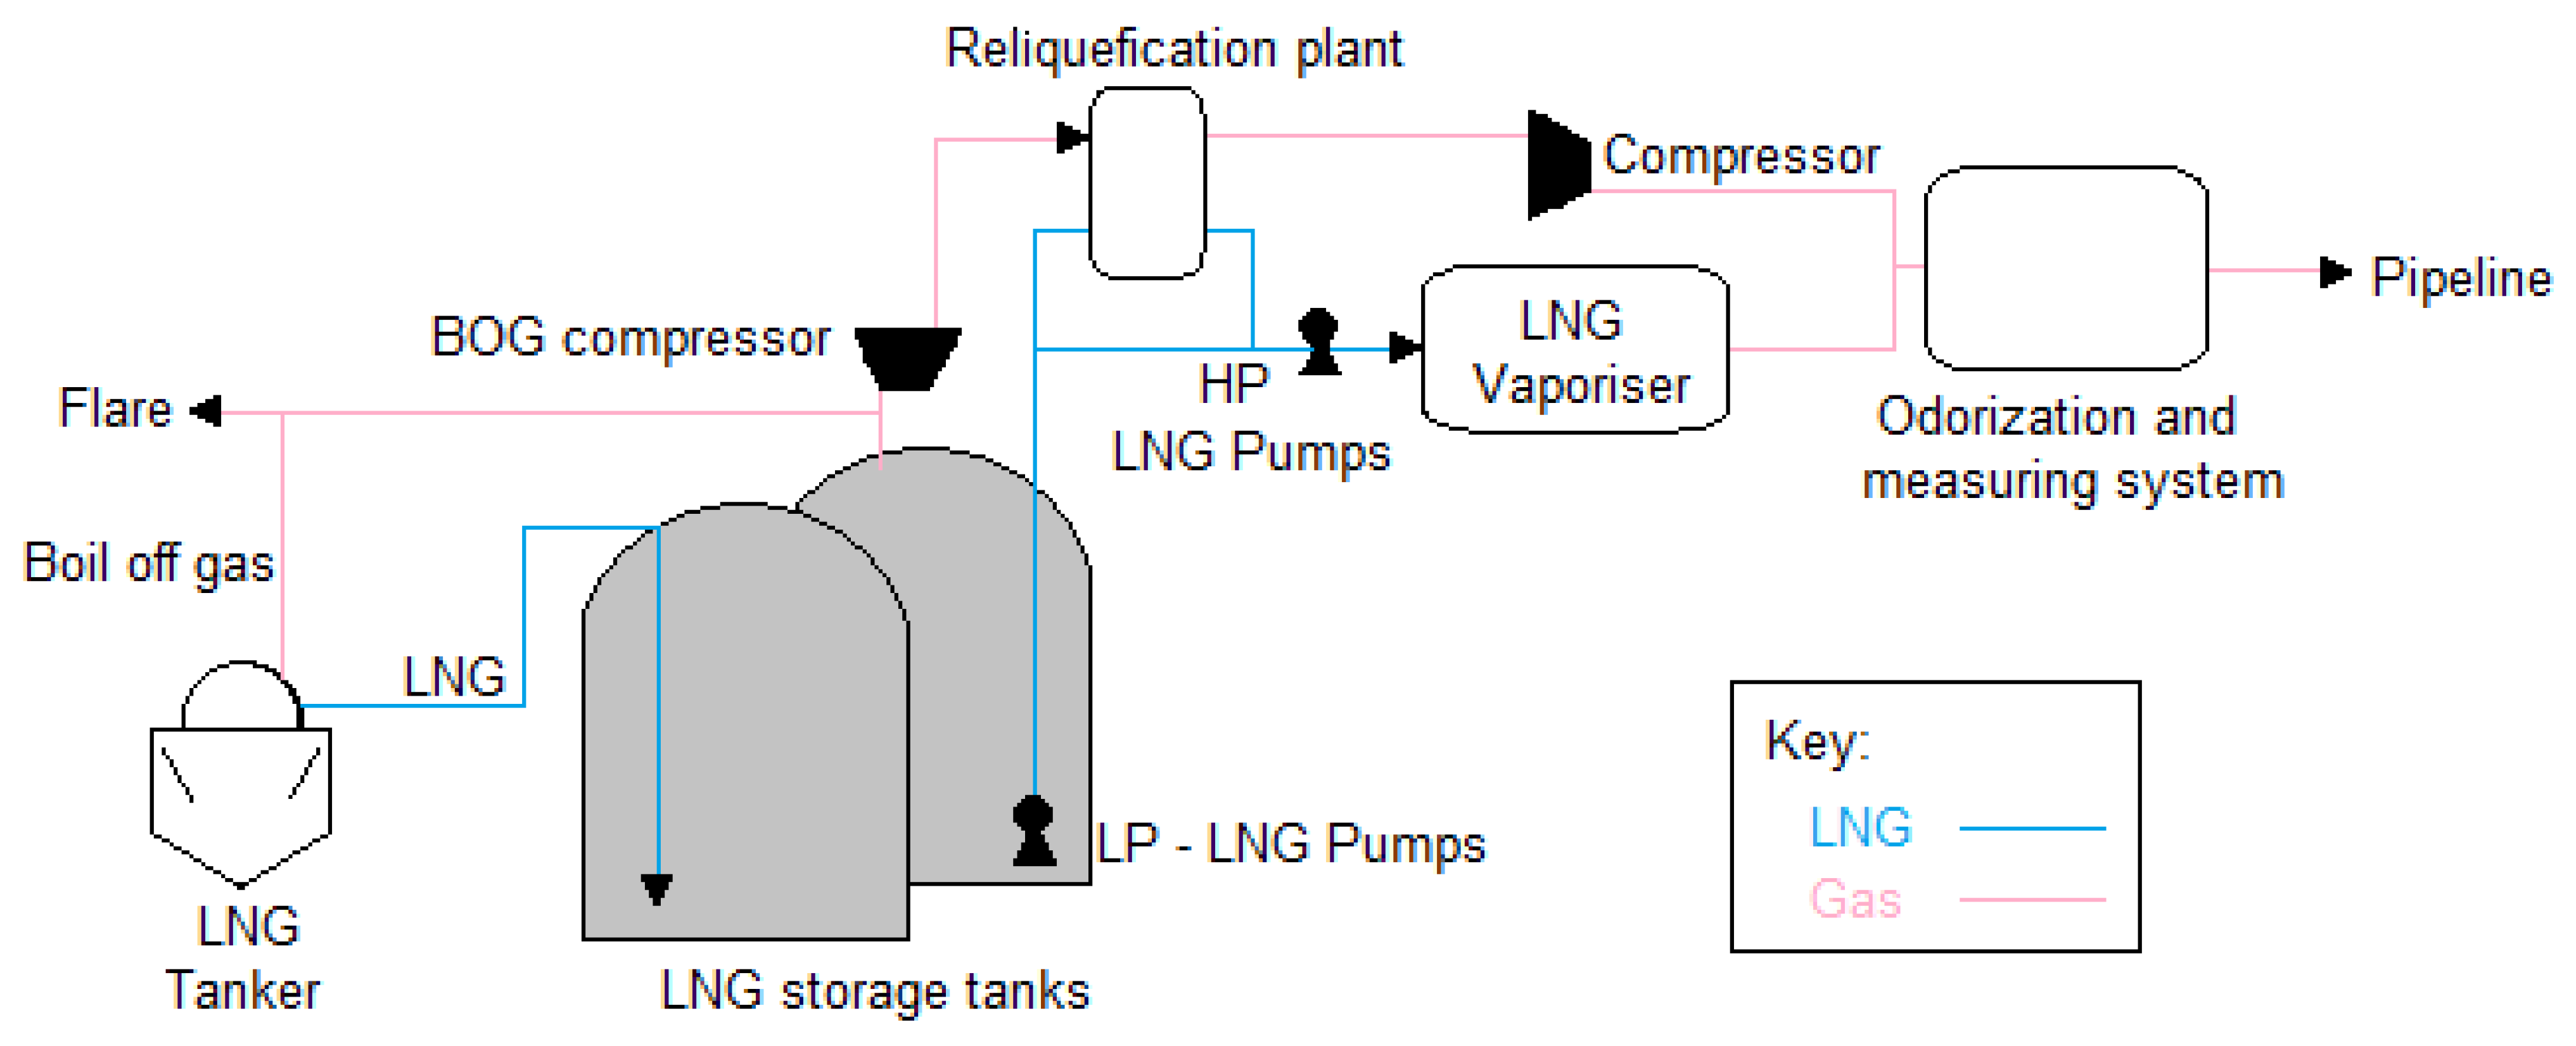
Regasification plants typically have a similar infrastructure: unloading dock, storage tanks with pumping equipment, BOG management system, vaporization system, and tanker loading areas, as shown in
Figure 5.
The system is designed for a fixed flow rate that allows the vessel’s cargo to be transferred through a jetty (unloading arms) to the storage tanks at a temperature similar to the storage temperature. As a rule, the vessel’s own pumps are used for unloading operations.
Following the diagram in
Figure 5, the connections are made from the vessel’s manifold to the jetty, where the loading/unloading hoses and connections are located. These allow the transfer of both LNG and BOG through liquid and vapor lines, ensuring a stable temperature under predetermined conditions. These lines are made of low-carbon stainless steel, coated with thermal insulation, and are double-walled.
During the loading/unloading operation, the tank pressure is regulated to maintain it above the LNG saturation pressure. Once the LNG passes through the jetty connections, it is introduced into the tanks through two lines, one with a larger diameter than the other. The one with the smallest diameter is responsible for keeping the system cool while no discharges are made with the LNG recirculation.
The main larger-diameter supply line can be split to go to different storage tanks, while the secondary, or smaller-diameter, line maintains the cold by circulating LNG from the collector to the docking area and the return from the reliquefied.
The cargo then reaches the storage tanks. Its external structure is made of concrete and carbon steel, and its internal structure is constructed of 9% nickel-plated steel. Furthermore, the upper part has an anti-splash plate, and the lower part has a standpipe to prevent stratification [
24].
The connections entering or exiting the tank are in the dome and have systems to oversee vacuum or overpressure conditions through safety valves. This area also includes a collector that connects the storage tanks, through which the generated BOG is sent to the compressors, the vent area, or the jetty.
Once the cargo is stored, when there is demand, regasification begins. It is pumped from the bottom of the tank to the reliquefied, and secondary pumps send the LNG to the vaporization system for subsequent change in state, treatment, and delivery to the grid.
The regasification system consists of the following:
Low-pressure pumps (primary pumps): These are equipment installed inside the tank and are used to cool the lines, supply vaporizers, or directly supply the tanker truck loading area.
High-pressure pumps (secondary pumps): These pumps are responsible for pumping from the reliquefied to the vaporization area.
Vaporizer systems: These can be Open-Rack Vaporizers (ORVs), which vaporize the LNG with seawater as a hot thermal source, or Submerged Combustion Vaporizers (SCVs), which burn BOG or regasified natural gas to heat the LNG and change its state.
In addition to regasification as a change in state of LNG, BOG generation occurs inside storage tanks, both onboard and onshore. During unloading, the liquid level in the onshore tanks increases, creating a displacement of vapor, while the level in the vessel’s tanks decreases, creating a pressure drop. To avoid a vacuum inside the vessel’s tanks, some of the vapor displaced from the tanks is sent to the ship.
When the regasification plant is operating, BOG is compensated by the high delivery rate of the supply, and the tank pressure is controlled by starting the compressors for delivery to the reliquefied.
The BOG control system consists of compressors, reliquefication plant, combustor, venting system, metering station, and odorization system.
It is important to highlight the role played by the reliquefication plant in this type of facility, as it allows BOG to be recovered during the storage process instead of consuming it or sending it to the grid.
This system prevents the stored gas from being released into the atmosphere when there is no demand. Its performance depends on several parameters such as the temperature of the salt water, the pre-cooling of BOG during the compression stage, the inlet temperature of BOG at the reliquefication plant, the vapor fraction at the end of the expansion, the nitrogen pressure level, and the temperature before expansion [
26].
3. Methodology
Despite the advances in the design and operation of LNG storage tanks, there is a methodological gap in the methods for their estimation focused on two main groups: a calculation using percentage estimates of generation based on the analysis of real facilities and a calculation using the analysis of the mass and energy balance of the storage tanks [
27,
28].
Firstly, the heat transfer that causes the daily BOG generation will be calculated. For this purpose, the following methodologies used in other publications, the heat transfer by conduction, convection, and radiation will be analyzed, according to the established studies, defining Equations (1)–(3) [
24,
29].
To apply Equations (1)–(3), the principles of Kirchhoff’s laws, commonly used in the analysis of electrical circuits and which can be extrapolated to thermal phenomena since electrical resistances are, in turn, thermal resistances [
24], are used.
For the calculation of BOG, two different methodologies will be used to establish a comparison. On the one hand, method one, numerical calculation using pre-established criteria for safety margins [
30], and, on the other hand, method two, the direct application of the mass and energy balance [
24].
For both methods, the calculations will be conducted with the EES (Engineering Equation Solve, Madison, WI, USA,) software and the transfer through the walls will be analyzed with Solid Works Simulation (SWS, Waltham, MA, USA).
For the calculation based on pre-established criteria, the first step is to calculate the net contribution to BOG generation. At this point, the displacement of the gas when filling the tank by the piston effect will be calculated, subtracting the volume that a primary pump of each tank extracts to maintain the minimum emission of the plant. The gas generation in each storage tank is due to heat gain from outside and the BOG generation in the ship for the same reason will also be calculated.
For the net contributions to BOG generation (
M1), this is given in Equation (4):
where
is the LNG discharge flow rate;
is the primary pump flow rate; and
is the density at storage conditions.
Equation (5) is used to calculate the gas generation in each storage tank due to heat gain from outside (
M1):
where
is the mass of gas to evaporate, and
is the latent heat of methane.
For the calculation of the BOG generation in the vessel (M3), Equation (5) will be used, adapted to this specific case, similar to the calculation of the system’s net gas demand (D), for which Equation (4) will be used, also adapted accordingly.
This results in Equation (6) for the BOG flow calculation:
For the calculations with the EES, the mass and energy balance in the storage system is based on the standard balance Equation (7).
The situation to be analyzed is a fuel storage tank where there is a liquid and a vapor state (if applicable, BOG), both in an initial state which, by generating a heat transfer with the environment (
), causes the vapor volume to increase in a final state, with no work generated (
) nor any variation in input mass with respect to time (
), the output mass in this balance being the mass generated by the heat transfer [
29].
In addition, a steady state is established as a condition, with a closed control volume and no mass exchange, and, in comparison with the variation in the internal energy in thermodynamic systems, the potential and kinetic energies can be considered negligible. Thus, Equation (8) is obtained as the balance:
where
is the heat transfer is generated is obtained by means of the calculation to be performed with the EES software;
is the mass flow value;
is its internal energy; and
h its enthalpy.
4. Approach and Calculation
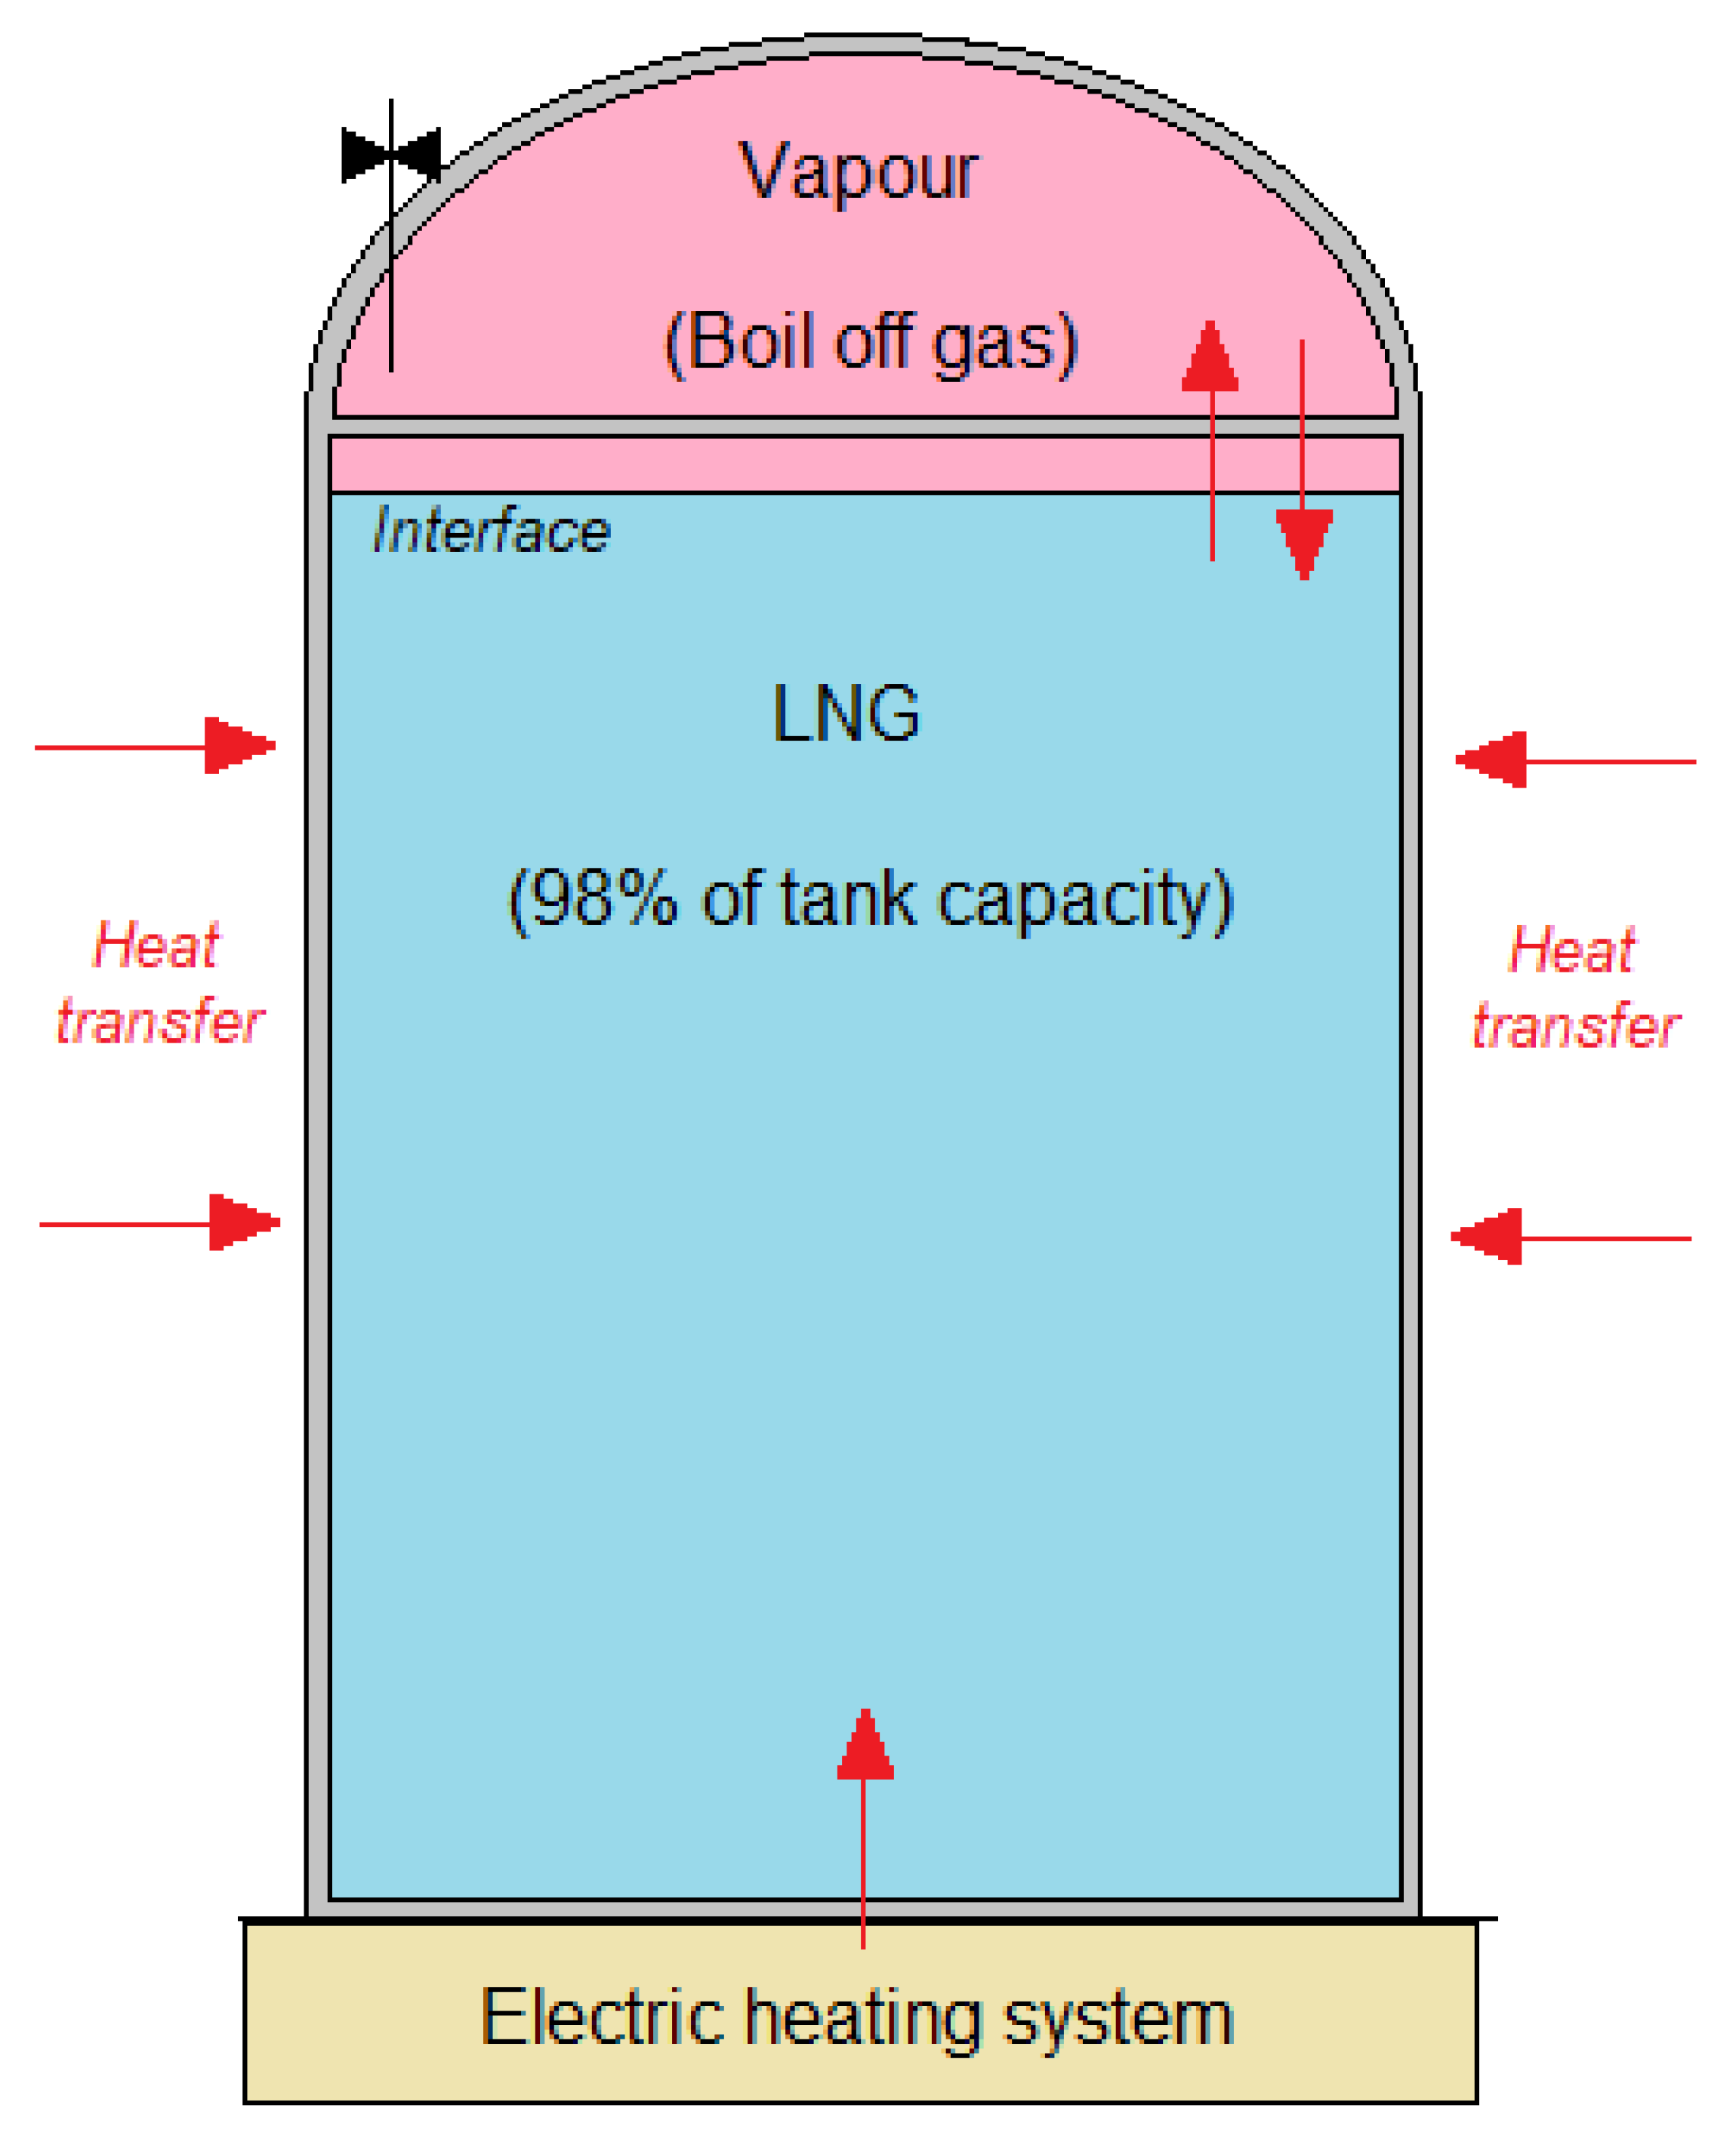
According to
Figure 6, the LNG storage inside the tank is a mixture of the liquid LNG in the lower layer of the tank, BOG generated and contained in the upper part, and the border area between the two, known as the interface. This tank receives heat from the outside, giving rise to the appearance of BOG that is stored in its upper part, and it will be the exit located in this area where the mass of BOG generated will be calculated.
The values of the main characteristics are in
Table 2.
Regarding the different coatings that make up this type of tank, the standards API 620 (Design and Construction of Large Welded Low Pressure Storage Tanks) and EN 1473:2021 (Installation and Equipment for Liquefied Natural Gas: Design of Onshore Installations) are applied [
32,
33].
The tank structure is as follows:
Floor: designed to minimize thermal transfer from the ground to the LNG. It consists of multiple layers of concrete, high density glass fiber blocks (HLBs), bituminous felt, glass fiber, and sand leveling layers.
In application of Equations (4)–(6) and the principles of Kirchhoff’s laws, convention, radiation, and conduction are represented as electrical resistances.
According to
Figure 7, in the case of the tank base, R1 is the ground conduction, R2, R5, and R8 the concrete conduction, R3 and R6 the foam conduction, R4 and R7 the felt conduction, R9 the inner tank steel conduction, and R10 the LNG convection.
Walls: It has a multi-layer insulation system that includes the outer concrete wall, rigid polyurethane–polyisocyanurate barriers, a space filled with expanded perlite, and elastic fiberglass blankets separating the perlite from the inner tank.
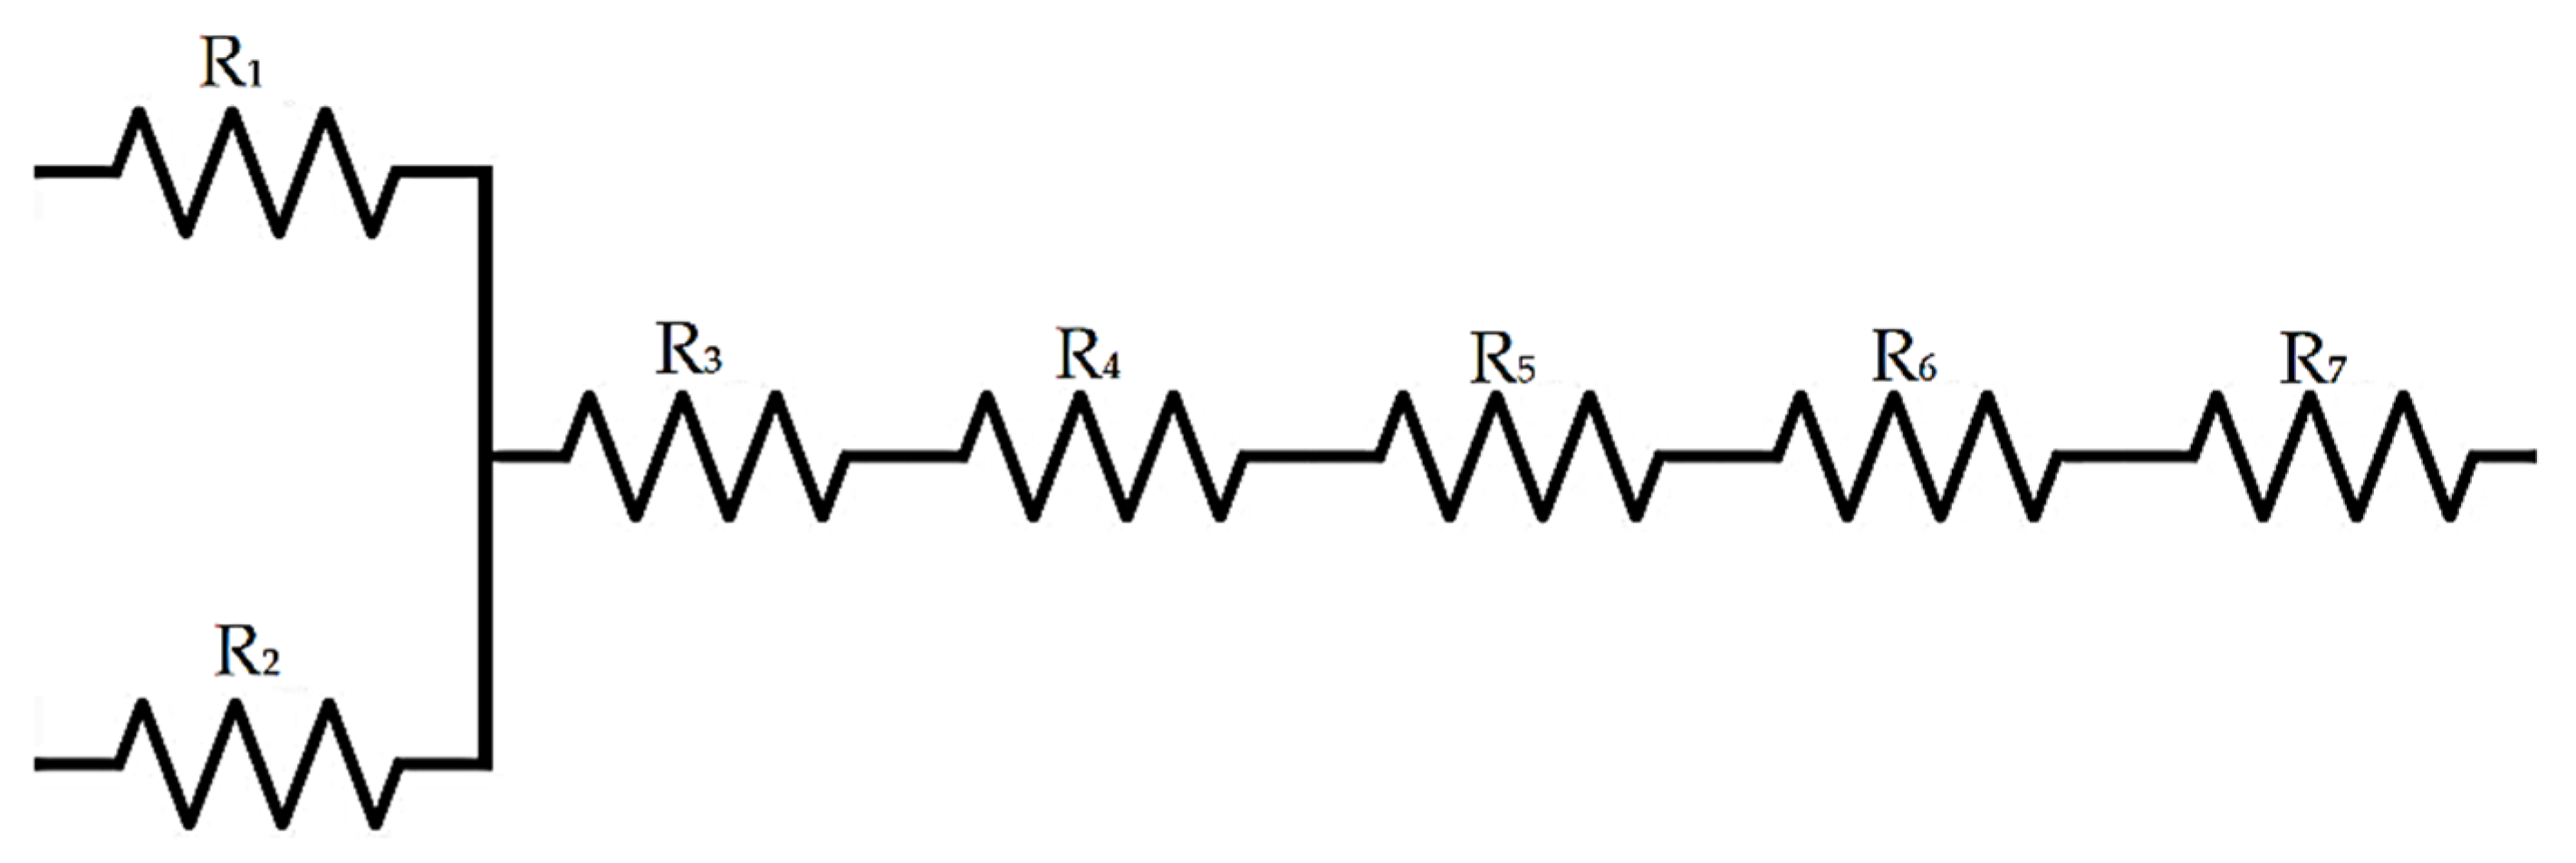
According to
Figure 8, in the case of the tank wall, R1 is the external convection and R2 the solar radiation, R3, the conduction of the concrete, R4 the conduction of the perlite, R5 the conduction of the elastic mantle, R6 the conduction of the inner tank steel, and R7 the convection of the LNG. In this case, the whole wall has been taken into consideration, assuming that the tank is filled to its maximum capacity (98%) to apply in R7 the properties of the LNG.
According to
Figure 9, in the case of the tank dome, R1 is the external convection and R2 the solar radiation, R3, the concrete conduction, R4 the elastic mantle conduction, R5 the inner tank steel conduction, and R6 the BOG convection, since the dome area is only in contact with the vapor phase.
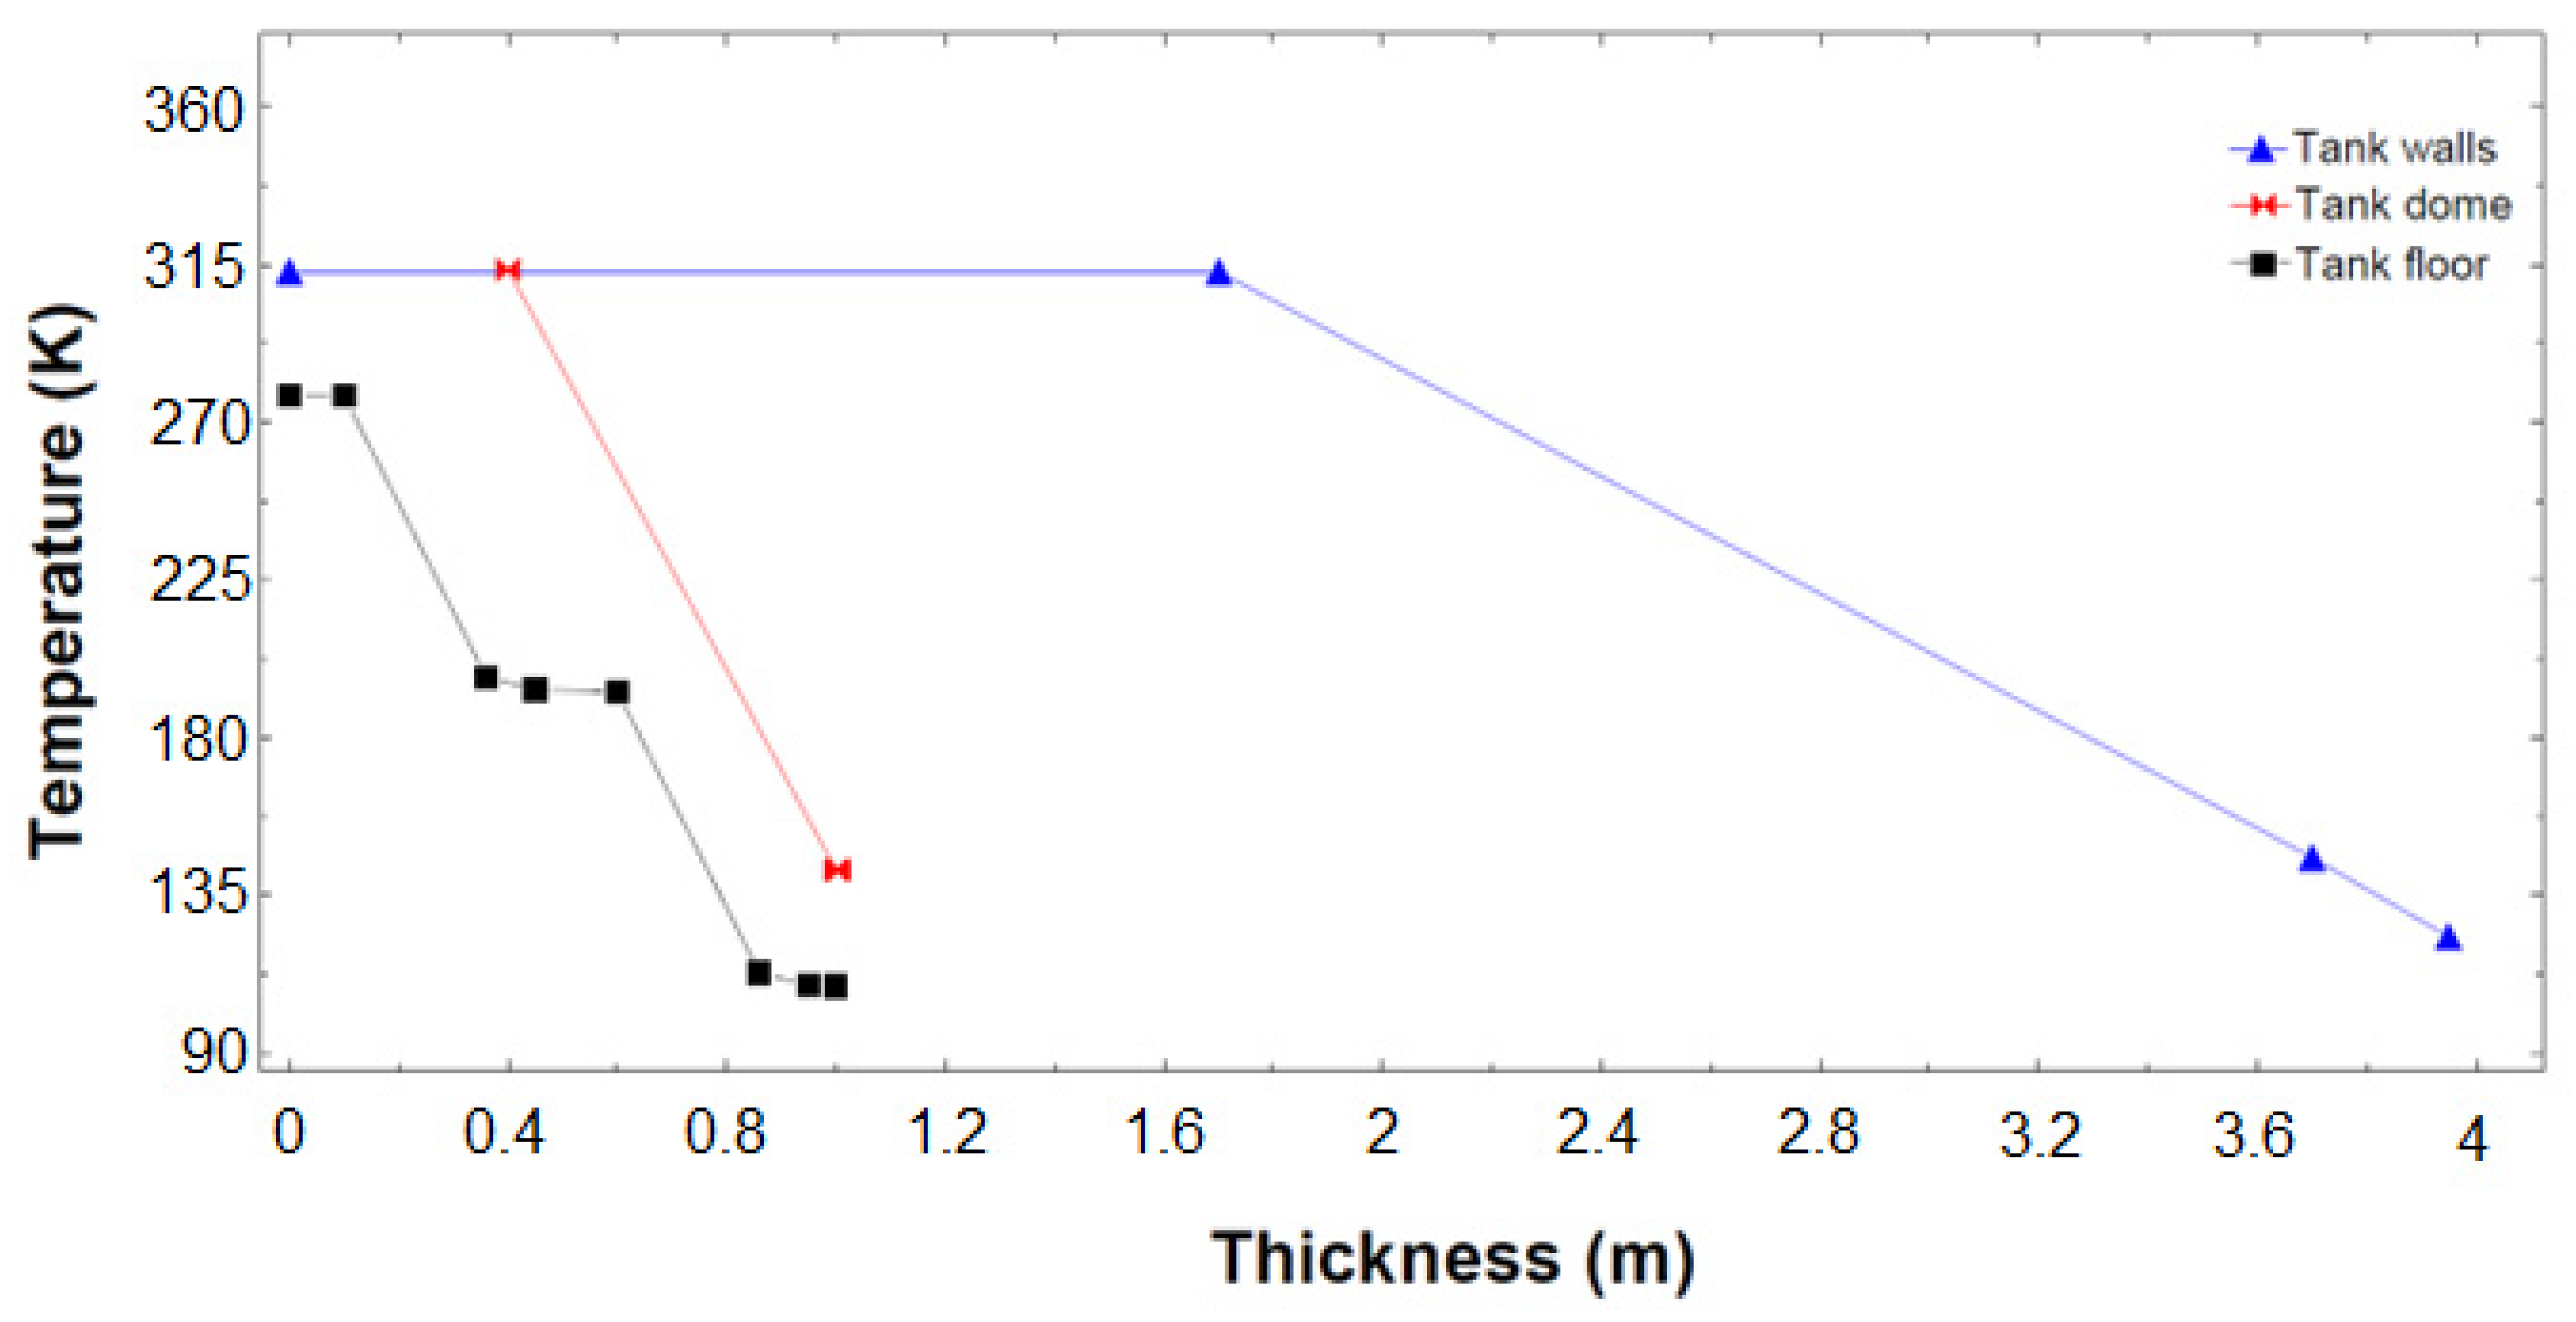
According to
Figure 10, it can be seen how the temperature evolves as a function of the insulation layers of the tank. The black line represents the insulation of the tank floor, which is the one with the largest thermal jumps. Two large jumps related to the layers of high-density glass fibers can be highlighted, which absorb the largest thermal jump, similar to what happens with the walls, where the largest jump takes place in the perlite.
The lowest parts of
Figure 10 correspond to the inner face of the storage tank, the highest points being the outer face of the tank. From this it can be seen that while at the base of the tank, a differentiation between a primary and a secondary barrier can be observed; this differentiation does not exist either in the walls or in the dome, with the same element supporting the greatest thermal gradient, be it perlite in the case of the walls or fiberglass in the case of the dome.
The transfer ranges for the base of a tank and its walls are less than 20 W/m
2 in the case of the base, and between 1 and 10 W/m
2 in the case of the walls and the dome [
31].
According to
Table 3, the values obtained in comparison are within the ranges, except in the case of the dome.
It should be noted that in the case of the walls, it is at the limit of the established margins, so it would be important to adopt some measure to reduce heat transfer in the tanks analyzed in this article. Similarly, in the case of the dome, the limit of 10 W/m2 is exceeded. In this case, the dome is only made up of concrete and fiberglass plates, and it is necessary to adopt covering measures either after construction or during construction with additional insulation, in the same way as for the walls.
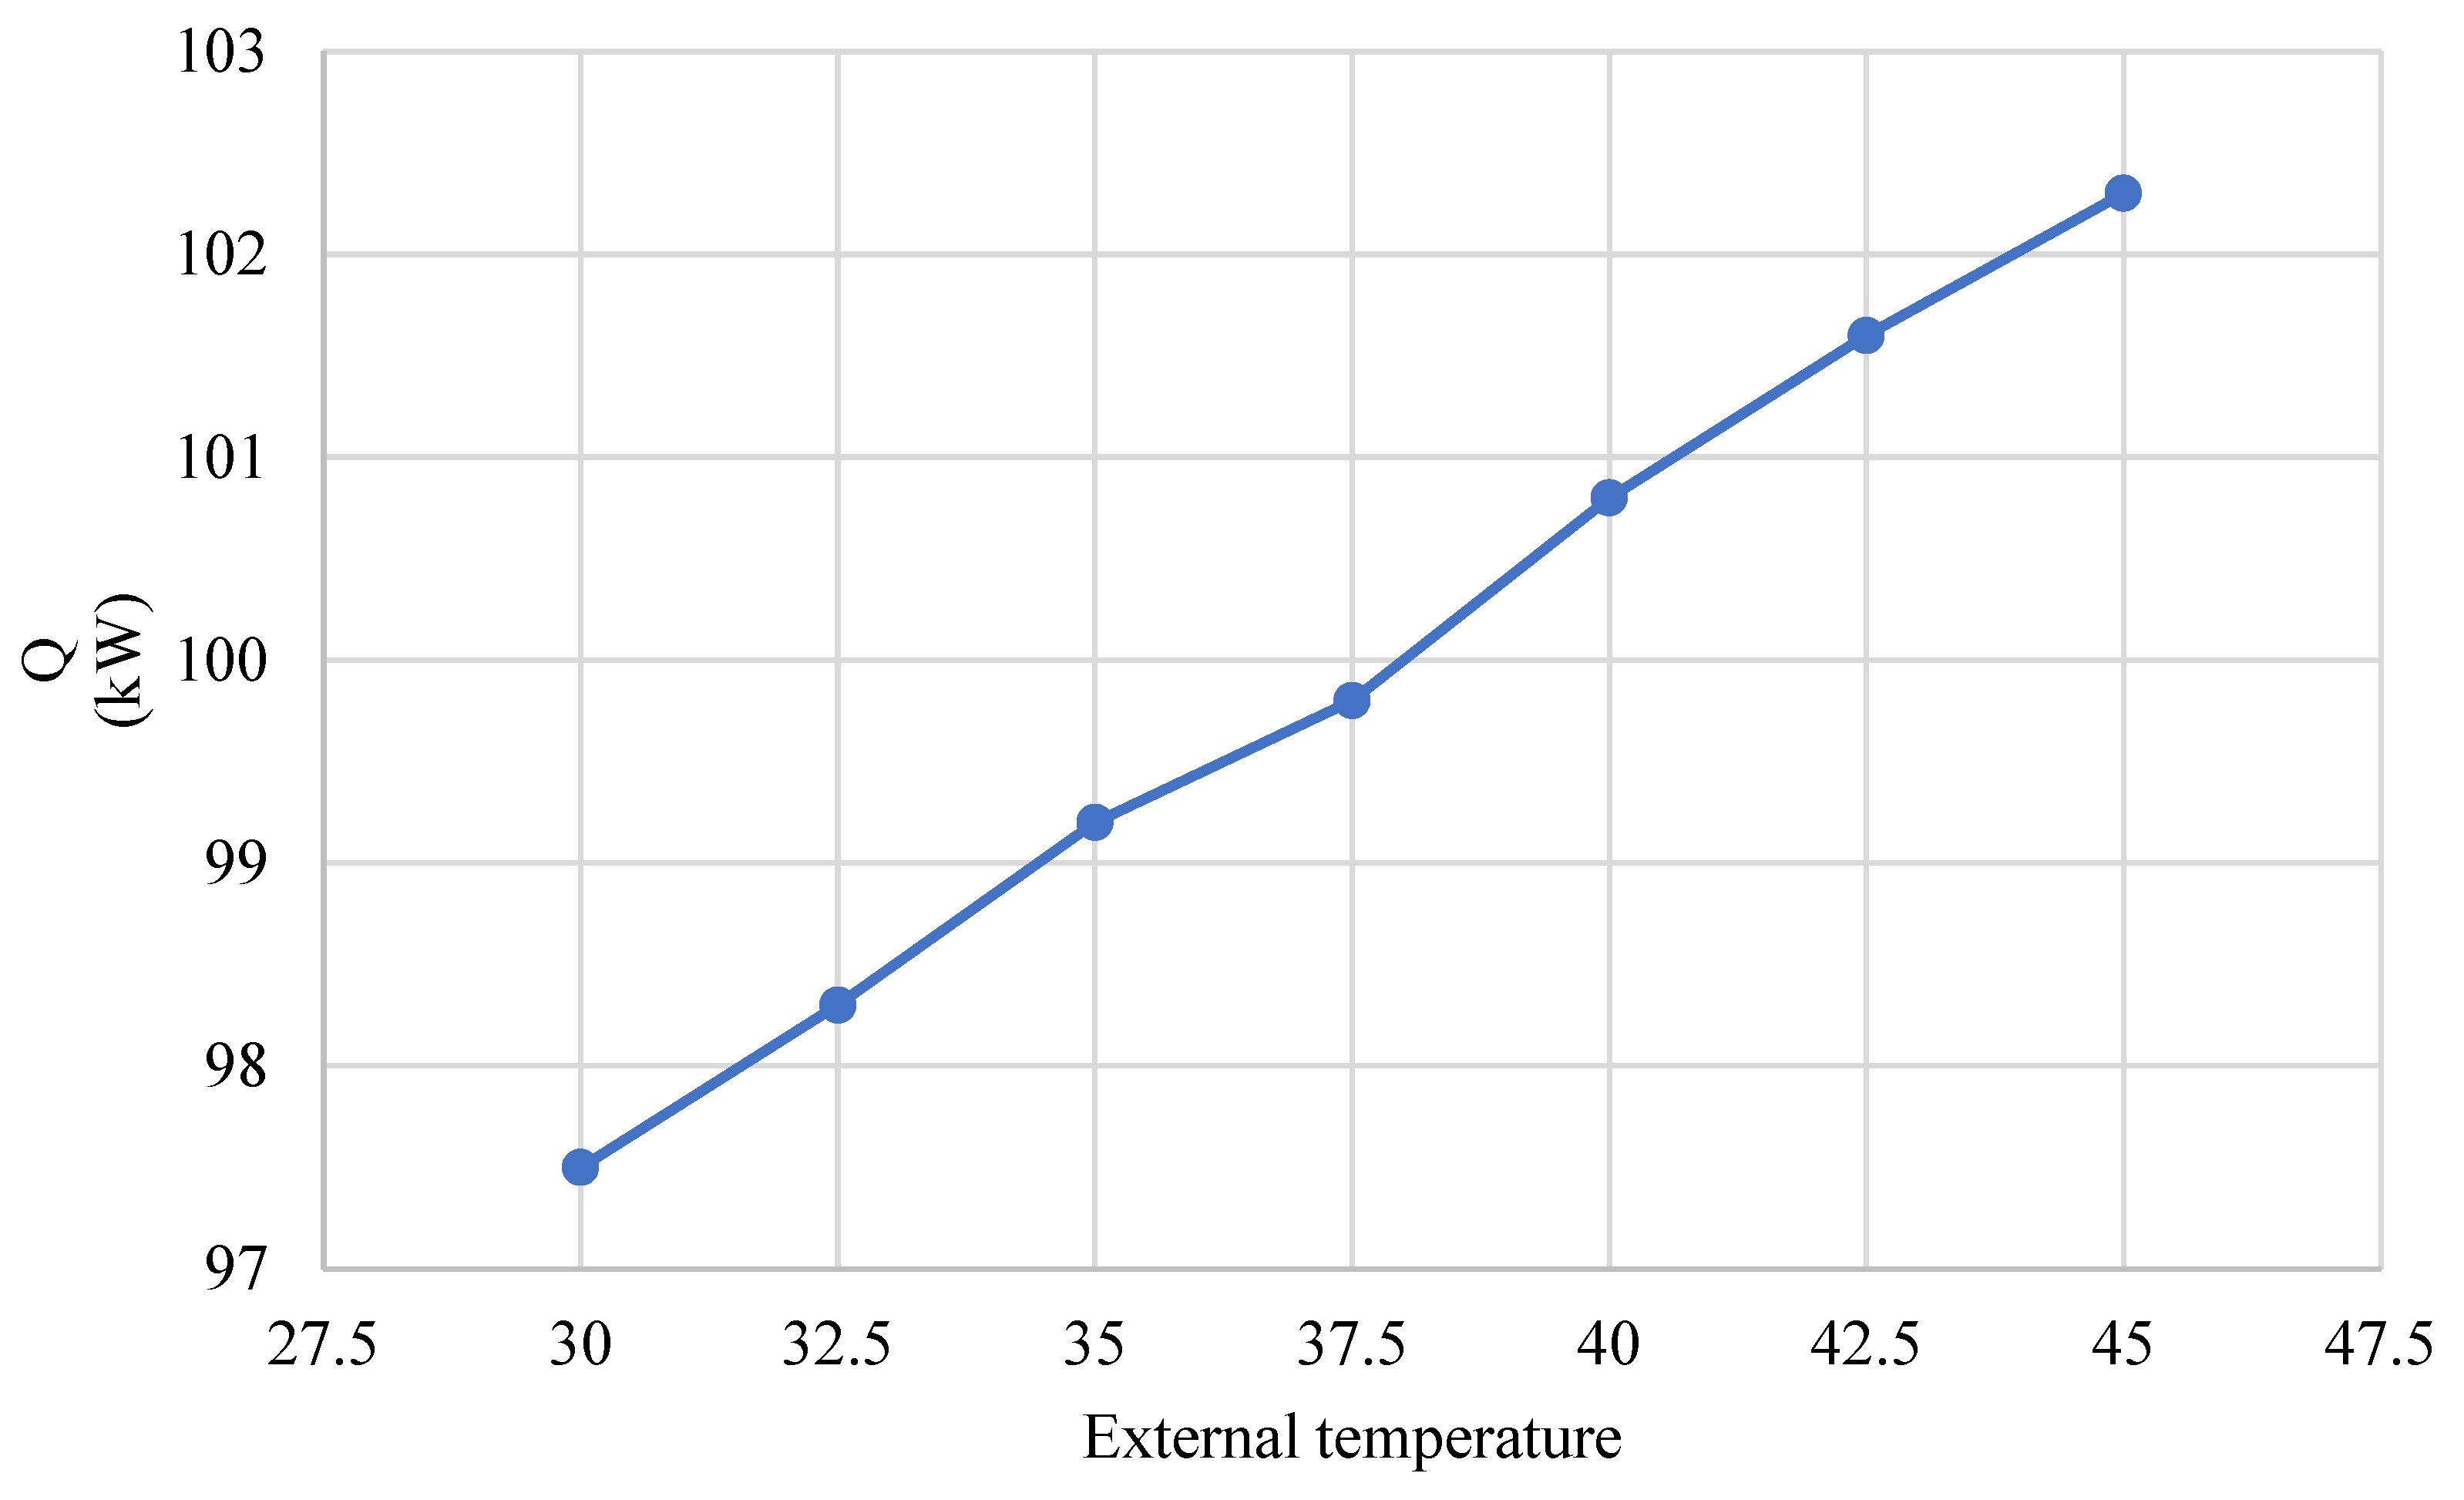
It is important to consider the environmental surroundings in the location of a plant of these characteristics, especially the solar radiation conditions. Radiation is one of the fundamental parts of heat transfer, as can be seen after evaluating the variation in the outside temperature versus the total transfer generated in the study tank in
Figure 11.
In a variation of 15 °C externally, from an extreme heat temperature of 45 °C to 30 °C, there is a 4.7% variation due to solar radiation.
About the calculation of BOG generated with method 1, a generation rate of 964.44 m3/day was obtained, and with method 2, a rate of 1204.56 m3/day, the difference between the two methods being around 240 m3/day, a difference of 24.89% more than the value obtained with method 1.
The preset calculation method does not at any time consider the type of insulation of the tanks; it only makes the calculations by formulating the pumping systems and flows generated, setting the daily rate of BOG generation and other elements to limit the calculations. This makes it a method that does not consider vital characteristics for a regasification plant such as, for example, the solar radiation to which the tanks are subjected due to their geographical location.
The mass and energy balance allows us to conduct the analysis without the need to establish the daily generated BOG criterion and offers a greater depth of calculations.
They conclude that the best methodology for analyzing this type of tank is the mass and energy balance, as it considers factors that other methodologies do not.
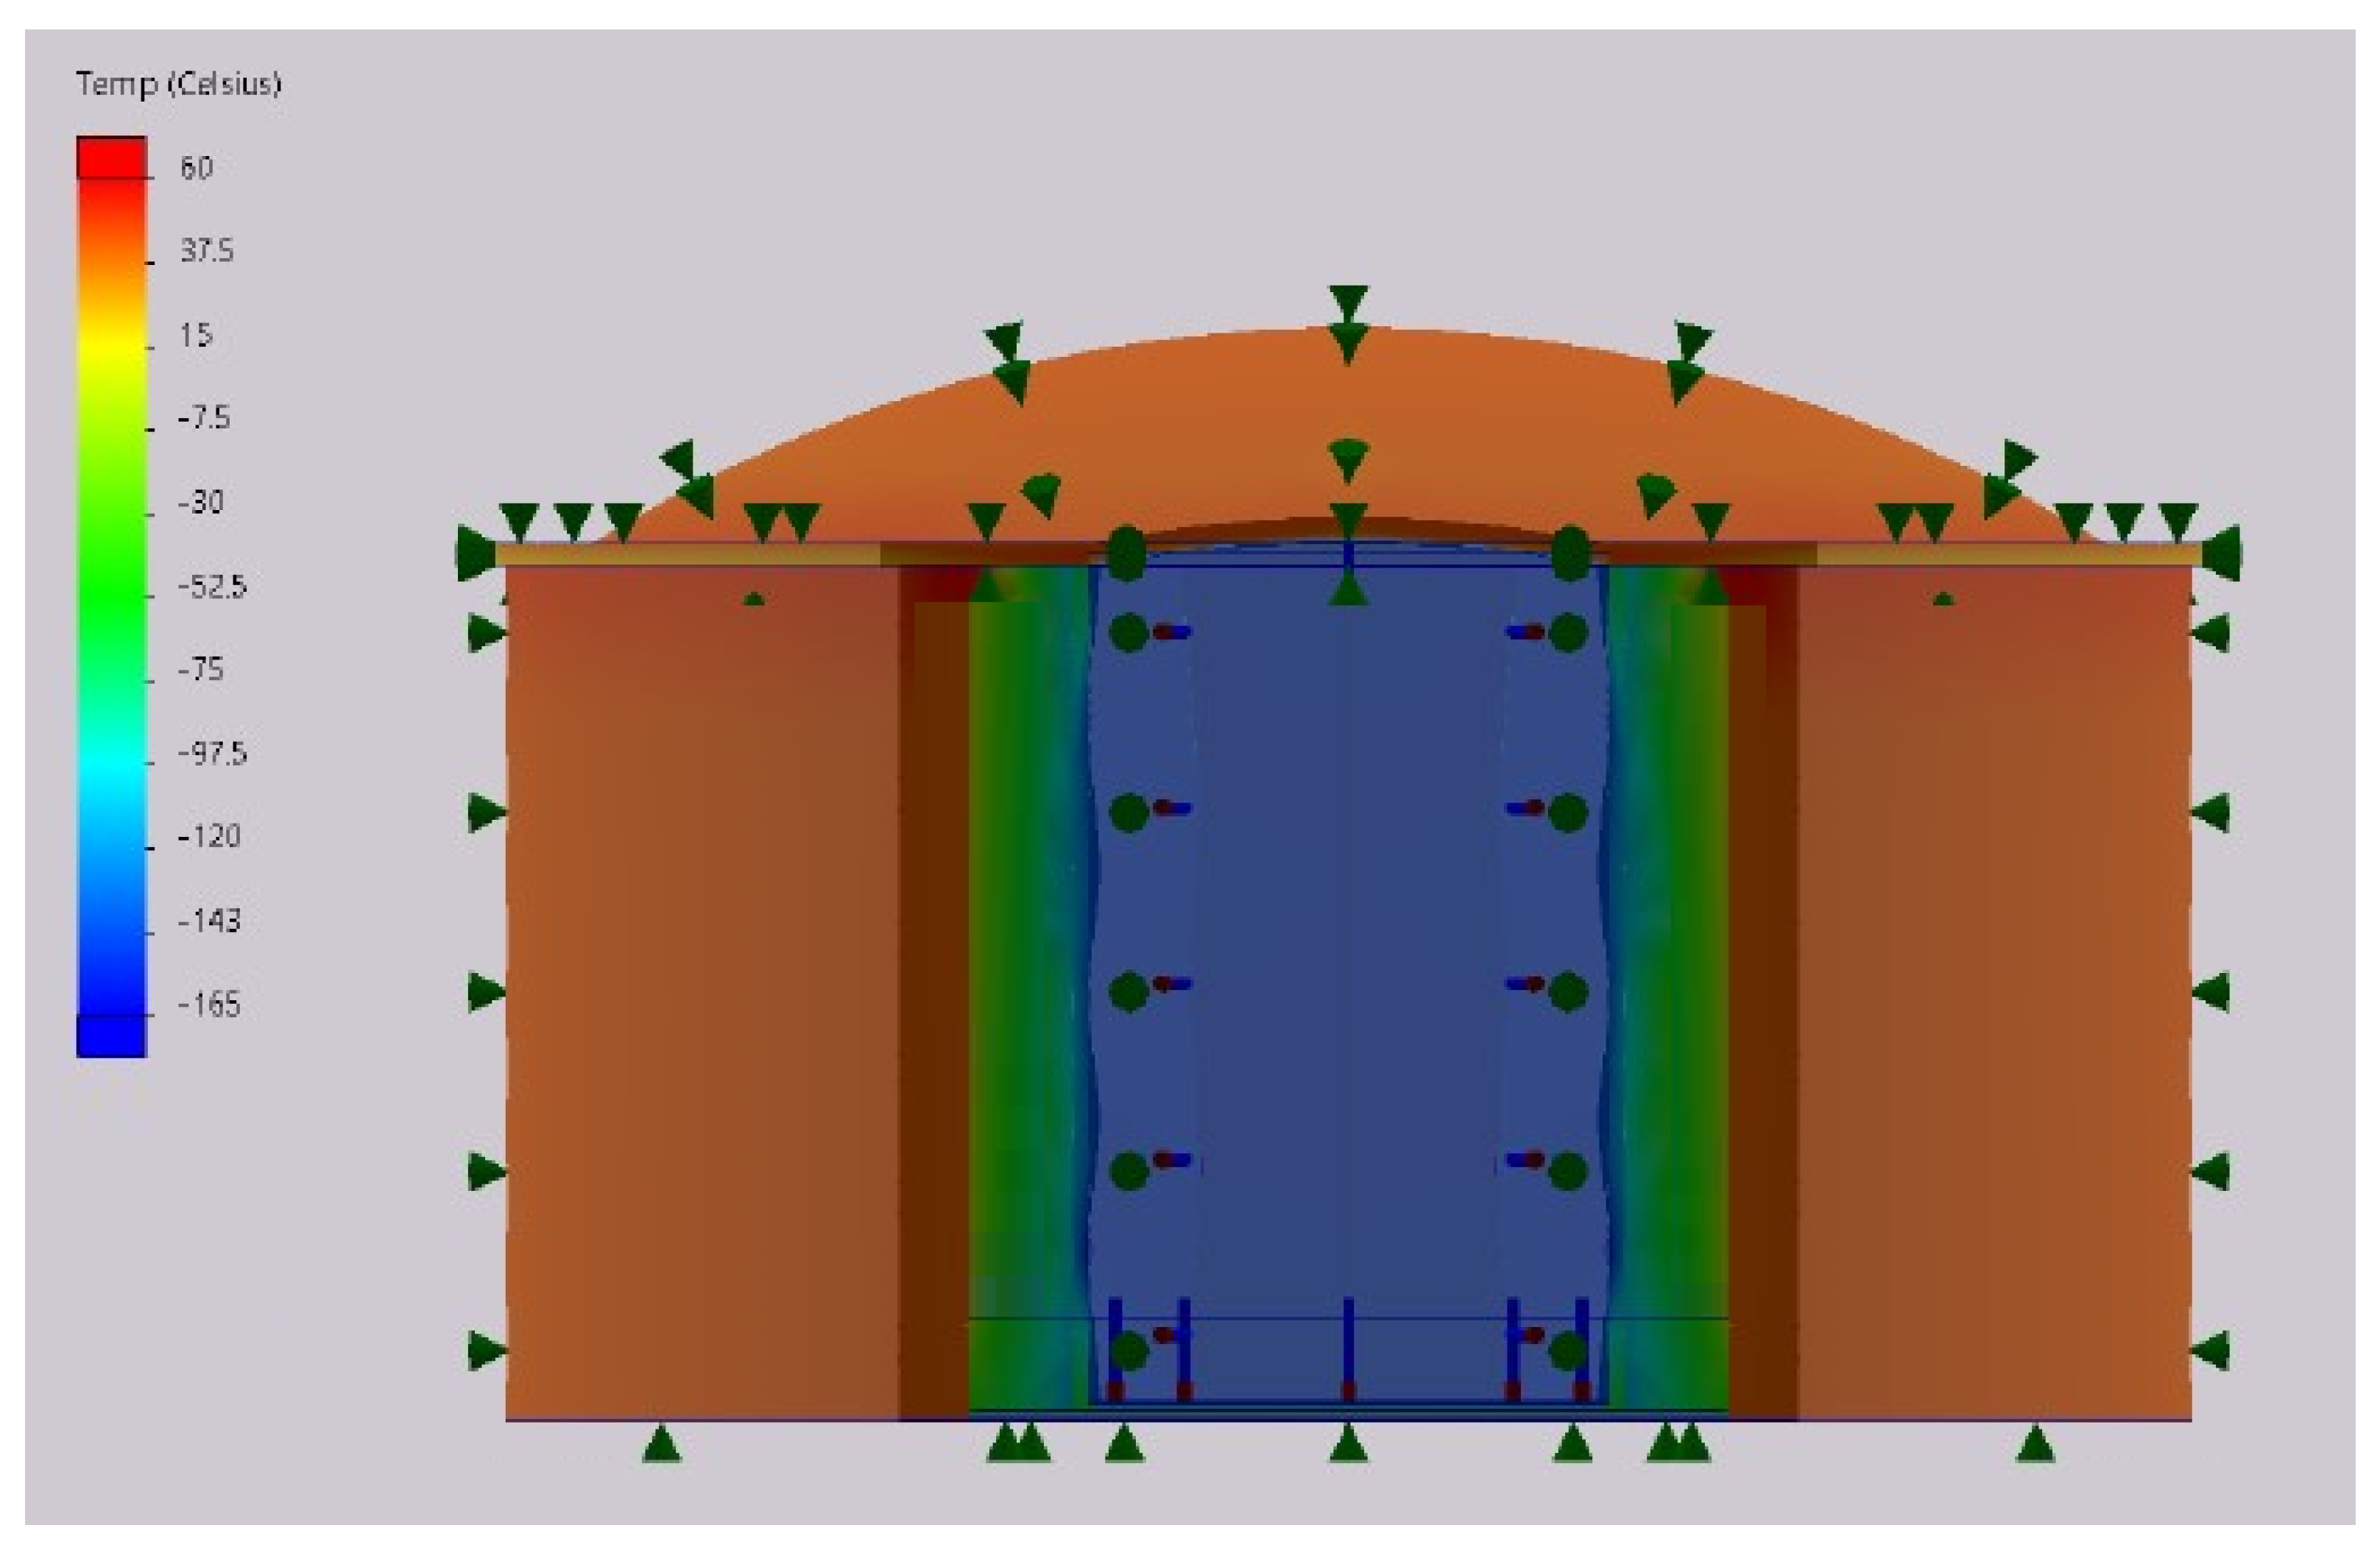
In the present study, a detailed comparison was conducted between the temperature data obtained using two simulation tools: SolidWorks and EES. The analysis focused on three key areas of the LNG storage tank, the base, the walls, and the dome, with the objective of evaluating the consistency between both models and detecting discrepancies that could influence the thermal interpretation of the system. In doing so, validation of the energy and mass balance method was also sought.
The survey of the tank is shown in
Figure 12 and the properties of the simulation mesh in
Table 4.
Six equidistant points were taken at the thickness of the floor, the tank walls, and the dome. At the base of the tank, the results showed a strong agreement between the two methods. In five of the six points analyzed, the differences were minimal, with maximum errors of 2.85 °C.
In the case of the tank walls, the behavior was more heterogeneous. Although some points showed exact agreement between the two models, others showed discrepancies with errors of around 4.27 °C, related to the complexity of the thermal gradients where the interaction between insulation, radiation, and convection can be more difficult to model accurately by SW.
The tank dome, on the other hand, had a discrepancy of around 0.5 °C. However, the outermost face, where the most marked difference is evident, suggests that boundary conditions and direct exposure to external temperatures can significantly influence the accuracy of the models.
With reference to the percentage of BOG generated by heat transfer,
Table 5 is obtained.
The greatest heat transfer takes place through both the base and the dome of the tank, these areas being responsible for 34.04% and 38.86% of BOG generated, respectively. While it is true that both the base and the walls are within reasonable parameters, the case of the dome is different, which is why it is necessary to conduct an in-depth study of the dome.
As an improvement in insulation and given that the main construction materials in this part of the tanks are concrete and fiberglass blocks, variations in the thickness of the material are made to observe the behavior of heat transfer.
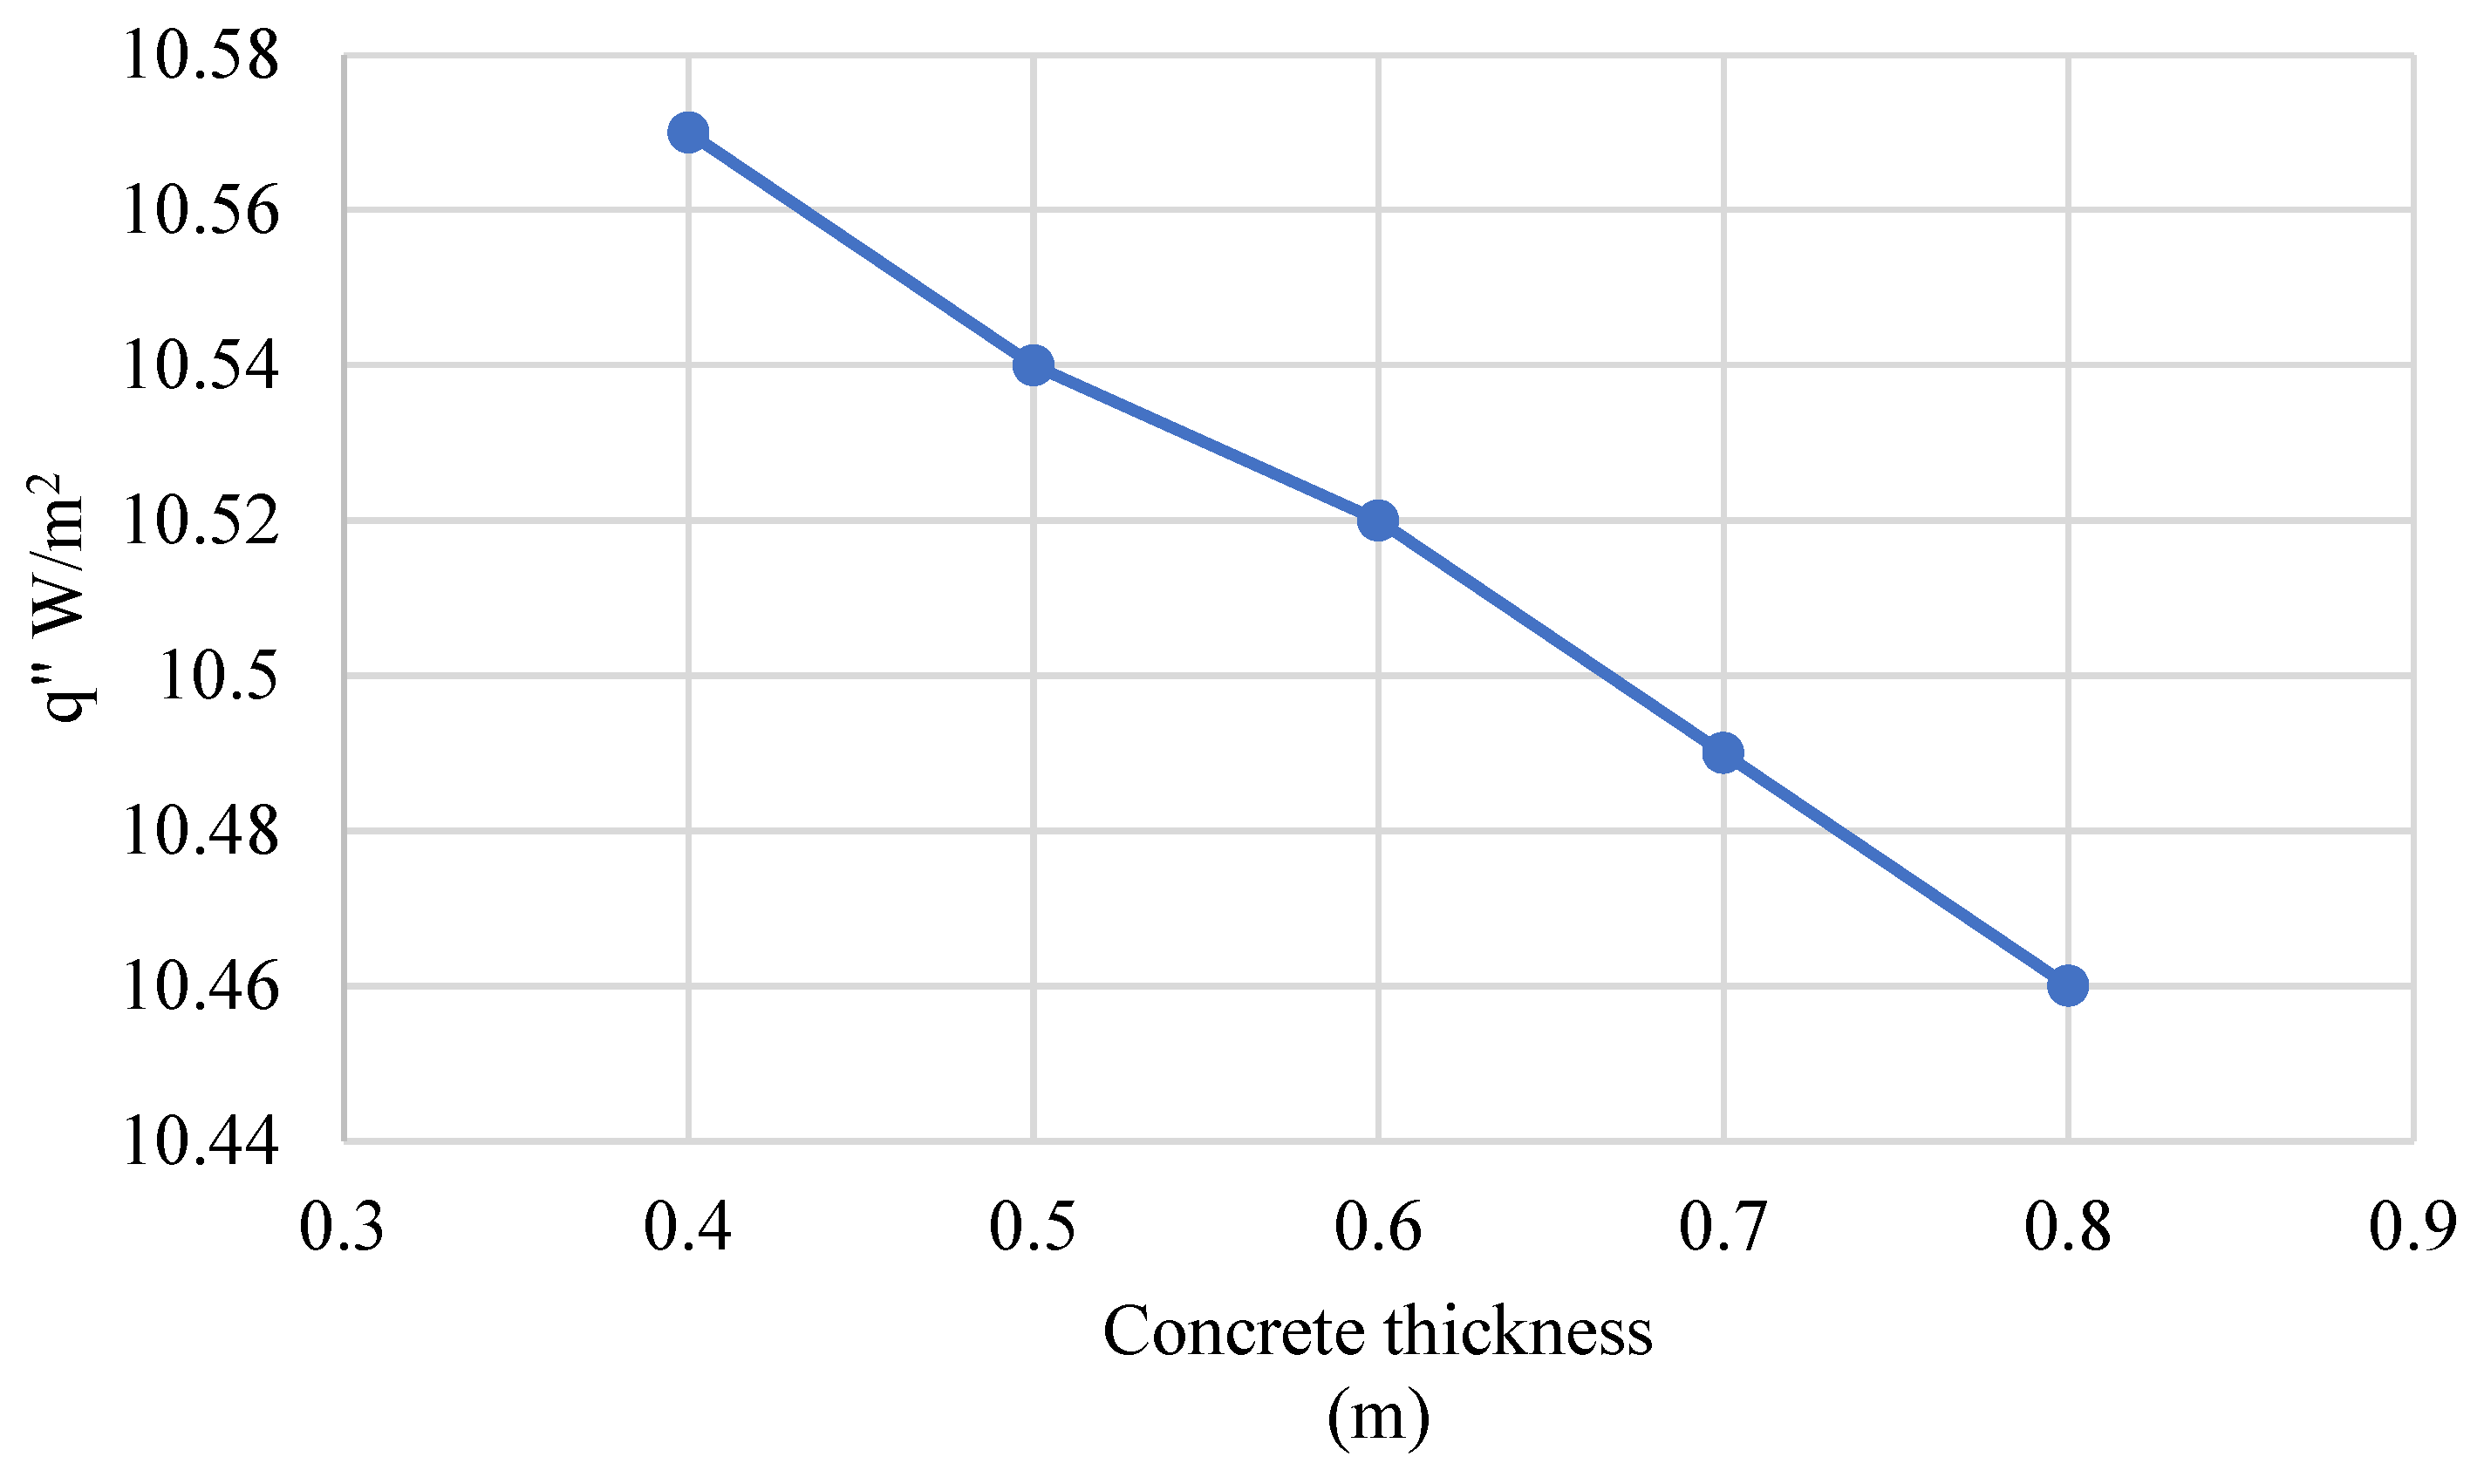
In the case of concrete, thickness variations are made from the initial 0.4 m layer to 0.8 m, resulting in a transfer change from 10.57 W/m
2 to 10.46 W/m
2, as can be seen in
Figure 13.
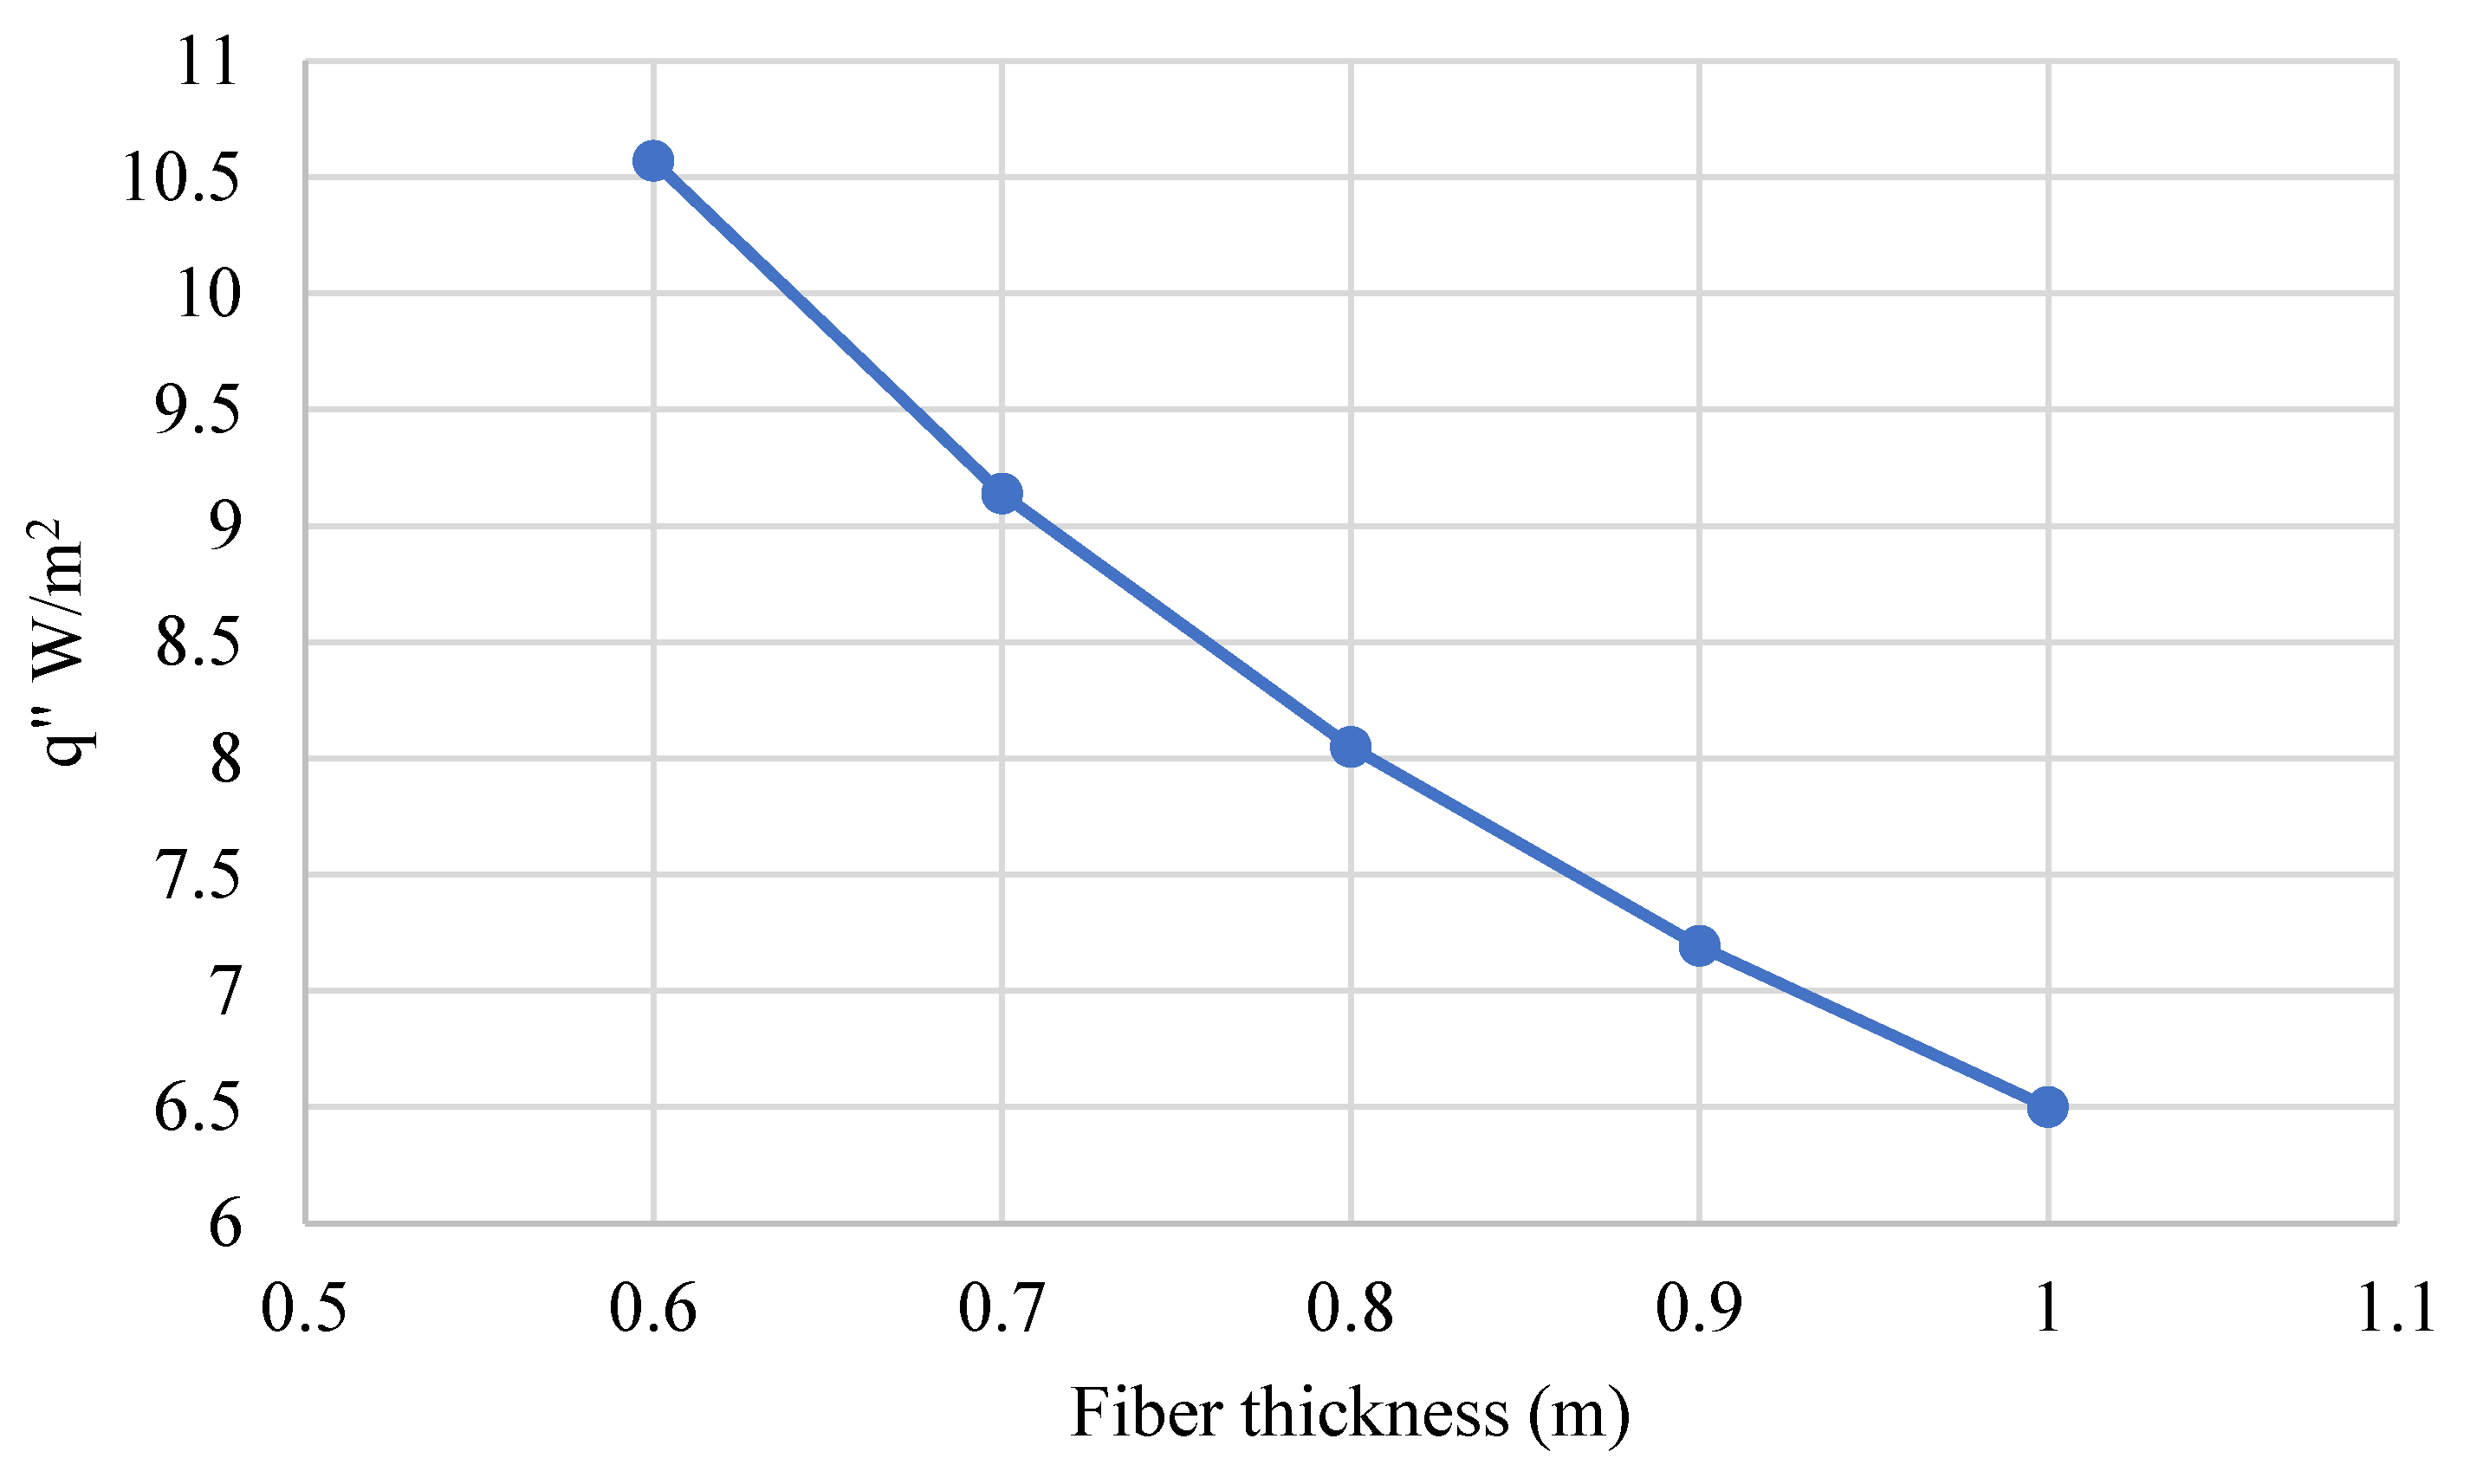
Applying the same methodology to fiberglass blocks, thickness was varied from a starting 0.6 m to 1.0 m, resulting in a range from 10.57 W/m
2 to 6.5 W/m
2, as shown in
Figure 14.
An increase in thickness of 0.4 m in the concrete layer would allow a reduction of 0.11 W/m2, while an increase of 0.4 m in the glass fiber layer would reduce heat transfer by more than 4 W/m2.
In view of these results, an improvement of the insulation in the dome could be achieved at the construction level by increasing the thickness of the glass fiber layer instead of the concrete layer, which is also a much lighter material.
Increasing the thickness of the glass fiber would reduce the heat transfer generated and, in turn, the generation of BOG inside the tank.
Within the framework of improving BOG management, they propose three alternatives that would optimize energy use, reduce emissions, and improve the operational efficiency of the plant.
The first alternative is the implementation of a cogeneration system. This type of installation allows the simultaneous production of electrical and thermal energy from a single primary energy source. Its operation is based on the use of gas or steam turbines coupled to an alternator, using the waste heat to generate steam in a second cycle, which increases the overall efficiency of the system [
34].
Although this technology has proven to be effective in other industrial facilities, its installation requires significant investment and constant thermal demand to be viable. In addition, its performance is highly dependent on cycle design and waste heat utilization, which may limit its application under certain operating conditions.
Another option could be improvements to the reliquefication plant. This system allows BOG to be converted back to a liquid state through cooling and condensation and returned to the storage tanks. Reliquefication technology is based on refrigeration cycles using diverse types of refrigerants, either cascade or mixed, and requires a very elaborate design of the main equipment such as compressors, evaporators, and condensers [
35].
This alternative has the advantage of keeping the LNG composition constant and avoiding flaring, but it involves considerable technical complexity and energy consumption. Research on improving the diverse types of refrigerants that can be used in the system would be a way to improve the performance of this installation by increasing the volume of liquefied BOG.
Finally, there is also the possibility of implementing a compression system for direct injection of BOG into the transport network. This solution consists of increasing the pressure of the evaporated gas to the levels required by the pipeline, thus avoiding its loss through venting or combustion. This is a simpler alternative from a technical and operational point of view, which can be integrated with existing systems and allows a more flexible response to variations in demand or plant operation [
36].
All these alternatives are presented as options to burn the excess BOG in the plant’s flare, a practice that would imply the payment of CO2 emission rights if the plant were in the EU. In addition, it also entails an economic loss by having to burn a resource that was intended for sale because of the need to control the safety of the installation.
In this context, it is essential to compare the different BOG management strategies, considering their advantages, limitations, and conditions, as shown in
Table 6.
In all these proposals, additionally, it could be applied in the integration of a digital twin.
The integration of digital twins in onshore regasification plants represents an evolution in the form of supervision and maintenance of these facilities, making it possible to create a virtual replica of the physical system, which is updated in real time using data extracted from sensors distributed throughout the plant. Through this integration, it is possible to continuously calibrate the operating parameters, anticipate deviations and make decisions based on predictive simulations.
Following the schematic in
Figure 15, the process starts with the instrumentation of key equipment with sensors connected to an IoT network. These devices collect temperature, pressure, or flow data, which are sent to an integration platform. There, the data is filtered, validated, and normalized to ensure its quality before being fed to the digital twin.
Once updated, the virtual replica adjusts its internal parameters to reflect the real state of the plant. This allows real-time simulations to be run that predict, for example, BOG generation under different environmental or load conditions in anticipation of atmospheric situations such as elevated temperature alerts. In addition, the system can issue operational alerts or recommendations and even trigger automatic responses.
5. Conclusions
Methane, in the form of LNG, is the most widely used new-generation fuel in the maritime sector. The facilities that store and distribute it in ports are facing continuous refurbishment for energy improvement; however, it is necessary not to lose sight of the effects of the Jevons paradox in the search for energy efficiency.
It has been shown that the best way to perform such an analysis, as opposed to methodologies with pumping calculations and preset values, is to perform a mass and energy balance, allowing the system as a whole to be covered and not only during a given operation, as the difference between one method and the other is more than 240 m3/day, about 25%.
If the tanks are built according to the specifications set, they will function adequately with a daily generation of BOG of less than 0.05% of the volume stored per day, which is perfectly acceptable for a typical regasification plant. However, it has been detected that the heat transfer in the dome exceeds the desirable values, which suggests opportunities for improvement in the insulation, especially in later phases of construction with the possibility of some type of painting to reduce the impact of solar radiation.
The value of the heat transfer in the tank walls is almost at the limit of the values set and, although the value obtained at the base of the tank is within the range, the heat transfer through the dome, as well as the analysis of its structure, leads to the conclusion that this is an element of the tank where the insulation could be improved, both during the construction of the tank and at a later stage with the possibility of applying some type of paint to reduce the impact of solar radiation, to cite one example.
It is true, however, that glass fibers and perlite have been identified as the elements with the greatest temperature transfer, and that these elements should be the subject of further study to improve thermal insulation.
The areas of highest heat transfer are the base and the dome of the tank, responsible for 34.04% and 38.86% of the BOG generated, respectively. Although the base and walls are within acceptable parameters, the dome requires special attention. Improvements in insulation were evaluated by increasing the thickness of the materials: in the case of concrete, going from 0.4 m to 0.8 m reduces the transfer from 10.57 W/m2 to 10.46 W/m2, i.e., a marginal improvement of 0.11 W/m2. In contrast, increasing the glass fiber thickness from 0.6 m to 1.0 m reduces the transfer from 10.57 W/m2 to 6.5 W/m2, an improvement of more than 4 W/m2. Therefore, reinforcing the glass fiber layer is a more efficient and lighter solution to reduce heat transfer and, consequently, the generation of BOG by the dome.
In terms of the management of the BOG generated, the analysis of the three alternatives offers different advantages. Cogeneration allows a high energy yield but requires a high investment and specific operating conditions. Upgrading the reliquefication plant maintains LNG quality and avoids emissions but entails greater technical complexity and energy consumption. Compression for direct grid injection stands out for its simplicity, flexibility, and integration with existing systems, making it a particularly viable option in variable operating scenarios.
The calculations have been made without taking into account the need to keep the lines and equipment cool, which would also lead to an increase in the BOG generated by the heat transfer that exists in the plant’s systems and which should be quantified instead of applying a percentage of generation. This aspect has not been the subject of this study, which focused more on the storage systems than on the distribution systems, as well as the analysis of alternatives that allow for better insulation after the start-up of the terminal or alternatives to the management of the BOG.
