Article

Dual Enhancement of Power System Monitoring: Improved Probabilistic Multi-Stage PMU Placement with an Increased Search Space & Mathematical Linear Expansion to Consider Zero-Injection Bus

by
Ziad M. Ali
1,2,
Seyed-Ehsan Razavi
3,*,
Mohammad Sadegh Javadi
4,
Foad H. Gandoman
5,6 and
Shady H.E. Abdel Aleem
7
1
Electrical Engineering Department, College of Engineering at Wadi Addawaser, Prince Sattam bin Abdulaziz University, 11991 Wadi Addawaser, Saudi Arabia
2
Electrical Engineering Department, Aswan Faculty of Engineering, Aswan University, 81542 Aswan, Egypt
3
Faculty of Electrical and Computer Engineering, University of Birjand, 97175-615 Birjand, Iran
4
Department of Electrical Engineering, Shiraz Branch, Islamic Azad University, 71993-4 Shiraz, Iran
5
ETEC Department & MOBI Research Group, Vrije Universiteit Brussel, Pleinlaan 2, 1050 Brussel, Belgium
6
Flanders Make, 3001 Heverlee, Belgium
7
Mathematical, Physical and Engineering Sciences, 15th of May Higher Institute of Engineering, 11731 Cairo, Egypt
*
Author to whom correspondence should be addressed.
Energies 2018, 11(6), 1429; https://doi.org/10.3390/en11061429
Submission received: 1 May 2018 / Revised: 23 May 2018 / Accepted: 31 May 2018 / Published: 3 June 2018

Abstract

:
This paper presents a mathematical linear expansion model for the probabilistic Multistage Phasor Measurement Unit (PMU) Placement (MPP) in which zero-injection buses (ZIBs), as well as communication channel limitations, are taken into consideration. From the linearization perspective, presenting a model formulizing the probabilistic concept of observability while modelling the ZIB is of great significance, and has been done in this paper for the first time. More importantly, the proposed probabilistic MPP utilizes a technique disregarding the prevalent subsidiary optimizations for each planning stage. Although this technique, in turn, increases the problem complexity with manifold variables, it guarantees the global optimal solution in a wider and thorough search space; while in the prevalent methods, some parts of the search space might be missed. Furthermore, the proposed model indicates more realistic aspects of the MPP where system operators are allowed to follow their intention about the importance of buses such as strategic ones based on monitoring the priority principles. In addition, the model is capable of considering the network topology changes due to long-term expansions over the planning horizon. Finally, in order to demonstrate the effectiveness of the proposed formulation, the model is conducted on the IEEE 57-bus standard test system and the large scale 2383-bus Polish power system.

1. Introduction

In recent years, a system named Wide Area Monitoring Protection and Control (WAMPC) has been introduced to power systems covering supervisory control and data acquisition (SCADA)’s shortfalls, in which Phasor Measurement Units (PMUs) are the main components of this system, providing synchronized real-time signals with the aim of making the network observable [1]. Data obtained from PMUs have revolutionized the power system analysis. In [2,3], event locations are estimated online using the data gathered by PMUs. Utilizing the benefits of real-time PMU data, early warning to the angle instability is possible which can protect the power system against blackouts. In this respect, a model has been presented in [4] to produce a very quick and efficient response to angle instability. Similarly, taking advantage of the PMU’s accurate data, the network voltages can be monitored closely to have a more reliable system from the instability point of view. This issue has been addressed by authors of [5,6,7,8]. Controlled islanding as another strategy to prevent cascading blackouts was mainly investigated from the aspect of either optimal splitting surface determination or the start-up criterion; by increasing the penetration of PMUs in power systems, a more efficient method has been developed to include both aspects [9].
The previously stated benefits can be derived without any necessity to install PMUs at all network buses. This is because a PMU can make its neighboring buses observable by measuring accurate and online current and voltage phasors. On the other hand, the device requires suitable infrastructure such as communication links, which are sometimes cost-intensive, to be prepared. Here the problem of Optimal PMU Placement (OPP) arises to achieve the objectives using the minimum possible PMUs installed. In [10,11,12,13,14], the problem of OPP has been carried out attempting to observe the whole network. In addition to this goal, the authors in [15] have proposed an OPP scheme more suitable for the state estimation and post-estimation. Through this method, the matter of bad date detection can be significantly improved by fixing the extra PMUs at strategic buses. Similarly, a new OPP with the aim of improving the state estimation has been investigated in [16] using the Genetic Algorithm (GA). Therein, considering the Zero Injection bus (ZIB) in the observability rules introduces nonlinearity to the problem [10,12]. Though utilizing an evolutionary algorithm can handle the nonlinear problem [12], mathematical linearization techniques have always been the preference due to their considerable advantages [13,14,17,18,19]. In this regard, modeling the ZIBs in the OPP problem beside the redundant PMU placement has been addressed in the framework of Integer Linear Programming (ILP) [19]. In recent years, PMU placement studies have given more practical considerations. Due to presence of conventional power flow and injection measurements in the power system, an OPP model has been solved considering such devices [14,20]. In reality, PMUs come with the limited number of communication channels that restrict them to measure all entering branches. To consider this limitation, several studies have been carried out to assign the PMU channels to specific transmission lines [11,21]. Moreover, thanks to the valuable experiences from a real-life project, Rather et al. in [22] have considered some major hidden costs in the OPP problem to propose a realistic cost-efficient model instead of widely used OPP that minimizes the number of PMUs. Based on this study, the four major factors which impose a considerable financial burden to a PMU installation project, next to the PMU cost, are the costs related to instrument transformers, shutdown during installation, communication infrastructure and building suitable foundations.
Apart from the methodologies used to model the OPP and the abovementioned considerations, there are two distinct viewpoints in terms of observability, that is, deterministic and probabilistic. From the deterministic point of view, a PMU can make a bus either observable or not. Under this broader definition, the exact description of the complete and incomplete observability as well as the concept of the depth of unobservability has been addressed in [23]. So far, the OPP is usually investigated from the deterministic viewpoint [10,11,12,17,19,20,21,22,23,24,25,26]. However, the probabilistic concept of observability provides more realistic insight. Indeed, not only does the probabilistic definition of observability include the effects of PMUs on its own, but also considers some more related practical aspects such as the impacts of availability of lines, PMUs and their communication links on the observability of a bus. In [27], a probabilistic version of the observability is defined to include the mentioned factors while ignoring the presence of ZIBs. In spite of the deterministic contingency-constrained PMU placement model [10,13,14,17,21] which considers the N-1 security criterion on lines and PMUs, the probability of line and PMU failures, derived from the history of the system and equipment, are taken into account in the probabilistic model [28]. In [18], a multi-objective OPP has been studied considering a similar concept of observability in a probabilistic framework, attempting to maximize and minimize the expected value of system observability and the number of PMUs, respectively.
In reality, large scale power systems usually generate a huge financial burden because of the costs related to PMUs, preparing the infrastructure, and installation. Moreover, technical restrictions avoid installing all the needed PMUs over a short period of time. Thus, the PMU installation is done over separate planning stages for a specific timetable as a Multistage PMU Placement (MPP) optimization problem [24]. In the deterministic framework, the MPP has been investigated with various objectives such as maximizing the network observability over the time horizons [25], maximizing tie-line observability by means of the analytic hierarchy process method [26], and phasing PMUs in order of precedence at sparse locations [29]. Furthermore, the delivery costs for PMUs’ relocation is investigated in the MPP context in [30]. Authors in [31] have included communication infrastructure costs as well as the installation cost. On the other hand, the probabilistic MPP has not been much focused thus far. In this regard, Ref. [27] has proposed a probabilistic model for MPP introducing an index for the system. It is worth noting that in all the above-mentioned MPP studies, the methods of MPP mainly used are the same. That is to say, firstly, the PMU placement of the initial stage is carried out. At the next stage, another optimization is performed under a condition that those buses obtained from the results of the first optimization are put aside from the search space. In other words, the input for the second optimization is limited, leading to a smaller search space.
This paper aims at improving the power system monitoring during the planning stage by presenting a comprehensive linear model for the probabilistic MPP while practical issues are considered. The main contributions of the paper are listed below.
  • Proposing a linear expansion model for the probabilistic MPP to consider ZIBs, for the first time: Modeling the ZIB has been always a great challenge in terms of the linearization. This is why previous research has used evolutionary algorithms such as Particle Swarm Optimization (PSO) [32,33], Imperialist Algorithm [34] or non-linear programing [35,36]. But, among all optimization methods, linear programming is in preference to others due to two main superiorities; assuring the global optimum of a problem in convex models and the capability to be implemented in large scale cases.
  • In the probabilistic framework, a linear technique is used for MPP in search of the global optimum solution in the complete search space with the help of manifold auxiliary variables, all by performing one optimization run. Finally, the model is strengthened so as to consider the channel capacity of the PMUs and the network topology changes resulted from the expansion planning in power systems.
  • Providing a realistic context of the MPP scheme desirable for system operators: In order to implement a practical MPP, the proposed model is able to utilize inputs gathered by system operators; and to install PMUs at buses, which are of highest importance based on a pre-determined policy, earlier than other nodes. Indeed, this model allows the system operators to weigh the network buses’ importance according to their preferences to monitor the critical areas of the network such as dynamic suspected areas, power plants, tie lines or any other strategic nodes in earlier stages of the MPP.
The remainder of the paper is organized as follows. The motivation of presenting this paper is discussed in the Section 2. In this section the primary difference between the proposed MPP method and the conventional method is thoroughly described. The proposed linear expansion is formulated in the Section 3. Section 4 suggests the numerical results, including a comparative case study. Finally, Section 5 points to several conclusions of the research work presented.

2. Motivation-Limited Search Space of the Conventional MPP

Before presenting the proposed dynamic strategy, it is necessary to describe the blind spots of the conventional Linear Programming (LP) method based on the MPP. In the conventional linear based MPP [24,25,27], firstly, the final year’s optimal PMU locations are predetermined at the beginning of the scheduling. Then, in order to install the PMUs on these preset locations during the time stages, the MPP starts utilizing a subsidiary LP optimization for the first planning stage aimed at maximizing the network observability. Afterwards, by omitting the solutions of the first stage from the preset locations, the PMU placement for the second time stage is done via another subsidiary optimization. Serially, this strategy will be continued by several independent subsidiaries LP optimizations for subsequent stages. Therefore, this method can be known as non-dynamic strategy. In this condition, the best possible solution may not be reached. This is because the prevailing non-dynamic strategies may lead to a limited search space. This fact may be due to the two following reasons.
  • The prevalent strategy, which sequentially maximizes the network observability from the first stage to the final stage, does not consider a part of the search space. Here, an example is presented to show the importance of the above issue. Assume that in a given 50-bus network it has been scheduled to install 15 PMUs on a set of predetermined 15 buses after three planning stages. Also, assume that after solving the conventional MPP, the optimal solution obtained leads to the observability of 25, 40, and 50 network buses from the first stage to the third stage, respectively. It is believed that some better possible solutions may exist which are not in the prevalent method’s search space. For instance, a solution leading to observing 24, 43 and 50 buses for the first to the third stages, respectively, is far more desirable compared to the previous situation. Notice that the cumulative network observability during the planning horizon for the second condition is more than the first one. Obviously, the latter solution cannot be reached by the prevalent non-dynamic strategy because the conventional approach tries to maximize the network observability for the first stage at the first step. Thus, it reaches its optimal solution for the first stage as 25 buses are observable. As a result, the path to better possible solutions (like 24, 43, and 50 observable buses) is missing.
  • Another reason relates to the nature of the LP solvers. Most of the researchers have proposed their MPP model based on the LP technique in several subsidiary optimizations. It is very likely for each subsidiary problem to have several alternative optimal solutions, while LP solvers employed in the optimization software (Like CPLEX [37] in GAMS [38]) can reach just one of them in multiple runs. Also, the existing possibility of alternative optimal solutions has not been checked. Hence, it is possible that a global optimal solution is not reached through several LP subsidiary problems. In other words, the problem’s search space in conventional techniques is decreased because the paths through the unreached alternative optimal solutions are not investigated.
In fact, beside proposing a linear formulation for the probabilistic MPP, covering the two aforementioned gaps is considered one of the outstanding points of this work. For this reason, this paper utilizes a method to achieve the optimal solution in a larger search space. To this end, unlike the prevalent strategy, the PMU placement for all intermediate stages is simultaneously performed in one optimization problem known as the dynamic strategy.

3. Problem Formulation

The probabilistic definition deployed in this paper is similar to that presented in [27]. However, the most significant point drawing a distinction between that introduced in [27] and the one presented in this paper is that the latter has been strengthened with the capability of the ZIB modeling. In the following, first the proposed probabilistic index is introduced in Section 3.1 and the dynamic multi-stage PMU placement formulation is presented (Section 3.2). Afterwards, in Section 3.3, the mathematical linear expansion is scrutinized.

3.1. Probabilistic Observability Concept

Based on Kirchhoff’s Current Law (KCL), between a ZIB and its neighboring buses, if all buses are observable except one, that unobservable bus can be met by applying the KCL at the ZIB [13,14]. Accordingly, the probabilistic observability function of the bus i at stage t can be formulated as below:
P O i t = 1 j Ω ( 1 A i j t x j t ) .
where x j is a binary decision variable showing the presence and the absence of the PMU at bus j when this value takes 1 and 0, respectively. Set Ω indicates all network buses. Also, A i j represents the probability of the observability of the bus i because of the presence of a PMU at bus j. This constant value has been defined as:
A i j = a i j · A j V m · A i j C m · A j P M U · A j L i n k · A i j L i n e .
where A i j C m and A j V m are the availability of the PMU current measurement at the line ij and the availability of PMU voltage measurement at the bus j, respectively. Moreover, A j P M U and A j L i n k are given and show the availability of the successful operation for PMU at bus j, and its communication link, respectively. Furthermore, A i j L i n e represents the availability of line ij. In (2), a i j represents the connectivity of buses i and j . That is to say, if buses i and j are connected, a i j is equal to 1, otherwise this parameter would be zero.
In order to model ZIBs, the product term ( 1 A j z j y i , j ) is employed. In this term,   y i , j is an auxiliary binary variable that is equal to 1 if the bus i can be observed by the effect of the zero-injection at bus j; otherwise 0. Also, z j is a binary parameter that is equal to 1 if the bus j is a ZIB; otherwise 0. Thus, the observability function of the bus i would be equal to 1 if the bus i can be observed either by installing the PMU at this bus or neighboring buses through ( 1 A i j x j ) , or by the effect of ZIB through ( 1 A j z j y i , j ) . Parameter A j is the product of probabilities of all factors that the zero-injection bus j makes either one of its neighboring buses or itself observable.
A j = k Ω a k j · A k V m · A k j C m · A k P M U · A k L i n k · A k j L i n e .
Here, the probabilistic index at stage t for a network comprising N buses can be defined as the Average of the Probabilistic Observability (APO) as below:
A P O t = 1 N i Ω P O i t .

3.2. Probabilistic Multi-Stage PMU Placement with Incremental Search Space

Unlike common methods used for the MPP dedicating several separate optimizations corresponding to each planning stage [24,25,26,27], this paper takes the advantage of the method used in [39], known as the dynamic MPP. The method searches for the optimal solution in the whole search space in just one optimization run, while in traditional approaches, specific buses are firstly chosen to be equipped with PMUs for the first stage by means of an optimization problem. Afterwards, these buses are put aside from all candidate buses and another optimization is performed for the second stage. The steps continue for all stages through several optimization runs. This procedure sometimes leads to missing some parts of the search space, as discussed in [39].
In order to install a specific number of PMUs at the pre-determined buses (e.g., set Ω pmu ), over M planning stages, the proposed MPP is as follows:
max   F i t = t = 1 M 1 A P O t .
subject to:
i Ω pmu x i t = k = 1 t n k ;   t { 1 ,   2 ,   ,   M 1 } .
x i t + 1 x i t   ;   i Ω ,   t { 1 ,   2 ,   ,   M 2 } .
x j t = 0 ;       j { Ω Ω pmu } ,       t { 1 ,   2 ,   ,   M 1 } .
i Ω a i j t y i , j t = z j ;     j Ω ,   t { 1 ,   2 ,   ,   M 1 }
Expressions (6)–(9) represent the problem constraints. In (5), A P O t is the system probability index at stage t. Equation (6) points to the scheduling table of each stage. Indeed, n t shows that how many PMUs should be installed at stage t which must be in accordance with the pre-defined planning timetable. It is apparent that if a PMU is located at bus i at stage t, this bus remains observable for the upcoming stages. In this respect, inequality (7) is utilized. Equation (8) guarantees that the PMUs are chosen just from the set Ω pmu . Moreover, constraint (9) is added in order to complete the ZIBs’ modeling. This constraint ensures that one of the buses which are incident to a ZIB, or the ZIB itself, can be observed by the effect of the ZIB through KCL. This claim can be obviously proved by the following deduction. When bus j is a ZIB, the right hand side of (9) is equal to 1. Hence, exactly one auxiliary variable of buses which are incident to bus j or the auxiliary variable of bus j, would be equal to 1. Otherwise, the right hand side of this equality is zero. Therefore, all auxiliary variables of buses which are incident to the bus would be equal to 0.

3.3. Mathematical Linear Expansion for the Problem

It is obvious that the objective function (5) is nonlinear since it includes some product terms. Indeed, this nonlinearity stems from th variables mentioned in (1). It should be noticed that the nonlinearity, and therefore the complexity, existing in (11) is much more intense than that stated in [27], because of the added product term related to the ZIB. In the following, a proof for linear version of the P O i t (Equation (1)) and the objective function (5) is presented.
It is simple to understand that the product term of (1) is defined as the unobservability function ( P O i t = 1 P U i t ) where its expanded form is derived as:
P U i t = [ ( 1 x 1 t · A i 1 ) · ( 1 x 2 t · A i 2 ) ( 1 x N t · A i N ) ]   ×   [ ( 1 y i , 1 t · z 1 · A 1 ) · ( 1 y i , 2 t · z 2 · A 2 ) ( 1 y i , N t · z N · A N ) ] ; i Ω ,   t { 1 ,   2 ,   ,   M 1 } .  
Now for linearization, the auxiliary variables w i j t and v i j t are employed. Assume that:
{ w i 1 t = ( 1 x 1 t · A i 1 ) ;       w i 2 t = w i 1 t ( 1 x 2 t · A i 2 ) ;     i Ω ,   t { 1 ,   2 ,   ,   M 1 } . w i j t = w i ( j 1 ) t ( 1 x j t · A i j ) ;   w i N t = w i ( N 1 ) t ( 1 x N t · A i N ) ;
and
{ v i 1 t = ( 1 y i , 1 t · z 1 · A ' 1 ) ; v i 2 t = v i 1 t ( 1 y i , 2 t · z 2 · A ' 2 ) ; i Ω ,   t { 1 ,   2 ,   ,   M 1 } . v i j t = v i ( j 1 ) t ( 1 y i , j t · z j · A ' j ) ; v i N t = v i ( N 1 ) t ( 1 y i , N t · z N · A ' N ) ;
Thus, it can be concluded that:
U i t = w i N t · v i N t ;     i Ω .
According to (11) and (13), if a PMU is placed either at the bus i or its neighboring buses at stage t, the auxiliary variable w i N t becomes zero. Therefore, the unobservability function ( P U i t ) would be equal to zero, subsequently. Moreover, according to (12) and (13), if the bus i at stage t becomes observable, being affected by a ZIB, then, the auxiliary variable v i N t becomes zero. Thus, the unobservability function ( P U i t ) would be equal to zero, subsequently. Hence, the nonlinear expression w i N t · v i N t used in (13) could be converted into the linear version using the following constraints:
U i t = r i N t = w i N t · v i N t ;     i Ω   t { 1 ,   2 ,   ,   M 1 } .  
r i N t w i N t ;     i Ω ,   t { 1 ,   2 ,   ,   M 1 } .
  r i N t v i N t ;     i Ω ,   t { 1 ,   2 ,   ,   M 1 } .  
r i N t w i N t + v i N t 1 ;     i Ω ,   t { 1 ,   2 ,   ,   M 1 } .
So, in general, the linear form of the objective function (5) is formulated as (18):
max   F i t = 1 N t = 1 M 1 i Ω ( 1 r i N t ) .
where (15)–(17) and:
{ w i j t w i ( j 1 ) t + x j t ;   w i j t w i ( j 1 ) t x j t ; i Ω ,   j { Ω 1 } , t { 1 ,   2 ,   ,   M 1 } . w i j t w i ( j 1 ) t ( 1 A i j ) + ( 1 x j t ) ; w i j t w i ( j 1 ) t ( 1 A i j ) ( 1 x j t ) ;
w i 1 t = ( 1 x 1 t · A i 1 )       i Ω , t { 1 ,   2 ,   ,   M 1 } .
{ v i j t v i ( j 1 ) t + y i , j t · z j ; v i j t v i ( j 1 ) t y i , j t · z j ; i Ω ,   j { Ω 1 } , t { 1 ,   2 ,   ,   M 1 } . v i j t v i ( j 1 ) t ( 1 A j ) + ( 1 y i , j t · z j ) ; v i j t v i ( j 1 ) t ( 1 A j ) ( 1 y i , j t · z j ) ;
v i 1 t = ( 1 y i , 1 t · z i · A 1 ) ;     i Ω , t { 1 ,   2 ,   ,   M 1 } .
Constraints (19)–(20) and (21)–(22) are the linear equivalent form of (11) and (12), respectively. The proof of these sets is similar. In the following, the proof for set (18) and (19) is presented. According to (11), 0 ≤ w i 1 t ≤ 1 since x 1 t is either 1 or 0 and, A i 1 lies in [0, 1]; likewise, 0 ≤ w i 2 t ≤ 1 since it results from the product of two terms which both lie in [0, 1]. In general 0 ≤ w i j t ≤ 1; j Ω . In order to consider the effect of the installed PMU at bus j on the probability of the unobservability index of the bus i ( P U i ), the third and the fourth inequalities of (19) are employed. In this case, w i j t = w i ( j 1 ) t ( 1 A i j ) . This equality is exactly the same as the one seen in (11). Notice that, w i j t and w i ( j 1 ) t   lie in [0, 1], so, 1 ≤ w i j t w i ( j 1 ) t ≤ 1; thus, the first and the second inequalities of (19) are complied. Similarly, according to (11), if there is no PMU at bus j, w i j t should be equal to w i ( j 1 ) t   while the first and the second inequalities of (19) guarantee this equality. In this case, the third and fourth inequalities would be complied since 1 w i j t w i ( j 1 ) t ( 1 A i j ) 1 .
Finally, in order to solve the proposed MPP, the integration of the objective function (18) and constraints (6)–(9), (15)–(17) and (19)–(22) should be taken into consideration as a mixed integer linear programming.

3.4. Power System Expansion Planning Consideration

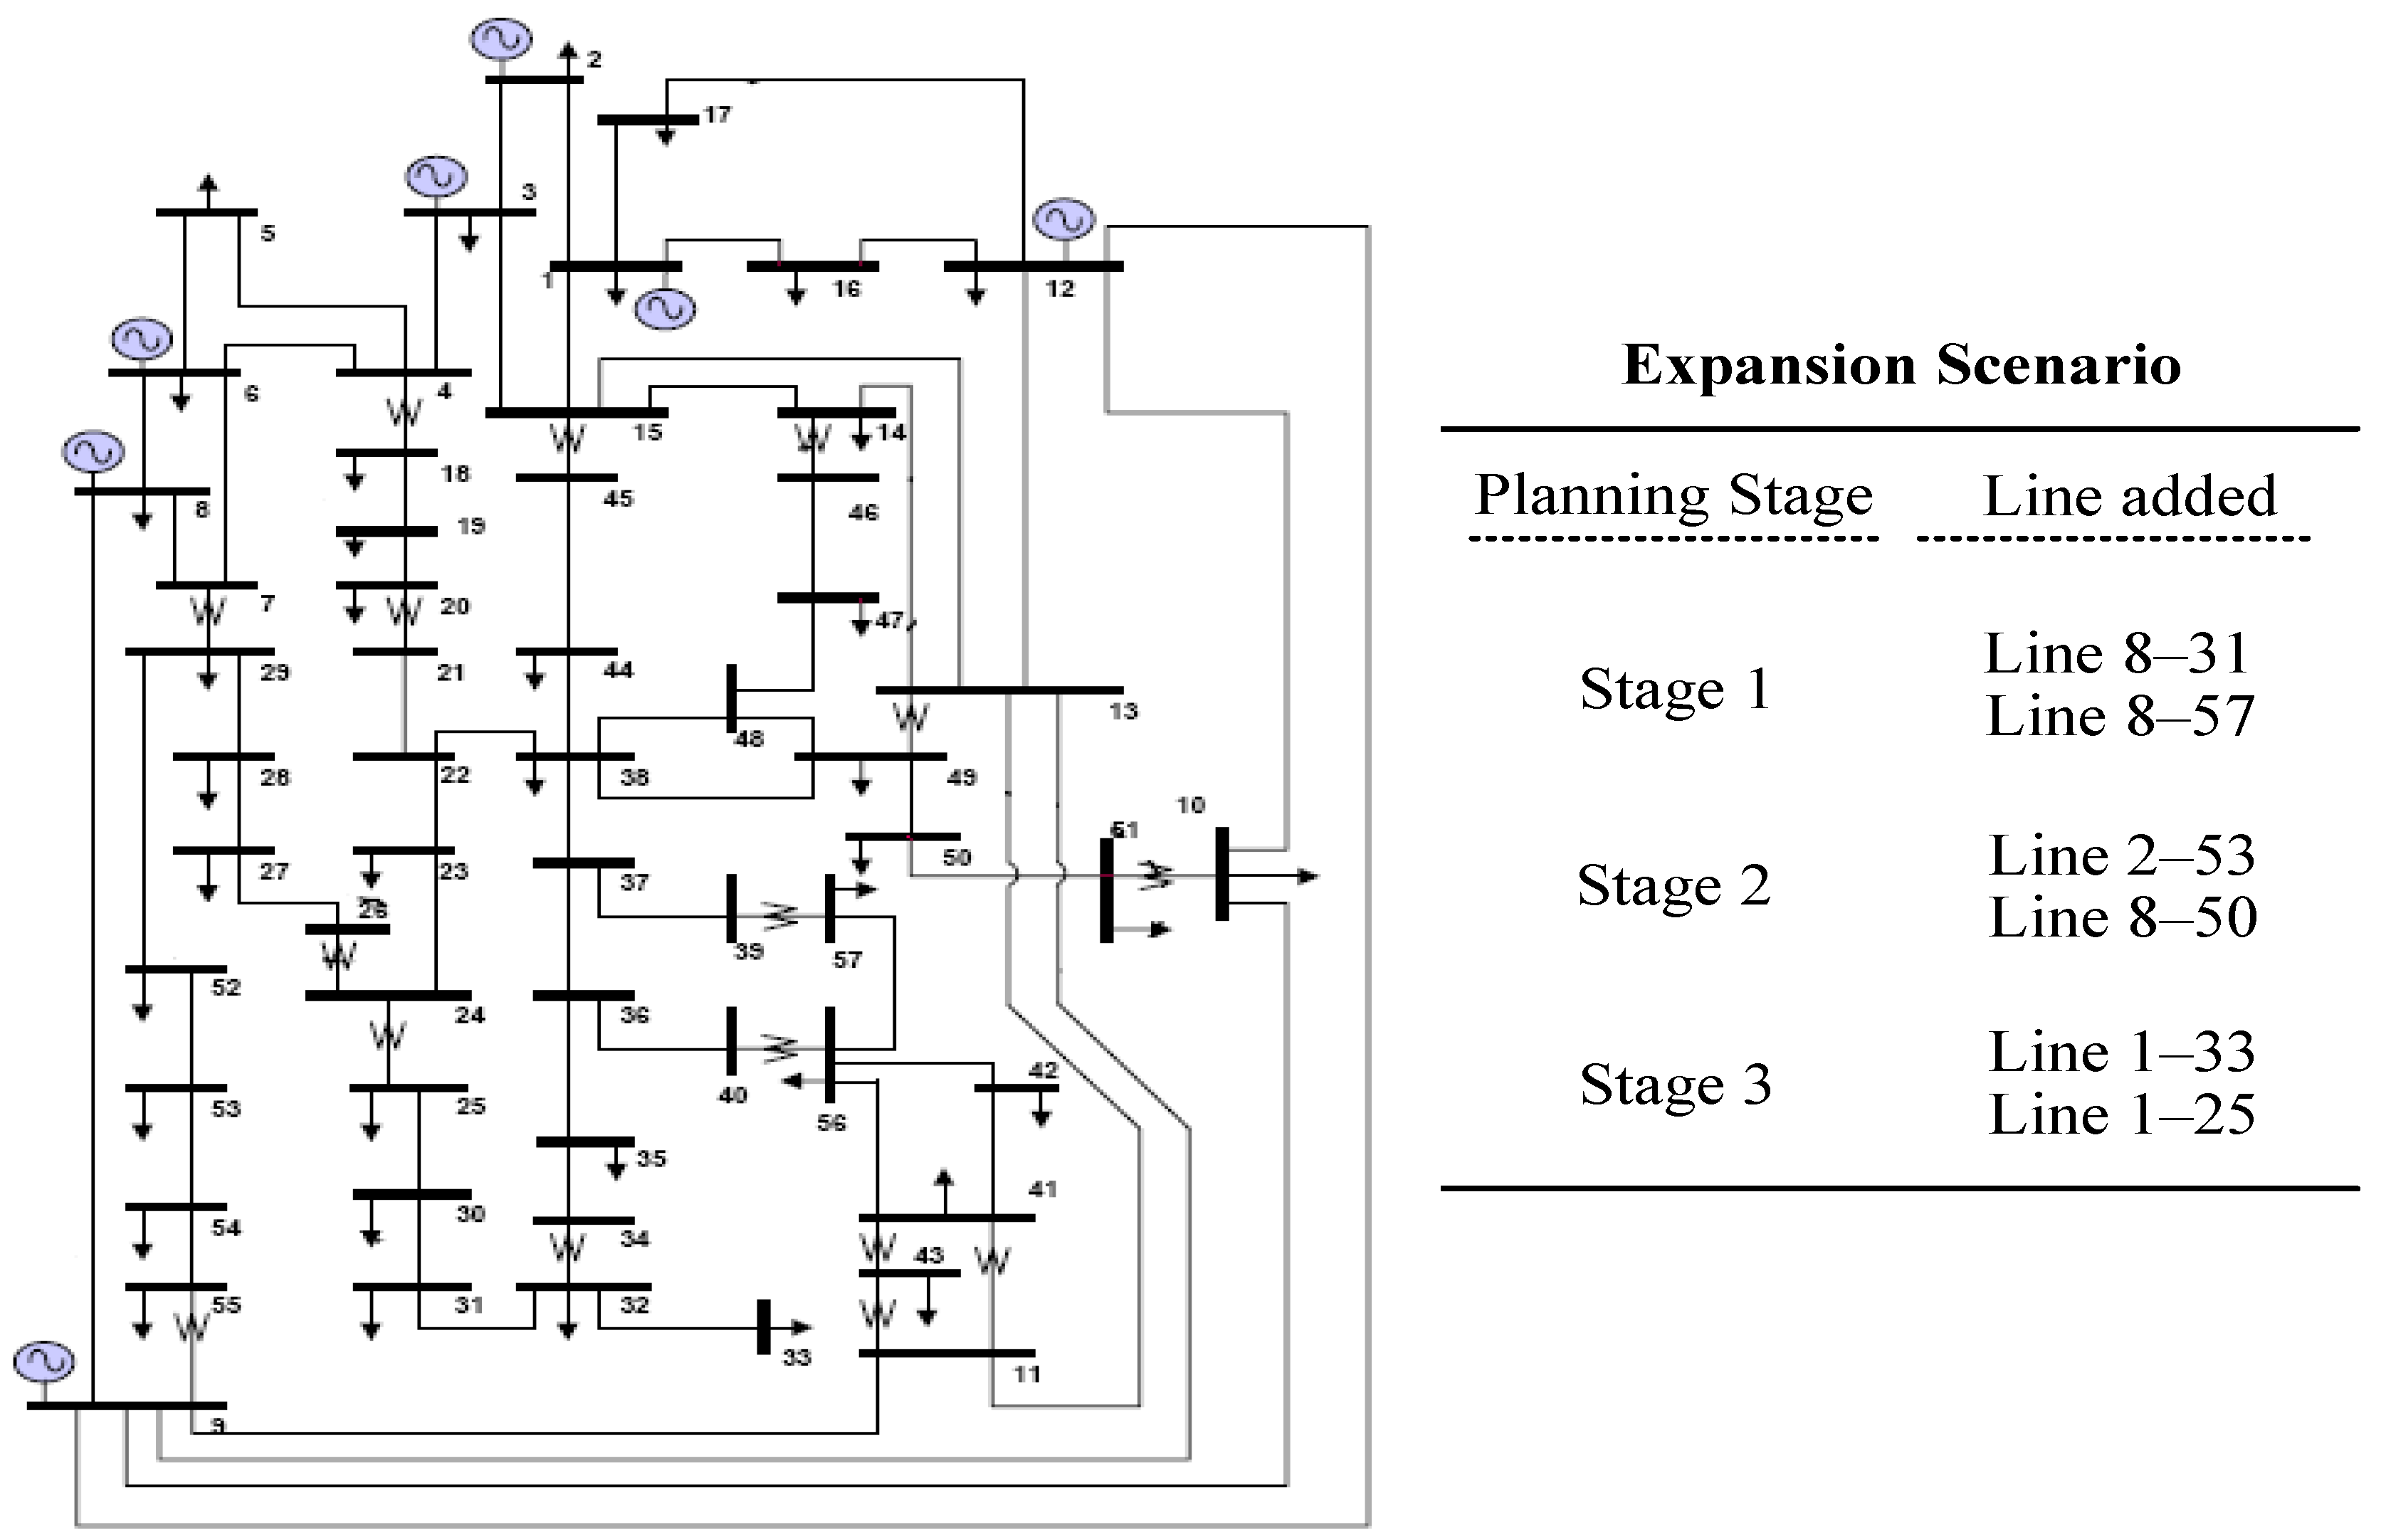
Knowing the expansion scenario over the PMU installation horizon, changes in the network topology can be considered by updating the network connectivity data for each stage. In this regard, the binary connectivity parameter a i j is replaced by a i j t . Parameter a i j t is defined as the binary parameter associated with the connectivity of buses i and j at stage t. This modification is based on the assumption that zero injection buses stay immutable and there are no changes in the generation or load bus over the placement horizon.

3.5. PMU Channel Limit Consideration

In practice, a PMU has a limited number of communication channels to measure the current phasor of the entering lines. Figure 1a demonstrates a schematic PMU with the unlimited communication channel, while the PMU in Figure 1b is able to measure just two entering buses due to channel limitation. The connectivity parameter a i j used in the above formulation links bus i to all buses that are connected to it based on the network graph. This definition of a i j is suitable for a PMU having unlimited channels. In other words, for Figure 1a, a i j = a i k = a i l = a i m = a i n = 1 . In Figure 1b, although the buses j, k and n are connected to the bus i, according to network graph, the PMU does not observe them. Hence, it is possible to model the PMU channel limits by applying the modification in the connectivity matrix where a PMU is supposed to measure a limited entering lines’ current phasor. To serve this purpose, parameter a i j must be transformed into a i j · β i j . Parameter β i j is a binary parameter mentioning that the PMU placed at bus i has a channel forward bus j if it is equal to 1, otherwise 0. In Figure 1b, β i l = β i m = 1 and β i j = β i k = β i n = 0 .
It is worth noting that this parameter is obtained from the single stage OPP for the final year. To explain in simple words, β i j is the input of the MPP and it is already known.

3.6. Monitoring Priority Consideration

Buses are not all of the same importance in power systems. A general classification distinguishes the load buses from the voltage controlled buses where generators are connected. From the dynamic point of view, monitoring the latter class, such as power plants, is of great significance compared to load buses. On the hand, power system planners and operators may follow other principles with different preferences. Thus, they may tend to observe the dynamic suspected areas more than other buses, or it may be crucial to observe nodes having a decisive role in power system market. Accordingly, in order to consider more technical aspects, the proposed MPP has been enhanced using a weight factor, w i , allowing the system operators to weigh the network buses importance from their priorities. In this respect, the objective function (5) is modified as Equation (23). It should be noted that the linear form of Equation (5), that is, Equation (18), can be modified, similarly.
max   F i t = t = 1 M 1   ( 1 N i Ω w i × P O i t ) .
where w i is the mentioned weight factor associated with the bus i. Under such circumstances, the system operators should compare the network nodes and weigh them in a proper way. As default, the factor is equal to one for all nodes when they are of the same importance. Also, if the system operator decides to observe a bus at the earlier stages of the proposed MPP, a big constant number should be devoted to the related weight factor, it means w i 1 .

4. Numerical Studies

This section provides four different scenarios to demonstrate the efficiency of the proposed approach. The first scenario focuses on the benefits of the incremental search space for the probabilistic MPP through a comprehensive comparative case study, while in the second scenario the capability of the proposed model in modeling the ZIB is investigated. In the third scenario, the channel limitation is applied to the test system while the probabilistic MPP considering ZIBs is solved. Eventually, the capability of the model to handle a large scale test system is examined in the fourth scenario regarding monitoring priority issue. Moreover, while aimed at simulating the proposed MPP, the model has been programmed in GAMS [38] optimization package environment using the CPLEX 12.2 solver. Configuration of the computer used for this programming is a 3.2-GHz CPU and 8 GB RAM.

4.1. First Scenario (A Comparative Study)

In order to show the advantage of the MPP with the incremental search space, the exact case used in [27] has been chosen in order to compare the results obtained. Although the model presented considers ZIBs, the effects of such buses are ignored in this scenario to draw a meaningful comparison with the results of [27]. Note that ZIBs are not taken into consideration in [27].
In this regard, the IEEE 57-bus test system [40], which grows in three stages, requires 24 PMUs at buses Ω pmu = { 1 , 3 , 6 , 8 , 11 , 12 , 14 , 18 , 20 , 22 , 24 , 28 , 30 , 32 , 35 , 38 , 39 , 40 , 41 , 45 , 47 , 51 , 52 , 54 } to guarantee that the observability value for each bus ( P O i 3 ) would be more than 0.985 after the planning. Figure 2 depicts this network as well as the transmission expansion planning. As is clear, six lines are planned to be constructed over three stages. Installing these PMUs during three stages is the optimization problem for which the proposed probabilistic model has been presented in Section 3.2. The availability lines table, data related to the probability availability of PMUs and their communication links as well as expansion planning are considered the same as those in [27]. Considering the related execution time of 8.5 s, Table 1 illustrates the obtained results of the proposed probabilistic MPP compared to those reported [27]. As can be seen in Table 1, by installing eight PMUs during the first installation phase, 36 buses will be observed by both methods. It should be noticed that the average probability index of the first stage, A P O 1 , obtained from both methods are approximately equal in value. The detailed observability value of each bus for the first stage is reported in Table 2.
According to Table 2, the buses which their P O i t quantities are indicated as non-zero value are observable.
Over the second stage, the results from the proposed method exhibit an improvement in the power system monitoring. In this stage, one more bus is observable in comparison with the conventional MPP, showing that the proposed dynamic approach has searched for the solution in a bigger search space. The results suggest that the studied IEEE 57-bus test system has more careful monitoring during the second stage which normally lasts 2 to 3 years. According to Table 1, the average probability index for this stage, A P O 2 , is improved from 0.8867 (in [27]) to 0.9026 which is considered as a significant enhancement from the probabilistic perspective. The observability values of the network buses for the second stage, P O i 2 , are illustrated in Table 3. As can be seen in this table, the number of unobservable buses resulted from the proposed MPP, yellow cells, is five; which is one bus less than the number of blue cells belonging to the conventional MPP.
Finally, by installing all 24 PMUs at the end of the planning, the APO index for the third stage would be equal to 0.9952, i.e., the initial target value. Obviously, the buses’ probability of observability indexes for the final stage, P O i 3 , are exactly similar for both methods, as represented in Table 4.
The test carried out in this scenario clearly shows the advantage of the proposed MPP over the conventional MPP approach. To answer the question of why the conventional method cannot necessarily guarantee the global optimum of the MPP problem, it would suffice to observe the results of Table 1 more deliberately. As is stated in Section 2, the conventional MPP attempts to maximize the observability of the stages hierarchically, from the first stage to the end, by performing an optimization problem for each stage. In other words, the conventional MPP organizes the PMU locations for the first stage so as to reach the maximum amount of A P O 1 . As is presented in Table 1, this amount is 0.6231 subject to the installation of eight PMUs at buses 3, 8, 12, 24, 28, 32, 38 and 41. By fixing these buses for the first stage solution and using other optimization procedures per each stage, the 16 remaining PMUs will be dedicated to the 16 remaining buses, for the rest of the planning stages. On the other hand, the aim of the proposed MPP is not maximizing the observability of the stages hierarchically, but maximizing the cumulative observability of all stages. Therefore, by installing eight PMUs at buses 1, 6, 12, 24, 32, 38, 41 and 54 based on the proposed MPP (Table 1), the APO index associated with the first stage would be 0.6230. Although the proposed MPP leads to an A P O 1 value that is a bit less than 0.6231 resulted from conventional method and their difference is negligible, it guarantees that the A P O i is the maximum. Accordingly, it leads to the APO value for the second stage that is considerably higher than that of the conventional one. Indeed, in the prevalent MPP, by specifying several buses to be equipped with PMUs at the first stage, they are not allowed to participate in the next stages’ placement, and a part of the problem’s search space may be missed.

4.2. Second Scenario (Validating ZIBs Consideration)

The aim of this scenario is to investigate the capability of the proposed model in considering ZIBs in the MPP and its validity. Since in the previous scenario the application of the proposed formulation was well demonstrated in terms of the probabilistic MPP, we are allowed to examine the accuracy of the model in the presence of ZIBs in the deterministic framework. In doing so, it would be sufficient to set parameters A j V m ,   A i j C m ,   A j P M U ,   A j L i n k and A i j L i n e to “1”. In this respect, the model is applied to IEEE 57-bus test system and the obtained results are compared to the results of Ref. [39] in which a completely different formulation is utilized for the deterministic MPP. In this case, the network comprises 15 ZIBs and 11 PMUs at specific buses (shown in Table 5) that make the system observable [26]. Considering this set of candidate buses, a three-stage PMU placement has been implemented with 4, 4 and 3 PMUs budget for the first to third stages, respectively. Table 5 represents both results. It is apparent that the results are the same as those obtained by different linear formulations. Indeed, it can be interpreted that the proposed model is successful in modeling the effects of ZIBs.
Overall, regarding the results and discussions stated above from two scenarios, the proposed linear formulation improves power system monitoring by searching for the optimal solution in a wider search space, dynamically, as well as considering ZIBs in the probabilistic MPP, which has been done for the first time in this paper.

4.3. Third Scenario (Probabilistic MPP Considering the Channel Limitation)

This scenario considers the effect of channel limitation in the proposed MPP. The test has been conducted on the IEEE 57-bus test system over three stages without expansion planning, while ZIBs are taken into account. The location of PMUs targeted for the final planning year is derived from [11]. In this reference, the authors have proposed an approach for the OPP in which the used PMUs come with limited channel. The results obtained for the IEEE 57-bus test system determine 14 PMUs for installation where the channel capacity of each PMU is considered to be 2. The exact locations of these PMUs and the detail of channel allocation for every PMU can be seen in Table 6. In addition, the probability values are as used in the first scenario. Regarding the mentioned information as input data of the proposed MPP, Table 7 and Table 8 demonstrate the probabilistic MPP results. The execution time in this case is 18.9 seconds, which is more than the first scenario due to adding constraints associated with ZIBs. As it can be seen from Table 7, the number of observable buses increases as more PMUs installed over stages. By installing all 14 PMUs, the network APO index becomes equal to 0.96935.
Furthermore, Table 8 illustrates the details of the P O i index for the third stage. By carefully investigating this table, it can be figured out that the P O indexes related to some buses are relatively low compared to others; for instance buses 38 and 39. This is why these buses have become observable due to the effect of ZIBs existing in the network; and, obviously, in order to make a bus observable in such a way, the probability of all associated lines and PMUs must be taken into account. On the other hand, from more practical aspects, a so-called ZIB is not a real zero-injection substation because of its internal consumption, such as lighting and so on, that may vary over the following years. Also, there is no guarantee that it will always remain a ZIB in future years. Overall, considering the theoretical results from Table 8 as well as practical mentioned issues, it is sensible to consider the PMU placement, both OPP and MPP, without considering ZIBs in realistic power systems.

4.4. Fourth Scenario (Large Scale Implementation Considering Monitoring Priority)

The applicability of the proposed MPP model to cover a large scale case study is the main goal of this scenario. In this regard, a three-stage probabilistic MPP is applied to the 2383-bus Polish power system [41] comprising 2896 lines. The network requires 746 PMUs to be fully observable without any channel limitation. The probability values of the PMUs are the same as previous tests, however the line availability values are assumed to be 0.9955 for all lines due to lack of exact information. Furthermore, the monitoring priority issue presented in section 3.6 is considered in this test. In [42], 75 buses of the 2383-bus system are specified as critical nodes based on the system operator principles. Table 9 lists these 75 critical buses that the system operators tend to monitor prior to other buses. The weighting factors associated with these buses are set to “100”, which is far more than “1” dedicated to other buses. Table 10 reports the related results for the three planning stages. Though, due to the space limit, the location of the installed PMUs as well as P O i index at each stage has not been reported, it is worth noting that all 75 critical buses mentioned become observable at the first planning stage. Moreover, the execution time in this case is 5.26 h, which is acceptable for problems in the planning mode.

5. Conclusions

This work represented a linear model reflecting improvements in the probabilistic Multistage PMU Placement (MPP) from several main aspects. On the one hand, a dynamic approach for installing PMUs over time horizon is used by searching for the optimal solution in a complete search space resulting in the global optimum of the problem. This technique has not been applied to the multistage PMU installation before, aimed at maximizing the observability in the probabilistic framework. In order to exhibit the effectiveness of the proposed approach compared to existing ones, a comparative test (the first scenario) was carried out under the same conditions of an existing study. The results obtained show that by installing the same number of PMUs, the probability observability index has been improved. On the other hand, Zero-Injection Bus ZIBs were taken into account in the probabilistic multistage framework for the first time. For this purpose, the concept of probability of observability introduced in [27] was expanded to a comprehensive model considering ZIB effects. Afterwards, the linearization proof containing a heavy mathematical burden was presented. In this respect, a test has been designed to install PMUs over the planning years, considering ZIBs and channel limits (the third scenario). The probabilistic results obtained from this test suggested that the probability of observability of those buses that become observable by means of the ZIB effect is relatively low in comparison to other buses. Also, the optimization mainly tended to make them observable in the last stage. This conclusion theoretically implies that, in reality, the PMU locations should be selected while ignoring the ZIBs effect. However, the operators should take the advantage of ZIBs in minimizing errors in the state estimation by providing additional data through the KCL. Finally, the performance of the formulation was validated on a large scale power system. In the fourth scenario, 75 buses of the 2383-bus Polish power system have been assumed to be critical, therefore, they have been given monitoring priority by system operators. The model successfully solved such a large scale problem and made all critical buses observable at the first stage of PMU installation.

Author Contributions

Investigation, Z.M.A.; Conceptualization and Methodology, S.-E.R.; Resources, F.H.G.; Supervision, M.S.J.; Validation, S.H.E.A.A.

Conflicts of Interest

The authors declare no conflict of interest.

References

  1. Monti, A.; Sadu, A.; Tang, J. Chapter 8—Wide Area Measurement Systems: Applications. In Phasor Measurement Units and Wide Area Monitoring Systems; Academic Press: Cambridge, MA, USA, 2016; pp. 177–234. [Google Scholar]
  2. Kim, D.I.; White, A.; Shin, Y.J. PMU-based Event Localization Technique for Wide-Area Power System. IEEE Trans. Power Syst. 2018. [Google Scholar] [CrossRef]
  3. Mousavi-Seyedi, S.S.; Aminifar, F.; Rezaei, M.R.; Hasani, R. Optimal fault location algorithm for series-compensated transmission lines based on PMU data. In Proceedings of the 2015 Smart Grid Conference (SGC), Tehran, Iran, 22–23 December 2015; pp. 105–109. [Google Scholar]
  4. Ivanković, I.; Kuzle, I.; Holjevac, N. Algorithm for Fast and Efficient Detection and Reaction to Angle Instability Conditions Using Phasor Measurement Unit Data. Energies 2018, 11, 681. [Google Scholar] [CrossRef]
  5. Su, H.-Y.; Liu, T.-Y. GECM-Based Voltage Stability Assessment Using Wide-Area Synchrophasors. Energies 2017, 10, 1601. [Google Scholar] [CrossRef]
  6. Su, H.Y.; Liu, C.W. Estimating the Voltage Stability Margin Using PMU Measurements. IEEE Trans. Power Syst. 2016, 31, 3221–3229. [Google Scholar] [CrossRef]
  7. Vournas, C.D.; Lambrou, C.; Mandoulidis, P. Voltage Stability Monitoring From a Transmission Bus PMU. IEEE Trans. Power Syst. 2017, 32, 3266–3274. [Google Scholar] [CrossRef]
  8. Yang, H.; Zhang, W.; Chen, J.; Wang, L. PMU-based voltage stability prediction using least square support vector machine with online learning. Electr. Power Syst. Res. 2018, 160, 234–242. [Google Scholar] [CrossRef]
  9. Tang, Y.; Li, F.; Zheng, C.; Wang, Q.; Wu, Y. PMU Measurement-Based Intelligent Strategy for Power System Controlled Islanding. Energies 2018, 11, 143. [Google Scholar] [CrossRef]
  10. Ghosh, P.K.; Chatterjee, S.; Roy, B.K.S. Optimal PMU placement solution: Graph theory and MCDM-based approach. IET Gen. Transm. Distrib. 2017, 11, 3371–3380. [Google Scholar] [CrossRef]
  11. Manousakis, N.M.; Korres, G.N. Optimal PMU Placement for Numerical Observability Considering Fixed Channel Capacity—A Semidefinite Programming Approach. IEEE Trans. Power Syst. 2016, 31, 3328–3329. [Google Scholar] [CrossRef]
  12. Maji, T.K.; Acharjee, P. Multiple Solutions of Optimal PMU Placement Using Exponential Binary PSO Algorithm for Smart Grid Applications. IEEE Trans. Ind. Appl. 2017, 53, 2550–2559. [Google Scholar] [CrossRef]
  13. Aminifar, F.; Khodaei, A.; Fotuhi-Firuzabad, M.; Shahidehpour, M. Contingency-Constrained PMU Placement in Power Networks. IEEE Trans. Power Syst. 2010, 25, 516–523. [Google Scholar] [CrossRef]
  14. Khajeh, K.G.; Bashar, E.; Rad, A.M.; Gharehpetian, G.B. Integrated Model Considering Effects of Zero Injection Buses and Conventional Measurements on Optimal PMU Placement. IEEE Trans. Smart Grid 2017, 8, 1006–1013. [Google Scholar]
  15. Chen, J.; Abur, A. Placement of PMUs to Enable Bad Data Detection in State Estimation. IEEE Trans. Power Syst. 2006, 21, 1608–1615. [Google Scholar] [CrossRef]
  16. Shahriar, S.M.; Habiballah, O.I.; Hussein, H. Optimization of Phasor Measurement Unit (PMU) Placement in Supervisory Control and Data Acquisition (SCADA)-Based Power System for Better State-Estimation Performance. Energies 2018, 11, 570. [Google Scholar] [CrossRef]
  17. Azizi, S.; Dobakhshari, A.S.; Sarmadi, S.A.N.; Ranjbar, A.M. Optimal PMU Placement by an Equivalent Linear Formulation for Exhaustive Search. IEEE Trans. Smart Grid 2012, 3, 174–182. [Google Scholar] [CrossRef]
  18. Aghaei, J.; Baharvandi, A.; Rabiee, A.; Akbari, M.A. Probabilistic PMU Placement in Electric Power Networks: An MILP-Based Multiobjective Model. IEEE Trans. Ind. Inf. 2015, 11, 332–341. [Google Scholar] [CrossRef]
  19. Gou, B. Generalized Integer Linear Programming Formulation for Optimal PMU Placement. IEEE Trans. Power Syst. 2008, 23, 1099–1104. [Google Scholar] [CrossRef]
  20. Korres, G.N.; Manousakis, N.M.; Xygkis, T.C.; Löfberg, J. Optimal phasor measurement unit placement for numerical observability in the presence of conventional measurements using semi-definite programming. IET Gen. Transm. Distrib. 2015, 9, 2427–2436. [Google Scholar] [CrossRef]
  21. Rashidi, F.; Abiri, E.; Niknam, T.; Salehi, M.R. Optimal placement of PMUs with limited number of channels for complete topological observability of power systems under various contingencies. Int. J. Electr. Power Energy Syst. 2015, 67, 125–137. [Google Scholar] [CrossRef]
  22. Rather, Z.H.; Chen, Z.; Thøgersen, P.; Lund, P.; Kirby, B. Realistic Approach for Phasor Measurement Unit Placement: Consideration of Practical Hidden Costs. IEEE Trans. Power Deliv. 2015, 30, 3–15. [Google Scholar] [CrossRef]
  23. Nuqui, R.F.; Phadke, A.G. Phasor measurement unit placement techniques for complete and incomplete observability. IEEE Trans. Power Deliv. 2005, 20, 2381–2388. [Google Scholar] [CrossRef]
  24. Dua, D.; Dambhare, S.; Gajbhiye, R.K.; Soman, S.A. Optimal Multistage Scheduling of PMU Placement: An ILP Approach. IEEE Trans. Power Deliv. 2008, 23, 1812–1820. [Google Scholar] [CrossRef] [Green Version]
  25. Mahaei, S.M.; Hagh, M.T. Minimizing the number of PMUs and their optimal placement in power systems. Electr. Power Syst. Res. 2012, 83, 66–72. [Google Scholar] [CrossRef]
  26. Sodhi, R.; Srivastava, S.C.; Singh, S.N. Multi-criteria decision-making approach for multistage optimal placement of phasor measurement units. IET Gen. Transm. Distrib. 2011, 5, 181–190. [Google Scholar] [CrossRef]
  27. Aminifar, F.; Fotuhi-Firuzabad, M.; Shahidehpour, M.; Khodaei, A. Probabilistic Multistage PMU Placement in Electric Power Systems. IEEE Trans. Power Deliv. 2011, 26, 841–849. [Google Scholar] [CrossRef]
  28. Mazhari, S.M.; Monsef, H.; Lesani, H.; Fereidunian, A. A Multi-Objective PMU Placement Method Considering Measurement Redundancy and Observability Value Under Contingencies. IEEE Trans. Power Syst. 2013, 28, 2136–2146. [Google Scholar] [CrossRef]
  29. Bo, W.; Jiang, Q.; Cao, Y. Transmission network fault location using sparse PMU measurements. In Proceedings of the 2009 International Conference on Sustainable Power Generation and Supply, Nanjing, China, 6–7 April 2009; pp. 1–6. [Google Scholar]
  30. Wen, M.H.F.; Xu, J.; Li, V.O.K. Optimal Multistage PMU Placement for Wide-Area Monitoring. IEEE Trans. Power Syst. 2013, 28, 4134–4143. [Google Scholar] [CrossRef] [Green Version]
  31. Almasabi, S.; Mitra, J. Multi-stage optimal PMU placement including substation infrastructure. In Proceedings of the 2017 IEEE Industry Applications Society Annual Meeting, Cincinnati, OH, USA, 1–5 October 2017; pp. 1–8. [Google Scholar]
  32. Rahman, N.H.A.; Zobaa, A.F. Integrated Mutation Strategy with Modified Binary PSO Algorithm for Optimal PMUs Placement. IEEE Trans. Ind. Inf. 2017, 13, 3124–3133. [Google Scholar] [CrossRef]
  33. Rahman, N.H.A.; Awalin, L.J. Strategic PMUs placement considering power flow measurements using binary particle swarm optimization method. In Proceedings of the 2017 International Conference on Engineering Technology and Technopreneurship (ICE2T), Kuala Lumpur, Malaysia, 18–20 September 2017; pp. 1–3. [Google Scholar]
  34. Taher, S.A.; Mahmoodi, H.; Aghaamouei, H. Optimal PMU location in power systems using MICA. Alex. Eng. J. 2016, 55, 399–406. [Google Scholar] [CrossRef]
  35. Manousakis, N.M.; Korres, G.N. A Weighted Least Squares Algorithm for Optimal PMU Placement. IEEE Trans. Power Syst. 2013, 28, 3499–3500. [Google Scholar] [CrossRef]
  36. Soroudi, A. Power System Optimization Modeling in GAMS; Springer: Berlin, Germany, 2017. [Google Scholar]
  37. IBM ILOG CPLEX Optimization. Available online: https://www.ibm.com/products/ilog-cplex-optimization-studio (accessed on 24 May 2018).
  38. Download Current GAMS Distribution. Available online: https://www.gams.com/download/ (accessed on 19 May 2018).
  39. Razavi, S.E.; Falaghi, H.; Ramezani, M. A new integer linear programming approach for multi-stage PMU placement. In Proceedings of the 2013 Smart Grid Conference (SGC), Tehran, Iran, 17–18 December 2013; pp. 119–124. [Google Scholar]
  40. Christie, R. Power System Test Archive. Available online: http://www.ee.wash-ington.edu/research/pstca (accessed on 30 April 2018).
  41. Download MATPOWER 6.0. Available online: http://www.pserc.cornell.edu/matpower (accessed on 16 December 2016).
  42. Paudel, J.; Xu, X.; Balasubramaniam, K.; Makram, E.B. A Strategy for PMU Placement Considering the Resiliency of Measurement System. J. Power Energy Eng. 2015, 3, 29. [Google Scholar] [CrossRef]
Figure 1. (a) A schematic Phasor Measurement Unit (PMU) without any communication channel limitation; (b) A schematic PMU with the communication channel limitation.
Energies 11 01429 g001
Figure 2. Standard IEEE 57-bus test system.
Energies 11 01429 g002
Table 1. Proposed Multistage PMU Placement (MPP) results for the IEEE 57-Bus System Compared to the Ref. [27] (First Scenario).
Planning StagesNo. of PMUs to Be InstalledPMU Locations
(MPP Result)
No. of Observable Buses A P O i Index
Proposed MPPRef. [27]Proposed MPPRef. [27]Proposed MPPRef. [27]
Stage 181, 6, 12, 24, 32, 38, 41, 543, 8, 12, 24, 28, 32, 38, 4136360.62300.6231
Stage 283, 14, 20, 28, 35, 39, 51, 521, 6, 14, 20, 35, 47, 52, 5452510.90260.8867
Stage 388, 11, 18, 22, 30, 40, 45, 4711, 18, 22, 30, 39, 40, 45, 5257570.99520.9952
Table 2. The Obtained Probability of Observability Index for the first stage, P O i 1 , Compared to the Ref. [27] (First Scenario).
Stage 1
Bus No. P O i 1 P O i 1 P O i 1 P O i 1
Proposed MPPRef. [27]Bus No.Proposed MPPRef. [27]Bus No.Proposed MPPRef. [27]Bus No.Proposed MPPRef. [27]
10.990160160.999740.98457310.983880.99973460.985160.98516
20.984970.98338170.999710.98190320.990160.990164700
300.990161800330.981010.981014800
40.981500.986551900340.983090.98309490.983280.98328
50.98704020003500500.985060.98506
60.990160.98556210036005100
70.981900.98684220.986840.98684370.985360.985365200
80.985560.99016230.982100.98210380.990160.990165300
90.985160.99975240.990160.990163900540.982200
100.985160.98516250.985560.985564000550.990160
110.985560.98556260.985560.98556410.990160.99016560.985160
120.990160.990162700.98546420.985760.98576570.986150.98615
130.982990.982992800.99016430.982890.98289
14002900.98437440.981700.98170
150.986650.9826930004500
Table 3. The Obtained Probability of Observability Index for the second stage, P O i 2 , Compared to the Ref. [27] (First Scenario).
Stage 2
Bus No. P O i 2 P O i 2 P O i 2 P O i 2
Proposed MPPRef. [27]Bus No.Proposed MPPRef. [27]Bus No.Proposed MPPRef. [27]Bus No.Proposed MPPRef. [27]
10.990160.99016150.999740.99974310.983880.99973460.982100.99969
20.999750.99975170.999710.99971320.990160.990164700.99016
30.990160.990161800330.981010.98101480.983280.99978
40.999750.99975190.983780.98378340.999670.99967490.985060.98506
50.987040.98704200.990160.99016350.990160.99016500.981210.98516
60.990160.99985210.985160.98516360.985660.98566510.990160
70.981910.99976220.986840.98684370.999750.98536520.990160.99016
80.985560.99985230.982110.98210380.990160.99016530.999720.99972
90.985160.99975240.990160.99016390.990160540.990160.99016
100.999810.98516250.985560.985564000550.985160.98516
110.985560.98556260.985560.98556410.990160.99016560.986150.98615
120.990160.99016270.985460.98546420.985760.98576570.987170.98675
130.999760.99976280.990160.99016430.982890.98289
140.990160.99016290.999750.99975440.981700.98170
150.999990.9999930004500
Table 4. The Obtained Probability of Observability Index for the third stage, P O i 3 , Compared to the Ref. [27] (First Scenario).
Stage 3
Bus No. P O i 3 Bus No. P O i 3 Bus No. P O i 3 Bus No. P O i 3 Bus No. P O i 3 Bus No. P O i 3
Both MethodsBoth MethodsBoth MethodsBoth MethodsBoth MethodsBoth Methods
10.99016110.99985210.99980310.99999410.99985510.99016
20.99975120.99016220.99987320.99016420.98576520.99016
30.99016130.99999230.99970330.99968430.99969530.99972
40.99999140.99016240.99016340.99967440.99971540.99016
50.98704150.99999250.99999350.99016450.99016550.98516
60.99985150.99974260.98556360.99975460.99969560.99982
70.99976170.99971270.98546370.99975470.99016570.99973
80.99985180.99016280.99016380.99987480.99978
90.99999190.99969290.99975390.99016490.98506
100.99981200.99016300.99016400.99016500.99968
Table 5. Three-stage PMU Placement for IEEE 57-bus Test Systems Considering zero-injection bus (ZIB) Effects (Second Scenario).
ZIBs LocationsPlanning StagesNo. of PMUs to Be Installed PMU Locations (MSPP Result)No. of Observable Buses
4, 7, 11, 21, 22, 24, 26, 34, 36, 37, 39, 40, 45, 46, 48Stage 144, 13, 38, 5629
Stage 241, 20, 25, 5447
Stage 3332, 51, 5457
Table 6. Optimal PMU Placement (OPP) results for the IEEE 57-bus Test Systems Considering ZIBs and channel limitation [11] (Third Scenario).
No. of PMUsChannel CapacityPMU LocationsChannel Allocation
1422, 5, 9, 12, 15, 20, 25, 28, 32, 41, 49, 51, 53, 562(2-1, 2-3), 5(5-4, 5-6), 9(9-8, 9-55), 12(12-16, 12-17), 15(15-14, 15-45), 20(20-19, 20-21), 25(25-24, 25-30), 28(28-27,28-29), 32(32-31, 32-33), 41(41-42, 41-43), 49(49-13, 49-48), 51(51-10, 51-50), 53(53-52, 53-54), 56(56-40, 56-57)
Table 7. The Obtained MPP Results for IEEE 57-bus Systems Considering ZIBs and Channel Limitation (Third Scenario).
Planning StagesNo. of PMUs to Be InstalledPMU Locations with Assigned ChannelsNo. of Observable Buses A P O i Index
Stage 1515(15-14, 15-45), 20(20-19, 20-21), 25(25-24, 25-30), 28(28-27,28-29), 56(56-40, 56-57)240.40804
Stage 252(2-1, 2-3), 5(5-4, 5-6), 9(9-8, 9-55), 41(41-42, 41-43), 49(49-13, 49-48)440.74573
Stage 3412(12-16, 12-17), 32(32-31, 32-33), 51(51-10, 51-50), 53(53-52, 53-54)570.96935
Table 8. The Obtained Probability of Observability Index for the third stage, P O i 3 (Third Scenario).
Stage 3
Bus No.
P O i 3
Bus No.
P O i 3
Bus No.
P O i 3
Bus No.
P O i 3
Bus No.
P O i 3
Bus No.
P O i 3
10.98497110.92966210.98516310.98388410.99015510.99015
20.99015120.99015220.96943320.99015420.98576520.98427
30.98338130.98427230.92917330.98101430.98289530.99015
40.98131140.98249240.98556340.91945440.96671540.98220
50.99015150.99015250.99015350.94173450.98497550.98605
60.98704150.98457260.96532360.96933460.81845560.99015
70.94178170.98190270.98546370.90653470.84405570.98625
80.98338180.92097280.99015380.87838480.98328--
90.99015190.98378290.98437390.83798490.99015--
100.98724200.99015300.98427400.98704500.98121--
Table 9. 75 Critical buses of the 2383-bus Polish power system [42] (Fourth Scenario).
Test SystemCritical Buses
2383-bus system6, 18, 29, 133, 246, 309, 310, 321, 322, 353, 354, 361, 365, 366, 374, 425, 456, 494, 511, 525, 526, 527, 546, 556, 613, 644, 645, 679, 694, 717, 750, 754, 755, 796, 797, 870, 923, 944, 978, 979, 1050, 1096, 1120, 1138, 1190, 1201, 1212, 1213, 1216, 1217, 1245, 1483, 1504, 1524, 1647, 1664, 1669, 1680, 1761, 1822, 1882, 1883, 1885, 1919, 1920, 2112, 2113, 2166, 2195, 2196, 2235, 2258, 2261, 2274, 2323
Table 10. The Obtained MPP Results for 2383-bus Polish Power System (Fourth Scenario).
Planning StagesNo. of PMUs to Be InstalledNo. of Observable Buses A P O i Index
Stage 124913400.5545
Stage 224920300.8412
Stage 324823830.9895

