Article

A Network Psychometric Analysis of Math Anxiety Factors in Italian Psychology Students

by
Emma Franchino
1,
Luciana Ciringione
2,
Luisa Canal
2,
Ottavia Marina Epifania
2,
Luigi Lombardi
2,
Gianluca Lattanzi
3 and
Massimo Stella
1,*
1
CogNosco Lab, Department of Psychology and Cognitive Sciences, University of Trento, 38068 Rovereto, Italy
2
Department of Psychology and Cognitive Sciences, University of Trento, 38068 Rovereto, Italy
3
Department of Physics, University of Trento, 38123 Povo, Italy
*
Author to whom correspondence should be addressed.
Psychol. Int. 2025, 7(2), 48; https://doi.org/10.3390/psycholint7020048
Submission received: 7 April 2025 / Revised: 27 May 2025 / Accepted: 3 June 2025 / Published: 9 June 2025
(This article belongs to the Section Psychometrics and Educational Measurement)

Abstract

:
Dealing with mathematics can induce significant anxiety, affecting academic performance: this phenomenon is known as Math Anxiety (MA). While math anxiety scales were mostly developed in English, some have been translated and validated for Italian populations (e.g., the Abbreviated Math Anxiety Scale). This study translated the 3-factor MAS-UK scale into Italian, producing a new tool, MAS-IT, which was validated in a sample of 324 Italian psychology undergraduates. Confirmatory Factor Analysis (CFA) tested the original MAS-UK 3-factor model and revealed that it did not fit the MAS-IT data. A subsequent Exploratory Graph Analysis (EGA) identified four distinct factors of math anxiety in MAS-IT. The “Passive Observation MA” factor remained stable across the analyses, whereas the “Evaluation MA” and “Everyday/Social MA” items showed poor stability. These quantitative findings suggest potential cultural or contextual differences in the expression of math anxiety among today’s psychology undergraduates, highlighting the need for more appropriate assessment tools tailored to this population.

1. Introduction

Anxiety is an evolutionary feedback mechanism designed to defend individuals from potential dangers and threats (Lovibond & Lovibond, 1995). For instance, the thought of meeting a predator might cause physical and emotional discomfort for a tourist visiting a lush forest. Such discomfort would drive the tourist away without ever encountering the predator. In more general terms, anxiety helps individuals avoid threats without ever facing real dangers. Unfortunately, anxiety can also be triggered by experiences that are not intrinsically dangerous (Hunt et al., 2011). For instance, an equation on a blackboard might trigger feelings of anxiety as intense as those inspired by the thought of a voracious predator. Are these thoughts equally threatening? One might argue that wild predators are far more dangerous than equations and blackboards. However, for many people, elements related to mathematics can trigger profound sensations of anxiety, a phenomenon known as math anxiety (Ashcraft & Krause, 2007; Stella, 2022).
Math anxiety is categorized under generalized anxiety disorders in the Diagnostic and Statistical Manual of Mental Disorders (DSM-V, American Psychiatric Association, 2013); however, not everyone suffering from math anxiety would meet the criteria for a general anxiety disorder. Furthermore, math anxiety differs from other anxiety disorders due to its context specificity (Luttenberger et al., 2018). Math anxiety can be defined as a context-dependent feeling of tension triggered by experiences related to mathematics. Individuals might experience math anxiety when dealing with numbers, when feeling observed by others in math classes, or when performing tasks involving mathematical concepts (Stella, 2022).
The physiological and emotional effects of math anxiety are very similar to those of general anxiety (e.g., increased heart rate, stomach aches, feelings of tension, apprehension, and nervousness) (Paechter et al., 2017; Papousek et al., 2012), while some more specific consequences have been observed on the cognitive level. In particular, a study by Ashcraft and Krause (2007) demonstrated a strong relationship between working memory, math anxiety, and math performance. Working memory is a subcomponent of cognitive memory and is responsible for processing symbols, rules, and skills related to language and mathematical knowledge (Ashcraft & Krause, 2007). Prior findings identified a positive correlation between the complexity of math problems and the load on working memory (LeFevre et al., 2005). Ashcraft and Krause (2007) further showed that math anxiety can drain the resources of working memory, compromising its efficiency and reducing its maximum capacity. This relationship between working memory and math anxiety helps explain the negative correlation between math anxiety and math achievement (Ashcraft & Krause, 2007). Moreover, lower performance in solving math problems can reinforce feelings of inadequacy or negative biases (Stella, 2022). Interestingly, math anxiety might coexist with positive or neutral perceptions of science (Stella, 2020; Stella & Zaytseva, 2020), making its detection a complex and concerning challenge. The most concerning aspect of math anxiety is that it can cause individuals to avoid mathematics, promote distorted perceptions of the subject (Stella & Zaytseva, 2020), and perpetuate higher levels of math anxiety through a vicious cycle (Wilson, 1999).
Worldwide statistics show that math anxiety is a global phenomenon, even in countries known for advanced STEM curricula, such as the United States, where 93% of adults reported experiencing math anxiety during their education (Blazer, 2011). Research has found that students in the humanities and psychology are among the populations most affected by math anxiety (Onwuegbuzie & Wilson, 2003). Psychology students must take several courses in mathematics and statistics throughout their academic studies (Siew et al., 2019). According to Messer et al. (1999), nearly 77% of psychology curricula include at least one statistics-related course, which involves mathematical content (Messer et al., 1999). For these students, math-related courses can be particularly challenging and negatively impact academic progress, leading to delayed graduation, premature career changes, or even failure to complete their degree (Siew et al., 2019).
Over time, various statistical methods have been developed to measure math anxiety, aiming to identify its key factors and potential ways to overcome it. Richardson and Suinn (1972) were the first to operationalize the math anxiety construct by developing the Mathematics Anxiety Rating Scale (MARS). The MARS, designed to measure math anxiety in various contexts, had a test–retest reliability of 0.85 and a Cronbach’s alpha of 0.97 (Capraro et al., 2001). Although MARS has been one of the most cited scales for measuring math anxiety, its length (98 items) prompted researchers to develop more concise versions. A revised and shorter version of MARS, known as MARS-R, was developed by Hopko (2003), retaining 12 items and yielding a two-factor model (Hopko, 2003).
One of the most recently developed math anxiety scales is the Mathematics Anxiety Scale-UK (MAS; Hunt et al., 2011), which was originally validated in a British undergraduate population. The MAS-UK includes 23 items related to statements about situations involving mathematics and Math Anxiety (MA). The items identify three main factors contributing to math anxiety:
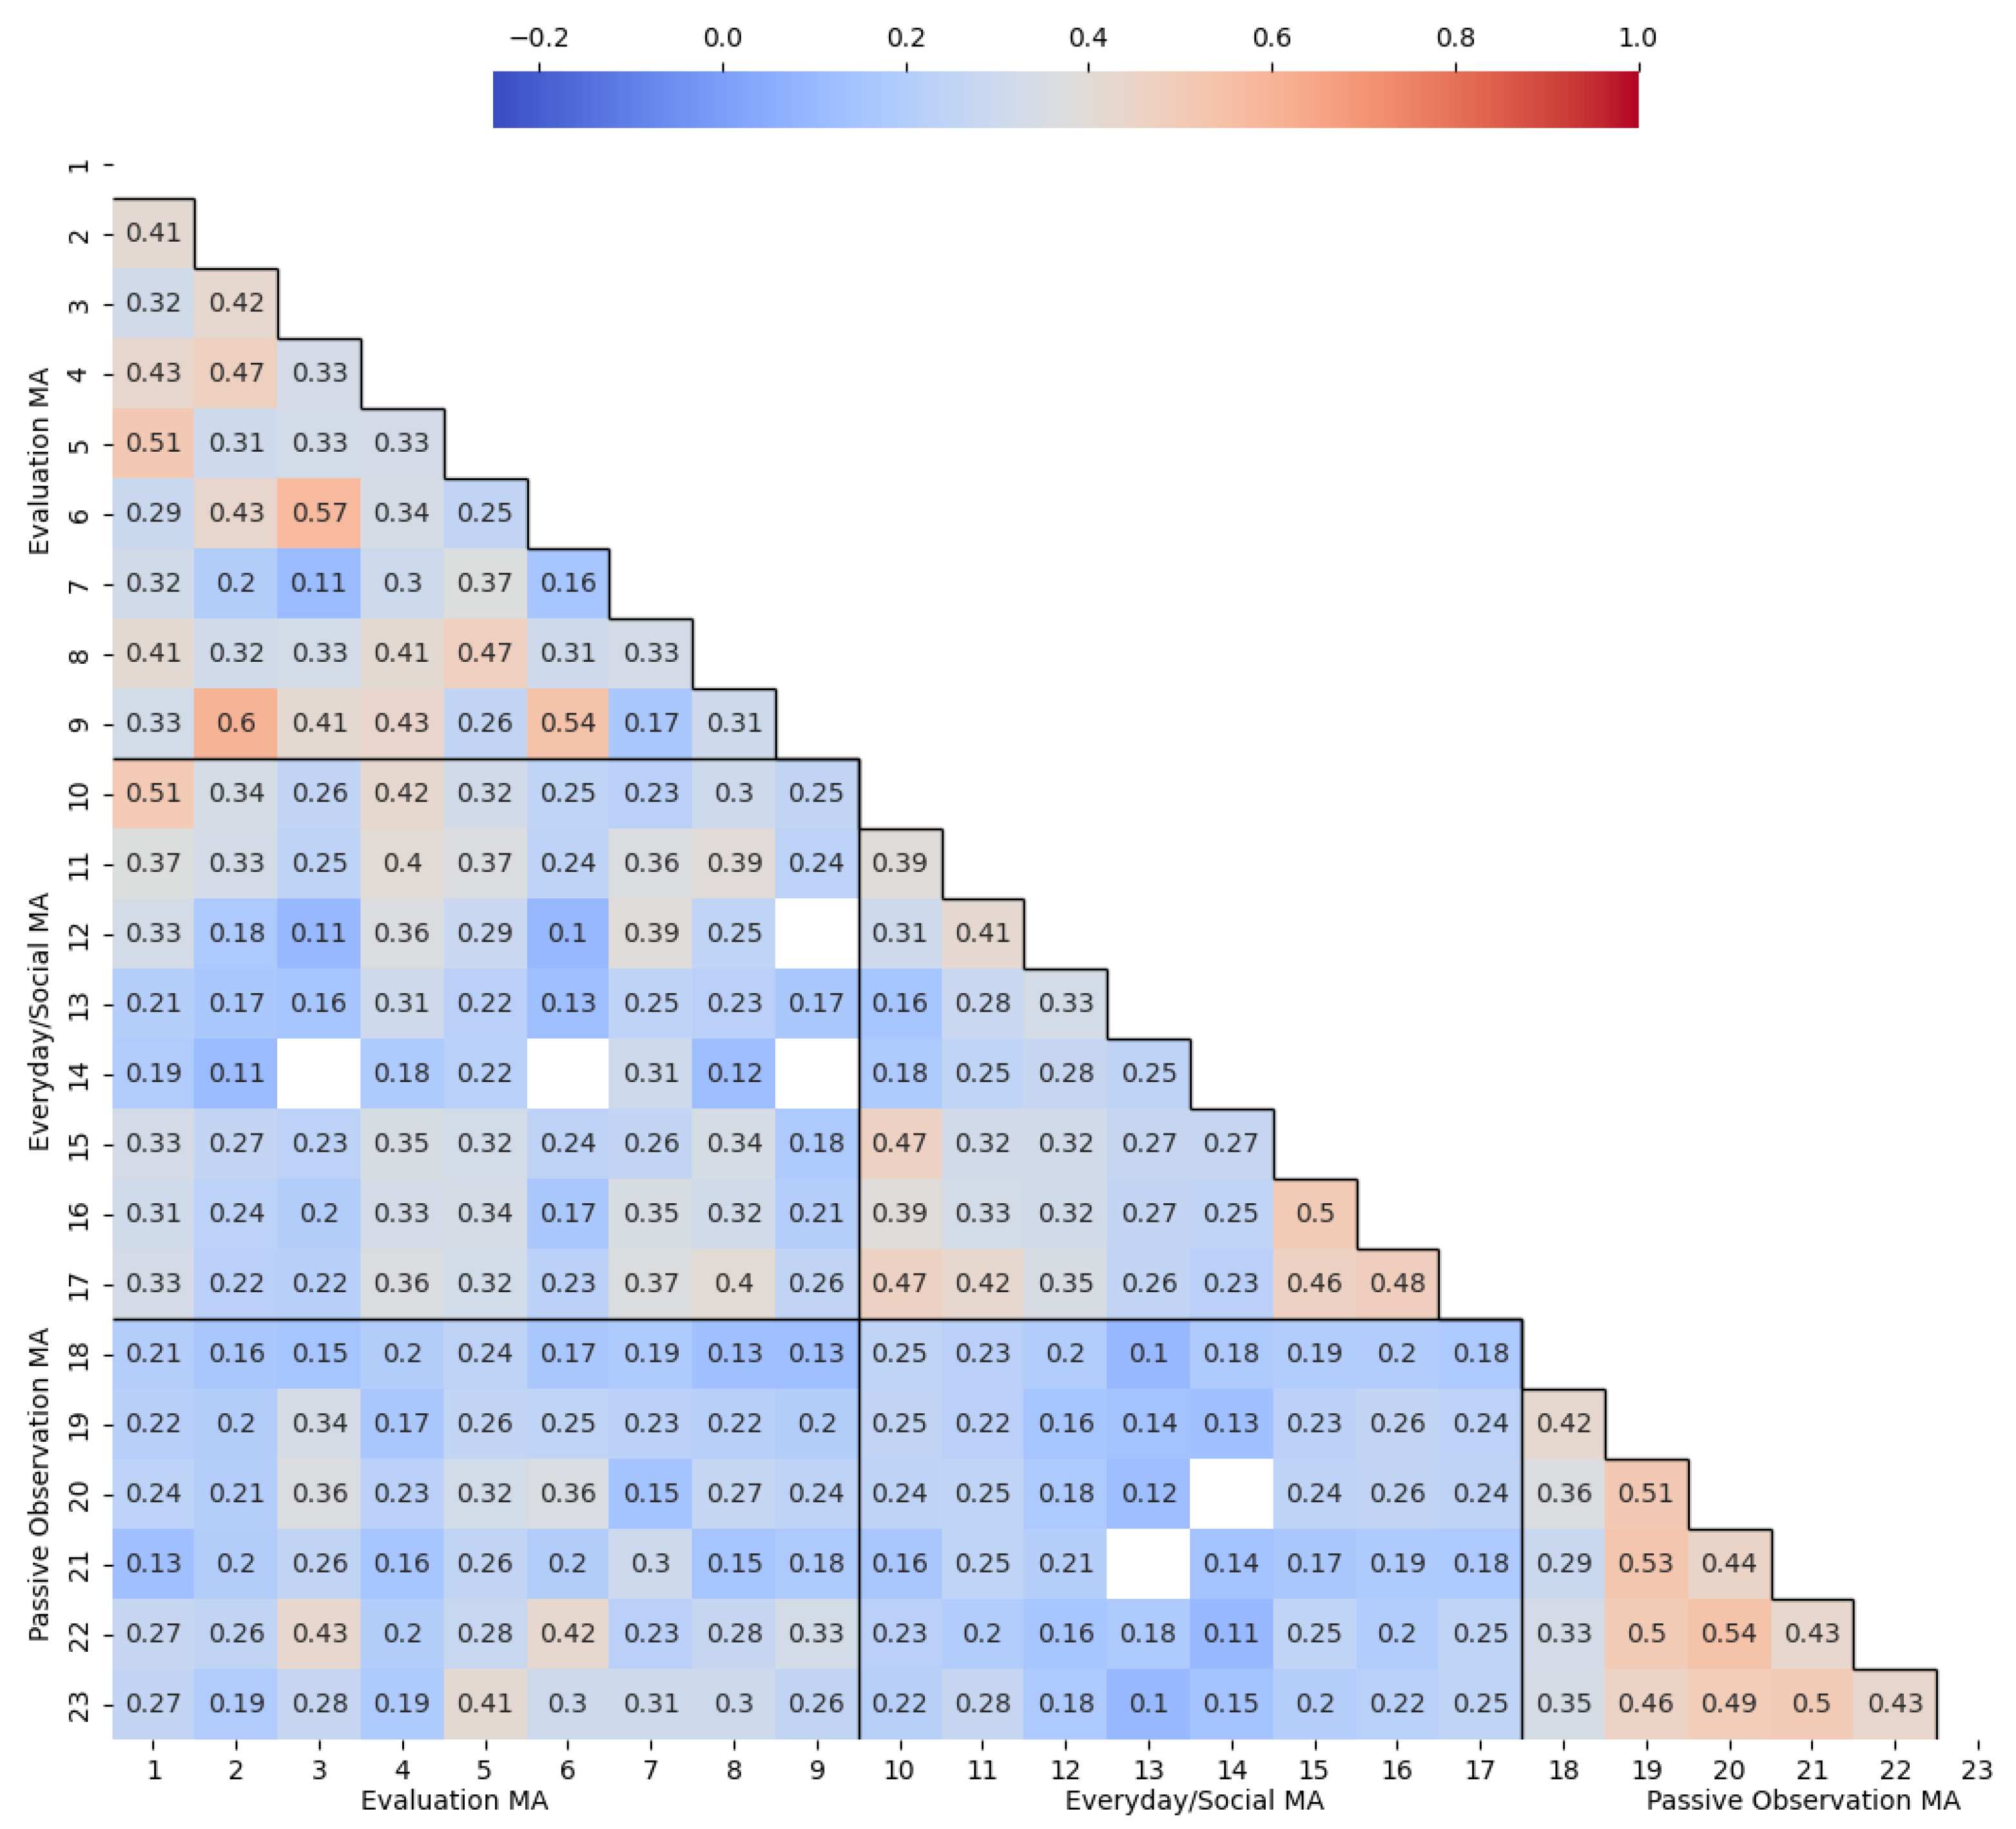
  • Evaluation MA, which refers to anxiety related to the assessment of one’s mathematical abilities, often in formal academic settings (such as taking a math exam or answering questions in class).
  • Everyday/Social MA, triggered in daily situations where math is required, often with social implications (e.g., calculating change, splitting bills, or remembering phone numbers).
  • Passive Observation MA, experienced when passively observing math-related activities without direct involvement (e.g., watching someone solve a problem or listening to a math lecture).
To the best of our knowledge, in the Italian context, the main MA psychometric scale validated among Italian participants is the Abbreviated Math Anxiety Scale (AMAS, Hopko et al., 2003). This scale consists of nine items, measuring Learning Math Anxiety (LMA) and Math Evaluation Anxiety (MEA), and was found to be more parsimonious (i.e., briefer and externally valid) than the MARS-R scale (Hopko et al., 2003). Importantly, despite including “abbreviated” in its name, AMAS is not a selection of items from MAS-UK or other scales but rather a substantial revision of math anxiety items focused on learning and testing in mathematical contexts. These differences distinguish AMAS from MAS-UK and other psychometric tools.
Regarding Italian samples, AMAS was first translated into Italian and tested for its validity and reliability among high school and college students (Primi et al., 2014). Subsequently, AMAS was also validated among Italian primary school children by Caviola and colleagues (Caviola et al., 2017). The Italian translation of AMAS was then used by several studies with Italian participants: Piccirilli et al. (2023) sampled 73 high school students (Piccirilli et al., 2023); Cuder et al. (2024) investigated 109 middle school students (Cuder et al., 2024). Additionally, a new adapted version of AMAS was developed by Primi and colleagues in 2020 to measure math anxiety in children: the Early Elementary School Abbreviated Math Anxiety Scale (EES-AMAS, comprising nine items; Primi et al., 2020).
Although AMAS is the primary scale used in Italy to measure math anxiety, the present study focuses on the MAS-UK scale because it adopts a three-factor model that aligns with other psychological insights from earlier scales such as MARS-R and MARS. Specifically, MAS-UK is more advantageous than AMAS because it not only considers the Evaluation and Passive aspects of MA, which are also captured by the two-factor model of AMAS, but also includes a range of everyday/social situations in which math anxiety might occur. In contrast, AMAS does not have a specific factor for social contexts; its structure primarily revolves around evaluating mathematical tasks and learning math content. Consistent with other studies (Devine et al., 2018; Luttenberger et al., 2018; Stella, 2022) emphasizing the relevance of social relationships in the development of math anxiety (e.g., parents transmitting math anxiety to their children, or peer evaluation exacerbating math anxiety in teenagers), we focused on a psychometric tool that adequately addresses the social factor. Based on these considerations, the aim of the present study is to validate an Italian translation of the MAS-UK scale—henceforth referred to as MAS-IT—among a sample of Italian undergraduate students in psychology or related fields.
Additionally, considering that MAS-UK was created in 2011, some of its items might no longer be optimal for measuring math anxiety among today’s students. Indeed, many cultural changes may have affected academic contexts, such as technological innovations (e.g., social media), the COVID-19 pandemic, and other societal changes. Hence, a secondary goal of the current study is to evaluate how the MAS-IT performs in a sample of Generation Z individuals. We employed network psychometrics (Golino & Epskamp, 2017) to assess the structure of correlations among math anxiety items in the MAS-IT responses from Gen-Z psychology students in Italy.
Network analysis has increasingly been recognized as a valuable method for investigating psychological constructs, as it conceptualizes psychological phenomena as systems of interacting components. For instance, Guerrera et al. (2023) proposed a Network Intervention Analysis, which conceptualizes mental disorders as the product of the interplay between symptoms, in order to assess how specific treatments affect individual symptoms and how those effects spread across symptom networks (Guerrera et al., 2023). In a 2025 study by Sarti and colleagues, network models were also used with the Apathy Evaluation Scale to map the interrelations between apathy factors and cognitive decline (Sarti et al., 2025). These applications highlight the strength of network approaches in capturing the complexity and dynamics of psychological phenomena. In the present study, network analysis provides insights into how different factors of math anxiety interact.

2. Materials and Methods

2.1. Participants

A sample of 324 students from the Department of Psychology at an Italian university was recruited through convenience sampling using the Department’s social media platforms and word of mouth. Students were enrolled in different Bachelor’s programs related to psychology: Sciences and Techniques of Cognitive Psychology, and Communication Interfaces and Technologies. The participants were all adults (over 18 years old) and native Italian speakers. The study protocol was approved by the institutional Human Research Ethics Committee (ID: 2024-039) and complied with the principles of the Declaration of Helsinki. The participants provided informed consent and received no compensation for their involvement.
The participant sample was divided into different groups based on both the year they were recruited and their academic year at the time of participation. The present study was conducted during both 2023 and 2024. In 2023, students were not grouped by academic year because of small sample sizes, resulting in a single heterogeneous group. In 2024, the sample was divided into first-, second-, and third-year students (reflecting the structure of the Italian Bachelor’s degree system).

2.2. Materials

MAS-IT Scale

For this study, we used an Italian translation of the MAS-UK, hereafter referred to as MAS-IT, to maintain consistency with the original scale’s naming convention. The MAS-IT comprised 23 items, corresponding to the final version of the MAS-UK, which were carefully translated into Italian by two experts (see Table A1). The translated items presented statements about mathematics-related situations; these could be grouped into three factors based on which aspects of mathematics—and math anxiety—they measured (i.e., the same factors identified in the MAS-UK; Hunt et al., 2011). These factors, as introduced earlier, correspond to: Evaluation MA, Everyday/Social MA, and Passive Observation MA. Table A1 presents both the translated items from the MAS-UK and their factor groupings.
To minimize wording effects, and given that semantic coherence was not required in the original MAS-UK scale (cf. Hunt et al., 2011), we randomized the order of the MAS-IT items. The participants rated their anxiety for each item on a 5-point Likert scale ranging from 1 (not at all anxious) to 5 (extremely anxious), yielding a broad measure of math anxiety levels. The responses were collected in a Microsoft Excel file.

2.3. Data Analysis

Descriptive analyses (Table A2) were conducted using Python 3.9.6. The same programming language was used for comparative analyses based on factors and students’ year of enrolment, as well as for generating representative box plots. Where the sample included fewer than 50 students per enrolment year, both non-parametric and parametric analyses were employed, with their convergent results evaluated despite sample size limitations. For non-parametric analyses, the Kruskal–Wallis (KW) and Dunn–Bonferroni tests were performed, while ANOVA was used for parametric analyses. These methods were chosen to examine differences between enrolment years within the sample. To facilitate comparison, the mean Likert score for students in each population group, as well as the mean score for all items within each MA factor, was computed, providing a clearer basis for the comparisons of interest.
Additionally, a correlation matrix (using Kendall’s Tau rank correlations) for each item of MAS-IT was computed, and the respective correlogram was generated. The correlogram illustrates the strength and direction of the correlations, with items visually clustered by their respective factors.

2.3.1. Confirmatory Factor Analysis

Further analyses, including Confirmatory Factor Analysis (CFA) and Exploratory Graph Analysis (EGA), were performed using the R-packages lavaan (Rosseel, 2012) and EGAnet (Golino & Epskamp, 2017), respectively. The aim of these analyses was to assess the reliability of MAS-IT within this specific population sample. Specifically, Confirmatory Factor Analysis was conducted to evaluate whether the hypothesized 3-factor structure of the MAS-UK would fit the observed data in the sample of Italian psychology students (Brown, 2015). CFA was also used to validate the results from Exploratory Graph Analysis (see the following subsection) and to identify the factor structure of math anxiety within the current sample of Italian psychology undergraduates.

2.3.2. Exploratory Graph Analysis

Exploratory Graph Analysis (Golino & Epskamp, 2017) was used on a randomly split half of the dataset to uncover the latent factor structure of the MAS-UK items based on the collected MAS-IT data. Unlike CFA, which tests a predefined model structure, EGA identifies factor structures directly from the data using network psychometrics (Christensen & Golino, 2021). EGA involves three steps:
  • Correlation Matrix Estimation. This step employs the cor_auto method to estimate correlations based on data type, allowing for the evaluation of correlations between all pairs of variables.
  • Graphical Least Absolute Shrinkage and Selection Operator (GLASSO). The GLASSO algorithm is applied to the correlation matrix to estimate a sparse partial correlation network, retaining stronger connections while penalizing weaker ones. This approach effectively identifies the strongest connections between items, yielding a clear and interpretable network structure.
  • Community Detection and Factor Estimation. This step groups items into clusters (i.e., factors) based on their network connections. These clusters represent latent constructs, where items within the same cluster exhibiting strong associations (Golino & Epskamp, 2017).
To evaluate reliability, item stability analysis was performed using bootstrap EGA (with the bootEGA function provided by EGAnet). Here, we estimated and evaluated the stability of dimensions identified via exploratory graph analysis: we assessed the robustness of each item’s placement within those dimensions (Christensen & Golino, 2021).

2.3.3. Correlation Between EGA and MAS-UK Factors

After the MAS-IT items were clustered into distinct communities/factors based on EGA, their structure was compared with the factor structure defined by MAS-UK. The Jaccard similarity index was calculated to quantify the overlap between factors, based on the intersection and union of items within each factor, thus measuring the similarity between the EGA and MAS-UK factors (cf. Stanghellini et al., 2024). A Jaccard index of 1 indicates perfect similarity between two factors, whereas an index of 0 indicates complete dissimilarity, showing that the factors share no items.
Next, the scores of all items within each factor were summed for both the CFA factors (corresponding to the MAS-UK factor structure) and the EGAnet factors. Kendall’s Tau correlations were then computed between pairs of factor scores. These correlations are presented as a correlogram, which illustrates the strength and direction of the correlations between the EGA communities and the MAS-UK factors.

3. Results

Table A2 reports summary descriptive statistics for the collected data. These values suggest potential non-normality in the distributions of item scores. Given the sample size limitations (see Section 2 Materials and Methods), this finding underscores the need to compare parametric and non-parametric approaches when analyzing differences across subsamples.
Further comparative analyses were conducted, focusing on differences between population groups. Specifically, we analyzed only the division by academic enrolment year (first year: N 1 = 48; second year: N 2 = 68; third year: N 3 = 51), excluding data from students who participated in the study in 2023, as the analysis required a clear distinction between academic enrolment years.
We also grouped the data by math anxiety factor, enabling clear contrasts between sample groups. The comparative box plot (Figure 1)—where each box represents the mean Likert score for a student group—shows no significant differences between groups for any MA factors (Evaluation MA: KW = 0.08, p = 0.959; Everyday/Social MA: KW = 2.14, p = 0.343; Passive Observation MA: KW = 4.3, p = 0.117). Although the boxes show variation in mean Likert scores between MA factors, the scores remain consistent across sample groups.
In contrast, the comparison between MA factors, grouped by student cohorts, reveals significant differences (p < 0.001), as shown in Figure 2. Specifically, across all academic enrolment years, significant differences exist between Evaluation MA and Passive Observation MA, as well as between Evaluation MA and Everyday/Social MA. Furthermore, among second-year BSc students, a significant difference emerged between Everyday/Social MA and Passive Observation MA. These findings indicate that participating students exhibited varying levels of math anxiety across different factors. Figure 2 illustrates that Evaluation MA levels are consistently higher than either Everyday/Social MA or Passive Observation MA levels. This suggests that psychology undergraduates experience greater math anxiety during evaluative math tasks (e.g., equation solving) compared to other math-related situations.

3.1. Correlational Analysis

Figure 3 presents the inter-item correlations among MAS-IT items. The strongest positive correlations (with τ coefficients approaching 1, represented by red squares) occurred between items belonging to the same MA factor. Notably, no negative correlations were present between MAS-IT items, and six correlations were non-significant (p ≥ 0.05). Among these, four involved items from both the Everyday/Social MA and Evaluation MA factors, while the remaining two connected the Passive Observation MA and Everyday/Social MA factors.
Stronger inter-item correlations suggest greater internal consistency for total scores across factor structures. Since our findings demonstrate stronger correlations between items within the same factors, the 3-factor model represents a coherent approach for item classification.

3.2. Confirmatory Factor Analysis with the UK 3-Factor Model

The Confirmatory Factor Analysis (CFA) evaluated the hypothesized original factor structure of the MAS-UK using the collected data. The model’s goodness of fit was assessed with standard indices, including the Comparative Fit Index (CFI) > 0.90, the Root Mean Square Error of Approximation (RMSEA) < 0.06, and the Standardized Root Mean Square Residual (SRMR) < 0.08 (Hu & Bentler, 1999).
The results of the CFA on the MAS-IT data revealed a poor fit between the original model and our data, supporting the alternative hypothesis that the original 3-factor MAS-UK model is inappropriate for these data ( χ 2 = 898.803, df = 227, p < 0.001). The fit indices confirmed this conclusion: the RMSEA value of 0.096 reflects an inadequate fit, and the CFI value of 0.811 falls below the recommended threshold of 0.90. However, the SRMR index was satisfactory (0.079 < 0.08). Collectively, these findings demonstrate that the UK 3-factor model fails to adequately represent the Italian data, suggesting the need for either model refinement or theoretical revision to better reflect the underlying structure. Consequently, the analysis was extended using exploratory approaches.

3.3. Exploratory Graph Analysis

Since the UK model proved inadequate for the Italian data, exploratory analyses were warranted. First, an Exploratory Graph Analysis (EGA) was performed using a randomly selected 50% subsample to cluster items into new factors (see Section 2 Materials and Methods). Next, a Unique Variable Analysis (UVA, Christensen et al., 2023) was conducted on this subsample to identify potentially redundant items by calculating the weighted redundancy index (wTO). This approach enabled the identification of locally dependent or redundant item pairs. Finally, an item stability analysis was carried out (Christensen & Golino, 2021), assessing the stability of item communities identified in the median graph through bootstrap analysis.

3.3.1. Network Estimation

EGA revealed four math anxiety components in the MAS-IT data, which were then compared with the original MAS-UK model. The resulting network analysis identified four clusters (factors/communities), as shown in Figure 4, representing distinct dimensions of math anxiety.

3.3.2. Network Factors and Interpretation

Factor I includes the largest number of items, all related to mathematical problem-solving situations. These include social contexts (e.g., Item 4: “Being asked to calculate GBP 9.36 divided by four in front of several people”) and skill evaluation scenarios (e.g., Item 8: “Being asked to calculate three fifths as a percentage”). Factor II comprises only four items, each involving mathematical evaluation. These scenarios range from classroom situations (e.g., Item 2: “Being asked to write an answer on the board at the front of a maths class”) to formal assessments (e.g., Item 3: “Taking a math exam”). Factor III contains four items reflecting social/everyday math anxiety (e.g., Item 17: “Working out how much your shopping bill comes to”). Notably Factor IV perfectly aligns with one of the original MAS-UK factors, incorporating all items from the Passive Observation MA factor. All the key characteristics of the factors identified using Exploratory Graph Analysis, including the MAS-IT items within each factor, their conceptual content, and stability scores—which will be discussed later—can be found in Table A3.

3.3.3. Network Factors and Correlational Analysis

To assess the similarity between the EGA-derived item clusters and the MAS-UK factor structure, we computed the Jaccard similarity index. The results indicated that both EGA Factor I and Factor II show the strongest similarity to the Evaluation MA factor (Jaccard indices = 0.38 and 0.44, respectively). In contrast, Factor III demonstrated the closest alignment with the Everyday/Social MA factor (Jaccard index = 0.5). As noted earlier, Factor IV exhibits perfect correspondence with the Passive Observation MA factor (Jaccard index = 1).
We examined the statistical correlations between total scores for items within each EGA factor and each MAS-UK factor using Kendall’s Tau coefficient, with results visualized in the correlogram (Figure 5). The analysis reveals an absence of negative correlations, with the strongest associations ( τ > 0.6) occurring between factors that were most similar according to the Jaccard index. The sole exception is EGA Factor I, which correlates strongly with both Evaluation MA and Everyday/Social MA. This pattern suggests that EGA Factor I encompasses items representing aspects of both Evaluation MA and Everyday/Social MA.

3.3.4. Redundancy Between Items

The Unique Variable Analysis (UVA) on the MAS-IT, based on the weighted redundancy index (wTO), was conducted with EGAnet.

3.3.5. Unique Variable Analysis

The analysis identified multiple pairs of items with significant redundancy (wTO > 0.20). The highest redundancy (wTO = 0.291) occurred between items 19 and 21 (cf. Table A1 in Appendix A), both regarding situations involving the observation or listening of someone dealing with math. A moderate level of redundancy was also present between items 1 and 5, which concern multiplication problems. Furthermore, small-to-moderate redundancy was found across four different item pairs:
  • Items 2 and 9 (wTO = 0.249): both concerning math abilities evaluation in front of a class.
  • Items 3 and 6 (wTO = 0.220): both involving a math test.
  • Items 4 and 13 (wTO = 0.217): item 4 concerns a math operation in front of a class, while item 13 concerns the memorization of a phone number.
  • Items 6 and 9 (wTO = 0.206): both regarding math evaluation in the class environment.

3.3.6. Interpretation of Redundant Items

Highly redundant items are those that are related to the most similar circumstances, which suggests they assess the same aspect of math anxiety (MA). Therefore, when developing future Math Anxiety scales, researchers may consider retaining only one item from each highly redundant pair as a viable strategy. As recommended by Christensen et al. (2023), a conservative approach to merging redundant items involves considering only those with a weighted topological overlap (wTO) exceeding the 0.3 threshold. However, in this study, we did not find any item pairs that met this threshold; thus, no item should be removed based on redundancy in future revisions of this scale.

3.3.7. Item Stability Analysis

Figure 6 presents the results of the item stability analysis, performed using the bootEGA function from the EGAnet package. The y-axis displays each item of the MAS-IT questionnaire, grouped according to the four distinct communities (or factors) identified by the previous Network Estimation analysis. These factors are color-coded to match the network estimation plot (Figure 4). The x-axis shows the stability level of each item across 500 bootstrap replications, with values ranging from 0 (lowest stability) to 1 (highest stability).

3.3.8. Interpretation of Item Stability Analysis with Bootstrapping

Most of the items exhibited stability scores (S) above 0.80. At the factor level, items within Factor IV, which correspond to the Passive Observation MA factor in the MAS-UK, demonstrated perfect stability score (S = 1.00) for all of the items, except for item 22 (S = 0.98). Slightly lower stability was observed for Factor II’s items (0.89 ≤ S ≤ 0.96), while Factor I’s items showed stability scores ranging from 0.65 to 0.93. Conversely, Factor III showed the lowest stability (S = 0.38) for all of its items.
These results indicate that, through non-parametric bootstrapping, which repeatedly resamples the data with replacement, some items within the EGA factors consistently cluster within the same factor, as indicated by higher stability scores. However, Factor III exhibited low stability, with its items being inconsistently assigned across bootstrap samples. This instability may suggest ambiguity in the content of these items. As shown in Table A3, these items all relate to the use of math skills for calculating expenses, presumably involving cash transactions. Given this observation, further investigation into the underlying causes of the low stability is desirable, as well as further consideration to the revision or removal of items within Factor III.

3.3.9. Total Entropy Fit Index and Item Stability

We subsequently conducted the bootstrap test for the Total Entropy Fit Index (TEFI) to evaluate whether the four-community structure identified through EGA offered a better fit than a randomly generated 4-dimensional structure. The results revealed that the Base TEFI value (M = −16.88, SD = 1.26) was significantly lower than the Comparison TEFI (M = −10.21, SD = 0.63), p = 0.002 (one-tailed). This finding indicates that randomly assigning MAS-IT items to factors fails to adequately explain the 4-factor structure identified via EGA. Thus, although some items (particularly those in Factor III) exhibit instability, the overall 4-factor structure provides a reasonably good fit for the MAS-IT data. This positive finding warrants a final confirmatory analysis on the remaining 50 % of the data.

3.4. Confirmatory Analysis of the 4-Factor Structure of MAS-IT

In the 4-factor confirmatory model for the MAS-IT, the Standardized Root Mean Square Residual fell within the conventional cut-off (0.073) with modest misfit indexes ( χ 2 ( 224 ) = 534.59 , p < 0.001 ; R M S E A = 0.093 , 90 % , C I = 0.082 0.103 , p < 0.001 ). Nonetheless, the hypothesized 4-factor structure was largely supported at the item level: all 23 indicators loaded significantly on their intended latent dimensions ( | z | 4.73 , p < 0.001 ), with substantial standardized loadings higher than the desirable 0.50 threshold (see Appendix A Table A4). Factors showed moderate inter-correlations (r = 0.15–0.52), suggesting related but distinguishable facets of mathematical anxiety, and the latent variances were significantly different from zero. Cronbach’s alphas were all above the acceptable threshold of 0.70 ( α F a c t o r 1 = 0.82 α F a c t o r 2 = 0.85 , α F a c t o r 3 = 0.76 , α F a c t o r 4 = 0.87 ), indicating a satisfactory internal consistency of factors. Given the ratio of estimated parameters to cases (52 to 162), the power to detect misfit was only modest, which may partly explain the elevated RMSEA. Nonetheless, the pattern of strong, salient loadings in conjunction with limited cross-factor correlations and high internal factor consistency all indicate preliminary construct validity to the MAS-IT. Future work should pursue model refinements (e.g., freeing theoretically justified residual covariances or testing a second-order structure) and replication in a larger, more heterogeneous sample to secure more robust evidence for the scale’s factorial validity.

4. Discussion

Math anxiety is a well-documented psychological phenomenon with significant implications for academic performance (Stella, 2022), particularly in disciplines that require quantitative skills (Primi et al., 2020; Siew et al., 2019). This study examines mathematics anxiety factor scores across different enrolment years within a BSc Psychology program. Our results provide insights into the stability of math anxiety levels over time and highlight the relative prominence of specific anxiety dimensions measured by the MAS-UK scale (Hunt et al., 2011), which was adapted into Italian for this study and termed the MAS-IT.
It is essential to clarify that the present work differs substantially from the validation of the AMAS in various Italian populations (Caviola et al., 2017; Primi et al., 2014), as the AMAS and MAS-UK/MAS-IT contain different items and, therefore, measure different aspects of math anxiety (MA) (Hopko et al., 2003). While the AMAS is a shorter scale that assesses the same broad psychological construct—math anxiety—it is fundamentally distinct from the MAS-UK and, by extension, the MAS-IT.
Existing literature provides substantial evidence supporting the need to study math anxiety among psychology students. For example, Paechter et al. (2017) found that psychology undergraduates often experience significant mathematics and statistics-related anxiety, which negatively affects their learning behaviors and exam performance (Paechter et al., 2017). Similarly, Wilson’s (1999) research suggests that students with high math anxiety tend to avoid enrolling in courses with substantial quantitative content, thereby limiting their proficiency in essential research skills (Wilson, 1999). Given these findings and the existing literature, addressing math anxiety within psychology curricula is crucial to improving students’ engagement and competence in the quantitative aspects of their education.
A key finding of the present study is that math anxiety (MA) levels remained stable across enrolment years. This suggests that, within this sample, students entering the Psychology program exhibit similar levels of MA, despite undertaking additional statistics courses and training in psychology. Given that math anxiety can stem from both early educational experiences and broader societal influences (Ashcraft, 2002; Stella, 2022), the consistency observed here may reflect two plausible explanations: (i) a lack of systematic change in mathematics education at the secondary level or (ii) a lack of anxiety-reducing initiatives in higher education. This finding also suggests that, despite potential variations in teaching methodologies or curriculum changes over time, persistent anxieties related to mathematics remain among psychology students, who often choose the discipline (Wilson, 1999) due to its perceived lower mathematical demands compared to STEM fields.
In addition to its stability across years, math anxiety was not experienced uniformly across its factors. Specifically, students exhibited higher scores on the Evaluation MA factor compared to the Everyday/Social MA and Passive Observation MA factors. This finding aligns with both theoretical (Maloney & Beilock, 2012; Richardson & Suinn, 1972) and empirical (Cipora et al., 2022) literature on math anxiety, which suggests that evaluative contexts—such as exams, graded assignments, or public demonstrations of mathematical ability—provoke the highest levels of anxiety.
A further key finding is that the 3-factor model proposed by the MAS-UK scale (Hunt et al., 2011) did not fit the MAS-IT data. This result prompted exploratory reanalysis using network psychometrics (Christensen et al., 2023; Christensen & Golino, 2021; Golino & Epskamp, 2017; Stella, 2022), which revealed a four-factor structure with better fit than random expectation.
Regarding the stability of MAS-IT items, the lowest stability scores were found for the factor containing items related to everyday mathematical tasks involving financial transactions, particularly those requiring cash payments (see items 10, 15, 16, 17 in Table A1).
Given that the MAS-IT data were collected in 2023 and 2024 and that the MAS-UK questionnaire was created in 2011, it is plausible that the increased prevalence of cashless payments in recent years—especially among students—has contributed to the low stability of these items. We suggest that digital payment methods enable users to avoid tasks that typically require mental arithmetic, such as splitting bills or calculating change. As demonstrated by Paundra et al. (2023), Millennials and Generation Z have adopted digital payment methods more frequently, with up to 69% of respondents from these generations reporting a preference for digital payments over cash (Paundra et al., 2023). This societal shift in payment habits could explain the lower stability of these items. Importantly, this instability is unlikely to stem from sample size limitations, as network psychometrics successfully replicated the factors of the original MAS-UK scale. For these reasons, a shortened MAS-IT scale, which excludes the items of Factor III, could be used in future research. Furthermore, we believe these problems might contribute also to the fit issues of the 4-factor CFA tested in this work. Despite these issues, the strong item loadings, modest factor intercorrelations, and solid internal reliabilities provide support for the MAS-IT’s construct validity. Future studies should refine the model—perhaps by adding theory-based error covariances or testing a higher-order factor—and replicate the analysis with a larger, more diverse sample to confirm the scale’s factorial structure.
The present study has several limitations. First, our approach did not assess the stability of the MA scale within the same participants longitudinally as they progressed through their degree program. This limitation could be addressed by implementing larger longitudinal datasets that follow psychology students throughout their academic careers, akin to a Lagrangian approach in fluid dynamics. Furthermore, it is important to highlight that math anxiety is a complex phenomenon (Stella, 2022), which may not be fully explained by psychological factors alone. Instead, it could be alleviated (Stella & Zaytseva, 2020) or influenced (Cipora et al., 2022) through social interactions. Future studies could explore MA with richer behavioral data. Also, expanding the current analysis beyond University-level samples would be an intriguing direction for future research within the Italian landscape.
Based on our current results, future studies could implement an alternative scale to measure MA in Italian psychology undergraduates. This new scale could be more concise than the MAS-UK by removing unstable items that provided limited discriminative value (e.g., Factor III’s items). Additionally, new items could be developed to better reflect contemporary cultural contexts and the specific experiences of the target population. An innovative approach could involve leveraging AI models—such as AI-GENIE (Russell-Lasalandra et al., 2024)—to select the most appropriate items for capturing the multifaceted nature of MA and to support the development of a more robust psychometric tool.
To facilitate future development and potential systematic reviews on this topic, we hereby release the full dataset of responses for the MAS-IT data: https://doi.org/10.17605/OSF.IO/3KYDQ.

5. Conclusions

Studying math anxiety through psychometric methods is crucial, given its widespread prevalence, especially among psychology undergraduates, who constitute the focus of this study. Our findings demonstrated the inadequate fit of the 3-factor UK model to the data collected from Italian psychology students, revealing the low stability of certain items. These results suggest that a shortened version of the MAS-IT scale could be developed by removing unstable items with subsequent validation in future research.
This study provides valuable data to the scientific community to support the development of robust psychometric tools tailored to this specific population. Furthermore, our results highlight the need to establish effective support strategies to help students manage (if not overcome) math anxiety. Addressing this issue could significantly enhance students’ academic experience and outcomes.

Author Contributions

Conceptualization, L.C. (Luciana Ciringione) and M.S.; methodology, M.S., L.C. (Luisa Canal), O.M.E. and L.L.; validation, E.F., L.C. (Luisa Canal) and M.S.; formal analysis, M.S.; investigation, L.C. (Luciana Ciringione); data curation, L.C. (Luciana Ciringione), L.C. (Luisa Canal), L.L., O.M.E. and M.S.; writing—original draft preparation, E.F., L.C. (Luciana Ciringione) and M.S.; writing—review and editing, E.F., M.S. and G.L.; visualization, E.F.; supervision, M.S.; project administration, L.C. (Luciana Ciringione), M.S. and E.F. All authors have read and agreed to the published version of the manuscript.

Funding

This research received no external funding.

Institutional Review Board Statement

The study was conducted in accordance with the Declaration of Helsinki and approved by the Institutional Review Board (or Ethics Committee) of the University of Trento (protocol code ID: 2024-039; approved on the 20 June 2024).

Informed Consent Statement

Informed consent was obtained from all subjects involved in this study.

Data Availability Statement

The data collected and used to produced the results of the current study is available here: MAS-IT data: https://doi.org/10.17605/OSF.IO/3KYDQ.

Conflicts of Interest

The authors declare no conflicts of interest.

Appendix A

Table A1. MAS-UK items and correspondent MAS-IT items.
FactorItemMAS-UK ItemMAS-IT Item
Evaluation MA 1Having someone watch you multiply 12 × 23 on paperAvere qualcuno che mi guarda moltiplicare 12 × 23 su carta
2Being asked to write an answer on the board at the front of a maths classSe mi viene chiesto di scrivere una risposta alla lavagna all’inizio di una lezione di matematica
3Taking a maths examSostenere un esame di matematica
4Being asked to calculate £9.36 divided by four in front of several peopleSe mi viene chiesto davanti a molte altre persone di calcolare EUR 9.36 diviso per 4
5Calculating a series of multiplication problems on paperCalcolare una serie di moltiplicazioni su carta
6Being given a surprise maths test in a classDover affrontare un test di matematica a sorpresa in una classe
7Being asked to memorize a multiplication tableDover memorizzare una tabellina
8Being asked to calculate three fifths as a percentageSe mi viene chiesto di calcolare i 3/5 di una percentuale
9Being asked a maths question by a teacher in front of a classSe mi viene chiesta una domanda di matematica da un/una insegnante di fronte alla classe
Evaluation MA
Everyday/Social MA
10Adding up a pile of changeCalcolare la somma degli spiccioli di un resto
11Being asked to add up the number of people in a roomSe mi viene chiesto di sommare il numero di persone in una stanza
12Calculating how many days until a person’s birthdayCalcolare quanti giorni mancano al compleanno di una persona
13Being given a telephone number and having to remember itRicevere un numero di telefono e doverlo ricordare
14Working out how much time you have left before you set off to work or place of studyCalcolare quanto tempo mi rimane prima di partire per il lavoro o il luogo di studio
15Working out how much change a cashier should have given you in a shop after buying several itemsCalcolare quanto resto dovrebbe avermi dato un cassiere in un negozio dopo aver acquistato diversi articoli
16Deciding how much each person should give you after you buy an object that you are all sharing the cost ofDecidere quanto ogni persona dovrebbe darmi dopo aver acquistato un oggetto di cui condividete il costo
17Working out how much your shopping bill comes toCalcolare quanto sia il conto di uno scontrino
Passive observation MA 18Reading the word “algebra”Leggere la parola “algebra”
19Listening to someone talk about mathsAscoltare qualcuno che parla di matematica
20Reading a maths textbookLeggere un testo di matematica
21Watching someone work out an algebra problemGuardare qualcuno risolvere un problema di algebra
22Sitting in a maths classFrequentare una lezione di matematica
23Watching a teacher/lecturer write equations on the boardGuardare un/una insegnante scrivere equazioni alla lavagna
Table A2. Descriptive statistics of the MAS-IT items. The minimum and maximum values assignable to each item were the lowest and highest point of the Likert scale: respectively, 1 and 5.
ItemMeanSt.Dev.MedianSkewnessKurtosisSE
12.281.242.000.61−0.760.07
23.301.163.00−0.14−0.910.06
33.541.024.00−0.30−0.540.06
43.001.283.00−0.01−1.090.07
51.570.841.001.572.280.05
63.771.104.00−0.58−0.500.06
71.450.851.002.154.390.05
82.251.162.000.64−0.530.06
93.611.164.00−0.43−0.690.06
102.141.142.000.79−0.260.06
111.720.921.001.060.130.05
121.560.881.001.481.410.05
132.221.112.000.74−0.120.06
141.650.921.001.531.980.05
151.750.951.001.230.950.05
161.690.971.001.381.250.05
171.580.851.001.582.280.05
181.290.641.002.416.120.04
191.450.751.001.903.910.04
201.730.931.001.251.040.05
211.370.731.002.194.880.04
221.710.881.001.180.860.05
231.500.781.001.702.890.04
Table A3. Key characteristics of the factors identified by Exploratory Graph Analysis: MAS-IT items within each factor, their conceptual content and their stability scores (computed on half of the available data), as indicators of structural robustness.
FactorItemsContentStability Scores
Factor I1, 4, 5, 7, 8,
11, 12, 13, 14
Evaluation of math skills in everyday and social situationsModerate to high stability scores
(0.65 ≤ S ≤ 0.93)
Factor II2, 3, 6, 9Math evaluation in academic settings with peers or examsVery high stability scores
(0.89 ≤ S ≤ 0.96)
Factor III10, 15, 16, 17Daily math for calculating change and managing cashLowest stability scores
(S = 0.38)
Factor IV18, 19, 20, 21, 22, 23Correspondence to Passive Observation MAS-UK factorAlmost perfect stability score (0.98 ≤ S ≤ 1)
Table A4. Factor Loadings from the 4-factor CFA.
ItemFactor IFactor IIFactor IIIFactor IV
10.594
20.842
30.801
40.738
50.683
60.858
70.650
80.539
90.850
100.739
110.539
120.515
130.717
140.650
150.736
160.737
170.747
180.759
190.743
200.720
210.774
220.694
230.720

References

  1. American Psychiatric Association. (2013). Diagnostic and statistical manual of mental disorders: Dsm-5. American Psychiatric Association. [Google Scholar]
  2. Ashcraft, M. H. (2002). Math anxiety: Personal, educational, and cognitive consequences. Current Directions in Psychological Science, 11(5), 181–185. [Google Scholar] [CrossRef]
  3. Ashcraft, M. H., & Krause, J. A. (2007). Working memory, math performance, and math anxiety. Psychonomic Bulletin and Review, 14, 243–248. [Google Scholar] [CrossRef] [PubMed]
  4. Blazer, C. (2011). Strategies for reducing math anxiety. ERICC BlazerResearch Services, Miami-Dade County Public Schools. [Google Scholar]
  5. Brown, T. A. (2015). Confirmatory factor analysis for applied research. Guilford Publications. [Google Scholar]
  6. Capraro, M. M., Capraro, R. M., & Henson, R. K. (2001). Measurement error of scores on the mathematics anxiety rating scale across studies. Educational and Psychological Measurement, 61, 373–386. [Google Scholar] [CrossRef]
  7. Caviola, S., Primi, C., Chiesi, F., & Mammarella, I. C. (2017). Psychometric properties of the Abbreviated Math Anxiety Scale (AMAS) in Italian primary school children. Learning and Individual Differences, 55, 174–182. [Google Scholar] [CrossRef]
  8. Christensen, A. P., Garrido, L. E., & Golino, H. (2023). Unique variable analysis: A network psychometrics method to detect local dependence. Multivariate Behavioral Research, 58(6), 1165–1182. [Google Scholar] [CrossRef] [PubMed]
  9. Christensen, A. P., & Golino, H. (2021). Estimating the stability of psychological dimensions via bootstrap exploratory graph analysis: A Monte Carlo simulation and tutorial. Psych, 3(3), 479–500. [Google Scholar] [CrossRef]
  10. Cipora, K., Santos, F. H., Kucian, K., & Dowker, A. (2022). Mathematics anxiety—Where are we and where shall we go? Annals of the New York Academy of Sciences, 1513(1), 10–20. [Google Scholar] [CrossRef]
  11. Cuder, A., Pellizzoni, S., Di Marco, M., Blason, C., Doz, E., Giofrè, D., & Passolunghi, M. C. (2024). The impact of math anxiety and self-efficacy in middle school STEM choices: A 3-year longitudinal study. British Journal of Educational Psychology, 94, 1091–1108. [Google Scholar] [CrossRef]
  12. Devine, A., Hill, F., Carey, E., & Szucs, D. (2018). Cognitive and emotional math problems largely dissociate: Prevalence of developmental dyscalculia and mathematics anxiety. Journal of Educational Psychology, 110(3), 431. [Google Scholar] [CrossRef]
  13. Golino, H. F., & Epskamp, S. (2017). Exploratory graph analysis: A new approach for estimating the number of dimensions in psychological research. PLoS ONE, 12, e0174035. [Google Scholar] [CrossRef]
  14. Guerrera, C. S., Platania, G. A., Boccaccio, F. M., Sarti, P., Varrasi, S., Colliva, C., Grasso, M., De Vivo, S., Cavallaro, D., Tascedda, F., Pirrone, C., Drago, F., Di Nuovo, S., Blom, J. M. C., Caraci, F., & Castellano, S. (2023). The dynamic interaction between symptoms and pharmacological treatment in patients with major depressive disorder: The role of network intervention analysis. BMC Psychiatry, 23(1), 885. [Google Scholar] [CrossRef] [PubMed]
  15. Hopko, D. R. (2003). Confirmatory factor analysis of the math anxiety rating scale–revised. Educational and Psychological Measurement, 63(2), 336–351. [Google Scholar] [CrossRef]
  16. Hopko, D. R., Mahadevan, R., Bare, R. L., & Hunt, M. K. (2003). The Abbreviated Math Anxiety Scale (AMAS): Construction, validity, and reliability. Assessment, 10, 178–182. [Google Scholar] [CrossRef] [PubMed]
  17. Hu, L., & Bentler, P. M. (1999). Cutoff criteria for fit indexes in covariance structure analysis: Conventional criteria versus new alternatives. Structural Equation Modeling: A Multidisciplinary Journal, 6(1), 1–55. [Google Scholar] [CrossRef]
  18. Hunt, T. E., Clark-Carter, D., & Sheffield, D. (2011). The development and part validation of a U.K. scale for mathematics anxiety. Journal of Psychoeducational Assessment, 29, 455–466. [Google Scholar] [CrossRef]
  19. LeFevre, J., DeStefano, D., Coleman, B., & Shanahan, T. (2005). Mathematical cognition and working memory (pp. 361–377). Psychology Press. [Google Scholar]
  20. Lovibond, P. F., & Lovibond, S. H. (1995). The structure of negative emotional states: Comparison of the Depression Anxiety Stress Scales (DASS) with the beck depression and anxiety inventories. Behaviour Research and Therapy, 33, 335–343. [Google Scholar] [CrossRef]
  21. Luttenberger, S., Wimmer, S., & Paechter, M. (2018). Spotlight on math anxiety. Psychology Research and Behavior Management, 11, 311–322. [Google Scholar] [CrossRef]
  22. Maloney, E. A., & Beilock, S. L. (2012). Math anxiety: Who has it, why it develops, and how to guard against it. Trends in Cognitive Sciences, 16(8), 404–406. [Google Scholar] [CrossRef]
  23. Messer, W. S., Griggs, R. A., & Jackson, S. L. (1999). A national survey of undergraduate psychology degree options and major requirements. Teaching of Psychology, 26, 164–171. [Google Scholar] [CrossRef]
  24. Onwuegbuzie, A. J., & Wilson, V. A. (2003). Statistics anxiety: Nature, etiology, antecedents, effects, and treatments—A comprehensive review of the literature. Teaching in Higher Education, 8, 195–209. [Google Scholar] [CrossRef]
  25. Paechter, M., Macher, D., Martskvishvili, K., Wimmer, S., & Papousek, I. (2017). Mathematics Anxiety and statistics anxiety. Shared but also unshared components and antagonistic contributions to performance in statistics. Frontiers in Physiology, 8, 257559. [Google Scholar] [CrossRef] [PubMed]
  26. Papousek, I., Ruggeri, K., MacHer, D., Paechter, M., Heene, M., Weiss, E. M., Schulter, G., & Freudenthaler, H. H. (2012). Psychometric evaluation and experimental validation of the statistics anxiety rating scale. Journal of Personality Assessment, 94, 82–91. [Google Scholar] [CrossRef] [PubMed]
  27. Paundra, J., Hamidah, H., Anggita, K. M., Setiawati, R., & Sitepu, A. N. R. S. (2023, July 25–26). The effect of millennial and gen-Z generation disruption on decreasing buying and selling transactions using cash. The 6th International Conference on Vocational Education Applied Science and Technology (ICVEAST 2023) (pp. 548–559), Surakarta, Indonesia. [Google Scholar]
  28. Piccirilli, M., Lanfaloni, G. A., Buratta, L., Ciotti, B., Lepri, A., Azzarelli, C., Ilicini, S., D’Alessandro, P., & Elisei, S. (2023). Assessment of math anxiety as a potential tool to identify students at risk of poor acquisition of new math skills: Longitudinal study of grade 9 Italian students. Frontiers in Psychology, 14, 1185677. [Google Scholar] [CrossRef]
  29. Primi, C., Busdraghi, C., Tomasetto, C., Morsanyi, K., & Chiesi, F. (2014). Measuring math anxiety in Italian college and high school students: Validity, reliability and gender invariance of the Abbreviated Math Anxiety Scale (AMAS). Learning and Individual Differences, 34, 51–56. [Google Scholar] [CrossRef]
  30. Primi, C., Donati, M. A., Izzo, V. A., Guardabassi, V., O’Connor, P. A., Tomasetto, C., & Morsanyi, K. (2020). The Early Elementary School Abbreviated Math Anxiety Scale (the EES-AMAS): A new adapted version of the AMAS to measure math anxiety in young children. Frontiers in Psychology, 11, 1014. [Google Scholar] [CrossRef] [PubMed]
  31. Richardson, F. C., & Suinn, R. M. (1972). The mathematics anxiety rating scale: Psychometric data. Journal of Counseling Psychology, 19, 551–554. [Google Scholar] [CrossRef]
  32. Rosseel, Y. (2012). lavaan: An R package for structural equation modeling. Journal of Statistical Software, 48, 1–36. [Google Scholar] [CrossRef]
  33. Russell-Lasalandra, L. L., Christensen, A. P., & Golino, H. (2024). Generative psychometrics via AI-GENIE: Automatic item generation and validation via network-integrated evaluation. Available online: https://osf.io/preprints/psyarxiv/fgbj4_v1 (accessed on 6 April 2012). [CrossRef]
  34. Sarti, P., Varrasi, S., Guerrera, C. S., Platania, G. A., Furneri, G., Torre, V., Boccaccio, F. M., Rivi, V., Tascedda, S., Pirrone, C., Santagati, M., Blom, J. M. C., Castellano, S., & Caraci, F. (2025). Exploring apathy components and their relationship in cognitive decline: Insights from a network cross-sectional study. BMC Psychology, 13(1), 129. [Google Scholar] [CrossRef]
  35. Siew, C. S. Q., McCartney, M. J., & Vitevitch, M. S. (2019). Using network science to understand statistics anxiety among college students. Scholarship of Teaching and Learning in Psychology, 5, 75–89. [Google Scholar] [CrossRef]
  36. Stanghellini, F., Perinelli, E., Lombardi, L., & Stella, M. (2024). Introducing semantic loadings in factor analysis: Bridging network psychometrics and cognitive networks for understanding depression, anxiety and stress. Advances.in/Psychology, 2, 1–27. [Google Scholar] [CrossRef]
  37. Stella, M. (2020). Forma mentis networks reconstruct how Italian high schoolers and international STEM experts perceive teachers, students, scientists, and school. Education Sciences, 10(1), 17. [Google Scholar] [CrossRef]
  38. Stella, M. (2022). Network psychometrics and cognitive network science open new ways for understanding math anxiety as a complex system. Journal of Complex Networks, 10(3), cnac012. [Google Scholar] [CrossRef]
  39. Stella, M., & Zaytseva, A. (2020). Forma mentis networks map how nursing and engineering students enhance their mindsets about innovation and health during professional growth. PeerJ Computer Science, 6, e255. [Google Scholar] [CrossRef] [PubMed]
  40. Wilson, V. A. (1999, November 8–10). Mathematics anxiety in secondary school students. Annual Meeting of the Mid-South Educational Research Association, Biloxi, MS, USA. [Google Scholar]
Figure 1. Box plot comparing mean Likert scores of MAS-IT questions, grouped by MAS-UK factors, over students’ academic years. Empty dots indicate outliers; bars indicate data distribution.
Psycholint 07 00048 g001
Figure 2. Box plot comparing mean Likert scores of MAS-IT questions over MAS-UK factors, grouped by students’ academic years. Empty dots indicate outliers; bars indicate data distribution. The asterisks indicate significant differences between factors: ***: 1.00 × 10 4 < p < 1.00 × 10 3 and ****: p 1.00 × 10 4 .
Psycholint 07 00048 g002
Figure 3. Correlogram showing Kendall’s Tau correlations between MAS-IT items, grouped by MAS-UK factor (Evaluation, Everyday/Social, and Passive Observation). The color intensity and size of each square represent the strength of the correlation, with red indicating strong positive relationships (i.e., τ close to 1). Blank spaces indicate non-significant correlations (p ≥ 0.05).
Psycholint 07 00048 g003
Figure 4. Exploratory Graph Analysis (EGA) network of MAS-IT items, illustrating the estimated clustering structure (communities) and the strength of partial correlations between items. Each node represents a MAS-IT item, and edges represent regularized partial correlations; thicker edges indicate stronger associations.
Psycholint 07 00048 g004
Figure 5. Correlogram showing Kendall’s Tau correlations between EGA factors and MAS-UK factors based on MAS-IT data. The color intensity of each square represent the strength of the correlation, and the values inside the squares represent the Kendall’s Tau correlation coefficients. The strongest correlations align with the Jaccard similarity results. All correlations are statistically significant (p < 0.05).
Psycholint 07 00048 g005
Figure 6. Item stability analysis for the MAS-UK scale in the sample of Italian psychology students.
Psycholint 07 00048 g006
Disclaimer/Publisher’s Note: The statements, opinions and data contained in all publications are solely those of the individual author(s) and contributor(s) and not of MDPI and/or the editor(s). MDPI and/or the editor(s) disclaim responsibility for any injury to people or property resulting from any ideas, methods, instructions or products referred to in the content.

