Abstract
Previous research on immigrant integration indicates that contextual factors, such as access to health services, often lead to varying levels of immigrant incorporation and feelings of inclusion. Research has demonstrated the link between inclusion and physical health but less is known about the connection between mental health and immigrant inclusion. In this study, we examine the impact of the prevalence of mental health issues at the county level on immigrants’ perceptions of inclusion. We propose that a lower prevalence of mental health issues at the county level is associated with improved perceptions of inclusion among immigrants. To explore this relationship, we analyze data from the Kaiser Family Foundation, which covers feelings of immigrant inclusion from a racially and geographically diverse sample of immigrants across the United States. We pair these data with CDC PLACES data on the crude prevalence of mental health issues at the county level. Our findings reveal an association between the crude prevalence of mental health issues at the county level and immigrants’ feelings of inclusion. Through this analysis, we underscore the significance of understanding the contextual determinants that shape migrants’ perceptions of inclusion.
1. Introduction
Although immigrant integration is a polarizing issue in American society, it remains an important topic to understand. Immigrants currently account for around 14% of the U.S. population, and immigration to the U.S. is currently the highest it has been in decades, leaving local, state, and national experts grappling with the challenges that come with immigrant integration (Moslimani & Passel, 2024). As research demonstrates, many factors—such as social, economic, and political factors—contribute to immigrant integration (Joppke, 2013; Kivisto, 2015; van Tubergen et al., 2004). While many studies have focused on the policy dimensions of immigrant inclusion, fewer studies have focused on the impact that community health has on feelings of immigrant inclusion (Aboii, 2016; Ortiz et al., 2021). In this paper, we examine how community mental health (including stress, depression, and problems with emotions) impacts feelings of immigrant inclusion.
We demonstrate the relationship between the crude prevalence of mental health at the county level (i.e., the crude prevalence among adults aged ≥ 18 years who report that their mental health, including stress, depression, and problems with emotions was not good for 14 or more days during the past 30 days) and feelings of immigrant inclusion through the combination of two datasets. Our independent variable comes from the CDC’s Population-Level Analysis and Community Estimates dataset, which provides estimates of various health outcomes at the county level. For our dependent variable, we use data from the Kaiser Family Foundation and the Los Angeles Times on self-reported feelings of immigrant inclusion. The data include a nationally representative survey on migrant perceptions of health and feelings of inclusion at the neighborhood, state, and national levels. We create an additive index from feelings of inclusion at these three levels. We regress this index onto the prevalence of mental health issues through multilevel models that vary both slopes and intercepts to account for the nested nature of the data. We find that as the crude prevalence of mental health at the county level increases, self-reported feelings of inclusion decrease.
Several mechanisms may explain why we find that feelings of immigrant inclusion decrease along with higher rates of mental health issues at the county level. High levels of mental health challenges at the county level may be indicative of social withdrawal among community members, lower civic engagement, and reduced resources devoted to immigrant inclusion. First, a higher crude prevalence of mental health issues tends to correlate with social isolation and reduced interpersonal trust (Elsina & Martinsone, 2020; Hall et al., 2020; Segrin, 1996). In communities where mental health issues are a challenge, residents may be less likely to interact with each other or engage in community activities that foster immigrant inclusion, such as attending events at local community centers (Mccann et al., 2012). In this way, social isolation and withdrawal may reduce opportunities for immigrants to build local networks, participate in civic life, and feel a sense of belonging.
Second, given the current levels of polarization surrounding immigration (Ollerenshaw & Jardina, 2023), mental health issues can affect the establishment of social networks necessary for inclusion. Prior work demonstrates that individuals who experience mental health issues, like depression, for instance, are more likely to suffer from low feelings of efficacy and are less likely to engage in community civic activities such as advocacy efforts (Baum et al., 2024; Bernardi et al., 2023; Landwehr & Ojeda, 2021; Ojeda, 2015). Civic engagement, such as volunteering, can be beneficial in establishing a sense of community, as interacting with others generally improves feelings of inclusion (Fenn et al., 2024; Hrivnák et al., 2023; Nelson et al., 2019).
Third, counties with a high prevalence of mental health issues often grapple with finding the resources necessary to address mental health concerns, which are often indicative of poor economic conditions. Poor economic conditions may generate feelings of depression, which in turn foster resentment toward newcomers, particularly if economic hardships create competition for jobs and services (Bhavnani & Lacina, 2018; Goldstein & Peters, 2014). Poor economic conditions also limit the amount of resources that can go toward mental health resources and immigrant integration, generating a negative feedback cycle of poor mental health outcomes and exclusion. Recent data suggest that the mental healthcare professionals need met is only 28% across the U.S. (https://www.kff.org/other/state-indicator/mental-health-care-health-professional-shortage-areas-hpsas, accessed on 25 February 2025). Mental health challenges often strain local healthcare and social service systems and draw attention and funding away from immigrant integration programs such as language training, job placement services, and legal aid (Graaf et al., 2016; Pilkauskas et al., 2012; Starr, 2011). The strain can also make it more difficult for local governments and non-profits to implement policies that facilitate immigrant inclusion.
The contributions of this paper are twofold. First, this is one of the first studies that focuses on the impact of contextual variables on a immigrants’ perceptions of inclusiveness. Second while other works that focus on self-reported mental and physical health among immigrant or other vulnerable populations tend to use data from particular subsections of the population, our data are unique in that they include the first nationally representative survey of immigrants in the United States (Crawford et al., 2024; Hong & Yao, 2024; Mboweni et al., 2023; Salami et al., 2023; Sui & Yeung, 2024; Wieland et al., 2012). While other accounts on immigrant health are limited in their generalizability, the representative nature of our data allows us to paint a broad picture of immigrant health across the nation, providing a distinct contribution to the literature on both immigrant inclusion and health. To our knowledge, be it self-reported or observational data, no other representative sample on immigrant health in the United States exists besides the data we use in our analysis.
2. Materials and Methods
2.1. Data
To explore the relationship between inclusivity and immigrant health, we use a survey conducted by the Kaiser Family Foundation (KFF) in partnership with the Los Angeles Times. The nationally representative survey collected data on migrants’ perceptions of how welcoming their neighborhoods, states of residence, and other parts of the U.S. are toward immigrants (i.e., those born outside the U.S. and U.S. territories, including naturalized U.S. citizens, legal permanent residents, those with visas, and those who entered the country without inspection). The sample, comprising 3358 observations, matches the characteristics of the adult immigrant population in the U.S. based on the 2021 American Community Survey. The survey used a mix-mode data collection where responses were collected online, by telephone, and by mail through address-based sampling and random digit dialing from April to June 2023. All respondents were paid for their time. In addition, the surveys were offered in ten languages: English, Spanish, Chinese, Korean, Vietnamese, Portuguese, Haitian-Creole, Arabic, French, and Tagalog.
The dependent variable consists of an additive index measuring the cumulative effect of three inclusiveness measures at the neighborhood and state levels and in other parts of the U.S., ensuring consistency in units, magnitude, and conceptual focus. Perceived inclusivity captures the belief that a neighborhood, state, or any other place in the U.S. is inclusive or welcoming, irrespective of actual policies and outcomes. We assessed the validity of our index using principal components factor analysis to determine if the three variables—measuring welcoming feelings at the neighborhood, state, and national levels—converge into a single dimension of inclusiveness. The analysis retained one factor with an eigenvalue of 1.64, which exceeds the Kaiser criterion (1958) of 1 and accounts for over half of the total variance. This indicates that our composite index effectively captures a single dimension of overall inclusion (see Appendix A). We call this independent variable our Welcome Index, which captures how included immigrants feel in their communities.
The primary independent variable is the crude prevalence of mental health issues at the ZIP code tabulation area (ZCTA) level (i.e., respondents aged ≥ 18 years who reported that their mental health including stress, depression, and problems with emotions was not good for 14 or more days during the past 30). The data come from the latest release of the Population Level Analysis and Community Estimates (PLACES) (www.cdc.gov/places/, accessed on 18 February 2025), a collaboration between the Centers for Disease Control and Prevention (CDC), the Robert Wood Johnson Foundation, and the CDC Foundation, which provides model-based estimates of health measures. The model-based estimates were produced by the CDC using data sources such as the Behavioral Risk Factor Surveillance System (BRFSS) 2020, Census Bureau 2010 population estimates, and American Community Survey (ACS) 2015–2019 estimates.
We include control variables in line with previous research on immigrant health (Goel et al., 2004; Lara et al., 2005; Riosmena et al., 2015; Saasa et al., 2022), including whether survey respondents have perceived being treated worse in a restaurant, with their interactions with the police, and in the housing market. In addition, we control for respondents’ English ability, their level of education, sex, total household income, the number of years living in the U.S., if they are employed, and their race and ethnicity. We do not have access to respondents’ immigration status to protect respondents’ anonymity. Table 1 summarizes the data.

Table 1.
Summary Statistics.
2.2. Methods
The PLACES and the KFF data were merged into a tabular cross-sectional database. The final data include individual and ZCTA data, producing a multi-level data structure with individuals nested within ZCTAs. Given the hierarchical nature of the data, we fit a varying-intercept, varying-slope multilevel model in which both intercepts and coefficients vary across groups simultaneously. Given that the number of observations is lower than the number of ZCTAs, we instead choose to model the hierarchical nature of the data using counties as the second level to avoid making the random effects parameters and the residual variance unidentifiable (Gelman & Hill, 2007). We collapsed the ZCTA crude prevalence of mental health to the county level to reflect, more accurately, survey respondents’ place of residence rather than using the overall crude prevalence at the county level from PLACES since not all ZCTAs in a county were included. All models are run using R version 4.4.2.
First, we run a linear model, ignoring the hierarchical nature of the data. Equation (1) summarizes the model:
Welcome Index = β0 + β1 Mental Health + β2 D.Restaurant + β3 D.Police + β4 D.Housing + β5 English + β6 Education + β7 Sex + β8 Income + β9 Years US + β10 Employment + β11 Race/Ethnicity + ε.
Our next step is to run a varying-intercepts/varying-slopes multilevel model of the following form (see Equation (2)). This multilevel model predicts an immigrant’s feelings of inclusion, or welcome index, based on a set of individual and county level predictors—including the crude prevalence of mental health, categorical indicators for restaurant, police, and housing discrimination perceptions, as well as English proficiency, education, sex, income, years in the U.S., employment status, and race/ethnicity—while also incorporating group-level variability. Specifically, the model allows both the intercept (baseline level of the welcome index) and the slope for the crude prevalence of mental health, our independent variable, to vary across counties through the random effects terms and . This structure captures the idea that not only does the overall level of inclusion perceptions (i.e., welcome index) differ by county, but the impact of the crude prevalence of mental health on the welcome index can also change from one county to another, thus accounting for unobserved heterogeneity, such as differences between local institutions and policies, at the county level.
Welcome Indexij = β0 + β1 Mental Health ij + β2 D.Restaurantij + β3 D.Policeij + β4 D.Housingij + β5 English ij + β6Educationij + β7 Sexij + β8Iincomeij + β9 Years USij + β10Employmentij + β11 Race/Ethnicityij + b0j + b1j Mental Healthij + εij.
The random effects are assumed to follow a joint multivariate normal distribution:
and the individual-level errors are assumed to be
3. Results
The results are summarized in Table 2. Model 1 presents the results after running a linear regression predicting the levels of migrant inclusiveness. Overall, as the crude prevalence of mental health increases, so do migrants’ feelings of perceived lack of inclusion (β = 0.0197, p < 0.05). In other words, poor mental health results in feelings of exclusion, whereas good mental health results in feelings of inclusion. Feelings of discrimination or mistreatment in restaurants, by the police, or housing, are also associated with feelings of exclusion. As migrants’ English proficiency increases, they also tend to have more positive feelings of inclusion. As respondents live in the U.S. for longer, feelings of inclusion seem to decrease, plausibly because immigrants realize the dichotomy between immigrants and non-immigrants that exists within American society (Cortina, 2024).
Table 2.
Linear regression results (Model 1) and multilevel regression results (Model 2).
Turning to Model 2, the multilevel model, the fixed effects results indicate that county-level crude prevalence of mental health is significantly associated with feelings of exclusion (β = 0.0309, p < 0.05), suggesting that migrants living in counties with a higher prevalence of poor mental health tend to experience slightly higher levels of exclusion, or lack of inclusion. An increase of 1 percentage point in the overall rate of mental health issues is associated with a 0.03 unit rise in the extent to which migrants feel excluded. Among the strongest predictors, discrimination in restaurants (β = 0.3211, p < 0.001) and discrimination during interactions with the police (β = 0.1919, p < 0.01) significantly influence perceived immigrant inclusion, indicating that experiences of discrimination play a major role in shaping perceptions of feeling unwelcome. Additionally, discrimination in housing (β = 0.1242, p < 0.05) also has a significant effect. English proficiency has a negative association (β = −0.2217, p < 0.001), implying that individuals with higher English proficiency may feel more included, possibly due to stronger community networks. Years in the U.S. also has a small but significant positive effect (β = 0.0041, p < 0.01), suggesting that the longer immigrants reside in the U.S., the less they feel included.
Several demographic variables, such as education, income, employment status, and sex, do not appear to have a statistically significant effect on immigrant inclusion. However, race and ethnicity (β = 0.1667, p < 0.05) show a positive correlation, indicating that racial and ethnic minorities tend to feel less welcome than non-Hispanic white immigrants. Figure 1 summarizes the results.
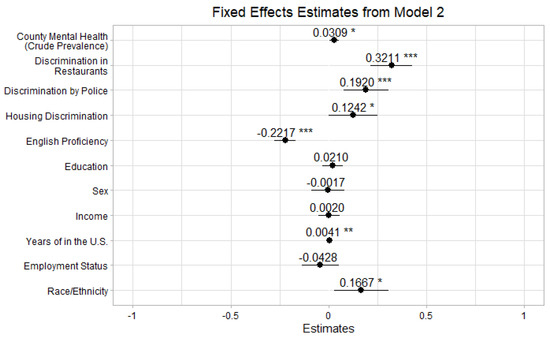
Figure 1.
Fixed effects’ estimates for Model 2. Note: p < 0.001 ***, p < 0.01 **, p < 0.05 *.
In terms of the random effects, the variance estimates show substantial variation in inclusion perceptions across counties (σ2 = 0.855 for intercepts). The slope for county-level mental health prevalence has a small variance (σ2 = 0.0038), meaning that while its effect varies slightly across counties, it may not be a dominant force. The strong negative correlation (−1.00) between county-level mental health prevalence and the intercept suggests that for migrants living in counties with lower baseline inclusion scores, the crude prevalence of mental health tends to have a more substantial negative effect on inclusion.
One of the most important limitations is that the model did not fully converge, suggesting potential instability in the estimates, possibly due to collinearity or insufficient data points per county, a common challenge when working with observational data. Additionally, while the variance components suggest meaningful between-county differences, the small effect sizes of some predictors warrant further investigation.
Despite these limitations, this analysis highlights the importance of mental health prevalence and discrimination experiences in shaping immigrant inclusion. Both discrimination and the prevalence of mental health issues negatively affect inclusion.
4. Discussion
High rates of mental health issues, including stress, depression, and problems with emotions at the county level, may be indicative of several factors that contribute to low feelings of inclusion. They may be reflective of greater social withdrawal among members of the community, whether materialized via social isolation, low levels of civic engagement, or fewer resources to promote immigrant inclusion. First, in communities where mental health issues are prevalent, individuals may be less likely to interact with one another, which limits opportunities for immigrants to build networks and communities necessary for integration. Second, at the individual level, those who experience discrimination may also be less likely to engage in community life and thus withdraw from positive social interactions. Third, communities with high levels of mental health challenges tend to strain social service systems in addition to local healthcare, which limits resources that can potentially be devoted to integration.
Our analysis is not to say that other factors do not influence feelings of inclusion and exclusion among immigrants. Rather, an extensive body of work grapples with these various factors. Work concerning the social determinants of health argues that economic, societal, and political conditions also contribute to health outcomes, which in turn affect immigrant health (Marmot & Wilkinson, 2006; Short & Mollborn, 2015). Robust work in both the American and European contexts find that policy adoption, such as exclusionary policies, negatively affect immigrant mental health (Dourgnon et al., 2023; Malmusi, 2015; Vargas et al., 2017). Anti-immigrant policies not only reduce access to health services but also provoke stress, anxiety, and depression among immigrants particularly (Bratter & Eschbach, 2005; Eschbach et al., 2004; Kaestner et al., 2009; Martinez et al., 2015). In addition, restrictive federal policies often limit immigrants’ access to public assistance, contributing to declining mental and physical health among foreign-born populations (Gelatt, 2016; Pitkin Derose et al., 2007; Vargas & Pirog, 2016). Moreover, institutional, county-level factors, such as available social support services at the county level, employment, and labor conditions also contribute to inclusion and exclusion (Van Kempen, 2019). Other structural barriers, including geographic distance from health facilities, and intersecting socioeconomic variables such as income, racial and ethnic background, and legal status are also strong determinants of healthcare quality and overall wellbeing (Williams et al., 2010).
Collectively, this body of research highlights how social, structural, contextual, and institutional dynamics play a critical role in shaping immigrant health outcomes, be they physical or mental, which ultimately influence social inclusion (Anderson & Olson, 2019; Lamont, 2009; Wright & Stickley, 2013). Our work contributes to this existing body of literature by suggesting that community-level health mental health may point to several mechanisms at play, such as high levels of social isolation, more instances of discrimination, or strained social services, that may also affect individual feelings of inclusion. We make the case that, to create thriving communities, community mental health must also be assessed.
Future work should focus on identifying which of these mechanisms contribute to the link between increased county-level depression rates and lower feelings of inclusion. Longitudinal data on feelings of immigrant inclusion and county-level mental health may provide more insight into the specific mechanisms that connect these variables. Lastly, future work may explore the geographic variation inherent in this relationship. For example, rural versus urban areas may have different patterns of mental health challenges and patterns of inclusion (Cortina & Hardin, 2023). Future work may also focus on how local level factors, such as county and city level policies contribute to immigrant health and social inclusion.
Immigrant integration greatly benefits American society—immigrants contribute significantly to the economy as taxpayers, consumers, and business owners (Abramitzky & Boustan, 2017; Borjas, 1995). Not only do immigrants contribute to our community fabric economically, but they also contribute socially, enriching our society through the introduction of new cultural traditions, food, music, and art as previous immigrant waves have done. Moreover, immigrants who feel included in our society also actively contribute through volunteer work, civic participation, and advocacy (Bloemraad, 2006; De Graauw & Bloemraad, 2017). In many ways, immigrants revitalize our society by choosing to take part in the American Dream (Brubaker, 1990; Smith, 2008). The more included immigrants feel in society, the more they can contribute in these varying ways, creating thriving communities across the U.S. For this reason, it is important to understand how community-level factors influence feelings of immigrant inclusion.
Author Contributions
Conceptualization, S.C. and J.C.; methodology, S.C. and J.C.; software, S.C. and J.C.; validation, S.C. and J.C.; formal analysis, S.C. and J.C.; investigation, S.C. and J.C.; resources, S.C. and J.C.; data curation, S.C. and J.C.; writing—original draft preparation, S.C. and J.C.; writing—review and editing, S.C. and J.C.; visualization, S.C. and J.C.; supervision, S.C. and J.C.; project administration, S.C. and J.C.; All authors have read and agreed to the published version of the manuscript.
Funding
This research received no external funding.
Institutional Review Board Statement
Ethical review and approval were waived for this study as we use secondary data previously collected by the Kaiser Family Foundation and the Los Angeles Times.
Informed Consent Statement
Not applicable.
Data Availability Statement
Restrictions apply to the availability of these data. The data were obtained from the Kaiser Family Foundation and are available at https://www.kff.org/, with the permission of the Kaiser Family Foundation following the completion of a data use agreement.
Acknowledgments
We thank the Kaiser Family Foundation and the Los Angeles Times for their generosity in providing us with the immigrant health data used in this paper.
Conflicts of Interest
The authors declare no conflicts of interest.
Abbreviations
The following abbreviations are used in this manuscript:
| KFF | Kaiser Family Foundation |
| PLACES | Population Level Analysis and Community Estimates |
| CDC | Centers for Disease Control and Prevention |
| ZCTA | ZIP code tabulation area |
Appendix A
Table A1.
Principal-Component Factor Analysis.
Table A1.
Principal-Component Factor Analysis.
| Factor | Eigenvalue | Difference | Proportion | Cumulative |
|---|---|---|---|---|
| Factor 1 | 1.64 | 0.79 | 0.55 | 0.55 |
| Factor 2 | 0.85 | 0.34 | 0.28 | 0.83 |
| Factor 3 | 0.51 | 0.17 | 1.00 | |
| LR test: independent vs. saturated: chi2(3) = 1118.73 Prob>chi2 = 0.0000 | ||||
| Factor loadings (pattern matrix) and unique variances | ||||
| Variable | Factor 1 | Uniqueness | ||
| Neighborhood | 0.80 | 0.37 | ||
| State | 0.83 | 0.31 | ||
| Other parts of the U.S. | 0.57 | 0.68 | ||
| Observations: 3244 | ||||
| Factors retained: 1 | ||||
References
- Aboii, S. M. (2016). Undocumented immigrants and the inclusive health policies of sanctuary cities. Harvard Public Health Review, 9, 1–10. [Google Scholar] [CrossRef]
- Abramitzky, R., & Boustan, L. (2017). Immigration in American economic history. Journal of Economic Literature, 55(4), 1311–1345. [Google Scholar] [CrossRef] [PubMed]
- Anderson, K., & Olson, S. (2019). Immigration as a social determinant of health: Proceedings of a workshop. Available online: https://books.google.com/books?hl=en&lr=&id=dkqCDwAAQBAJ&oi=fnd&pg=PR1&dq=Immigration+and+the+Social+Determinants+of+Health&ots=pEnk9rBy-c&sig=T6Uo_hVE7JMRfu3dsWpOusoKKbY (accessed on 26 February 2025).
- Baum, M. A., Druckman, J. N., Simonson, M. D., Lin, J., & Perlis, R. H. (2024). The political consequences of depression: How conspiracy beliefs, participatory inclinations, and depression affect support for political violence. American Journal of Political Science, 68(2), 575–594. [Google Scholar] [CrossRef]
- Bernardi, L., Mattila, M., Papageorgiou, A., & Rapeli, L. (2023). Down but not yet out: Depression, political efficacy, and voting. Political Psychology, 44(2), 217–233. [Google Scholar] [CrossRef]
- Bhavnani, R., & Lacina, B. (2018). Nativism and economic integration across the developing world: Collision and accommodation. Cambridge University Press. Available online: https://www.cambridge.org/core/elements/nativism-and-economic-integration-across-the-developing-world/C724C9B1C8470EC9999C46AB510B5FAE (accessed on 25 February 2025).
- Bloemraad, I. (2006). Becoming a citizen: Incorporating immigrants and refugees in the United States and Canada. Available online: https://books.google.com/books?hl=en&lr=&id=nbkwDwAAQBAJ&oi=fnd&pg=PR9&dq=Becoming+a+citizen:+Incorporating+immigrants+and+refugees+in+the+United+States+and+Canada&ots=9npIIbwQbB&sig=iR7G-9hqvZqWFaC_-hTRiHm5xHg (accessed on 27 February 2025).
- Borjas, G. J. (1995). The economic benefits from immigration. Journal of Economic Perspectives, 9(2), 3–22. [Google Scholar] [CrossRef]
- Bratter, J. L., & Eschbach, K. (2005). Race/ethnic differences in nonspecific psychological distress: Evidence from the national health interview survey. Social Science Quarterly, 86(3), 620–644. [Google Scholar] [CrossRef]
- Brubaker, W. R. (1990). Immigration, citizenship, and the nation-state in france and germany: A comparative historical analysis. International Sociology, 5(4), 379–407. [Google Scholar] [CrossRef]
- Cortina, J. (2024). Proximity politics: How distance shapes public opinion and political behaviors. Columbia University Press. [Google Scholar]
- Cortina, J., & Hardin, S. (2023). The geography of mental health, urbanicity, and affluence. International Journal of Environmental Research and Public Health, 20(8), 5440. [Google Scholar] [CrossRef]
- Crawford, J., Lundy, T., Crawford, C., Moore, J., Viscek, N., & Kapisavanhu, N. (2024). The experience of social exclusion and the path to inclusion from the perspectives of immigrant and refugee women in the Niagara region. International Journal of Environmental Research and Public Health, 22, 12. [Google Scholar] [CrossRef]
- De Graauw, E., & Bloemraad, I. (2017). Working together: Building successful policy and program partnerships for immigrant integration. Journal on Migration and Human Security, 5(1), 105–123. [Google Scholar] [CrossRef]
- Dourgnon, P., Pourat, N., & Rocco, L. (2023). European immigrant health policies, immigrants’ health, and immigrants’ access to healthcare. Health Policy, 127(1). Available online: https://www.sciencedirect.com/science/article/pii/S0168851022003189?casa_token=vXnREs1LepwAAAAA:bNajVRYDSwqyhzwrDaSyt5YgEmW1rE4VCs0zRKgzFGviUP4f5yUEkJ8lEu5fgZ7S3hNMFXnwPw (accessed on 27 February 2025).
- Elsina, I., & Martinsone, B. (2020). Interpersonal relationship aspects as perceived risk and social support factors in a clinical sample of adolescents with depression. Journal of Relationships Research, 11. Available online: https://www.cambridge.org/core/journals/journal-of-relationships-research/article/interpersonal-relationship-aspects-as-perceived-risk-and-social-support-factors-in-a-clinical-sample-of-adolescents-with-depression/8C4613DF30730B86967294C34AAFFA10 (accessed on 27 February 2025).
- Eschbach, K., Ostir, G. V., Patel, K. V., Markides, K. S., & Goodwin, J. S. (2004). Neighborhood context and mortality among older Mexican Americans: Is there a barrio advantage? American Journal of Public Health, 94(10), 1807–1812. [Google Scholar] [CrossRef] [PubMed]
- Fenn, N., Sacco, A., Monahan, K., Robbins, M., & Pearson-Merkowitz, S. (2024). Examining the relationship between civic engagement and mental health in young adults: A systematic review of the literature. Journal of Youth Studies, 27(4), 558–587. [Google Scholar] [CrossRef] [PubMed]
- Gelatt, J. (2016). Immigration status and the healthcare access and health of children of immigrants. Social Science Quarterly, 97(3), 540–554. [Google Scholar] [CrossRef]
- Gelman, A., & Hill, J. (2007). Data analysis using regression and multilevel/hierarchical models. Cambridge University Press. [Google Scholar]
- Goel, M. S., Mccarthy, E. P., Phillips, R. S., & Wee, C. C. (2004). Obesity among US immigrant subgroups by duration of residence. The Journal of the American Medical Association, 292(23), 2860–2867. [Google Scholar] [CrossRef] [PubMed]
- Goldstein, J. L., & Peters, M. E. (2014). Nativism or economic threat: Attitudes toward immigrants during the great recession. International Interactions, 40(3), 376–401. [Google Scholar] [CrossRef]
- Graaf, G., Hengeveld-Bidmon, E., Carnochan, S., Radu, P., & Austin, M. J. (2016). The Impact of the great recession on county human-service organizations: A cross-case analysis. Human Service Organizations: Management, Leadership & Governance, 40(2), 152–169. [Google Scholar] [CrossRef][Green Version]
- Hall, E. D., Meng, J., & Reynolds, R. M. (2020). Confidant network and interpersonal communication associations with depression in older adulthood. Health Communication, 35(7), 872. [Google Scholar] [CrossRef]
- Hong, H., & Yao, C. T. (2024). Community inclusion experiences while establishing community mental health clubhouses in Taiwan: Perspectives from mental health professionals. Healthcare, 12(11), 1067. [Google Scholar] [CrossRef]
- Hrivnák, M., Moritz, P., Melichová, K., & Bellérová, S. (2023). Does civic engagement support relational and mental health of urban population? Societies, 13(2), 46. [Google Scholar] [CrossRef]
- Joppke, C. (2013). Tracks of immigrant political incorporation. In Outsiders no more? Models of immigrant political incorporation (pp. 65–81). Available online: https://books.google.com/books?hl=en&lr=&id=H3cTDAAAQBAJ&oi=fnd&pg=PA65&dq=tracks+of+immigrant+political+incorporation&ots=vIBwV6A5D8&sig=GUuxpqBfFVKiaBWPZngQiyb-k6g (accessed on 26 February 2025).
- Kaestner, R., Pearson, J. A., Keene, D., & Geronimus, A. T. (2009). Stress, allostatic load, and health of Mexican immigrants. Social Science Quarterly, 90(5), 1089–1111. [Google Scholar] [CrossRef]
- Kivisto, P. (2015). Social spaces, transnational immigrant communities, and the politics of incorporation. In Incorporating diversity (1st ed., pp. 299–319). Routledge. Available online: https://api.taylorfrancis.com/content/chapters/edit/download?identifierName=doi&identifierValue=10.4324/9781315633978-20&type=chapterpdf (accessed on 27 February 2025).
- Lamont, M. (2009). Responses to racism, health, and social inclusion as a dimension of successful societies. In Successful societies: How institutions and culture affect health (pp. 151–168). Cambridge University Press. Available online: https://books.google.com/books?hl=en&lr=&id=paLllU3WBlwC&oi=fnd&pg=PA151&dq=health+and+social+inclusion&ots=W-ZLcJPfBd&sig=FVG2rtATMeiyZeYnRL48HcsS4cU (accessed on 25 February 2025).
- Landwehr, C., & Ojeda, C. (2021). Democracy and depression: A cross-national study of depressive symptoms and nonparticipation. American Political Science Review, 115(1). Available online: https://www.cambridge.org/core/journals/american-political-science-review/article/democracy-and-depression-a-crossnational-study-of-depressive-symptoms-and-nonparticipation/F130385CE49E480832DC3A07B43A2CD4 (accessed on 25 February 2025). [CrossRef]
- Lara, M., Gamboa, C., Kahramanian, M. I., Morales, L. S., & Hayes Bautista, D. E. (2005). Acculturation and Latino health in the United States: A review of the literature and its sociopolitical context. Annual Review of Public Health, 26, 367–397. [Google Scholar] [CrossRef]
- Malmusi, D. (2015). Immigrants’ health and health inequality by type of integration policies in European countries. The European Journal of Public Health, 25(2), 293–299. Available online: https://academic.oup.com/eurpub/article-abstract/25/2/293/489061 (accessed on 25 February 2025). [CrossRef]
- Marmot, M., & Wilkinson, R. G. (2006). Social determinants of health. Oxford University Press. [Google Scholar]
- Martinez, O., Wu, E., Sandfort, T., Dodge, B., Carballo-Dieguez, A., Pinto, R., Rhodes, S., Moya, E., & Chavez-Baray, S. (2015). Evaluating the Impact of immigration policies on health status among undocumented immigrants: A systematic review. Journal of Immigrant and Minority Health, 17(3), 947–970. [Google Scholar] [CrossRef] [PubMed]
- Mboweni, E. N., Mphasha, M. H., & Skaal, L. (2023). Exploring mental health awareness: A study on knowledge and perceptions of mental health disorders among residents of Matsafeni village, Mbombela, Mpumalanga province. Healthcare, 12(1), 85. [Google Scholar] [CrossRef] [PubMed]
- Mccann, T. V., Lubman, D. I., & Clark, E. (2012). The experience of young people with depression: A qualitative study. Journal of Psychiatric and Mental Health Nursing, 19(4), 334–340. [Google Scholar] [CrossRef]
- Moslimani, M., & Passel, J. S. (2024, September 27). Key findings about U.S. immigrants. Pew Research Center. Available online: https://www.pewresearch.org/short-reads/2024/09/27/key-findings-about-us-immigrants/ (accessed on 27 February 2025).
- Nelson, C., Sloan, J., & Chandra, A. (2019). Examining civic engagement links to health. Available online: https://www.rand.org/content/dam/rand/pubs/research_reports/RR3100/RR3163/RAND_RR3163.pdf (accessed on 27 February 2025).
- Ojeda, C. (2015). Depression and political participation. Social Science Quarterly, 96(5), 1226–1243. [Google Scholar] [CrossRef]
- Ollerenshaw, T., & Jardina, A. (2023). The asymmetric polarization of immigration opinion in the United States. Public Opinion Quarterly, 87(4), 1038–1053. [Google Scholar] [CrossRef]
- Ortiz, R., Farrell-Bryan, D., Gutierrez, G., Boen, C., Tam, V., Yun, K., Venkataramani, A. S., & Montoya-Williams, D. (2021). A content analysis of us sanctuary immigration policies: Implications for research in social determinants of health: Study examines us sanctuary immigration. Health Affairs, 40(7), 1145–1153. [Google Scholar] [CrossRef]
- Pilkauskas, N. V., Currie, J. M., & Garfinkel, I. (2012). The great recession, public transfers, and material hardship. Social Science Review, 86(3), 401–427. [Google Scholar] [CrossRef]
- Pitkin Derose, K., Escarce, J. J., & Lurie, N. (2007). Immigrants and health care: Sources of vulnerability. Health Affairs, 26(5), 1258–1268. [Google Scholar] [CrossRef]
- Riosmena, F., Everett, B. G., Rogers, R. G., & Dennis, J. A. (2015). Negative acculturation and nothing more? cumulative disadvantage and mortality during the immigrant adaptation process among Latinos in the United States. International Migration Review, 49(2), 443–478. [Google Scholar] [CrossRef]
- Saasa, S., Okech, D., Choi, Y. J., Nackerud, L., & Littleton, T. (2022). Social exclusion, mental health, and social well-being among African immigrants in the United States. International Social Work, 65(4), 787–803. [Google Scholar] [CrossRef]
- Salami, O. O., Yaskina, M., Georgiades, K., Diaz, E., Hegadoren, K., Meherali, S., Yohani, S., & Senthilselvan, A. (2023). Mental health of immigrant children and adolescents (6–17 years) in Canada: Evidence from the Canadian health measures survey. International Journal of Environmental Research and Public Health, 20(21), 6997. [Google Scholar] [CrossRef] [PubMed]
- Segrin, C. (1996). Interpersonal communication problems associated with depression and loneliness. In Handbook of communication and emotion (pp. 215–242). Academic Press. Available online: https://www.sciencedirect.com/science/article/pii/B9780120577705500102 (accessed on 25 February 2025).
- Short, S. E., & Mollborn, S. (2015). Social Determinants and health behaviors: Conceptual frames and empirical advances. Current Opinion in Psychology, 5, 78–84. [Google Scholar] [CrossRef]
- Smith, R. (2008). Birthright citizenship and the fourteenth Amendment in 1868 and 2008. University of Pennsylvania Journal of Constitutional Law, 11, 1329–1335. Available online: https://heinonline.org/hol-cgi-bin/get_pdf.cgi?handle=hein.journals/upjcl11§ion=47 (accessed on 25 February 2025).
- Starr, M. A. (2011). Recession and the social economy. In Consequences of economic downturn: Beyond the usual economics (pp. 189–214). Palgrave Macmillan. [Google Scholar] [CrossRef]
- Sui, T., & Yeung, J. W. K. (2024). Emotional Health of immigrant adolescents by a cross-lagged panel network analysis: Self-esteem and depression. Healthcare, 12(24), 2563. [Google Scholar] [CrossRef] [PubMed]
- Van Kempen, R. (2019). Social exclusion: The importance of context. In R. Van Kempen, & H. Anderson (Eds.), Governing European cities: Social fragmentation, social exclusion and urban (1st ed., pp. 41–70). Taylor and Francis. [Google Scholar]
- van Tubergen, F., Maas, I., & Flap, H. (2004). The economic incorporation of immigrants in 18 western societies: Origin, destination, and community effects. American Sociological Review, 69(5), 704–727. [Google Scholar] [CrossRef]
- Vargas, E. D., & Pirog, M. A. (2016). Mixed-status families and WIC uptake: The effects of risk of deportation on program use. Social Science Quarterly, 97(3), 555–572. [Google Scholar] [CrossRef]
- Vargas, E. D., Sanchez, G. R., & Juárez, M. (2017). Fear by association: Perceptions of anti-immigrant policy and health outcomes. Journal of Health Politics, Policy and Law, 42(3), 459–483. [Google Scholar] [CrossRef]
- Wieland, M. L., Weis, J. A., Palmer, T., Goodson, M., Loth, S., Omer, F., Abbenyi, A., Krucker, K., Edens, K., & Sia, I. G. (2012). Physical activity and nutrition among immigrant and refugee women: A community-based participatory research approach. Women’s Health Issues, 22(2). [Google Scholar] [CrossRef]
- Williams, D. R., Mohammed, S. A., Leavell, J., & Collins, C. (2010). Race, socioeconomic status, and health: Complexities, ongoing challenges, and research opportunities. Annals of the New York Academy of Sciences, 1186(1), 69–101. [Google Scholar] [CrossRef]
- Wright, N., & Stickley, T. (2013). Concepts of social inclusion, exclusion and mental health: A review of the international literature. Journal of Psychiatric and Mental Health Nursing, 20(1), 71–81. [Google Scholar] [CrossRef] [PubMed]

Disclaimer/Publisher’s Note: The statements, opinions and data contained in all publications are solely those of the individual author(s) and contributor(s) and not of MDPI and/or the editor(s). MDPI and/or the editor(s) disclaim responsibility for any injury to people or property resulting from any ideas, methods, instructions or products referred to in the content. |
© 2025 by the authors. Licensee MDPI, Basel, Switzerland. This article is an open access article distributed under the terms and conditions of the Creative Commons Attribution (CC BY) license (https://creativecommons.org/licenses/by/4.0/).