Article

Feline Responses to Increasing Inclusion of Natural Olive Extract in Liquid or Dry Palatant Formulations Applied to Kibble Diets

Kemin Industries, Inc., Des Moines, IA 50317, USA
*
Author to whom correspondence should be addressed.
Submission received: 4 February 2025 / Revised: 4 March 2025 / Accepted: 6 March 2025 / Published: 9 March 2025
(This article belongs to the Topic Research on Companion Animal Nutrition)

Abstract

:
Olive extract (OE) has been used in human foods for its nutraceutical effects, making it a product of interest for pet food. However, OE’s effect on palatability has not been examined. The study objective was to evaluate the palatability of dry cat foods with OE applied at differing inclusions within liquid or dry palatants. Twenty-seven volatile compounds were identified by gas chromatography–mass spectrometry for a potentially earthy or fruit-like flavor profile. Liquid palatants were formulated to supply 0 (control), 15, 30, 50, 75, and 150 ppm OE, and dry palatants were formulated to provide 0, 100, 200, 400, and 600 ppm OE when coated onto kibble. Palatability was evaluated using two-day, two-bowl testing of OE-containing versus control rations in adult cats (n = 20) with two-tailed t-tests to determine if OE affected intake ratio (IR). The observed IR of rations with OE were 0.45 to 0.56. The only preference was the 200 ppm treatment (IR = 0.56; p = 0.01) while the other OE rations were not different from the control (p ≥ 0.05). These findings indicate that palatant formulations can supply kibble diets with up to 150 ppm OE for liquid and 600 ppm for dry applications without negatively impacting cat food palatability.

1. Introduction

Bioactive ingredients from plant sources are sought after by both human and pet food markets for their healthful perception. Many of these compounds may be found in industry waste streams, providing opportunities to promote sustainability within the pet food industry [1]. Studies have demonstrated potential positive outcomes for different plant-derived ingredients; however, the safety threshold for these molecules can vary greatly between dogs and cats and should not be used without adequate scrutinization [2].
As obligate carnivores, cats gravitate towards high-protein meat sources to ensure they consume adequate essential nutrients such as taurine [3]. Domestic cats are regarded as finicky eaters, as they prefer fresh-tasting diets and are suspicious of unknown or potentially harmful aromas [4]. Many plant compounds are considered bitter and have notable aromatic profiles that may discourage feline consumption. Despite being skeptical of untested or herbaceous aromas, cats are often found chewing on or interacting with various plant materials within their environment. As such, plant-based ingredients may be acceptable to cats, but their dietary inclusion needs to be titrated for both effect and acceptance.
The plants best known for attracting cats’ attention are catnip (Nepeta cataria) and other catmints from the Nepeta genus. The attractant in catnip is nepetalactone, an isoprenoid responsible for the “catnip effect” of euphoria or mania noted in most, but not all, cats [5]. In addition to catnip, anecdotal reports from veterinarians and veterinary nutritionists suggest that some cats readily consume olives, which may be offered in small amounts as treats in homes or veterinary clinics. Although olives do not specifically contain nepetalactone, they have several similar isoprenoid compounds that may contribute to cats’ selection of them as an attractant [6].
An internal study conducted in 2019 provided cat owners with various types of olives and olive oil to assess cats’ willingness to approach and consume olive products in their home environment. To determine potential links between olive acceptance and catnip responsiveness, cats were initially screened for positive or negative responses to catnip oil, with 26 of 39 participants being identified as positive responders. While over 70% of the cats approached the olive products, 19% and 24% consumed olives and olive oil, respectively, with no patterns attributed to catnip responsiveness [7]. These results indicated that olive acceptance varied between supplementation forms (whole fruit versus oil), thus supporting the evaluation of other olive products as a flavor component in palatants for cat diets. Olive extract (OE) has been used to improve the nutritional content of human food but has been scarcely evaluated in pet food [8]. A recent publication showed no adverse effects based on hematological profiles when feeding an OE to senior cats at 1000 ppm; however, there was no data assessing the effects of OE on diet palatability [9]. As adequate food consumption is needed to obtain the benefits of bioactive plant compounds, palatability assessment is an important first step when developing new products for cat food. The purpose of this study was to determine feline preference and consumption of kibble diets coated with liquid or dry palatants containing various concentrations of a natural OE.

2. Materials and Methods

2.1. Olive Extract Flavor Characterization

Natural OE was provided by PhenoFarm (Scandriglia RI, Italy) and analyzed by headspace solid-phase micro-extraction coupled with gas chromatography quadrupole time-of-flight (HS-SPME GC/Q-TOF) on an Agilent 7200B Series equipped with a PAL robotic tool change auto sampler (Santa Clara, CA, USA). In total, 1 g of sample was mixed with 9 mL of saturated NaCl and 10 μL of an internal standard (200 ppb, 2-octanol/3 ppm, cyclopentanol) in a 20 mL GC vial for qualitative analysis. The sample mixture was incubated at 60 °C for 5 min before the preconditioned fiber (250 °C, 3 min; 50/30 µm Carboxen®/DVB/PDMS, Agilent, Santa Clara, CA, USA) was exposed to sample headspace. The fiber was allowed to incubate in sample headspace for 30 min at 60 °C and transferred to the GC inlet equipped with an ultra-inert SPME liner (0.75 mm; Agilent) for 3 min at 250 °C before splitless injection. Gas chromatography–mass spectrometry (MS) analysis was performed using a 30 m × 0.25 mm × 0.25 µm film thickness HP-5MS capillary column (Agilent). The oven temperature was held at 40 °C for 0.5 min and ramped up to 160 °C at the rate of 10 °C/min and then to 325 °C at the rate of 30 °C/min with mass spectra generation in electron ionization mode at 70 eV. Resultant data were analyzed using MassHunter Qualitative Analysis (Version B.07.00, Agilent) for deconvolution and preliminary compound identification based on National Institute of Standard and Technology library suggestions (version NIST14). Confirmation of preliminary identities was performed using a linear retention index calculated for each compound using an alkanes standard (C7-C40, Millipore Sigma Supelco, Bellefonte, PA, USA).

2.2. Cat Food Preparations

2.2.1. Liquid Application to Dry Food

Pet foods often include palatant as an ingredient to add flavors and increase palatability. Palatants could be in either liquid or powder formats for coating onto the kibble surface. A liquid palatant, PALASURANCE® C40-10 Liquid (Kemin Industries, Verona, MO, USA), was chosen for initial testing due to the ease of adding liquid OE to a liquid matrix. One production lot of the C40-10 was used as the control palatant and the base for mixing in OE at different inclusion rates. All palatants were designed to be coated at 1.5% on the kibble to deliver 15 ppm (PT015-LQ), 30 ppm (PT030-LQ), 50 ppm (PT050-LQ), 75 ppm (PT075-LQ), or 150 ppm (PT150-LQ) of OE on the kibble surface (Table 1). The prototype palatants were prepared by measuring C40-10 and OE into 16 oz containers (S-19465, ULINE, Pleasant Prairie, WI, USA) and shaking for 1 min.
Uncoated cat kibble (Diamond® Maintenance Cat, Diamond Pet Foods®, Meta, MO, USA) was coated with 4% chicken fat for 3 min prior to the addition of 1.5% liquid palatant followed by additional mixing for 3 min in a rotating mixing drum (model 450DD, Kushlan Products LLC, Katy, TX, USA). Coated kibbles were packaged into foil bags before shipping to Kennelwood, Inc. (Champaign, IL, USA) for the feeding trials. The inclusion rates of chicken fat and palatant were in accordance with kibble manufacturer specifications. The chemical composition and ingredient list of the diet can be found in Table A1 and Table A2.

2.2.2. Dry Application to Dry Food

In the North American market, Kemin cat palatants in a dry powder form are typically higher in demand. Therefore, OE was additionally evaluated in the formulation of PALASURANCE® C15-20 (C15-20), a Kemin Industries-made dry palatant. C15-20 was used as the control palatant with 0 ppm of OE. For inclusions of OE into C15-20, liquid OE was plated onto SIPERNAT® 22 (EVONIK Corporation, Piscataway, NJ, USA) at a 1:1 ratio by weight and blended until visually homogeneous. Prototype dry palatants were made by replacing corn starch within the formulation with different levels of the plated OE to provide OE at 50 ppm (PT050-DB), 100 ppm (PT100-DB), 200 ppm (PT200-DB), 400 ppm (PT400-DB), and 600 ppm (PT600-DB) to the kibble surface when coated with 2% of the prototypes (Table 2). The control and prototype dry palatants were first mixed with a spoon for 30 sec, passed through a US 30 mesh sieve (600 µm; Fisher Scientific, Hampton, NH, USA), transferred to a zip-top bag, and shaken for 1 min.
Kibble coating methods for dry palatants were similar to those previously mentioned. A rotating mixing drum (model 450DD) was used to combine uncoated cat kibble (Evolve® Chicken & Rice, Sunshine® Mills, Inc., Red Bay, AL, USA), 6.4% chicken fat, and 2% dry palatant. The inclusion rates of chicken fat and palatant were in accordance with kibble manufacturer specifications. The chemical composition and ingredient list of the diet can be found in Table A1 and Table A2.

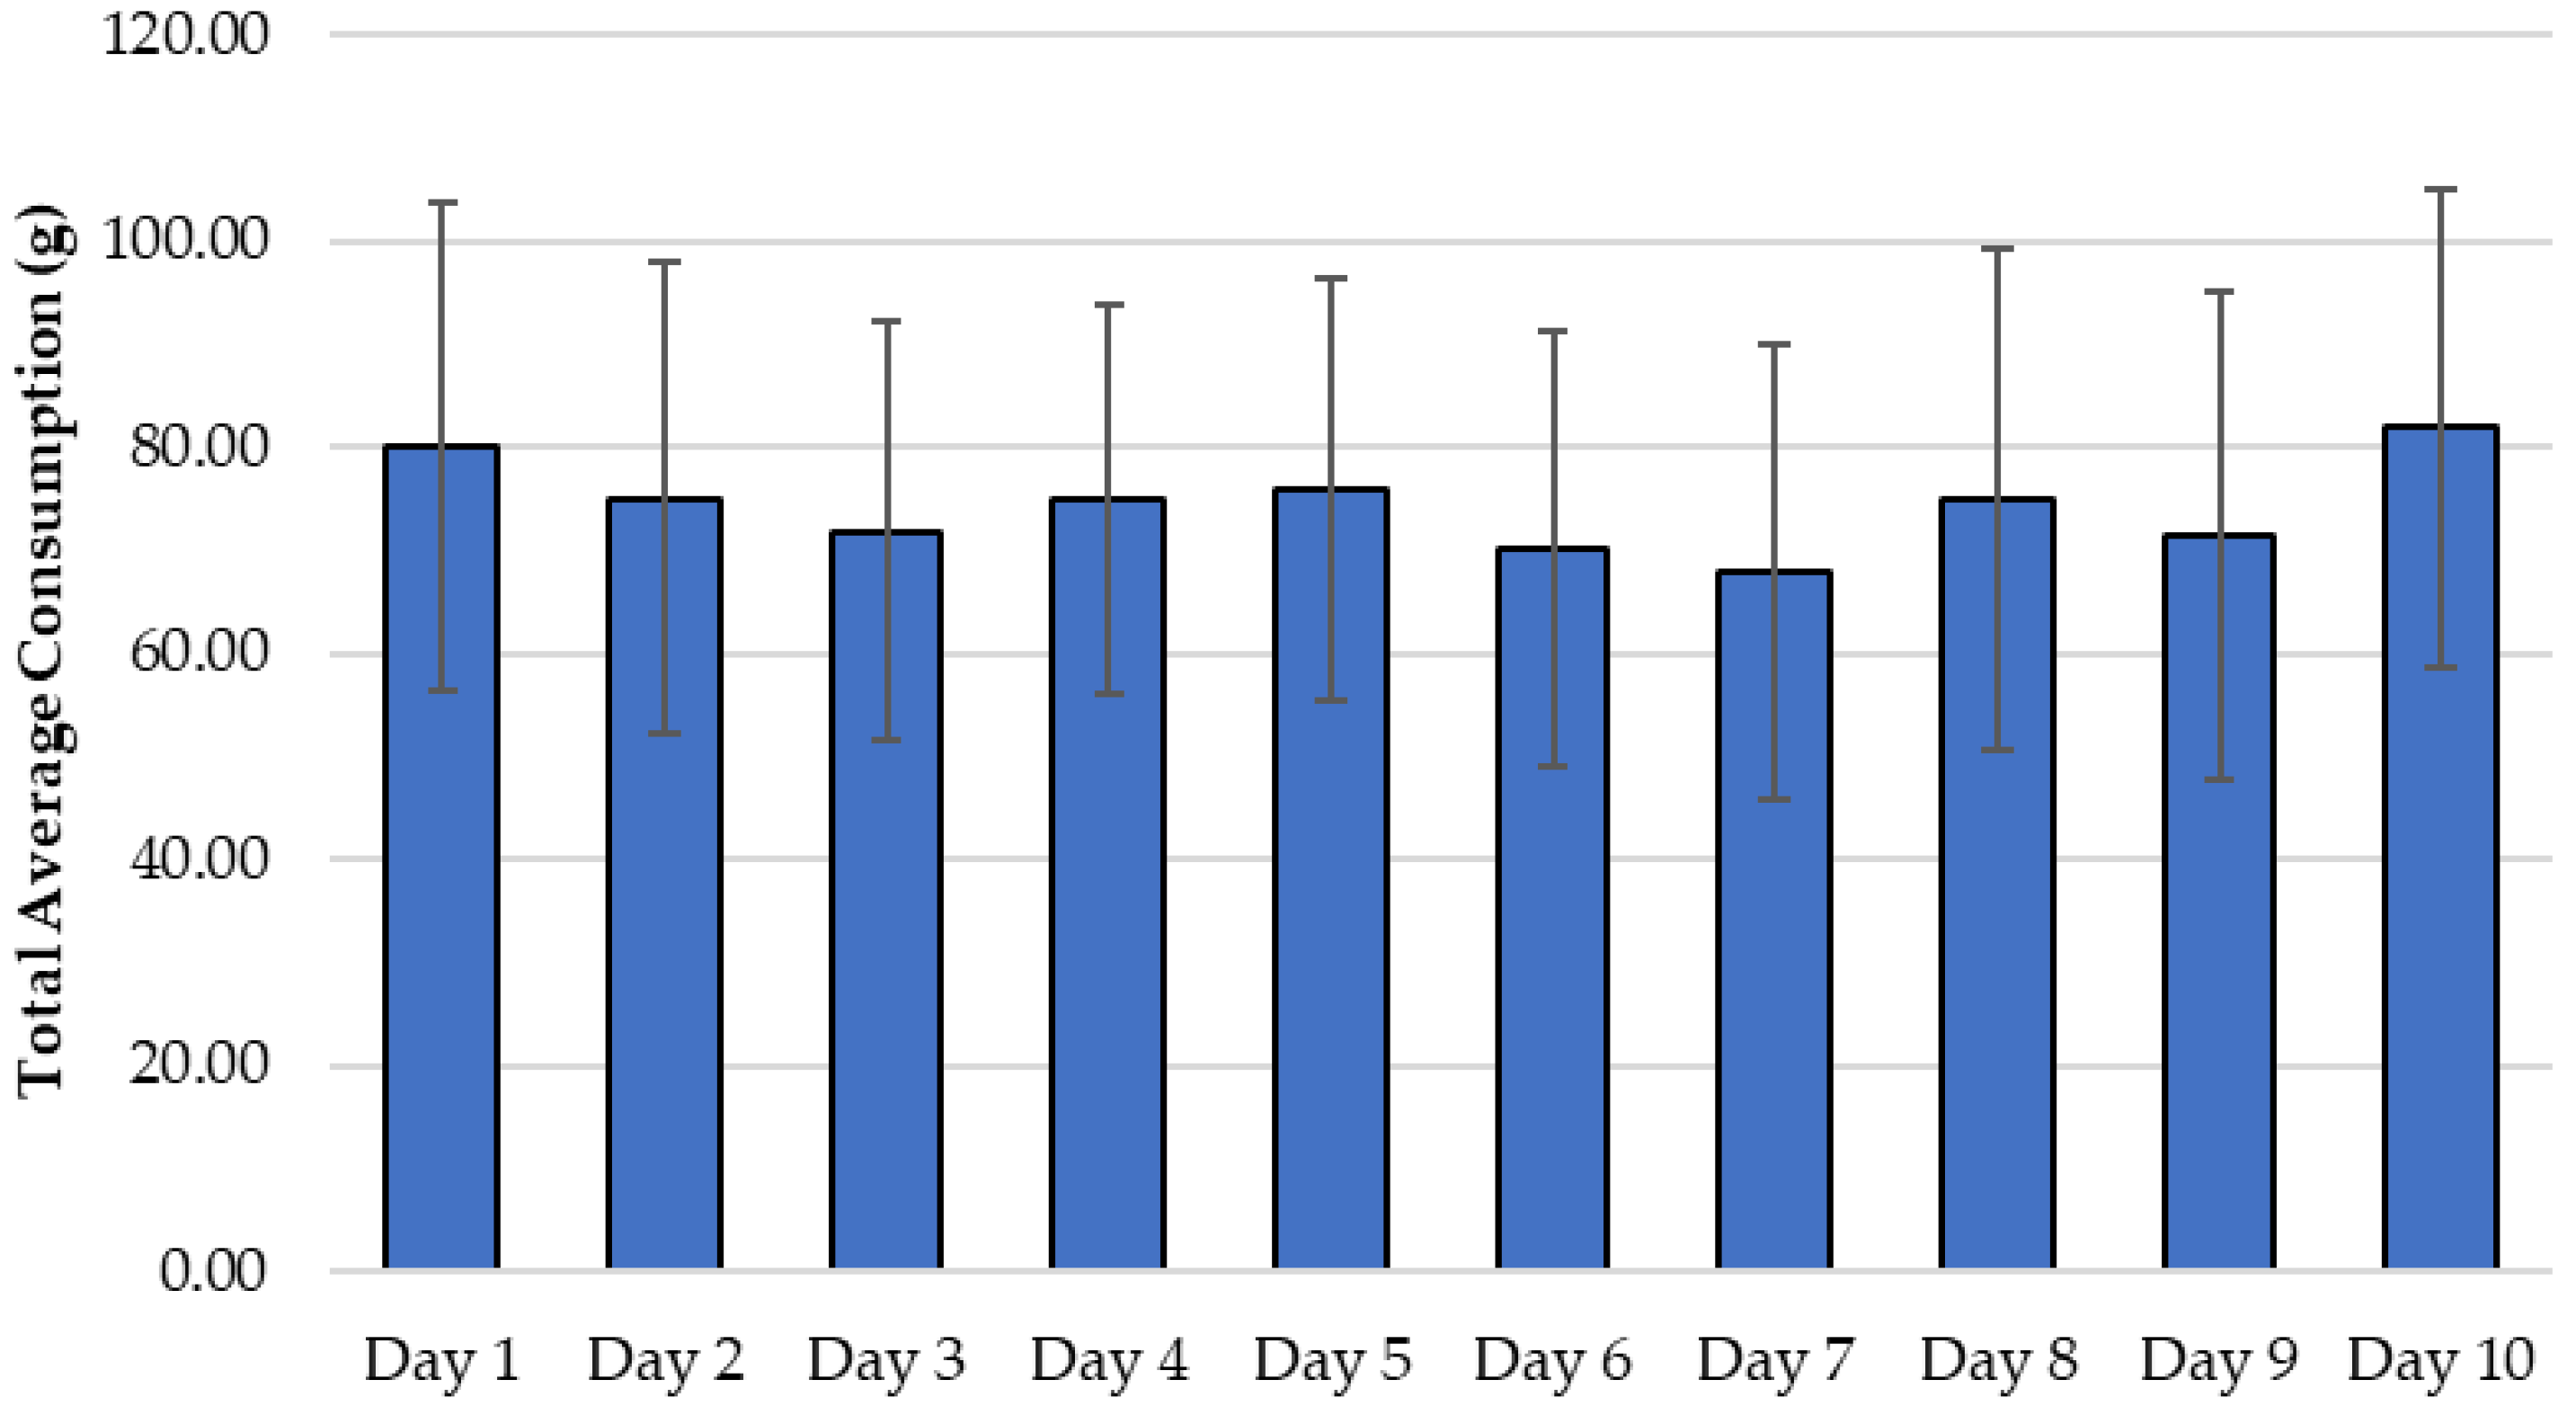
2.3. Palatability Testing

Palatability testing was performed as a two-day, two-bowl test with panels of 20 adult cats at Kennelwood, Inc. All animals were housed in a temperature-controlled room with free access to water. Cats were kept in cages during feeding times and free-roaming at other times. Rations were fed in increasing order of OE inclusion within liquid and dry applications. Each animal was presented with two bowls (experimental and control ration) containing approximately 110 g of diet for up to 8 h. Bowl placement was reversed on the second day to mitigate potential side preference. Ten cats were randomly selected to have control on the left and treatment on the right on the first day; the other ten cats had the opposite order. The amount of each diet consumed, and the first approach and first-choice preference were recorded for each animal on days 1 and 2. The intake ratio (IR) of the experimental ration was determined by the calculation shown below:
I n t a k e R a t i o I R = E x p e r i m e n t a l R a t i o n C o n s u m e d C o n t r o l R a t i o n C o n s u m e d + E x p e r i m e n t a l R a t i o n C o n s u m e d

2.4. Statistical Analysis

A two-tailed t-test was performed on IR using Microsoft® Excel®. The null hypothesis was that no preference was observed between the control- and OE-containing rations, resulting in an IR of 0.50 (H0 = 0.50). A given IR was statistically significant (showing a preference) when p < 0.05.

3. Results and Discussion

3.1. Olive Extract Flavor Characterization

The GC-MS analysis of OE identified 27 volatile compounds (Table 3). Overall, many of the compounds had fruity or green notes while others had earthy or phenolic descriptors [10]. The profile was characteristic of olive aroma when compared to the literature: 10 of the compounds identified have been associated with olive leaf oil [11], 9 with olive oil [12], 8 with brined table olives [13], and 7 with olive pomace [14,15]. Furthermore, five detected isoprenoid-related compounds, limonene, linalool oxide, linalool, rose oxide, and alpha-terpineol, have also been reported in catnip [16]. These compounds have green and herbal notes commonly associated with plant-derived products and are not limited to olives or catnip [17]. While taste molecules are often not readily volatile and difficult to detect from GC, a previous high-pressure liquid chromatography analysis of the product detected hydroxytyrosol, a bitter compound that may discourage consumption by cats [18]. Another bitter compound associated with olives and reported to be a potential antioxidant and irritant is oleocanthal. Oleocanthal has been identified in the oil portion of olive fruit using Proton Nuclear Magnetic Resonance [19] but was not detectable in olive oil using solid-phase GC-MS [20]. While differences in methodology may explain why oleocanthal was not detected in the current study, the OE used in this study was from a water-based extraction and oleocanthal was not expected to be found in the product.

3.2. Palatability Testing for Dry Food Applications

3.2.1. Palatability of Liquid Application to Dry Food

Over the 10 days of testing, the average daily consumption of the experimental and control rations ranged from 60 to 80 g out of the 220 g offered (Figure 1). The average IRs of OE rations by liquid application ranged from 0.45 to 0.55, suggesting similar consumption of the OE treatments compared to control diets (Figure 2). All applications resulted in parity or no difference in palatability compared to the control. Yet, comparing day-to-day testing of the OE treatments, there was an observed decrease in average IR on day 2 for all applications (Figure 3). In addition, the average first choice of diets containing olives was between 40 and 60% among all treatments (Figure 4). This corresponded to the results of the IR, as no significant numerical differences were observed. While it could not be determined if OE improved palatability, the application of the product up to 150 ppm via liquid palatant application did not negatively impact the cats’ preference for the diet.

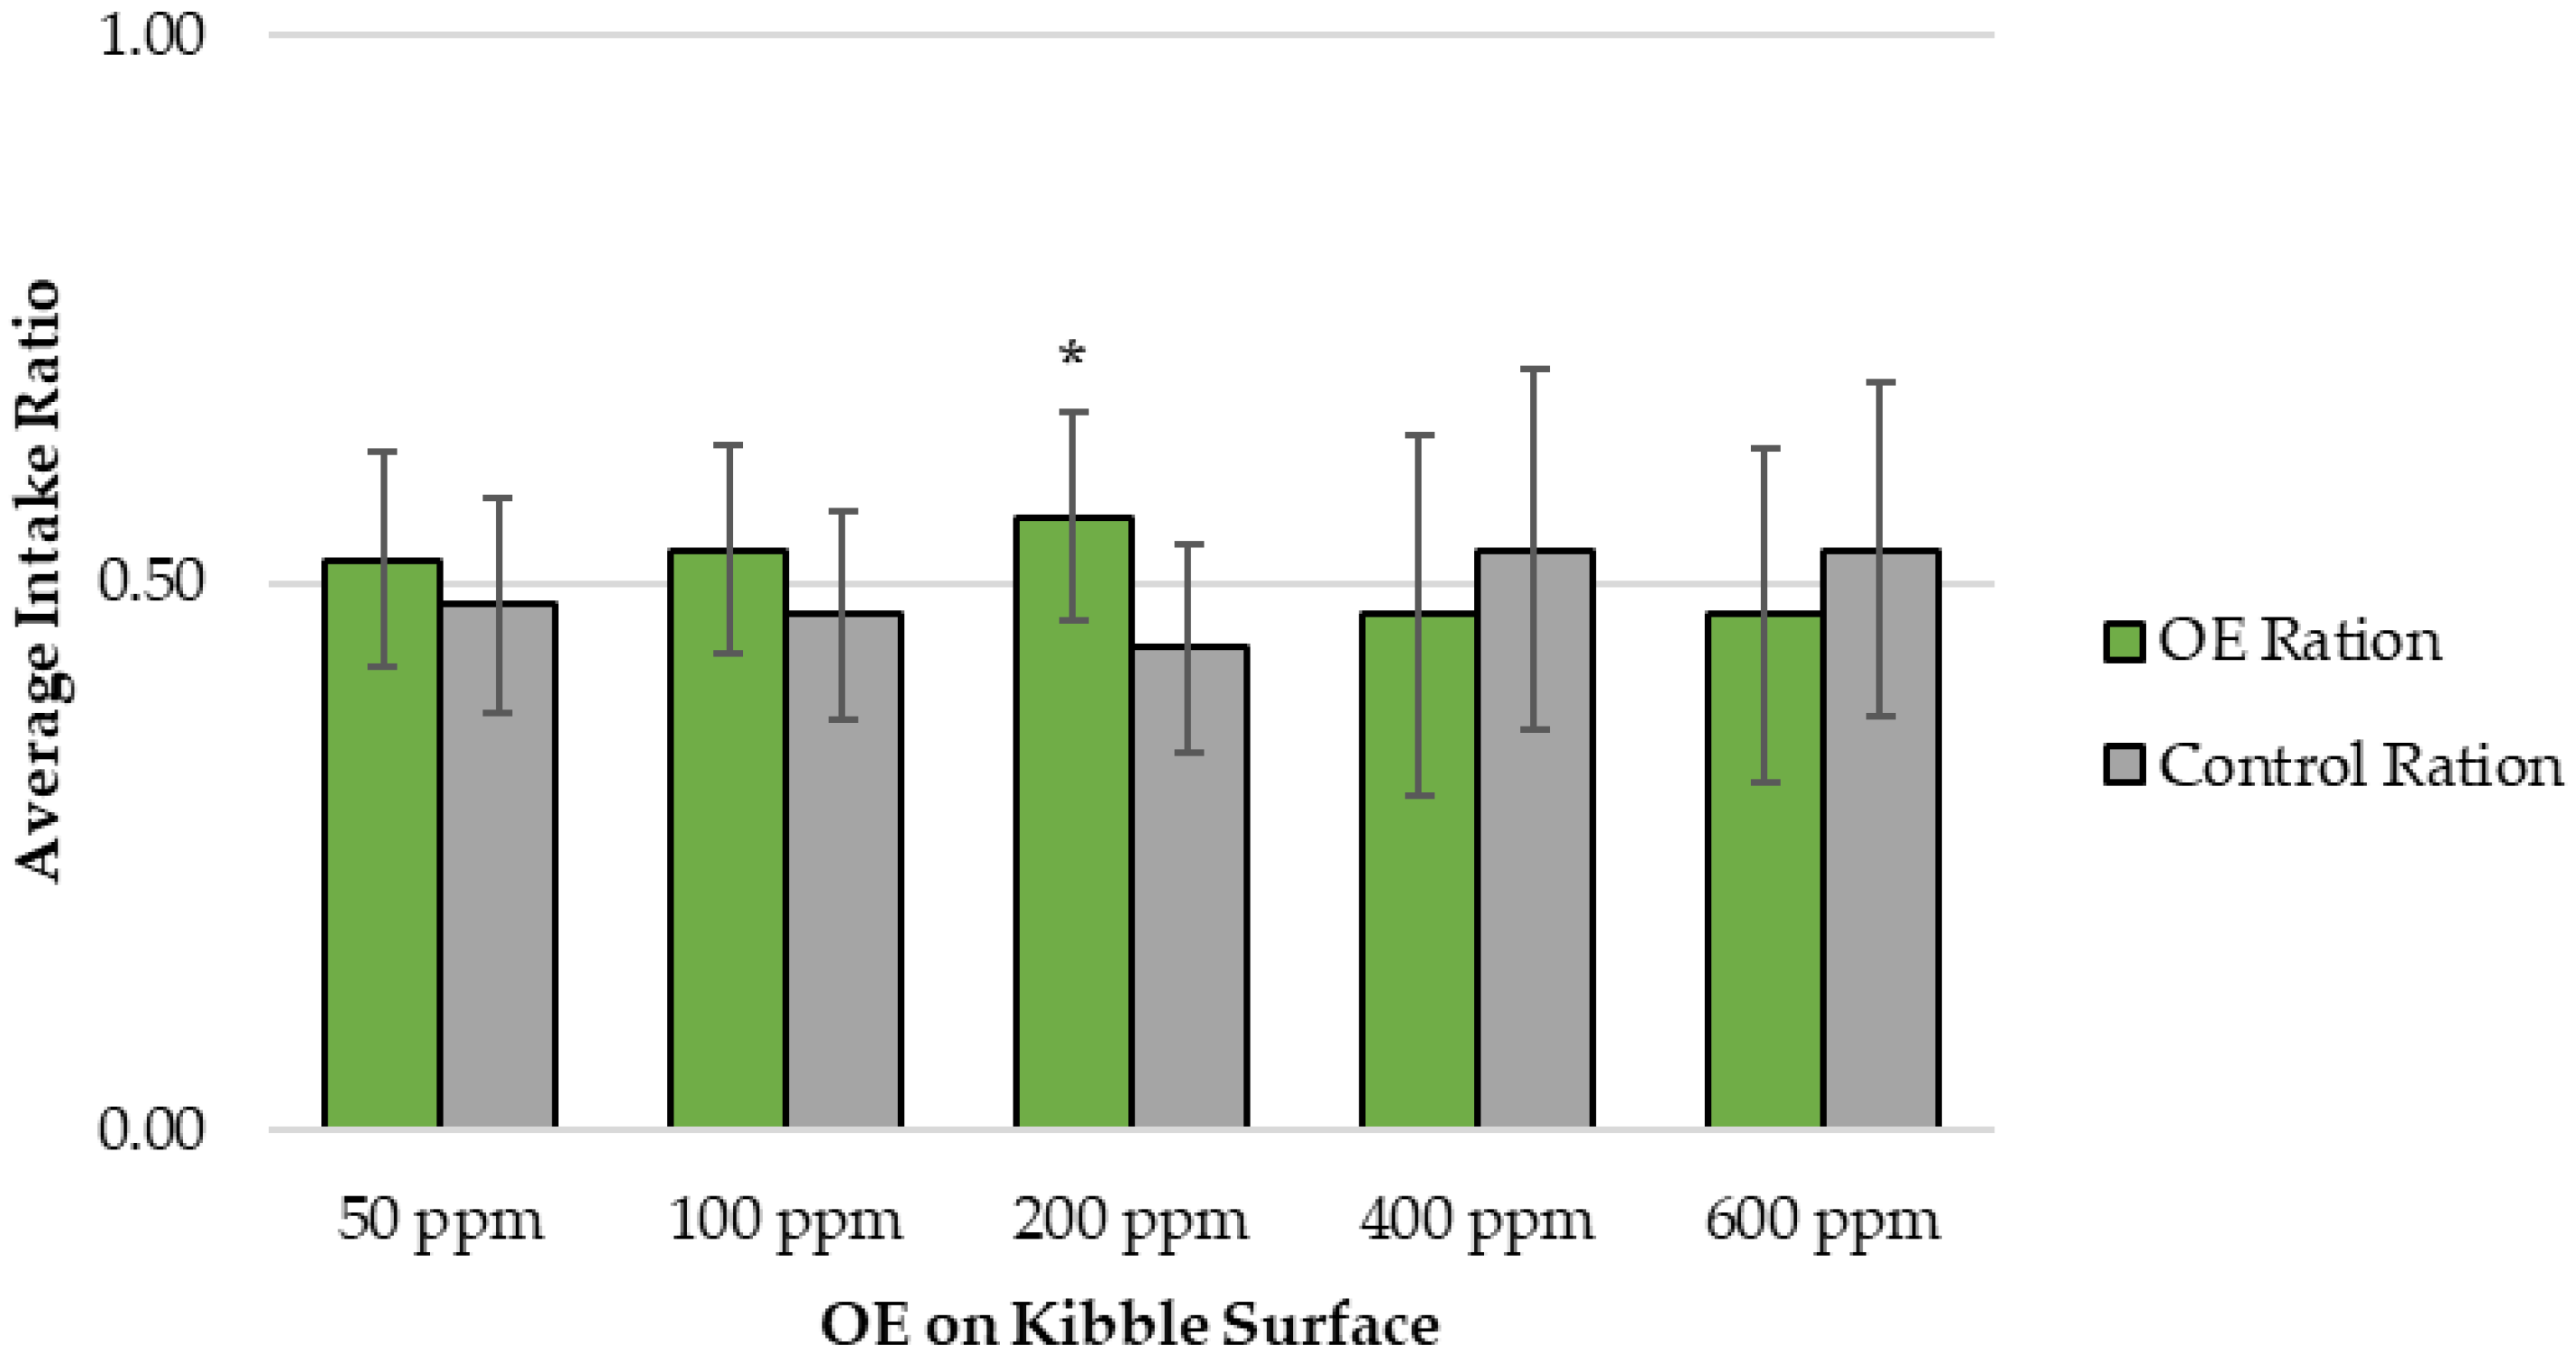
3.2.2. Palatability of Dry Application to Dry Food

The average daily consumption of the experimental and control rations ranged between 70 and 80 g of the total 220 g offered (Figure 5). Like with liquid applications, the consumption of kibbles with OE supplied by dry palatants and control diets were similar with average intake ratios of OE rations ranging from 0.47 to 0.56 (Figure 6). However, the decreasing trend noted in the day-to-day IR of the liquid applications was not observed with the dry applications (Figure 7). The OE inclusion started higher in the dry palatant trials based on the no-preference results between OE diets (15 to 150 ppm) and the control diet from the liquid palatant trials. Initially, 50 to 200 ppm OE was evaluated, with only the highest application (200 ppm OE) resulting in preference (p = 0.01), while no difference in palatability could be determined when comparing the lower applications to the control ration. With the preference for 200 ppm OE, testing with higher inclusions (400 to 600 ppm) was implemented to observe the continued effect on palatability. However, increasing OE inclusion above 200 ppm resulted in parity. The first choice of diets with 50 to 600 ppm ranged from 42 to 48%, which was close to a non-preference of 50% (Figure 4).
It is important to note the differences in fat application (3.0% versus 6.4%) and kibble used (Diamond® versus Sunshine®) for the liquid and dry applications. The level of fat may impact the release of aroma compounds on the surface, and the kibble could have different taste profiles, which may interact with the OE differently. Different kibble types were used due to availability at the time of testing for the liquid and dry applications.
A similarity observed throughout palatability testing was a higher first approach and choice on day 1 compared to day 2 for the OE rations (Figure 4 and Figure 8). In addition, within the liquid applications, a similar trend was noted for the IRs. While this could indicate an impact on longer-term palatability, the OE rations were fed back-to-back with increasing concentration and continuously had higher choice of the OE rations every other day. Another explanation may be a side bias within the panel of cats rather than a clear attraction to either diet. FC and FA were evaluated for each animal and noted if the animal selected a different ration, thus the same side for each test (Table A3). Within the 20-cat panel, 50% of the cats approached and 40% chose the same side for at least seven of the tests. Even so, while aroma can influence initial attraction to a diet, for “continuous choice,” other factors such as taste and texture have been considered stronger palatability drivers. While whole olives may contain bitter or potential throat-irritating compounds like oleocanthal, these were not detected in the extract in this study. Additionally, consumption did not decrease over the testing period and no negative clinical signs were noted by the animal care staff to suggest significant inclusion of potential irritants within OE-containing rations. Other methods focusing on the behavior responses of cats during and after eating could be an alternative to assessing a cat’s preference for a diet [21].
The overall results from the liquid and dry palatant trials showed that adding up to 600 ppm of OE onto the kibble surface did not deter the cats from consuming the diet. Though the current study presented promising results for using OE as a flavor ingredient, the long-term effect of OE on palatability and animal health could be further examined. Future studies could include more animals for a higher statistical power since most results in the current study were not statistically significant. Additionally, examining OE at the same concentrations on the same type of kibble for dry and liquid palatants may further help the understanding of how OE could show differing impacts on palatability with different applications. While the present study included OE up to 600 ppm, future research could include OE at a higher concentration that is still within the safety limit to determine whether there is an effect on palatability with a higher than 600 ppm application rate.

4. Conclusions

Olive extract is a novel ingredient for pet foods containing isoprenoid and other compounds that could be used as a flavor in dry cat foods. Short-term testing showed no negative impact on palatability for all treatment foods, suggesting that adding OE to dry foods at 15 to 600 ppm via liquid or dry palatant applications did not initially alter the cats’ interest in consumption of the different diets. Future research focused on longer-term palatability is necessary to fully assess OE applications on cat diets.

Author Contributions

Conceptualization, C.K.; formal analysis, C.K.; investigation, C.K.; data curation, C.K.; writing—original draft preparation, C.K., R.G., C.H. and K.F.-C.; writing—review and editing, R.G., C.H. and K.F.-C. All authors have read and agreed to the published version of the manuscript.

Funding

This research was funded by Kemin Inc.

Institutional Review Board Statement

Ethical review and approval for this study fell under the umbrella protocols of day-to-day palatability feeding studies. No further consideration for animal welfare was deemed necessary as no biological samples were collected from the animals and feeding was considered short-term.

Informed Consent Statement

Not applicable.

Data Availability Statement

The data presented in this study are available on request from the corresponding author. Information or data may not be available if deemed confidential, intellectual property of Kemin.

Acknowledgments

We thank Jason Shelton, My Troung, Thomas Webb, Victor Cedillos, Jay Ayala, and Francisco Padilla for their support of the study.

Conflicts of Interest

All authors are employed by Kemin Inc. The authors declare no conflict of interest.

Abbreviations

The following abbreviations are used in this manuscript:
OEOlive extract
HS-SPMEHeadspace solid-phase microextraction
GCGas chromatography
Q-TOFQuadrupole time-of-flight
IRIntake ratio

Appendix A

Table A1. Chemical composition of cat diets.
Diamond®Sunshine®
Calories (kcal/kg)37423588
Crude protein (min)30.00%32.00%
Crude fat (min)15.00%13.00%
Crude fiber (max)3.00%3.00%
Moisture (max)10.00%11.00%
Ash (max)-10.00%
Linoleic acid (min)-1.50%
Calcium (min)0.80%1.30%
Phosphorus (min)0.65%1.10%
Sodium (min)-0.20%
Selenium (min)0.3 mg/kg0.25 mg/kg
Vitamin A (min)10,000 IU/kg10,000 IU/kg
Vitamin E (min)100 IU/kg30 IU/kg
Taurine (min)0.10%-
Omega 6 fatty acid (min)0.0242.40%
Omega 3 fatty acid (min)0.0040.40%
Total microorganisms> 80,000,000 CFU/lb> 80,000,000 CFU/lb
Table A2. Top 10 ingredients listed of cat diets.
Order of IngredientDiamond®Sunshine®
1Chicken by-product mealChicken
2Whole grain ground cornChicken meal
3Wheat flourTurkey meal
4Chicken fat *Whole ground brown rice
5Corn protein mealPeas
6Ground white riceOat groats
7Dried plain beet pulpChicken fat *
8Natural chicken flavorFlaxseed
9FlaxseedDried plain beet pulp
10Fish mealNatural chicken flavor
* Preserved with mixed tocopherols.
Table A3. First approach (FA) and first choice (FC) of PhenoFarm™ Olive Extract (OE) coated on kibble rations from liquid and dry applications. An asterisk (*) indicates a change in selection between experimental OE and control ration from day 1 to day 2, or selection of the same side as rations were switched between days.
ApplicationOE RationMetricCat 1Cat 2Cat 3Cat 4Cat 5Cat 6Cat 7Cat 8Cat 9Cat 10Cat 11Cat 12Cat 13Cat 14Cat 15Cat 16Cat 17Cat 18Cat 19Cat 20
Liquid15 ppmFA **** *** * ***
FC * *** **** **
30 ppmFA* ** ** *** * **
FC ***** ** ** **
50 ppmFA**** * ***** * ***
FC* **** ** ** * **
75 ppmFA** * * *** *********
FC * * ******* * ****
150 ppmFA * * ** * ******
FC * ** **** ***
Dry50 ppmFA ** **** ****** *
FC * * ***** ** * ****
100 ppmFA *** ***** ******* *
FC ** ***** **
200 ppmFA ** ********* * *
FC * ***** * ********
400 ppmFA* *** *** ** * ****
FC* * * ** *
600 ppmFA** *** **** * ** **
FC****** *** ** * *

References

  1. Petcu, C.D.; Mihai, O.D.; Tăpăloagă, D.; Gheorghe-Irimia, R.-A.; Pogurschi, E.N.; Militaru, M.; Borda, C.; Ghimpețeanu, O.-M. Effects of plant-based antioxidants in animal diets and meat products: A review. Foods 2023, 12, 1334. [Google Scholar] [CrossRef] [PubMed]
  2. Guo, X.; Wang, Y.; Zhu, Z.; Li, L. The role of plant extracts in enhancing nutrition and health for dogs and cats: Safety, benefits, and applications. Vet. Sci. 2024, 11, 426. [Google Scholar] [CrossRef] [PubMed]
  3. MacDonald, M.L.; Rogers, Q.R.; Morris, J.G. Nutrition of the domestic cat, a mammalian carnivore. Annu. Rev. Nutr. 1984, 4, 521–562. [Google Scholar] [CrossRef] [PubMed]
  4. Aldrich, G.C.; Koppel, K. Pet Food Palatability Evaluation: A Review of Standard Assay Techniques and Interpretation of Results with a Primary Focus on Limitations. Animals 2015, 5, 43–55. [Google Scholar] [CrossRef] [PubMed]
  5. Bol, S.; Caspers, J.; Buckingham, L.; Anderson-Shelton, G.D.; Ridgway, C.; Buffington, C.T.; Schulz, S.; Bunnik, E.M. Responsiveness of Cats (Felidae) to silver vine (Actinida polygama), Tatarian honeysuckle (Lonicera tatarica), valerian (Valeriana officinalis) and catnip (Nepeta cataria). BMC Vet. Res. 2017, 13, 70. [Google Scholar] [CrossRef] [PubMed]
  6. Mapelli-Brahm, P.; Hernanz-Vila, D.; Stinco, C.M.; Heredia, F.J.; Melendez-Martinez, A.J. Isoprenoids Composition and Colour to Differentiate Virgin Olive Oils from a Specific Mill. Food Sci. Technol. 2018, 89, 18–23. [Google Scholar] [CrossRef]
  7. Guldenpfennig, R. (Kemin Inc., Des Moines, IA, USA); Best, J. (Kemin Inc., Des Moines, IA, USA). Private communication: WP-22-1736 Evaluating Olives (Olea Europea) as a Potential Feline Palatability Enhancer, 2022.
  8. Silva, A.F.R.; Resende, D.; Monteiro, M.; Coimbra, M.A.; Silva, A.M.S.; Cardoso, S.M. Application of hydroxytyrosol in the functional foods field: From ingredient to dietary supplements. Antioxidants 2020, 9, 1246. [Google Scholar] [CrossRef] [PubMed]
  9. Thomas, D.G.; Dyer, P.; Andrews, C.J. The effect of dietary olive polyphenols on markers of inflammation and bodyweight in senior domestic cats. J. Appl. Anim. Nutr. 2024, 12, 29–39. [Google Scholar] [CrossRef]
  10. The Good Scents Company. Available online: http://www.thegoodscentscompany.com/ (accessed on 30 November 2023).
  11. Popović, M.; Špika, M.J.; Bratinčević, M.V.; Ninčević, T.; Matešković, A.; Mandušić, M.; Rošin, J.; Nazlić, M.; Dunkić, V.; Vitanović, E. Essential Oil Volatile Fingerprint Differentiates Croatian cv. Oblica from Other Olea europaea L. Cultivars. Molecules. 2021, 26, 3533. [Google Scholar] [CrossRef] [PubMed]
  12. Stilo, F.; Liberto, E.; Reichenbach, S.E.; Tao, Q.; Bicchi, C.; Cordero, C. Exploring the Extra-Virgin Olive Oil Volatilome by Adding Extra Dimensions to Comprehensive Two-Dimensional Gas Chromatography and Time-of-Flight Mass Spectrometry Featuring Tandem Ionization: Validation of Ripening Markers in Headspace Linearity Conditions. J. AOAC Int. 2021, 104, 274–287. [Google Scholar] [CrossRef] [PubMed]
  13. Sacchi, R.; Corrado, G.; Basile, B.; Mandarello, D.; Ambrosino, M.L.; Paduano, A.; Savarese, M.; Caporaso, N.; Aponte, M.; Genovese, A. Effect of Salt Addition and Fermentation Time on Phenolics, Microbial Dynamics, Volatile Organic Compounds, and Sensory Properties of the PDO Table Olives of Gaeta (Italy). Molecules. 2022, 27, 8100. [Google Scholar] [CrossRef] [PubMed]
  14. Cecchi, L.; Migliorini, M.; Giambanelli, E.; Cane, A.; Mulinacci, N.; Zanoni, B. Volatile Profile of Two-Phase Olive Pomase (Alperujo) by HS-SPME-GC-MS as a Ket to Defining Volatile Markers of Sensory Defects Caused by Biological Phenomena in Virgin Olive Oil. J. Agric. Food Chem. 2021, 69, 5155–5166. [Google Scholar] [CrossRef] [PubMed]
  15. Christofi, A.; Fella, P.; Agapiou, A.; Barampouti, E.M.; Mai, S.; Moustakas, K.; Loizidou, M. The Impact of Drying and Storage on the Characteristics of Two-Phase Olive Pomace. Sustainability 2024, 16, 1116. [Google Scholar] [CrossRef]
  16. Baranauskiene, R.; Venskutonis, R.P.; Demyttenaere, J.C. Sensory and instrumental evaluation of catnip (Nepeta cataria L.) aroma. J. Agric. Food Chem. 2003, 51, 3840–3848. [Google Scholar] [CrossRef] [PubMed]
  17. Flavor-Base, 10th ed.; Computer Software; Leffingwell & Associates: Canton, GA, USA, 2010.
  18. Guldenpfennig, R.; Hsu, C.; Fries-Craft, K.; Garber, A.; Huang, X.; Wieneke, M.; Rutledge, K. Evaluation of a Natural Olive Extract as a Flavor Component in Dry and Wet Dog Foods. Preprints 2025, 2025011532. [Google Scholar] [CrossRef]
  19. Karkoula, E.; Skantsari, A.; Melliou, E.; Magiatis, P. Direct Measurement of Oleocanthal and Oleacein Levels in Olive Oil by Quantitative 1H NMR. Establishment of a New Index for the Characterization of Extra Virgin Olive Oils. J. Agric. Food Chem. 2012, 60, 11696–11703. [Google Scholar] [CrossRef] [PubMed]
  20. Ríos, J.J.; Gil, M.J.; Gutiérrez-Rosales, F. Solid-phase extraction gas chromatography-ion trap-mass spectrometry qualitative method for evaluation of phenolic compounds in virgin olive oil and structural confirmation of oleuropein and ligstroside aglycons and their oxidation products. J. Chromatogr. A 2005, 1093, 167–176. [Google Scholar] [CrossRef] [PubMed]
  21. Pekel, A.Y.; Mulazimoglu, S.B.; Acar, N. Taste preferences and diet palatability in cats. J. Appl. Anim. Res. 2020, 48, 281–292. [Google Scholar] [CrossRef]
Figure 1. Average daily consumption of rations with liquid palatant application. Daily consumption of kibble offered to cats. Rations included control and OE-spiked liquid palatant prototypes (day 1–2: 15 ppm, day 3–4: 30 ppm, day 5–6: 50 ppm, day 7–8: 75 ppm, day 9–10: 150 ppm) coated at 1.5% onto Diamond® Maintenance Cat kibbles. In total, 110 g of each ration (220 g total) was offered each day of testing. Data represent the mean grams consumed (n = 20 cats) ± standard deviation.
Pets 02 00013 g001
Figure 2. Liquid application to dry cat food palatability. Average intake ratio (IR) of PhenoFarm™ Olive Extract (OE) on Diamond® Maintenance Cat kibbles from 1.5% application of OE-spiked liquid prototypes compared to control without OE. Data represent the mean IR (n = 20 cats) ± standard deviation.
Pets 02 00013 g002
Figure 3. Day-to-day palatability comparison of liquid application to oe on dry cat food. Average intake ratio (IR) of PhenoFarm™ Olive Extract (OE) on Diamond® Maintenance Cat kibbles from 1.5% application of OE-spiked liquid prototypes over 2 days of testing. Data represent the mean IR (n = 20 cats) ± standard deviation.
Pets 02 00013 g003
Figure 4. OE attraction from liquid application to dry cat food. First approach (FA) and first choice (FC) of PhenoFarm™ Olive Extract (OE) on Diamond® Maintenance Cat from 1.5% application of OE-spiked liquid prototypes over 2 days of testing. Bars represent the percentage of cats (n = 20) wherein the OE-containing ration was FA or FC on days 1 or 2. Shapes represent the two-day average FA or FC for each OE ration.
Pets 02 00013 g004
Figure 5. Average daily consumption of rations with dry palatant application. Daily consumption of kibble offered to cats. Rations included control and OE-spiked dry prototypes (day 1–2: 50 ppm, day 3–4: 100 ppm, day 5–6: 200 ppm, day 7–8: 400 ppm, day 9–10: 600 ppm) coated at 2% onto Sunshine® Mills, Inc. Evolve® Chicken & Rice. In total, 110 g of each ration (220 g total) was offered each day of testing. Data represent the mean grams consumed (n = 20 cats) ± standard deviation.
Pets 02 00013 g005
Figure 6. OE palatability from dry application to dry cat food. Average intake ratio of PhenoFarm™ Olive Extract (OE) on Sunshine® Mills, Inc. Evolve® Chicken & Rice from 2% application of dry prototypes blended with increasing levels of OE plated silica compared to dry control without OE. Data represent the mean IR (n = 20 cats) ± standard deviation. An asterisk (*) denotes preference (p < 0.05; H0 = 0.50 when analyzed by two-tailed t-test).
Pets 02 00013 g006
Figure 7. Day-to-day palatability comparison of dry application to OE on dry cat food. Average intake ratio of PhenoFarm™ Olive Extract (OE) on Sunshine® Mills, Inc. Evolve® Chicken & Rice from 2% application of dry prototypes blended with increasing levels of OE plated silica. Error bars represent standard deviation of the mean.
Pets 02 00013 g007
Figure 8. OE attraction from dry application to dry cat food. First choice (FC) and first approach (FA) of PhenoFarm™ Olive Extract (OE) on Sunshine® Mills, Inc. Evolve® Chicken & Rice from 2% application of dry prototypes blended with increasing levels of OE plated silica over 2 days of testing. Bars represent the percentage of cats (n = 20) wherein the OE-containing ration was FA or FC on days 1 or 2. Shapes represent the two-day average FA or FC for each OE ration.
Pets 02 00013 g008
Table 1. Prototype liquid palatant formulations containing olive extract.
Ingredient, %PT015-LQPT030-LQPT050-LQPT075-LQPT150-LQ
C40-1099.9099.8099.6799.5099.00
Olive extract0.100.200.330.501.00
Table 2. Prototype dry palatant formulations containing olive extract.
Ingredient, %PT050-DBPT100-DBPT200-DBPT400-DBPT600-DB
Corn starch24.524.023.021.019.0
Plated olive extract (1:1)0.51.02.04.06.0
C15-20 other ingredients75.075.075.075.075.0
Table 3. Volatile compounds detected in PhenoFarm™ Olive Extract by HS-SPME GC-QTOF.
CompoundRI (DB5)Odor DescriptorsOlive Product Detected in
Furfural836sweet, woody, almondOil
Benzaldehyde965bitter almond, cherryLeaf, Oil, Fruit, Pomace
Phenol982phenolic, plasticPomace
Limonene1033citrus, herbal, terpeneOil, Fruit, Pomace
linalool oxide1077floral, herbal, earthyLeaf
4-methylbenzaldehyde1074fruity, cherry, phenolicOil, Fruit
methyl benzoate1099phenolic, wintergreenFruit
Linalool1100citrus, floral, sweetOil, Fruit
rose oxide1114green, red rose, fresh-
phenylethyl alcohol1119floral, roseOil, Pomace
methyl octanoate1123waxy, green, orangeFruit
ethyl benzoate1153floral, fruityFruit, Pomace
4-acetyl-1,4-dimethyl-1-cyclohexene1158fruity-
ethyl octanoate1194fruity, wine, waxyFruit, Pomace
methyl salicylate1202wintergreen, mintLeaf
alpha-terpineol1197pine, terpene, lilacLeaf
beta-cyclocitral1230tropical, saffron, herbalLeaf
2-acetyl-4-methylthiophene1233nutty, potato-
alpha-ionene1262mild, woodyLeaf
2-phenylethyl acetate1263floral, rose, honeyOil
4-ethylguaiacol1284spicy, smoky, baconPomace
Theaspirane1307tea, herbal, greenLeaf
beta-damascenone1393sweet, fruity, roseLeaf
dihydro-alpha-ionone1413woody, floral, berry-
beta-damascone1424fruity, floralLeaf
dihydrodehydro-beta-ionone1429floralLeaf
methyl dodecanoate1520waxy, soapy, creamy-
Disclaimer/Publisher’s Note: The statements, opinions and data contained in all publications are solely those of the individual author(s) and contributor(s) and not of MDPI and/or the editor(s). MDPI and/or the editor(s) disclaim responsibility for any injury to people or property resulting from any ideas, methods, instructions or products referred to in the content.

