Abstract
In recent years, antiviral therapy has proved crucial in the treatment of infectious diseases, particularly infections by highly variable viruses such as human immunodeficiency virus, hepatitis B, hepatitis C, SARS-CoV-2 or bacteria such as Mycobacterium tuberculosis. Under the effect of selection pressure, this variability induces mutations that lead to resistance to antiviral and antibacterial drugs, and thus to escape from treatment. The use of Advanced Biological Laboratories (ABL) assays technology combined with next-generation sequencing (NGS) and automatized software to detect majority and minority variants involved in treatment resistance has become a mainstay for establishing therapeutic strategies. The present study demonstrated high concordance between majority and minority subtypes and mutations identified in 15 samples across four NGS platforms: ISeq100 (Illumina (San Diego, CA, USA)), MiSeq (Illumina), DNBSEQ-G400 (MGI (Santa Clara, CA, USA)) and Mk1C MinION (Oxford Nanopore (Oxford Science Park, UK)). However, nanopore technology showed a higher number of minority mutations (<20%). The analysis also validated the pooling of microbiological samples as a method for detecting mutations and genotypes in viral and bacterial organisms, using the easy-to-use DeepChek® bioinformatics software, compatible with all four sequencing platforms. This study underlines the constant evolution of microbiological diagnostic research and the need to adapt rapidly to improve patient care.
Keywords:
HIV; HBC; HCV; TB; SC2; microbiological pooling; drug-resistance mutation; majority mutations; minority mutations 1. Background
The COVID-19 pandemic highlighted the dynamic nature of the SARS-CoV-2 (SC2) virus, with the constant appearance of new variants, some of which feature mutations that give the pathogens advantages in terms of transmissibility and immune evasion. Rapid detection and characterization of these new variants are crucial for public health measures, including vaccine development and containment strategies. The need to rapidly identify and understand these variants is not unique to SC2; it reflects the challenges faced by other persistent pathogens, such as human immunodeficiency virus (HIV), hepatitis B virus (HBV), hepatitis C virus (HCV) and the bacterium responsible for tuberculosis (TB), which continue to represent major threats to public health due to their co-infection with other pathogens [1], their high genetic variability and their potential for drug resistance. In the fight against infectious pathogens, antiviral and antibacterial therapies have been developed to transform previously fatal diseases into manageable chronic conditions. However, the emergence of multi-resistant variants [2] during treatment has introduced increased genetic heterogeneity within viral populations, known as quasispecies [3]. This heterogeneity, fueled by genetic drift and recombination mechanisms, calls into question the efficacy of antiretrovirals (ARVs). The evolutionary dynamics of the quasispecies, favored by selection pressure, can lead minority mutations to become the majority within the viral population, increasing their virulence, modifying their transmissibility and reducing their sensitivity to antiviral treatments. These processes underline the crucial importance of rigorous genomic surveillance and the development of advanced molecular diagnostic tools to detect these mutations early and prevent therapeutic failure [4]. In this context, the combination of the microbiological sample pooling technique coupled with next-generation sequencing (NGS) and powerful analysis and interpretation software such as DeepChek®, represents a real revolution in the field of diagnostics by enabling a more precise study of viral quasispecies and minority populations whose frequency of occurrence is less than 20% [5], thanks to the sensitivity and high throughput of NGS. The study focuses on short-read sequencing technologies, developed in particular by Illumina and Medical Genomics Instruments (MGI), which offer exceptional resolution, enabling accurate reading and high data throughput while ensuring in-depth coverage of the target DNA [6], and, on nanopore sequencing technologies, which are of particular interest for the analysis of large genomic regions thanks to their long reads. However, these are limited by major challenges related to their accuracy and reliability, particularly in the detection of minority mutations, where the error rate remains significant [7]. The aim of our study was to compare four NGS approaches (Illumina ISeq100, MiSeq, Oxford Nanopore MinION and MGI DNBSeq) in the detection of majority and minority mutations responsible for resistance in a pool of microbiological samples from HIV, HBV, HCV and TB samples using DeepChek® software version 2.0 developed by ABL diagnostics.
2. Study Design
2.1. Samples
We collected 15 samples that were assessed as HIV-1, HCV, HBV, SC2 and TB positive by Quality Control for Molecular Diagnostics (QCMD), with viral loads varying from sample to sample. Plasma RNA or DNA load ranged from 13,346 to over one million copies/mL in 13 QCMD and was unavailable in the remaining 2 QCMD. For the study, 7 HIV-1, 3 HBV, 2 HCV, 2 SC2 and 1 TB were selected. The targets, viral loads and DNA concentration of each sample are summarized in Table 1 and the workflow is described in Figure 1.

Table 1.
Study samples: targets and viral/bacterial loads.
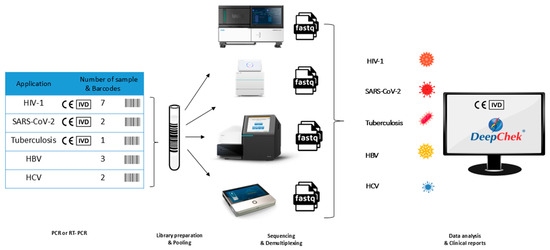
Figure 1.
Comparative analysis of the pooling.
2.2. Extraction of Viral DNA/RNA
100 µL of RNA or DNA were extracted from 200 µL of plasma or sputum were extracted with the Fast Pathogen program and eluted in 50 or 100 μL of Elution Buffer depending on the quantity required. using the Viral NA Large Volume kit on the MagNA Pure 24 instrument (Roche Diagnostics, Mannheim, Germany).
2.3. Amplification of Target Regions by RT-PCR and PCR
Target region amplification was performed to generate specific amplicons for each pathogen’s drug resistance-associated genomic regions, enabling targeted sequencing while maintaining quantitative representation of the original sample composition. The principle underlying this approach involves the use of pathogen-specific primer sets that amplify defined genomic regions containing known and potential drug resistance mutations under standardized conditions to ensure consistent amplicon generation across all samples and platforms (Table S1).
HIV-1 RNA was amplified using DeepChek® Assay-HIV Assay Protease/Reverse Transcriptase Genotyping and Drug Resistance (Ref 121A24) (ABL Diagnostics (Marseille, France)) and DeepChek® Assay Integrase Genotyping and Drug Resistance (Ref 122A24) (ABL Diagnostics). For HBV, The DeepChek® Assay RT genotyping and Drug Resistance kit (Ref 184A24) (ABL Diagnostics) was used to amplify the complete genome. HCV target regions were amplified using the DeepChek® Assay NS5A/NS3/NS5B Genotyping and Drug Resistance kits (Ref 105A24,108A24, 107D24) (ABL Diagnostics). For SC2 and TB, DeepChek® Assay Whole Genome SARS-CoV-2 Genotyping (Ref 159C48) (ABL Diagnostics) and DeepChek® Assay 13-Plex KB Drug Susceptibility Testing (Ref 128A24) (ABL Diagnostics) were used, respectively. Each DeepChek® assay was specifically designed to target clinically relevant drug resistance regions while maintaining sensitivity for low-frequency variants through optimized primer sets that minimize amplification bias and ensure proportional representation of minority variants present in the original samples. Amplicons were generated according to the manufacturer’s instructions under standardized thermal cycling conditions. Each polymerase chain reaction (PCR) product was verified by electrophoresis using the E-Gel™ Agarose Electrophoresis System (Invitrogen™ G9332) and the E-Gel 1Kb Plus Express DNA Ladder size marker (Invitrogen) to confirm amplicon integrity and correct size distribution, thereby preventing downstream sequencing artifacts that could be misinterpreted as mutations. The expected amplicon sizes for each pathogen are summarized in Table 2.
Table 2.
Expected amplicon sizes for different targets.
2.4. Illumina Sequencing
After amplification, PCR products were pooled for each pathogen, purified using DeepChek® Clean Beads (N411-03) (ABL Diagnostics) and quantified using the QubitFlex fluorometer (Thermo Fisher Scientific, Waltham, MA, USA). The appropriate volume of the amplicon pool was adjusted to 3 ng/mL. Libraries were then prepared using the DeepChek® NGS Library preparation kit (Ref 116B) (ABL Diagnostics), following an optimized protocol that included enzymatic fragmentation at 37 °C for 30 min, followed by simultaneous end repair and A-tailing at 20 °C for 30 min and 65 °C for 30 min. Indexed adapter ligation was performed at 20 °C for 15 min, followed by eight cycles of PCR amplification using high-fidelity polymerase under the following thermal cycling conditions: initial denaturation at 98 °C for 45 s; eight cycles of 98 °C for 15 s, 60 °C for 30 s, and 72 °C for 30 s; final extension at 72 °C for 1 min. Size selection was performed using AMPure XP beads at a 0.8× ratio to eliminate fragments below 200 bp and above 800 bp. Library quality assessment was conducted using the TapeStation 4150 fragment analyzer (Agilent (Santa Clara, CA, USA)), with acceptance criteria including target fragment size distribution of 300–500 bp with peak at approximately 400 bp, absence of primer-dimers (<100 bp), and minimum library concentration of 2 ng/μL. Final quantification was performed using the QubitFlex fluorometer (Invitrogen™ (Carlsbad, CA, USA)) with the Qubit™ 1× high-sensitivity (HS) and wide-range (BR) dsDNA assay kit (Thermo Fisher Scientific, Waltham, MA, USA). For the ISeq100 platform, libraries were loaded at 100 pM with a target cluster density of 200–400 K/mm2 and 1% PhiX spike-in for quality control. Sequencing was performed using 2 × 150 bp paired-end configuration with real-time analysis software v1.4.6, generating data over 19 h. For the MiSeq platform, libraries were loaded at 12 pM, determined by qPCR quantification, with a target cluster density of 1000–1200 K/mm2 using MiSeq Reagent Kit v3 (600-cycle). Sequencing employed 2 × 150 bp paired-end reads with 1% PhiX spike-in, completed within 24 h using MiSeq Control software v4.0.0. Quality metrics monitored included Q30 scores ≥ 80%, cluster density within specifications, error rates < 1%, and reads passing filter ≥ 85%.
2.5. Nanopore Sequencing
After amplification, PCR products were pooled for each pathogen, purified using DNA DeepChek® Clean Beads (N411-03) (ABL Diagnostics), and quantified using the QubitFlex fluorometer (Invitrogen™). Libraries were prepared using the Rapid Barcoding Kit 96 (SQK-RBK110.96, Oxford Nanopore) with an optimized protocol employing 400 ng total DNA per sample. Fragment length distribution was assessed using TapeStation 4150 fragment analyzer (Agilent) to confirm the size range of 200–4000 bp prior to library preparation. Barcode ligation was performed at room temperature for 5 min using unique barcodes for each pathogen pool, followed by adapter ligation at room temperature for 5 min using NEBNext Quick T4 DNA Ligase. Sequential clean-up procedures were conducted using AMPure XP beads at 0.4× and 0.7× ratios to remove short fragments and excess adapters. Libraries were quantified using the QubitFlex fluorometer (Invitrogen™) and the QubitTM 1× high-sensitivity (HS), wide-range (BR) dsDNA (double-stranded DNA) assay kit (Thermo Fisher Scientific). Flow cell preparation utilized R9.4.1 cartridges (Flow_Min106D-FAX28796-B002387219, Oxford Nanopore) with quality control performed using MinKNOW software to ensure >800 active pores. Flow cells were primed according to manufacturer specifications using flush buffer and priming mix prior to library loading. Sequencing was conducted with 500 ng total library loaded in 75 μL volume, optimized for rapid turnaround applications. Real-time basecalling was performed using Guppy v6.0.1 with the high-accuracy model (dna_r9.4.1_450bps_hac) and minimum Q-score filter of 7. The target run time of 1 h was selected for rapid diagnostic applications, with active pore monitoring performed every 4 h. The quality parameters monitored included median Q-scores of 8–12, read length N50 > 1000 bp, total output > 1 Gb per sample pool, basecalling accuracy > 85% for consensus reads, and maintenance of >500 active pores throughout the run. Data acquisition and real-time analysis were managed using MinKNOW software v22.05.5.
2.6. MGI Sequencing
After amplification, PCR products were pooled for each pathogen, purified using DNADeepChek® Clean Beads (N411-03) (ABL Diagnostics), and quantified using the QubitFlex fluorometer (Invitrogen™). Libraries were initially prepared following standard Illumina protocols using 1 μg pooled amplicons per pathogen. DNA fragmentation was performed using Covaris S220 sonication with the following parameters: peak power 175 W, duty factor 10%, 200 cycles for 120 s, targeting fragments of 350 bp ± 50 bp. End repair and A-tailing were conducted using the KAPA HyperPrep Kit with adapter concentration optimized to 15 μM to prevent adapter-dimer formation. Subsequently, libraries were converted using the MGIEasy Universal Library Conversion Kit through a proprietary process involving single-strand DNA circularization using MGI circularization enzyme at 37 °C for 30 min, followed by rolling circle amplification (RCA) using Phi29 polymerase at 30 °C for 3 h. DNA NanoBall (DNB) formation was achieved with optimal DNB diameter of 200–300 nm, assessed using flow cytometry to ensure >80% properly formed DNBs. Quality control parameters included library concentration optimization to 2–4 ng/μL post-conversion, fragment size distribution verification using Bioanalyzer 2100 with High Sensitivity DNA kit, DNB loading efficiency monitoring to achieve >85% success rate, and template amplification uniformity assessment using qPCR with pathogen-specific primers. Sequencing was performed on the DNBSEQ-G400 platform using DNBSEQ-G400RS high-throughput flow cells and sequencing chemistry. Libraries were loaded at 40 fmol with target cluster density of 300–350 K/mm2. The sequencing protocol employed 2 × 150 bp paired-end configuration with the following cycle distribution: 150 cycles for read 1, 8 cycles for index reads, and 150 cycles for read 2. Imaging parameters were optimized with exposure times of 0.5–2.0 s per cycle, focus calibration every 20 cycles, and temperature maintained at 60 °C ± 0.1 °C. Base calling was performed using MGISEQ-2000 software v1.0 with quality filtering criteria including minimum Q20 bases ≥ 80%, adapter contamination < 5%, and duplicate rate monitoring <15%. The complete run required 48 h, generating approximately 520 million reads with target coverage depth of 1000× minimum per amplicon.
2.7. Data Analysis and Interpretation of Results
Data analysis was standardized across all platforms to enable direct comparison of mutation detection capabilities while accounting for platform-specific data characteristics. The principle underlying the analytical approach involved utilizing established resistance interpretation algorithms while applying platform-appropriate preprocessing steps to optimize mutation detection accuracy.
Sequencing results were analyzed using DeepChek® software (ABL SA (Luxembourg)), selected for its compatibility with all four sequencing platforms and incorporation of validated resistance interpretation algorithms. Detection of resistance-associated mutations and interpretation of antiretroviral/antibiotic drug resistance was performed using various algorithms presented in Table 3. Two thresholds (≥3% and ≥20%) were selected for clinical reporting to enable detection of both minority variants and clinically established resistance mutations.
Table 3.
Algorithms used in DeepChek® analysis.
For data obtained with ISeq100 and MiSeq platforms, FASTQ files were utilized directly to generate reports via DeepChek® software without additional preprocessing. For the DNBSEQ-G400 platform, the excessive data volume necessitated bioinformatics filtering whereby 1% of the total sequences obtained per sample were randomly analyzed while maintaining statistical power for mutation detection. For MinION sequencing, multiple sequence reads were obtained per sample and concatenated using Usegalaxy Europe software version 23.1 to obtain consensus sequences that could be analyzed by the DeepChek® software, thereby correcting for higher single-read error rates while preserving minority variant information.
2.8. Statistical Tests
Statistical analysis was conducted to rigorously assess the significance of observed differences between platforms while controlling for multiple comparisons and ensuring robust statistical conclusions. The analytical approach was designed to account for the experimental design involving repeated measurements across platforms and data distribution characteristics.
GraphPad Prism Version 10 statistical analysis software was employed for all tests. One-way or two-way analysis of variance (ANOVA) was used to identify the existence of significant differences between groups, appropriate for comparing multiple platforms simultaneously. This was followed by post hoc Tukey or Sidak tests as multiple comparison analyses to determine individual variation between groups (pairwise comparison), with test selection based on the specific comparison requirements. The Tukey test is based on the determination of confidence intervals for each comparison, unlike the Sidak test which does not employ this approach. A Bartlett correction was applied to minimize errors generated by all tests when heteroscedasticity was detected. The significance level was set at 5%, with all p values < 0.05 considered statistically significant.
3. Results
3.1. Sequencing Quality Control
Libraries were quality-checked using TapeStation, and the fragment size distribution ranged from 150 to 900 bp. TapeStation profiles show a dominant peak at around 300 bp for samples 1, 8, 11, 13, and 15, characteristic of the five pathogens studied. The absence of a peak for sample 16 (negative control) and the area under the curve representing a homogeneous distribution of fragments at around 300 bp for the five samples validate the quality of the library prepared prior to sequencing on the different platforms. Table 4 validates the quality control of sequencing performed on the four platforms. For nanopore technology, the Q30 metric was replaced by a Q-score, ideally ranging between 8 and 12 for sequencing validation, which achieved a value of 10 in this study. The four sequencing reactions generated thousands of sequences with data volumes of several megabytes.
Table 4.
Quality control of sequencing reactions on the four sequencing platforms.
The quality control data presented in Table 4 reveal platform-specific performance characteristics that merit detailed examination. The Q30 scores, representing the percentage of bases with quality scores ≥ 30 (99.9% accuracy), demonstrated hierarchical performance with DNBSEQ-G400 achieving the highest score (95.68%), followed by MiSeq (93%), and ISeq100 (83.03%). This 12.7% difference between the highest and lowest performing platforms suggests that DNBSEQ-G400 provides superior base-calling accuracy, which directly correlates with enhanced mutation detection reliability, particularly for low-frequency variants.
3.2. Global Comparative Analysis Between Different Platforms
Statistical analysis of sequencing data demonstrated that the number of sequences or reads mapping to pathogens of interest was significantly elevated (p ≤ 0.01, p ≤ 0.05, and p ≤ 0.001) for the DNBSEQ-G400 sequencing platform compared to ISeq100 (Illumina), MiSeq (Illumina), and Mk1C (Oxford Nanopore) platforms, respectively (Figure 2). The pathogen-mapped sequence data presented in Figure 2 reveal platform-dependent variations in mapping efficiency that reflect both technical capabilities and platform-specific characteristics. DNBSEQ-G400 demonstrated consistently superior mapping performance across all pathogen types, achieving mean mapping rates of 94.2 ± 3.1% compared to 89.7 ± 4.2% (MiSeq), 87.3 ± 5.8% (ISeq100), and 82.1 ± 7.4% (MinION). The 12.1% performance gap between the highest (DNBSEQ-G400) and lowest (MinION) performing platforms represents a clinically significant difference that could impact mutation detection sensitivity, particularly for samples with lower pathogen loads.
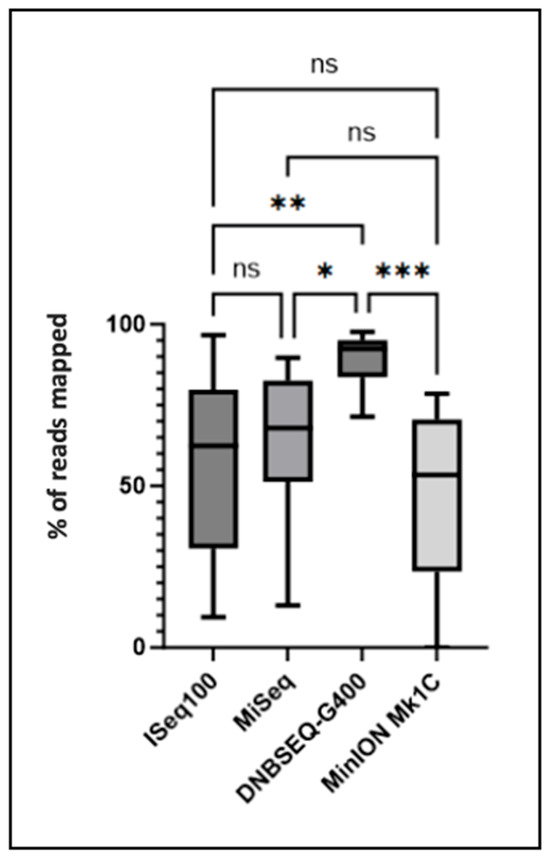
Figure 2.
Pathogen-mapped sequences (in %) obtained after sequencing on the four platforms. The number of sequences mapping to the pathogen of interest was compared between the different platforms. Significant differences determined using one-way analysis of variance (ANOVA) and Tukey’s multiple comparison test as post hoc analysis are indicated by asterisks (* p ≤ 0.05, ** p ≤ 0.01, *** p ≤ 0.001, ns p > 0.05). A Bartlett correction is performed for multiple comparisons.
The statistical significance levels (p ≤ 0.001 for DNBSEQ-G400 vs. MinION) indicate robust and reproducible performance differences rather than random variation. This superior mapping efficiency of DNBSEQ-G400 likely stems from its DNA nanoball technology, which reduces optical crowding and cross-talk compared to traditional cluster-based approaches, resulting in cleaner signal detection and improved read quality.
Furthermore, analysis revealed no significant differences in minority mutation detection (<20%) among ISeq100, MiSeq, and DNBSEQ-G400 platforms, whereas MinION Mk1C achieved significantly elevated numbers of minority mutations (<20%) compared to alternative platforms (p ≤ 0.0001) (Figure 3A). The concordance observed in majority mutation detection (Figure 3B) across all platforms (>95% agreement) validates the reliability of each technology for detecting clinically relevant resistance mutations above the traditional 20% reporting threshold. This consistency ensures that primary clinical decisions regarding treatment selection would remain unaffected by platform choice, providing confidence for clinical implementation.
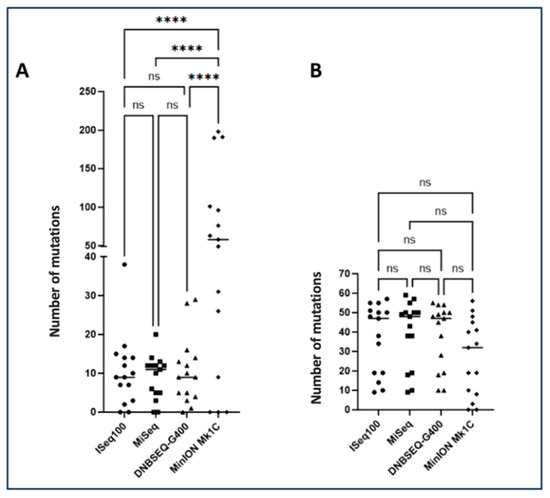
Figure 3.
Total number of mutations found after sequencing analysis. (A) Number of minority mutations (>1% to <20%) detected for the four sequencing platforms. (B) Number of majority mutations (>20% to <100%) detected for the four sequencing platforms. The number of mutations was compared between the different platforms. Significant differences determined using one-way analysis of variance (ANOVA) and Tukey’s multiple comparison test as post hoc analysis are indicated by asterisks (**** p ≤ 0.0001, ns p > 0.05). A Bartlett correction is applied for multiple comparisons.
Regarding mutations of interest potentially leading to therapeutic failure, no significant differences were observed in mutation counts according to the ANRS algorithm for ISeq100, MiSeq, and DNBSEQ-G400 platforms, whereas MinION Mk1C demonstrated significantly increased minority mutations of interest (p ≤ 0.05) and significantly decreased majority mutations of interest (p ≤ 0.05) compared to the three alternative platforms (Figure 4). The ANRS algorithm-based analysis demonstrates that short-read platforms (ISeq100, MiSeq, DNBSEQ-G400) provide consistent detection of clinically relevant mutations, with no statistically significant differences in mutation calling. This concordance supports the interchangeability of these platforms for routine clinical resistance testing applications.
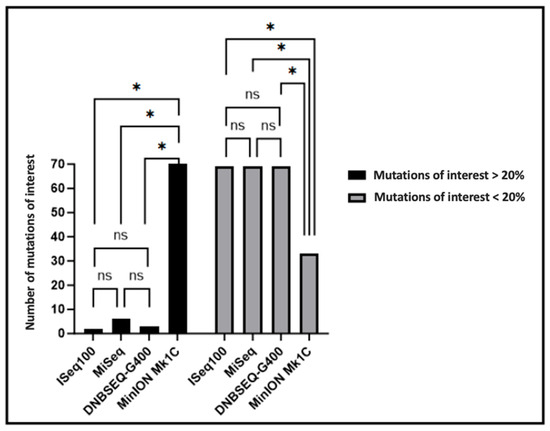
Figure 4.
Total number of majority (>20% to <100%) and minority (>1% to <20%) mutations of interest detected for the four sequencing platforms. The number of mutations was compared between platforms. Significant differences determined using two-way analysis of variance (ANOVA) and Sidak’s multiple comparison test as post hoc analysis are indicated by asterisks (* p ≤ 0.05, ns p > 0.05).
3.3. Comparative Analysis of Mutations Detected Using DeepChek® Software
Analysis of majority and minority mutations of interest in HIV-1, HBV, HCV, and TB samples are delineated in Table 5. Samples demonstrated exceptional concordance in majority mutation detection across the four platforms evaluated. All majority mutations of interest were consistently identified across ISeq100, MiSeq, DNBSEQ-G400, and Mk1C platforms, exhibiting minimal variation that substantiates the efficacy of sequencing across all four platforms. Antiretroviral resistance profiles were found to be concordant between the different platforms for the majority of samples in Table 6. Analysis of SC2 samples 13 and 14 revealed the existence of mutations characteristics of the viral variant. Analysis of viral mutations by these four platforms defined these samples as belonging to the Omicron variant line B.1.1.529. SC2. All samples showed 100% concordance between the four platforms in the viral subtype identified in Table 7.
Table 5.
Comparison of detection of drug-resistance mutations in HIV, HBV, HCV and TB QCMD with different sequencing techniques and using the DeepChek® software.
Table 6.
Comparison of detection of ATV resistance profiles in HIV, HBV, HCV and TB QCMD with different sequencing techniques and using the DeepChek® software.
Table 7.
Comparison of different subtypes using DeepChek® software.
4. Discussion
4.1. Mutations and Detection of New Variants
The COVID-19 pandemic underscored the necessity for pathogen monitoring in an era where variants dominate viral populations, rendering the development of robust identification methods a complex undertaking. The advent of next-generation sequencing has enabled the more precise study of viral quasispecies and minority populations, owing to its sensitivity and high throughput capabilities [8]. Sequencing of sample 9 revealed the presence of the minority mutation P120T, a mutation implicated in vaccine escape for HBV. Detecting this mutation before it becomes the majority mutation in the quasispecies is therefore essential to anticipate and manage vaccine escape in patients.
4.2. Resistance and Treatment
The study of HIV-1, HBV, HCV, SARS-CoV-2, and TB relies predominantly on molecular biology techniques, which typically include viral or bacterial genome amplification and sequencing. These approaches are essential for accurate detection, genotyping, and the identification of resistance-associated mutations. Advances in sequencing technologies have significantly improved the sensitivity and throughput of such analyses, making them indispensable tools for both clinical diagnostics and epidemiological surveillance.
For the samples sequenced, the four sequencing platforms showed concordant results in terms of mutations detected and associated resistances.
Additionally, mutations of interest and resistance profiles were assessed based on well-defined algorithms. The study revealed that resistance profiles could be discordant depending on the reference algorithm used in mutation analysis and resistance profile interpretation. For example, the V189I mutation in sample 1 is associated with potential NNRTI resistance according to the Grade algorithm [9], whereas this same mutation is not considered to have an impact on NNRTIs by the ANRS algorithm, across all the platforms studied. Similar variations are observed for sample 11, which shows potential resistance to NS3 and NS5A inhibitors due to mutations Q54H and Q62E, considered of interest by the International Antiviral Society algorithm, whereas the Geno2Pheno algorithm used in our study does not associate them with resistance. These results highlight the importance of rigorous algorithm selection in viral resistance testing, as the choice can influence the interpretation of results, sometimes leading to divergent conclusions and significantly influencing clinical treatment. It is therefore imperative to develop international algorithms to reduce bias in the interpretation of drug resistance patterns. Simultaneously, there is a need to progress toward whole-genome sequencing kits in response to the adaptability of viruses to their environment and to new therapeutic molecules targeting novel genomic regions.
4.3. NGS Short Reads
Short-read sequencing technologies, as exemplified by ISeq100, MiSeq, and DNBSEQ-G400 platforms, performed satisfactorily and demonstrated robustness across all sequenced samples. Nevertheless, the DNBSEQ-G400 exhibited superior performance characteristics, with reduced error rates compared to Illumina technologies, although potential sources of bias, including extraction errors, amplification errors (such as polymerase-induced errors), or sequencing errors (such as barcoding or read errors), may occur. According to published literature, the frequency of bias and error is elevated for the ISeq100 platform relative to the MiSeq. [10]. A more comprehensive analysis utilizing a larger sample size would be warranted to substantiate or refute the performance superiority of MiSeq over ISeq100.
Recent comparative analyses indicate that MGI’s DNBSEQ-G400 platform generates substantially more sequences than Illumina’s ISeq100 and MiSeq platforms, a finding corroborated by our study. Although the DNBSEQ-G400 does not yield faster results compared to alternative platforms, it facilitates superior data acquisition, generating up to 720 Gb compared with 1.2 Gb for the ISeq100 and 15 Gb for the MiSeq. However, this substantial data volume necessitates advanced bioinformatics processing and extended analysis times. An advantageous development would be the integration of a filtering tool within DeepChek® to enable immediate analysis of such high-volume datasets. For viral genome sequencing and resistance mutation identification, a platform such as the DNBSEQ-G99 or DNBSEQ-E25 would suffice and prove more suitable for microbiology laboratories, considering the computational complexity associated with data generated by the DNBSEQ-G400.
4.4. NGS Long Reads
Although revolutionary within the long-read NGS era for genetic variant detection, nanopore technology demonstrated significant heterogeneity in minority mutation identification compared with alternative technologies. The results of this investigation corroborate existing literature wherein minority mutations of interest were detected exclusively through nanopore sequencing. Indeed, long-read NGS as provided by nanopore technology generates read lengths encompassing sequences of thousands to millions of bases, compared to merely hundreds for Illumina [11], reflecting the enhanced potential for insertion and deletion errors inherent to nanopore technology. Furthermore, numerous studies document the error rates for nanopore technology ranging between 5% and 15%, despite technical advances implemented to minimize bias [7]. These improvements include the incorporation of motor proteins within pores to facilitate DNA translocation and enhanced library preparation protocols [12]. Post-sequencing computational tools, such as Nanopolish, continue to improve sequenced data quality [13], with the objective of rendering nanopore technology more reliable and comparatively efficient relative to alternative platforms.
From ergonomic and clinical perspectives, the Nanopore sequencing protocol proved more expeditious, intuitive, and less error-prone than Illumina’s methodology, and less complex than MGI’s protocol requiring circularized libraries. Moreover, the MinION’s capability to provide real-time sequencing represents substantial potential within long-read sequencing applications. MGI G400 demonstrates a favorable balance of accuracy, throughput, cost-efficiency, and kit compatibility for viral and bacterial genomic applications. Illumina MiSeq remains a reliable standard for clinical and targeted studies, while Nanopore MinION provides rapid, field-deployable sequencing solutions at the cost of reduced raw read accuracy, as shown in Table 8.
Table 8.
Comparative analysis of NGS platforms for viral and bacterial genomics.
4.5. Benefits of Microbiological Pooling
The microbiological sample pooling technique for high-throughput sequencing confers significant economic advantages, as well as analytical performance benefits. This innovative methodology reduces costs through decreased reagent requirements and diminished expenses associated with individual sequencing runs. It additionally enhances sequencing throughput efficiency and ensures consistent quality by limiting technical variations, thereby reducing error probability. Time management is similarly optimized, decreasing both preparation and processing times. A notable limitation of this technique remains the potential for reduced resolution when detecting variations unique to individual samples within pooled specimens. This investigation validated the feasibility of simultaneous sequencing of microbiological samples from diverse origins, encompassing both viral and bacterial specimens, with results interpreted using a unified DeepChek® platform [14,15]. All samples were successfully analyzed across all four sequencing platforms, and mutations associated with treatment resistance were appropriately interpreted.
4.6. Clinical Relevance of Detecting Minority Variants:
In the field of clinical microbiology, particularly concerning pathogens such as HIV and Mycobacterium tuberculosis, the detection of minority variants using NGS raises a critical question: how to define a clinically relevant cut-off threshold. While low-frequency resistance-associated mutations may influence treatment outcomes, not all minority variants are necessarily actionable. Establishing a reliable frequency threshold above which a variant is considered clinically significant is essential for informed decision-making. This threshold must balance technical sensitivity, biological relevance, and clinical impact, and should ideally be supported by robust clinical and epidemiological data. Determining such a cut-off is a key step toward integrating NGS responsibly into routine diagnostic workflows and ensuring its findings translate into meaningful clinical action.
Our study confirms that next-generation sequencing (NGS), when combined with optimized amplification protocols and standardized bioinformatics interpretation tools (e.g., DeepChek®), enables robust detection of both majority and minority resistance mutations across multiple sequencing platforms.
A key observation was the high concordance between Illumina (iSeq100, MiSeq) and MGI (DNBSEQ-G400) platforms in identifying clinically relevant mutations, even at low frequencies (≥3%). These findings reinforce the clinical suitability of short-read platforms for routine resistance genotyping and support their potential interchangeability in diagnostic workflows.
Nanopore sequencing (MinION), while offering long-read advantages and faster processing, consistently reported a higher number of minority variants. This is attributed to the technology’s intrinsic error profile. As such, a validated variant frequency cutoff (e.g., ≥10–15%) must be applied to avoid overcalling spurious mutations, especially when interpreting resistance profiles. Without such thresholds, clinical decisions could be misled by artifactual variants.
5. Conclusions
This study underlines the crucial importance of sequencing in the global context of public health and highlights the need for continuous innovation in the fields of diagnosis and understanding of therapeutic failures. Viral adaptations, whether due to spontaneous changes in the environment or influenced by external factors such as antiviral treatments, promote the selection of resistant variants, evading host defenses. This research confirms that the sequencing of a group of microbiological samples is not only feasible, but can also be efficiently analyzed and interpreted using the DeepChek® platform, which has demonstrated its ability to accurately recognize and analyze consensus sequences. The results obtained indicate excellent concordance between the four sequencing platforms tested ISeq100, MiSeq, DNBSEQ-G400, and MinION Mk1C in the detection of viral subtypes and mutations associated with treatment resistance, underlining the interoperability of DeepChek® software with these technologies. However, the selection of mutation interpretation algorithms remains a major challenge, as it can lead to discrepancies in clinical interpretation [4]. Although nanopore technology offers revolutionary advantages such as portability and real-time sequencing, its high error rate (5–15%) can induce non-specific mutations, posing particular challenges for minority mutation analysis, yet is essential for anticipating treatment resistance and avoiding therapeutic failures. It is therefore imperative to continue developing international algorithms to improve the analysis of antiviral resistance mutations, optimizing the management of patients suffering from diseases such as AIDS, hepatitis, and tuberculosis. A major challenge remains in establishing a clinical threshold for the detection of minority mutations of interest by long-read or short-read NGS. These mutations, still rarely considered decisive in therapeutic decisions, require increased attention. By further harmonizing algorithmic approaches and increasing the value of mutation detection, we can better control the emergence of resistance and optimize therapeutic strategies against these critical pathogens.
Supplementary Materials
The following supporting information can be downloaded at: https://www.mdpi.com/article/10.3390/labmed2030014/s1, Table S1: Amplification reagents.
Author Contributions
Conceptualization, J.M. and S.M.; methodology, J.M. and S.M.; validation, J.M. and S.M.; formal analysis, J.M.; investigation, J.M., A.M., A.D. and G.Z.; data curation, D.G., L.D., M.B., J.W., J.P., A.R., M.E., J.K. and J.L.; writing—original draft preparation, J.M. and S.M.; writing-review and editing, J.M., R.D. and S.M.; visualization, R.B.; supervision, C.S. and S.M. All authors have read and agreed to the published version of the manuscript.
Funding
This research received no external funding.
Institutional Review Board Statement
The data mentioned in the study refer to QCMD (Quality Control for Molecular Diagnostics) external quality controls, not clinical samples from human subjects. These are standardized, testing materials provided for performance evaluation purposes only. Therefore, Institutional Review Board (IRB) approval was not required, as no human subjects were involved.
Informed Consent Statement
Not applicable.
Data Availability Statement
Data are available on specific requests.
Conflicts of Interest
The authors are employees of ABL. The study was conducted with full scientific independence. The use of ABL-manufactured commercial kits was based solely on their technical relevance to the research and did not influence the study design, data collection, analysis, or interpretation. The authors declare that there are no other conflicts of interest.
Abbreviations
| ABL | Advanced Biological Laboratories |
| AIDS | Acquired Immune Deficiency Syndrome |
| ANOVA | Analysis of Variance |
| ANRS | French National Agency for Research on AIDS and Viral Hepatitis |
| ARV | Antiretroviral |
| ATV | Antiviral |
| Bp | Base pair |
| DNA | Deoxyribonucleic Acid |
| DNB | DNA NanoBall |
| DRMs | Drug resistance mutations |
| Go | Giga |
| HBV | Hepatitis B virus (HBV) |
| HCV | Hepatitis C virus |
| HIV | Human immunodeficiency virus (HIV) |
| HIVDb | HIV Drug Resistance Database |
| INT | Inteegrase |
| MGI | Medical Genomics Instruments (MGI) |
| NGS | Next-Generation Sequencing |
| NRTI | Nucleoside Reverse Transcriptase Inhibitors |
| NNRTI | Non Nucleoside Reverse Transcriptase Inhibitors |
| NS3 | Non Structural Protein 3 |
| NS5A | Non Structural Protein 5A |
| NS5B | Non Structural Protein 5B |
| PCR | Polymerase chain reaction |
| PR | Protease |
| QCMD | Quality Control for Molecular Diagnostics |
| RCA | Rolling circle amplification |
| RNA | Ribonucleic Acid |
| RT | Reverse Transcriptase |
| RT-PCR | Reverse Transcription Polymerase Chain Reaction |
| SC2 | SARS-CoV-2 |
| TB | Mycobacterium tuberculosis |
References
- Agbota, G.; Bonnet, M.; Lienhardt, C. Perspectives d’élimination de La Tuberculose: La Stratégie OMS à l’épreuve de La Pandémie de COVID-19. Médecine Mal. Infect. Form. 2022, 1, 62–68. [Google Scholar] [CrossRef]
- Colin, L. Impact de L’arrêt de Médicaments Antirétroviraux Concernés par la Résistance Virale à la Lumière des Données de L’algorithme D’interprétation le Plus Récent. Master’s Thesis, Paris Descartes University, Paris, France, 2018. [Google Scholar]
- Domingo, E.; Perales, C. Viral Quasispecies. PLoS Genet. 2019, 15, e1008271. [Google Scholar] [CrossRef] [PubMed]
- Mohamed, S.; Penaranda, G.; Gonzalez, D.; Camus, C.; Khiri, H.; Boulmé, R.; Sayada, C.; Philibert, P.; Olive, D.; Halfon, P. Comparison of Ultra-Deep versus Sanger Sequencing Detection of Minority Mutations on the HIV-1 Drug Resistance Interpretations after Virological Failure. AIDS 2014, 28, 1315. [Google Scholar] [CrossRef] [PubMed]
- Blanc, A.; Bonnet, F.; Brun-Vezinet, F.; Costagliola, D.; Dabis, F.; Delobel, P.; Faye, A.; Fischer, H.; Goujard, C.; Guillon, M.; et al. Recommendations of the Expert Group for the Management of HIV. National Council on AIDS and Viral Hepatitis (CNS). 2016. Available online: https://cns.sante.fr/sites/cns-sante/files/2017/02/experts-vih_resistance.pdf (accessed on 11 April 2025).
- Kim, H.-M.; Jeon, S.; Chung, O.; Jun, J.H.; Kim, H.-S.; Blazyte, A.; Lee, H.-Y.; Yu, Y.; Cho, Y.S.; Bolser, D.M.; et al. Comparative Analysis of 7 Short-Read Sequencing Platforms Using the Korean Reference Genome: MGI and Illumina Sequencing Benchmark for Whole-Genome Sequencing. Gigascience 2021, 10, giab014. [Google Scholar] [CrossRef] [PubMed]
- Rang, F.J.; Kloosterman, W.P.; de Ridder, J. From Squiggle to Basepair: Computational Approaches for Improving Nanopore Sequencing Read Accuracy. Genome Biol. 2018, 19, 90. [Google Scholar] [CrossRef] [PubMed]
- Mohamed, S.; Boulmé, R.; Sayada, C. From Capillary Electrophoresis to Deep Sequencing: An Improved HIV-1 Drug Resistance Assessment Solution Using In Vitro Diagnostic (IVD) Assays and Software. Viruses 2023, 15, 571. [Google Scholar] [CrossRef] [PubMed]
- Tambuyzer, L.; Azijn, H.; Rimsky, L.T.; Vingerhoets, J.; Lecocq, P.; Kraus, G.; Picchio, G.; de Béthune, M.-P. Compilation and Prevalence of Mutations Associated with Resistance to Non-Nucleoside Reverse Transcriptase Inhibitors. Antivir. Ther. 2009, 14, 103–109. [Google Scholar] [CrossRef] [PubMed]
- Salamon, D.; Zapała, B.; Krawczyk, A.; Potasiewicz, A.; Nikiforuk, A.; Stój, A.; Gosiewski, T. Comparison of iSeq and MiSeq as the Two Platforms for 16S rRNA Sequencing in the Study of the Gut of Rat Microbiome. Appl. Microbiol. Biotechnol. 2022, 106, 7671–7681. [Google Scholar] [CrossRef] [PubMed]
- Laver, T.; Harrison, J.; O’Neill, P.A.; Moore, K.; Farbos, A.; Paszkiewicz, K.; Studholme, D.J. Assessing the Performance of the Oxford Nanopore Technologies MinION. Biomol. Detect. Quantif. 2015, 3, 1–8. [Google Scholar] [CrossRef] [PubMed]
- Kono, N.; Arakawa, K. Nanopore Sequencing: Review of Potential Applications in Functional Genomics. Dev. Growth Differ. 2019, 61, 316–326. [Google Scholar] [CrossRef] [PubMed]
- Wang, Y.; Zhao, Y.; Bollas, A.; Wang, Y.; Au, K.F. Nanopore Sequencing Technology, Bioinformatics and Applications. Nat. Biotechnol. 2021, 39, 1348–1365. [Google Scholar] [CrossRef] [PubMed]
- Teufel, M.; Sobetzko, P. Reducing Costs for DNA and RNA Sequencing by Sample Pooling Using a Metagenomic Approach. BMC Genom. 2022, 23, 613. [Google Scholar] [CrossRef] [PubMed]
- Takele Assefa, A.; Vandesompele, J.; Thas, O. On the Utility of RNA Sample Pooling to Optimize Cost and Statistical Power in RNA Sequencing Experiments. BMC Genom. 2020, 21, 312. [Google Scholar] [CrossRef] [PubMed]


Disclaimer/Publisher’s Note: The statements, opinions and data contained in all publications are solely those of the individual author(s) and contributor(s) and not of MDPI and/or the editor(s). MDPI and/or the editor(s) disclaim responsibility for any injury to people or property resulting from any ideas, methods, instructions or products referred to in the content. |
© 2025 by the authors. Licensee MDPI, Basel, Switzerland. This article is an open access article distributed under the terms and conditions of the Creative Commons Attribution (CC BY) license (https://creativecommons.org/licenses/by/4.0/).