Article

Evaluating Interleukin-6, Tumour Necrosis Factor Alpha, and Myeloperoxidase as Biomarkers in Severe Osteoarthritis Patients: A Biostatistical Perspective

1
Department of Applied Science, South East Technological University, R93 V960 Carlow, Ireland
2
UPMC Aut Even Hospital, R95 D370 Kilkenny, Ireland
*
Author to whom correspondence should be addressed.
LabMed 2025, 2(2), 8; https://doi.org/10.3390/labmed2020008 (registering DOI)
Submission received: 16 March 2025 / Revised: 30 March 2025 / Accepted: 8 May 2025 / Published: 10 May 2025
(This article belongs to the Collection Feature Papers in Laboratory Medicine)

Abstract

:
Objective: This study employed advanced biostatistical methods to investigate Interleukin-6 (IL-6), Tumour Necrosis Factor Alpha (TNF-α), and Myeloperoxidase (MPO) levels in serum and plasma samples from patients with severe osteoarthritis (OA) compared to volunteers. The primary aim was to evaluate the diagnostic potential of these biomarkers and address statistical challenges, including non-normal data distribution and non-aged-matched groups. Design: Using Enzyme-Linked Immunosorbent Assays (ELISAs), IL-6, TNF-α, and MPO concentrations were analysed in 58 OA patients and 28 volunteers. Statistical analyses included Shapiro–Wilk tests to assess normality, a Mann–Whitney U (MWU) test to compare biomarker levels, and sensitivity analyses using Rank-based ANCOVA, and regression models were used to address non-normal data distributions and to validate the findings under adjustments for age and gender. Levene’s test was used to evaluate the homogeneity of variables. Results: Serum TNF-α and plasma MPO were significantly higher in OA patients than in volunteers (p < 0.05), while IL-6 levels were non-significant (p = 0.160). MWU tests confirmed significant differences for TNF-α (p = 0.045) and MPO (p = 0.0001). Sensitivity analysis using Rank-based ANCOVA and regression models confirmed the robustness of these biomarkers, with TNF-α (p = 0.037) and MPO (p = 0.0099) retaining statistical significance after adjusting for covariates. IL-6 remained non-significant across all analyses. Conclusions: TNF-α and MPO emerged as statistically robust biomarkers for severe OA, with the serum samples better reflecting inflammation than plasma. These findings underscore the importance of using advanced biostatistical methods such as Rank-based ANCOVA and regression to validate biomarkers, particularly in heterogenous datasets. Future research should incorporate larger, more diverse cohorts and detailed demographic profiling to explore the early diagnostic potential of these biomarkers and further understand OA progression.

1. Introduction

Osteoarthritis (OA) is a degenerative joint disease characterised by chronic pain, stiffness, and restricted mobility, primarily affecting the synovial joints [1]. The disease is characterised by focal degeneration of articular cartilage, accompanied by irregular regeneration and remodelling of subchondral bone. This process results in the progressive loss of cartilage and changes the underlying bone structure, ultimately leading to joint dysfunction and pain [2]. The aetiology of OA is multifactorial, involving mechanical wear and tear due to joint overuse, genetic predisposition influencing cartilage resilience, and biochemical factors such as inflammatory cytokines that contribute to cartilage degradation [3]. These complexities necessitate the identification of reliable biomarkers to enable earlier diagnosis and better disease monitoring. However, the complex and multifactorial nature of OA presents challenges in analysing biomarker data, requiring robust statistical methods to ensure validity [4,5].
Globally, OA prevalence is approximately 11% for hip and 24% for knee OA, with higher rates in individuals over 60 years old [6]. In 2020, 595 million people were affected, having increased by 132.2% since 1990. The predicted increase by 2050 for knee, hand and hip OA are 74.9%, 48.6% and 78.6%, respectively, underscoring the urgent need for effective early detection methods to prevent disease progression and reduce long-term disability [7]. Despite advancements, biomarker studies are often limited by challenges such as non-normal data distribution, small sample sizes and variability in demographics, which complicate the identification of reliable diagnostic markers [5,8,9]. Advanced biostatistical methods, including Rank-based ANCOVA and regression models, are crucial for overcoming these challenges, ensuring robust statistical conclusions [10,11]. While Rank-based ANCOVA has been established as a robust method for addressing non-normal data distributions [5], other transformation techniques, such as inverse normal transformations (INTs), have also been widely used. However, evaluations have raised concerns regarding Type I error control and statistical power under certain conditions [12]. These findings reinforce the importance of selecting appropriate statistical methods, particularly in studies involving heterogenous datasets like in OA research.
Currently, OA treatment options focus on symptom management, such as pain relief and improving joint function, using non-pharmacological interventions such as exercise, weight management, and physical therapy, as well as pharmacological treatments such as non-steroidal anti-inflammatory drugs (NSAIDs), opioids, and intra-articular injections [13,14]. However, these approaches have limited success in halting disease progression, highlighting the need for personalised treatment and novel diagnostic methods [15,16,17]. Biomarkers such as IL-6, TNF-α, and MPO hold promise in this regard [18,19]. These biomarkers are implicated in OA pathophysiology, with MPO linked to oxidative stress and IL-6 and TNF-α contributing to inflammatory processes [20,21]. However, demographic variability and dataset heterogeneity necessitate statistical methods to validate their utility [4,5].
IL-6 plays a dual role in OA, promoting inflammation under certain conditions while mitigating it in others [22,23]. It is involved in the induction of catabolic processes in joint tissues, leading to cartilage breakdown and joint damage [24,25]. However, IL-6’s context-dependent effects highlight the need for further research to elucidate its role in OA progression and management [26,27]. In this study, IL-6 levels were evaluated using Rank-based ANCOVA and regression models to assess their diagnostic utility in the presence of non-normal data distributions [5,8,10].
Similarly, TNF-α, a key mediator of systemic inflammation, has been linked to cartilage degradation and joint inflammation in OA [28,29,30]. Studies have shown that reducing TNF-α levels is often associated with clinical improvements in OA patients, suggesting its potential as a therapeutic target in managing OA symptoms and progression [31,32]. Given its consistent elevation in OA, TNF-α levels were analysed to validate its robustness as a biomarker under demographic variability [11].
Myeloperoxidase (MPO), a heme-containing peroxidase enzyme, contributes to oxidative stress and tissue damage, key factors in the inflammatory processes that drive OA pathology [33,34,35]. Recent studies have also identified MPO expression in osteophytes, linking neutrophil-driven degranulation and oxidative stress directly to structural joint changes characteristic of OA [36]. Statistical methods were employed to confirm the significance of MPO as a biomarker, particularly in plasma, addressing challenges such as outliers and demographic covariates. MPO’s role in oxidative stress suggests that it may provide valuable insights into OA progression and serve as a marker for disease monitoring [34].
This study leverages advanced statistical methods, including Rank-based ANCOVA and regression models, to evaluate IL-6, TNF-α, and MPO as biomarkers of OA. Sensitivity analyses were conducted to validate the findings in the context of non-age-matched data, providing a robust framework for biomarker validation [11,37]. By examining MPO levels in the serum and plasma of OA patients, this study seeks to elucidate mechanisms by which these biomarkers contribute to OA pathology and assess their utility in early diagnosis and disease monitoring [38]. Identifying specific pathways involving MPO could enable targeted interventions to mitigate tissue damage and inflammation. Similarly, targeting pro-inflammatory cytokines such as IL-6 and TNF-α may allow intervention in the disease process, potentially slowing down or halting OA progression [23,28,39].

2. Materials and Methods

2.1. Subjects

This study included patients with severe knee osteoarthritis (KOA) or hip osteoarthritis (HOA) undergoing total knee replacement (TKR) or total hip replacement (THR) surgery. The inclusion criteria required confirmed end-stage OA, characterised by persistent pain, significant functional impairment, and inadequate response to conservative treatments. Severe end-stage osteoarthritis (OA) referred to patients who required joint replacement surgery after exhausting other treatments options [40]. The classification followed the Kellgren–Lawrence grading system, with grades 3 and 4 indicating severe joint space narrowing, large osteophytes, and significant bone deformity [41,42]. Volunteers were verified as having no history of arthropathy through health screening questionnaires, which also captured information on recent infections, medication use, and other systemic inflammatory conditions. Exclusion criteria included any known autoimmune or inflammatory diseases, recent infections, or immunosuppressive treatment. All samples were collected at rest, prior to any surgical intervention or laboratory processing, to minimise the influence of acute physiological effects on biomarker expression.
The focus on severe OA patients enabled the identification of biomarkers strongly associated with OA pathology. In advanced disease stages, biomarkers exhibit more pronounced changes, facilitating detection and validation [20]. This methodology provides an opportunity to validate the association of biomarkers with the disease process in severe OA, which can be further explored in the earlier stages of OA [43]. Comparing severe OA patients with volunteers allowed for the establishment of a reference point for distinguished diseased from non-diseased states, thus supporting the identification and evaluation of potential diagnostic biomarkers [44].
A total of 86 samples were analysed (58 patient samples and 28 volunteer samples), each in duplicate. The mean ages of the patients and volunteers were 71.66 ± 8.25 years and 32 ± 10.97 years, respectively. Participants were assigned unique identifiers to ensure confidentiality. While detailed demographic and clinical characteristics were not extensively collected in this study, future research should incorporate these variables to validate and expand upon the findings.

2.2. Data Transparency

The biomarker data (IL-6, TNF-α and MPO levels) analysed in this study were published using Discriminant Function Analysis (DFA), which achieved a classification accuracy of 57.1%. The current study reanalysed this dataset using advanced biostatistical methods, focusing on biomarker robustness across serum and plasma samples (Table 1 and Table 2). Sensitivity analyses, comprising Rank-based ANCOVA (Table 3 and Table 4) and regression models (Supplementary Materials Tables S1–S6), were performed to validate the findings by addressing potential covariate effects such as age and gender. These analyses aimed to enhance the reliability of the results and evaluate the consistency of TNF-α and MPO as biomarkers. The data supporting the findings of this study are not publicly available due to ethical reasons.

2.3. Sample Size

Sample size calculations followed methodologies outlined in “Statistical Power Analysis for the Behavioural Sciences” by Jacob Cohen and “Sample Size Calculations in Clinical Research” by Chow et al. The study was designed to detect clinically significant differences with 80% power and a significance level of 0.05 for IL-6, TNF-α, and MPO. These calculations aligned with biomarker studies in the recent literature [45].

2.4. Ethical Considerations

Ethical approval was granted by the South East Technological University (SETU) Ethics Committee and Aut Even Hospital Kilkenny. The study was approved under protocol number 160 on the 8 December 2016. The study was conducted in accordance with the ethical principles outlined in the Declaration of Helsinki. Informed consent and a health screening questionnaire were obtained from patients and volunteers prior to participation in the study. Age and sex were used solely for statistical adjustment during analysis (e.g., ANCOVA and regression), but individual-level demographic data were not retained in the final dataset and are therefore not reported in the summary tables. Data confidentiality was maintained through the use of unique participant identifiers, and all records of data were securely stored, accessible only to authorised personnel.

2.5. Sample Collection and Processing

Blood samples were collected in Greiner VACUETTE® 3 mL with 3.2% (w/v) sodium citrate (plasma tubes) and Greiner VACUETTE® 4 mL Z serum sep clot activator (serum tubes). To minimise variability, samples were collected in the morning, reducing potential confounding effects, despite limiting the sample size due to restricted timeframes [46,47]. Serum tubes were left to clot for 30 min and centrifuged at 1800 rpm for 10 min within 1 h. Plasma tubes were centrifuged at 2800 rpm for 15 min within 1 h of collection. Aliquots of 200 µL of serum and plasma were stored in sterile Eppendorf tubes at −80 °C until analysis. Samples were thawed at room temperature (15–30 min) before analysis.

2.6. Enzyme-Linked Immunosorbent Assays

IL-6, TNF-α, and MPO were measured using commercially available ELISA kits (Biolegend, London, UK), according to the manufacturer’s instructions. All assays were performed in duplicate, and mean values were used for analysis (Table 1) (Supplementary Materials Table S7). Calibration curves were generated using the standards provided in each kit, with R2 values > 0.99 to ensure assay reliability. The MPO standards were in ng/mL and converted to pg/mL before statistical analysis.

2.7. Statistical Analysis

Statistical analyses were performed using Jamovi version 2.3.28 [Copyright 2021]. The data distribution was assessed using the Shapiro–Wilk test, confirming non-normality for IL-6, TNF-α, and MPO (p < 0.05, Supplementary Materials Table S8) [48]. Therefore, non-parametric Mann–Whitney U (MWU) tests were employed to compare biomarker levels (IL-6, TNF-α and MPO) between OA patients and volunteers, with the significant threshold set at p < 0.05 (Table 2) [49]. To facilitate comparability and reduce scale-related biases, all biomarker data were z-scored prior to analysis. Levene’s test was performed to evaluate homogeneity of variances, with significant results indicating unequal variances across groups (Supplementary Materials Table S9) [50].
To ensure the robustness of the findings, sensitivity analyses were performed, incorporating Rank-based ANCOVA and regression models. Rank-based ANCOVA was used to adjust covariates such as age and gender (Table 3 and Table 4), addressing demographic variability and accounting for the non-normal distribution of data. Regression analyses further evaluated the influence of age and gender on biomarker levels while confirming the reliability of TNF-α and MPO as biomarkers. Extreme value testing was also conducted to mitigate the influence of outliers, ensuring the results were not unduly affected by extreme data points. The detailed results of the sensitivity analyses, including variations under different scenarios, are provided to support the robustness and generalisability of the findings (Supplementary Materials Tables S1–S6).

3. Results

This section provides a comparative analysis of IL-6, TNF-α, and MPO concentrations in serum and plasma samples from OA and volunteers to assess their diagnostic potential. Individual results highlight biomarker variability, underscoring the heterogeneity in biomarker expression and the necessity for personalised approaches in OA diagnosis and management.

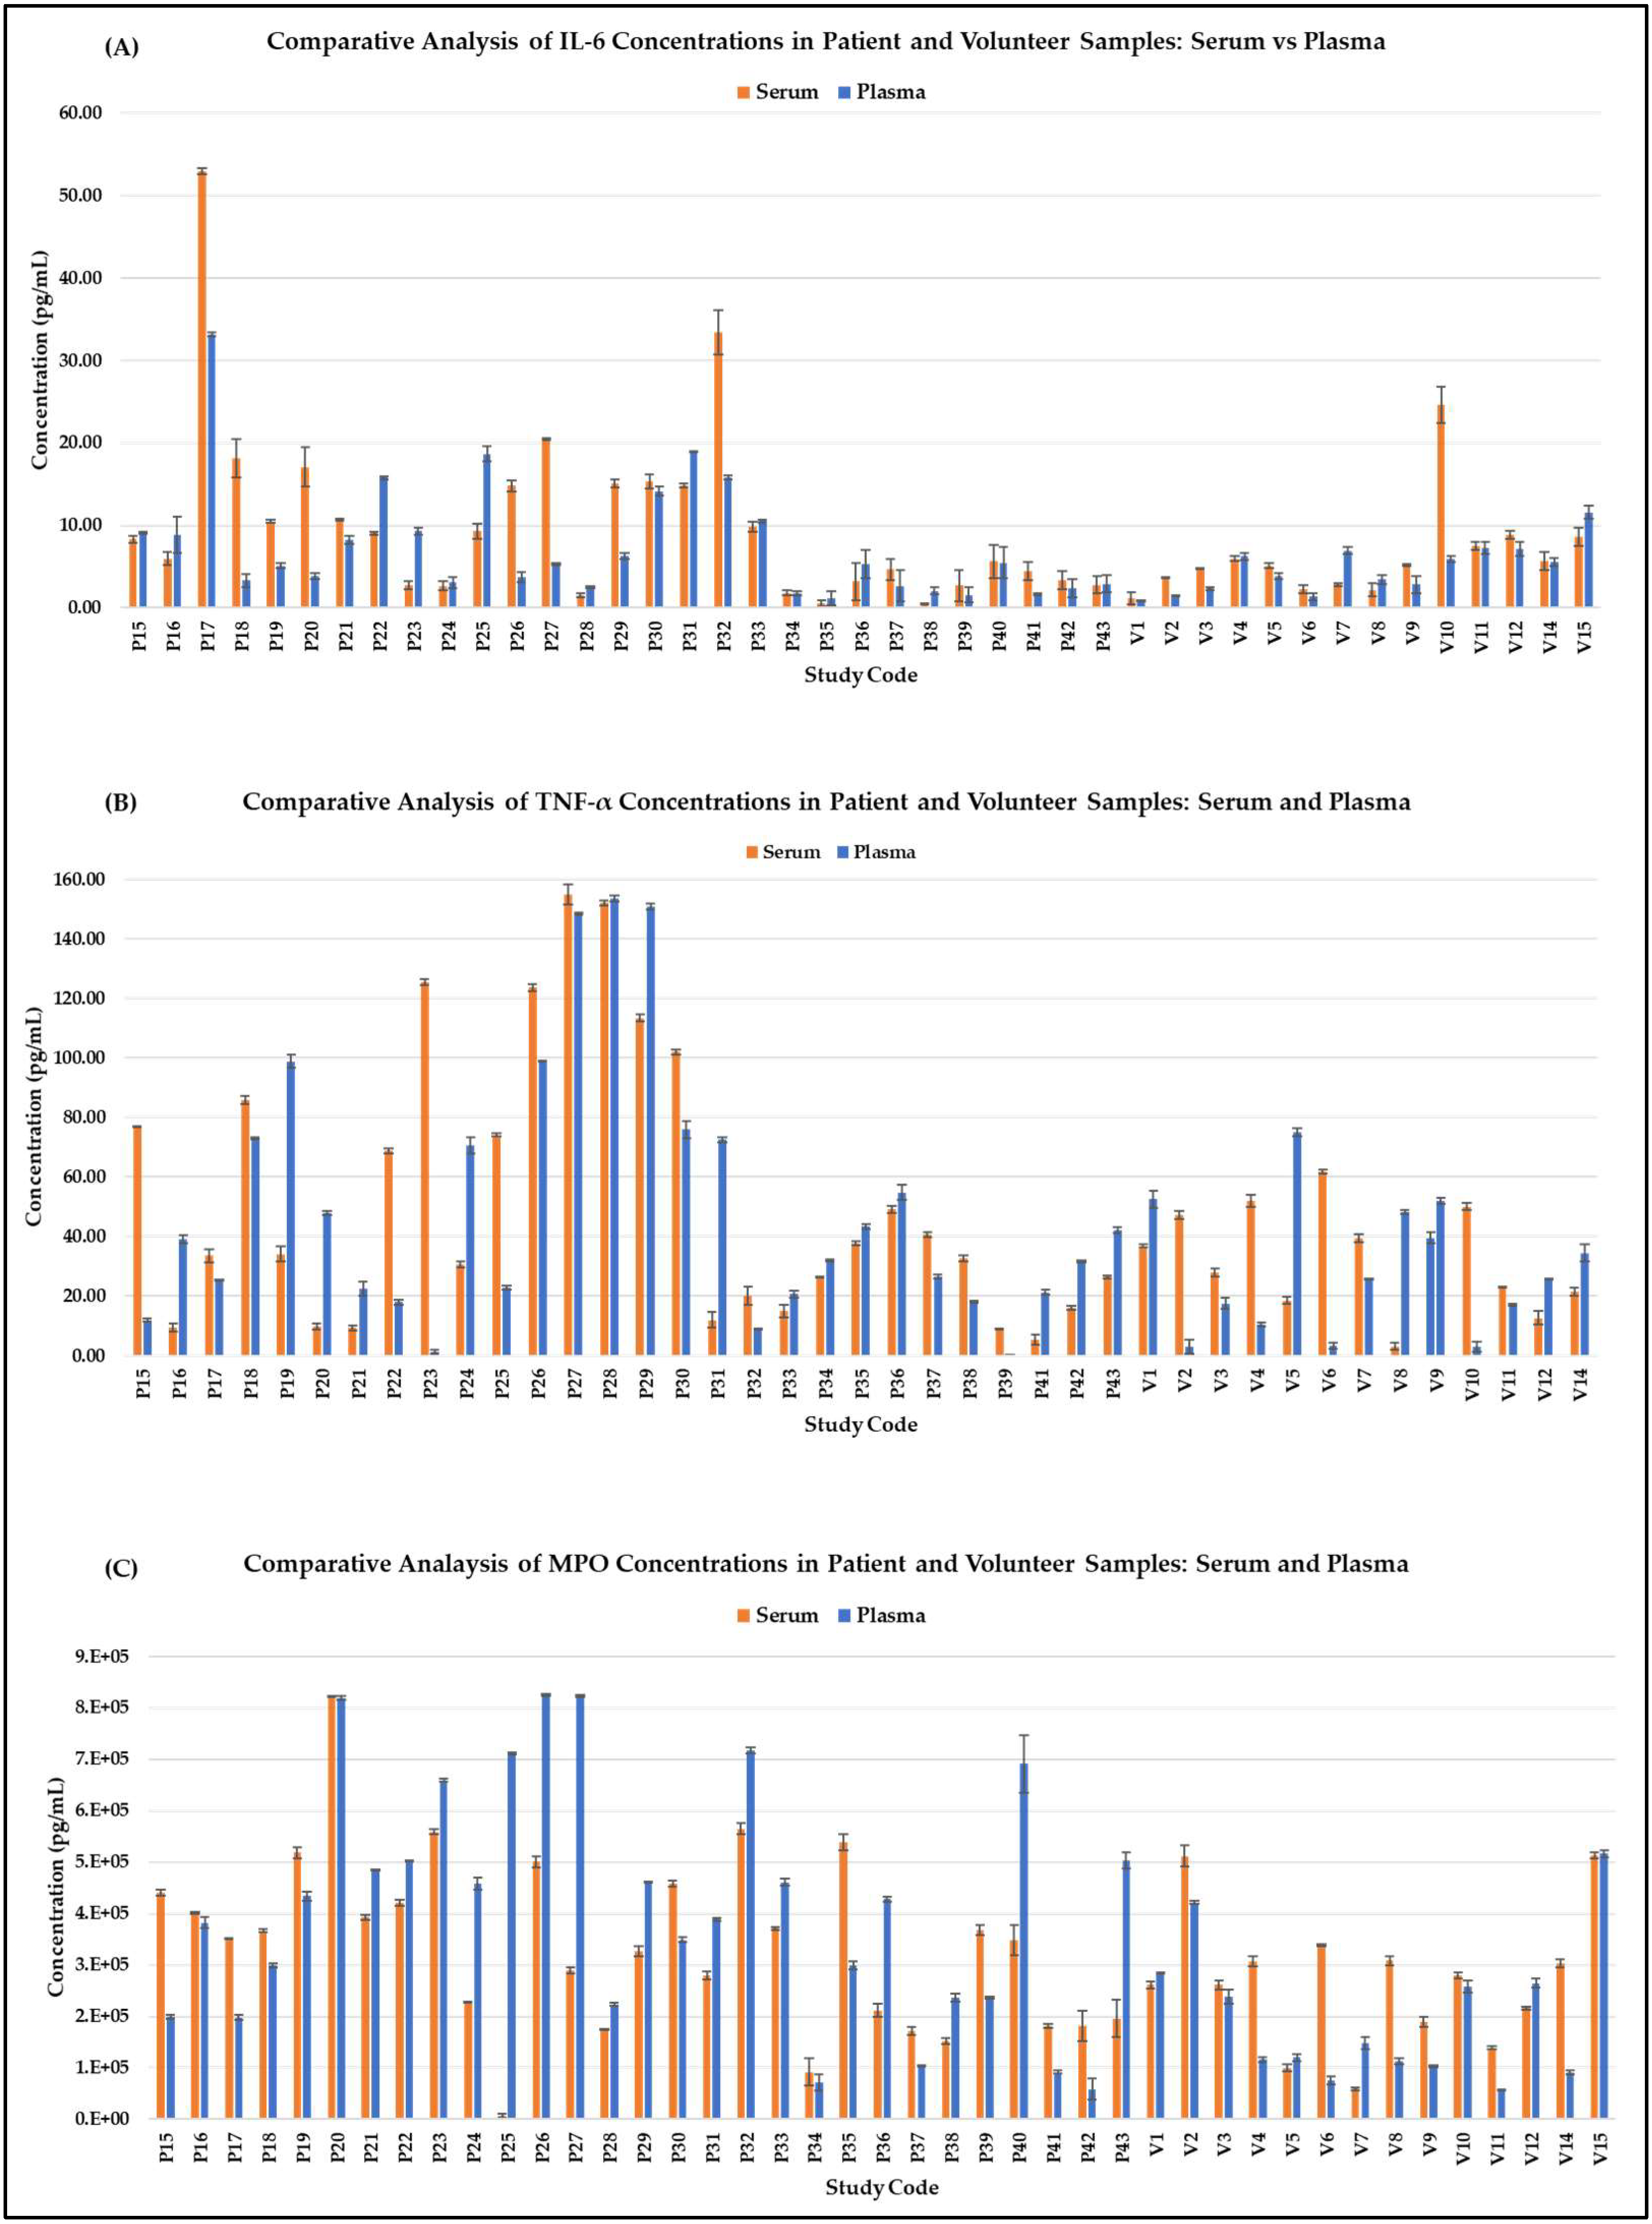
3.1. Comparative Analysis

Stacked bar charts (Figure 1), raw data (Table 1), and concentration ranges (Supplementary Materials Table S8) demonstrated higher biomarker concentrations in patient samples compared to volunteers. Serum samples from patients consistently exhibited significantly higher IL-6 and TNF-α concentrations than plasma samples, whereas plasma samples had higher MPO levels. These findings suggest that the choice of sample type may depend on the target biomarker, with plasma being more suitable for MPO analysis in OA.
Table 1. Average concentrations of IL-6, TNF-α, and MPO with standard deviations (±SD) in patient and volunteer blood samples. IL-6: Interleukin-6; TNF-α: Tumour Necrosis Factor Alpha; and MPO: myeloperoxidase.
IL-6 (pg/mL)TNF-α (pg/mL)MPO (pg/mL)
SampleSerumPlasma SerumPlasmaSerumPlasma
Patient10.42 ± 11.077.67± 7.2254.67 ± 44.4048.60 ± 44.623.42 × 105 ± 1.73 × 1054.18 × 105 ± 2.32 × 10⁵
Volunteer6.31± 5.764.78± 2.9930.26 ± 17.2128.21 ± 22.782.70 × 105 ± 1.32 × 1052.01 × 105 ± 1.37 × 10⁵
The elevated biomarker levels in patients compared to volunteers were consistent. For instance, serum IL-6 concentrations were highest in patients P17 (52.90 ± 0.38 pg/mL) and P32 (33.41 ± 2.67 pg/mL) (Figure 1). Patient P27 exhibited high concentrations of both IL-6 and TNF-α, while volunteer V10, with an IL-6 concentration of 24.58 ± 2.20 pg/mL (Figure 1), was notably active according to their consent form. This suggests that lifestyle factors, such as physical activity, may influence biomarker expression.
Patient P27 displayed the highest TNF-α concentration, in serum (154.84 ± 3.30 pg/mL) and plasma (148.33 ± 0.38 pg/mL), while P28 displayed elevated levels in both serum (152.13 ± 0.85 pg/mL) and plasma (153.48 ± 96 pg/mL). Volunteer V5 exhibited an elevated level of TNF-α concentration in plasma (74.98 ± 1.32 pg/mL), warranting further diagnostic monitoring (Figure 1).
Regarding MPO, P20 displayed the highest serum concentration (8.22 × 10⁵ ± 1.77 × 10² pg/mL), while P26 exhibited the highest plasma MPO level (8.25 × 10⁵ ± 1.09 × 10³ pg/mL). Volunteer V15 had similar MPO concentrations in both plasma (5.13 × 10⁵ ± 6.38 × 10³ pg/mL) and serum samples (5.16 × 10⁵ ± 6.19 × 10³ pg/mL), whereas V2 showed higher levels of MPO in serum (5.12 × 10⁵ ± 1.98 × 10⁴ pg/mL) than in plasma (4.21 × 10⁵ ± 2.82 × 10³ pg/mL) (Figure 1). These results underscore the variability of biomarker expression across individuals, particularly between physically active volunteers and patients, and the importance of considering lifestyle factors in biomarker studies. These individual values are presented to illustrate inter-individual variability and were not used for inference. Extreme value testing was conducted to ensure that such outliers did not skew the overall statistical results.

3.2. Statistical Analysis

The Mann–Whitney U (MWU) tests revealed significant differences in TNF-α and MPO levels between patients and volunteers (p < 0.05, Table 2), suggesting their potential reliability as biomarkers for OA diagnosis and monitoring. However, IL-6 levels were not significantly different between the two groups (p = 0.160). The non-normal data distribution was confirmed using a Shapiro–Wilk test (Supplementary Materials Table S8), supporting the use of Rank-based methods for further analysis (Table 3 and Table 4).
Table 2. Mann–Whitney U non-parametric test for blood samples (serum vs. plasma) and grouping (patients vs. volunteers). Ha μ1 ≠ μ2 represents the alternative hypothesis; there was a significant difference between the means (μ) of the two groups being compared, denoted as group 1 and group 2. p: p-value; ZIL-6: Z-scored Interleukin-6; ZTNF-α: Z-scored Tumour Necrosis Factor Alpha; and ZMPO: Z-scored Myeloperoxidase.
Mann–Whitney U TestBlood Samples (Serum vs. Plasma)Grouping
(Patients vs. Volunteers)
StatisticpStatisticp
ZIL-68070.3106590.160
ZTNF-α8220.4815700.045
ZMPO8970.8174570.001
Note. Ha μ1 ≠ μ2.
Based on these findings, TNF-α and MPO emerged as promising candidates for OA diagnosis, with significant differences observed in their distribution between patients and volunteers, while IL-6 remained non-significant. Future research incorporating detailed demographic and clinical data, including comorbidities, would further validate and expand upon the current results.

3.3. Sample Type Effects

Levene’s test indicated no significant differences in variance between serum and plasma samples for IL-6 and TNF-α. However, MPO exhibited significant variability between the two groups, highlighting sample type as a key factor influencing MPO levels (Supplementary Materials Table S9). Additionally, Mann–Whitney U tests showed no significant differences in biomarker concentrations between serum and plasma samples for any of the markers (Table 2), supporting the overall comparability of these sample types, particularly for IL-6 and TNF-α.

3.4. Sensitivity Analysis

Sensitivity analyses using Rank-based ANCOVA and regression models, adjusted for age and gender, confirmed the robustness of TNF-α (p = 0.037) and MPO (p = 0.0099) even after adjustment for covariates (Table 3 and Table 4). The regression results (Supplementary Materials Tables S1–S6) further validate these findings, ensuring the robustness of these biomarkers across various analytical approaches.
Table 3. Rank-based ANCOVA results for ZIL-6, ZTNF-α, and ZMPO. Degrees of freedom (Df), sum of squares (Sum Sq), mean squares (Mean Sq), F value, and the p-value (Pr(>F)) for each source of variance.
VariableSourceDfSum SqMean SqF ValuePr(>F)Observations Deleted
ZIL-6Grouping1124012402.010.161
Residuals8451,757616
ZTNF-αGrouping1246324634.200.044 *2
Residuals8348,707587
ZMPOGrouping16674667412.108 × 10−4 ***1
Residuals8446,324551
Note: p <0.05 is indicated by *; p is indicated by ***.
Table 4. ANCOVA results for ZIL-6, ZTNF-α, and ZMPO with covariates (age and gender). Degrees of freedom (Df), sum of squares (Sum Sq), mean squares (Mean Sq), F value, and the p-value (Pr(>F)) for each source of variance.
VariableSourceDfSum SqMean SqF ValuePr(>F)Observations Deleted
ZIL-6Ranked_Age1102710271.630.211
Gender1110.000.97
Grouping12622620.420.52
Residuals8251,707631
ZTNF-αRanked_Age1257225724.480.037 *2
Gender1198319833.460.067
Grouping11401400.240.623
Residuals8146,475574
ZMPORanked_Age1392839286.970.0099 **1
Gender140400.070.7902
Grouping1284728475.050.0272 *
Residuals8246,182563
Note: p <0.05 is indicated by *; p < 0.01 is indicated by **.

4. Discussion

This study identified TNF-α and MPO as robust biomarkers for severe OA, with serum better reflecting inflammatory states for IL-6 and TNF-α, while plasma proved more reliable for MPO analysis. These findings underscore the importance of sample type selection when analysing biomarkers, as the distinct profiles observed between serum and plasma can significantly influence biomarker interpretation [51]. Although IL-6 levels did not show significant differences between OA patients and volunteers, TNF-α and MPO exhibited notable variability, suggesting their diagnostic potential in OA [52]. Advanced biostatistical methods, including Rank-based ANCOVA and regression models, were critical in validating these biomarkers for heterogeneous datasets, addressing challenges such as non-normal data distributions, small sample sizes, and demographic variability [1,4,5,8,9]. These methods provide a robust framework for analysing non-parametric data, ensuring the reliability of findings even when standard assumptions are violated.
OA is traditionally considered a non-inflammatory arthropathy; however, inflammation plays a significant role in disease progression, particularly in severe cases [47]. Elevated TNF-α and MPO levels in OA patients compared to volunteers (Table 2: Mann–Whitney U tests: TNF-α p = 0.045; MPO, p = 0.001) emphasise their relevance in OA pathogenesis. Their significance was further confirmed in ANCOVA (Table 3) and regression analyses (Supplementary Materials Tables S1–S6), strengthening their diagnostic potential.
TNF-α, a pro-inflammatory cytokine, and MPO, a marker of oxidative stress, are often elevated in severe OA cases and may reflect systemic inflammation exacerbated by comorbidities such as obesity and cardiovascular disorders. These comorbidities can further influence biomarker levels and complicate the interpretation of their disease-specific roles [48]. OA is increasingly recognised as a multifactorial disease involving various pathological mechanisms and multiple cell types, including chondrocytes, synoviocytes, and immune cells, all contributing to disease heterogeneity and progression [13,53]. Biomarkers such as IL-6, TNF-α, and MPO likely reflect distinct aspects of OA pathology. For instance, IL-6 and TNF-α are predominantly produced by synoviocytes and immune cells, contributing to joint inflammation and cartilage degradation. In contrast, MPO reflects neutrophil-mediated oxidative stress, indicating broader inflammatory and degradative responses involving multiple cell types.
Previous research has demonstrated that osteophytes in OA express degranulation-specific genes, indicating a close relationship between osteophyte formation and neutrophil activity [36]. This aligns with the elevated MPO levels observed in this study, highlighting the relevance of MPO as a neutrophil degranulation biomarker linked directly to structural joint changes characteristic of OA. The robust and consistent statistical significance observed for MPO, contrasted with the non-significant findings for IL-6, underscores the relevance of neutrophil-mediated cartilage degradation pathways in OA progression; compared to cytokine-mediated inflammation alone, they may have greater clinical and biological importance in severe OA.
Future studies exploring these biomarkers across specific OA subtypes or tissue-specific pathologies could clarify their diagnostic utility and facilitate more therapeutic interventions.
A critical aspect of this study was the application of sensitivity analyses, including Rank-based ANCOVA (Table 3 and Table 4) and regression models, to validate the robustness of biomarker findings. These approaches addressed demographic variability and dataset heterogeneity, further substantiated by the Rank-based regression results (Supplementary Materials Tables S1–S6). Rank-based ANCOVA effectively addresses non-normal data, with limitations of inverse normal transformations (INTs), such as unreliable Type I error control and reduced power, highlighting its suitability for validating TNF-α and MPO as biomarkers across covariates [12]. These analyses addressed the inherent risks of p-value dependence in small datasets and ensured reliable demographic adjustments, enabling the extraction of meaningful insights from complex datasets [10,11,37]. The results confirmed the significance of TNF-α (p = 0.037) and MPO (p = 0.0099) (Table 4) as biomarkers, even after adjusting for demographic covariates. IL-6, however, remained non-significant across all analyses (without covariate adjustment, p = 0.16; with covariate adjustment: age, p = 0.21, and gender, p = 0.97). The sensitivity analyses also highlighted the impact of age, particularly for TNF-α and MPO, underscoring the importance of demographic adjustments in future studies [49].
This study highlights the potential of TNF-α and MPO as biomarkers for the diagnosis and progression of OA, supported by advanced biostatistical methods. Sensitivity analyses, including Rank-based ANCOVA and regression models, addressed the limitations posed by non-age-matched data, a common challenge in human studies due to ethical and logistical constraints in participant recruitment. These approaches, coupled with considerations for categorical data, highlight the importance of using appropriate methodologies in analysing complex datasets [10]. Additionally, the emphasis on statistical power underscores the potential of robust statistical tools to extract meaningful insights, particularly in conditions such as OA where balanced cohort recruitment remains challenging [9].
Propensity score matching was attempted to control for demographic variability but was limited by the small sample size. Extreme value testing further validated the robustness of these findings, particularly for MPO, which maintained consistent significance across all analyses. The use of synthetic datasets in future research could provide an avenue for validating these results under controlled conditions, addressing sample size limitations and enhancing model reliability [11,54].
While this study demonstrates the utility of advanced statistical methods, it also underscores the limitations inherent to biomarker research. The small sample size, determined by practical constraints, limits generalisability. Nonetheless, the use of non-parametric tests, such as the Mann–Whitney U test, ensured reliable group comparisons despite the data’s non-normal distribution. The comparability of biomarker levels between serum and plasma samples (p > 0.05) suggests that either sample type could be used for IL-6, TNF-α, and MPO analyses, though specific preferences depend on the biomarker being analysed.
Serum was consistently superior for IL-6 and TNF-α, while plasma was more suitable for MPO. These differences were statistically evident in the homogeneity of variance test (Supplementary Materials Table S9), where MPO exhibited significant variability across sample types, reinforcing the need for the careful selection of sample matrices in biomarker research [49,50,55]. Individual variability in biomarker expression was another important finding, as demonstrated by participants such as V10 and V15, whose profiles suggest that lifestyle factors, such as physical activity, may significantly influence biomarker levels [56]. These results emphasise the need for future studies to incorporate detailed demographic and lifestyle data, including BMI, comorbidities, and physical activity levels, to isolate OA-specific contributions to biomarker expression [57]. The variability in individual profiles also suggests that single biomarkers may not provide sufficient diagnostic power, highlighting the need for composite biomarker panels or multi-modal diagnostic approaches [1,54,58]. TNF-α and MPO emerged as reliable biomarkers for OA diagnosis and monitoring, supported by robust biostatistical validation. Serum was identified as the optimal sample type for IL-6 and TNF-α, while plasma proved more suitable for MPO. These findings highlight the critical role of biostatistical methods, such as Rank-based ANCOVA and regression, in overcoming the challenges of non-normal data distributions, small sample sizes, and demographic variability.
Future research should focus on larger, demographically diverse cohorts and incorporate detailed medical histories, imaging, and clinical evaluations to validate the roles of TNF-α and MPO in early OA detection and disease progression. Further validation using synthetic data frameworks, as proposed in Rank-based regression analysis (Supplementary Materials Tables S1–S6), could provide additional robustness to these findings and support predictive modelling approaches. Recent advances in high-resolution imaging techniques, including magnetic resonance imaging (MRI), electron microscopy, and laser-scanning confocal arthroscopy, offer opportunities to better understand structural- and cellular-level changes in OA [59,60]. Integrating biochemical biomarkers such as TNF-α and MPO with these advanced imaging methods could provide complementary diagnostic and prognostic information, bridging the gap between biochemical inflammation markers and structural tissue alterations. Future studies combing these modalities could improve early-stage OA detection, allow precise OA subtype characterisation, and enhance therapeutic monitoring strategies. Although this study focused on severe OA to ensure phenotype clarity, future studies should explore the expression of TNF-α and MPO in early-stage or preclinical OA to evaluate their utility for early diagnosis and disease interception. Future research should incorporate detailed clinical profiling and apply advanced regression methods, such as Cox proportional hazards modelling, to correlate biomarkers with clinical OA progression and outcomes, further validating their prognostic utility in personalised medicine frameworks. Advanced statistical approaches will remain essential for addressing the inherent variability in biomarker data and improving the reliability of future findings.

5. Conclusions

TNF-α and MPO emerged as promising biomarkers for severe OA, with serum TNF-α levels typically exceeding 50 pg/mL and plasma MPO levels above 4.0 × 10⁵ pg/mL, distinguishing patients from volunteers. Serum was identified as the optimal sample type for TNF-α, while plasma was more suitable for MPO analysis. Although IL-6 was evaluated, it did not show significant differences between groups.
These findings support the use of TNF-α and MPO in OA diagnosis and disease monitoring, establishing a foundation for biomarker utility and developing early diagnostic thresholds. Subsequent studies should prioritise validating these biomarkers in early-stage OA cohorts to determine their prognostic utility for earlier disease detection. Such research should incorporate longitudinal study designs, larger and demographically diverse cohorts, and comprehensive clinical profiling including age, gender, BMI, and comorbidities to enhance statistical power and generalisability. While this study relied on observational data, synthetic datasets represent a promising avenue to validate these findings under controlled conditions.
This study also highlights the value of Rank-based statistical methods in addressing non-normality, small sample sizes, and population variability. While alternatives such as INTs have been proposed, their limitations further validate the application of Rank-based approaches in biomarker research. Future studies should continue to evaluate these methods across diverse datasets to ensure the reliability and reproducibility of future findings and support the development of targeted diagnostic and therapeutic strategies for OA [12].

Supplementary Materials

https://www.mdpi.com/article/10.3390/labmed2020008/s1. Table S1: Residuals (rank-based regression, no covariates); Table S2: Coefficients (no covariates); Table S3: Model fit (models 1–3, no covariates); Table S4: Residuals (with covariates); Table S5: Coefficients (with covariates); Table S6: Model fit (models 1–3, with covariates); Table S7: IL-6, TNF-α, and MPO ranges in blood samples; Table S8: Shapiro–Wilk normality test (serum vs. plasma, patients vs. volunteers); Table S9: Levene’s test for variance homogeneity (serum vs. plasma, patients vs. volunteers).

Author Contributions

Conceptualization, L.J.C. and R.O.; methodology, L.J.C. and R.O.; software, L.J.C. and J.L.B.; validation, L.J.C. and J.L.B.; formal analysis, L.J.C. and J.L.B.; investigation, L.J.C.; resources, R.O. and S.E.; data curation, L.J.C., R.O. and S.E.; writing—original draft preparation, L.J.C.; writing—review and editing, R.O., J.L.B. and S.E.; visualization, L.J.C.; supervision, R.O. and J.L.B.; project administration, R.O. and S.E.; funding acquisition, R.O. All authors have read and agreed to the published version of the manuscript.

Funding

This research project was funded by the President’s Research Fellowship Scholarship at South East Technological University Carlow: PES1223.

Institutional Review Board Statement

The study was conducted in accordance with the Declaration of Helsinki, and approved by the Ethics Committee of South East Technological University, Carlow (protocol code 160 and date of approval 8 December 2016).

Informed Consent Statement

Informed consent was obtained from all subjects involved in the study.

Data Availability Statement

The data presented in this study are available on request from the corresponding author (due to ethical reasons).

Conflicts of Interest

The authors declare no conflict of interest.

References

  1. Hunter, D.J.; Bierma-Zeinstra, S. Osteoarthritis. Lancet 2019, 393, 1745–1759. [Google Scholar] [CrossRef]
  2. Thijssen, E.; van Caam, A.; van der Kraan, P.M. Obesity and osteoarthritis, more than just wear and tear: Pivotal roles for inflamed adipose tissue and dyslipidaemia in obesity-induced osteoarthritis. Rheumatology 2015, 54, 588–600. [Google Scholar] [CrossRef] [PubMed]
  3. Mobasheri, A.; Batt, M. An update on the pathophysiology of osteoarthritis. Ann. Phys. Rehabil. Med. 2016, 59, 333–339. [Google Scholar] [CrossRef] [PubMed]
  4. Altman, D.G. Practical Statistics for Medical Research; Taylor & Francis: New York, NY, USA, 1990. [Google Scholar]
  5. Conover, W.J.; Iman, R.L. Analysis of covariance using the rank transformation. Biometrics 1982, 38, 715–724. [Google Scholar] [CrossRef] [PubMed]
  6. Fernandes, L.; Hagen, K.; Bijlsma, J.; Andreassen, O.; Christensen, P.; Conaghan, P.; Doherty, M.; Geenen, R.; Hammond, A.; Kjeken, I.; et al. EULAR recommendations for the non-pharmacological core management of hip and knee osteoarthritis. Ann. Rheum. Dis. 2013, 72, 1125–1135. [Google Scholar] [CrossRef]
  7. Steinmetz, J.D.; Culbreth, G.T.; Haile, L.M.; Rafferty, Q.; Lo, J.; Fukutaki, K.G.; Cruz, J.A.; Smith, A.E.; Vollset, S.E.; Brooks, P.M.; et al. Global, regional, and national burden of osteoarthritis, 1990–2020 and projections to 2050: A systematic analysis for the Global Burden of Disease Study 2021. Lancet Rheumatol. 2023, 5, e508–e522. [Google Scholar] [CrossRef]
  8. Conover, W.J.; Iman, R.L. Rank Transformations as a Bridge between Parametric and Nonparametric Statistics. Am. Stat. 1981, 35, 124–129. [Google Scholar] [CrossRef]
  9. Cohen, J. Statistical Power Analysis for the Behavioral Sciences; L. Erlbaum Associates: Mahwah, NJ, USA, 1988. [Google Scholar]
  10. Stokes, M.E.; Davis, C.S.; Koch, G.G. Categorical Data Analysis Using SAS, 3rd ed.; SAS Institute: Cary, NC, USA, 2012. [Google Scholar]
  11. Steyerberg, E.W. FRANK E. HARRELL, Regression Modeling Strategies: With Applications, to Linear Models, Logistic and Ordinal Regression, and Survival Analysis, 2nd ed. Heidelberg: Springer. Biometrics 2016, 72, 1006–1007. [Google Scholar] [CrossRef]
  12. Beasley, T.M.; Erickson, S.; Allison, D.B. Rank-based inverse normal transformations are increasingly used, but are they merited? Behav. Genet. 2009, 39, 580–595. [Google Scholar] [CrossRef]
  13. Zhang, W.; Ouyang, H.; Dass, C.; Xu, J. Current research on pharmacologic and regenerative therapies for osteoarthritis. Bone Res. 2016, 4, 15040. [Google Scholar] [CrossRef]
  14. Yeap, S.S.; Abu Amin, S.R.; Baharuddin, H.; Koh, K.C.; Lee, J.K.; Lee, V.K.M.; Mohamad Yahaya, N.H.; Tai, C.C.; Tan, M.P. A Malaysian Delphi consensus on managing knee osteoarthritis. BMC Musculoskelet. Disord. 2021, 22, 514. [Google Scholar] [CrossRef]
  15. Poulet, B.; Staines, K.A. New developments in osteoarthritis and cartilage biology. Curr. Opin. Pharmacol. 2016, 28, 8–13. [Google Scholar] [CrossRef] [PubMed]
  16. Stefanicka-Wojtas, D.; Kurpas, D. Personalised Medicine—Implementation to the Healthcare System in Europe (Focus Group Discussions). J. Pers. Med. 2023, 13, 380. [Google Scholar] [CrossRef] [PubMed]
  17. Karsdal, M.; Michaelis, M.; Ladel, C.; Siebuhr, A.; Bihlet, A.; Andersen, J.; Guehring, H.; Christiansen, C.; Bay-Jensen, A.; Kraus, V. Disease-modifying treatments for osteoarthritis (DMOADs) of the knee and hip: Lessons learned from failures and opportunities for the future. Osteoarthr. Cartil. 2016, 24, 2013–2021. [Google Scholar] [CrossRef] [PubMed]
  18. Mobasheri, A.; Thudium, C.S.; Bay-Jensen, A.C.; Maleitzke, T.; Geissler, S.; Duda, G.N.; Winkler, T. Biomarkers for osteoarthritis: Current status and future prospects. Best Pract. Res. Clin. Rheumatol. J. 2023, 37, 101852. [Google Scholar] [CrossRef]
  19. Bernotiene, E.; Bagdonas, E.; Kirdaite, G.; Bernotas, P.; Kalvaityte, U.; Uzieliene, I.; Thudium, C.S.; Hannula, H.; Lorite, G.S.; Dvir-Ginzberg, M.; et al. Emerging Technologies and Platforms for the Immunodetection of Multiple Biochemical Markers in Osteoarthritis Research and Therapy. Front. Med. 2020, 7, 572977. [Google Scholar] [CrossRef]
  20. Mobasheri, A.; Henrotin, Y. Biomarkers of Osteoarthritis: A Review of Recent Research Progress on Soluble Biochemical Markers, Published Patents and Areas for Future Development. Recent Pat. Biomark. 2011, 1, 25–43. [Google Scholar] [CrossRef]
  21. Berenbaum, F. Osteoarthritis as an inflammatory disease (osteoarthritis is not osteoarthrosis!). Osteoarthr. Cartil. 2013, 21, 16–21. [Google Scholar] [CrossRef]
  22. Wiegertjes, R.; van de Loo, F.A.J.; Blaney Davidson, E.N. A roadmap to target interleukin-6 in osteoarthritis. Rheumatology 2020, 59, 2681–2694. [Google Scholar] [CrossRef]
  23. Tanaka, T.; Narazaki, M.; Kishimoto, T. IL-6 in inflammation, immunity, and disease. Cold Spring Harb. Perspect. Biol. 2014, 6, a016295. [Google Scholar] [CrossRef]
  24. Zhang, J.M.; An, J. Cytokines, inflammation, and pain. Int. Anesthesiol. Clin. 2007, 45, 27–37. [Google Scholar] [CrossRef] [PubMed]
  25. Uciechowski, P.; Dempke, W.C.M. Interleukin-6: A Masterplayer in the Cytokine Network. Oncology 2020, 98, 131–137. [Google Scholar] [CrossRef]
  26. Swärd, P.; Frobell, R.; Englund, M.; Roos, H.; Struglics, A. Cartilage and bone markers and inflammatory cytokines are increased in synovial fluid in the acute phase of knee injury (hemarthrosis)—A cross-sectional analysis. Osteoarthr. Cartil. 2012, 20, 1302–1308. [Google Scholar] [CrossRef] [PubMed]
  27. Stannus, O.; Jones, G.; Cicuttini, F.; Parameswaran, V.; Quinn, S.; Burgess, J.; Ding, C. Circulating levels of IL-6 and TNF-α are associated with knee radiographic osteoarthritis and knee cartilage loss in older adults. Osteoarthr. Cartil. 2010, 20, 1302–1308. [Google Scholar] [CrossRef]
  28. Jang, D.I.; Lee, A.A.-O.; Shin, H.Y.; Song, H.A.-O.; Park, J.H.; Kang, T.A.-O.; Lee, S.A.-O.X.; Yang, S.A.-O. The Role of Tumor Necrosis Factor Alpha (TNF-α) in Autoimmune Disease and Current TNF-α Inhibitors in Therapeutics. Int. J. Mol. Sci. 2021, 22, 2719. [Google Scholar] [CrossRef]
  29. Estee, M.M.; Cicuttini, F.M.; Page, M.J.; Wluka, A.E.; Wang, Y. Efficacy of tumor necrosis factor inhibitors in hand osteoarthritis: A systematic review and meta-analysis of randomized controlled trials. Osteoarthr. Cartil. Open 2023, 5, 100404. [Google Scholar] [CrossRef] [PubMed]
  30. Parameswaran, N.; Patial, S. Tumor necrosis factor-α signaling in macrophages. Crit. Rev. Eukaryot. Gene Expr. 2010, 20, 87–103. [Google Scholar] [CrossRef]
  31. Chisari, E.; Yaghmour, K.M.; Khan, W.S. The effects of TNF-alpha inhibition on cartilage: A systematic review of preclinical studies. Osteoarthr. Cartil. 2020, 28, 708–718. [Google Scholar] [CrossRef]
  32. Attur, M.; Krasnokutsky, S.; Zhou, H.; Samuels, J.; Chang, G.; Bencardino, J.; Rosenthal, P.; Rybak, L.; Huebner, J.L.; Kraus, V.B.; et al. The combination of an inflammatory peripheral blood gene expression and imaging biomarkers enhance prediction of radiographic progression in knee osteoarthritis. Arthritis Res. Ther. 2020, 22, 208. [Google Scholar] [CrossRef]
  33. Aratani, Y. Myeloperoxidase: Its role for host defense, inflammation, and neutrophil function. Arch. Biochem. Biophys. 2018, 640, 47–52. [Google Scholar] [CrossRef]
  34. Davies, M.J.; Hawkins, C.L. The Role of Myeloperoxidase in Biomolecule Modification, Chronic Inflammation, and Disease. Antioxid. Redox Signal. 2020, 32, 957–981. [Google Scholar] [CrossRef] [PubMed]
  35. Khan, A.A.; Alsahli, M.A.; Rahmani, A.H. Myeloperoxidase as an Active Disease Biomarker: Recent Biochemical and Pathological Perspectives. Med. Sci. 2018, 6, 33. [Google Scholar] [CrossRef] [PubMed]
  36. Kulkarni, P.; Harsulkar, A.; Märtson, A.A.-O.; Suutre, S.; Märtson, A.; Koks, S.A.-O. Mast Cells Differentiated in Synovial Fluid and Resident in Osteophytes Exalt the Inflammatory Pathology of Osteoarthritis. Int. J. Mol. Sci. 2022, 23, 541. [Google Scholar] [CrossRef]
  37. Ranstam, J. Why the P-value culture is bad and confidence intervals a better alternative. Osteoarthr. Cartil. 2012, 20, 805–808. [Google Scholar] [CrossRef]
  38. Martins, G.A.; Degen, A.N.; Antunes, F.T.T.; da Rosa, L.G.; Ferraz, A.G.; Wiilland, E.; Vieira, L.B.; de Souza, A.H. Benefits of electroacupuncture and a swimming association when compared with isolated protocols in an osteoarthritis model. J. Tradit. Complement. Med. 2021, 12, 375–383. [Google Scholar] [CrossRef] [PubMed]
  39. Edwards, S. Hip and Knee Surgeries. Available online: https://www.hipandkneesurgery.ie/ (accessed on 8 February 2022).
  40. Madry, H. Surgical therapy in osteoarthritis. Osteoarthr. Cartil. 2022, 30, 1019–1034. [Google Scholar] [CrossRef]
  41. Kellgren, J.H.; Lawrence, J.S. Radiological Assessment of Osteo-Arthrosis. Ann. Rheum. Dis. 1957, 16, 494–502. [Google Scholar] [CrossRef]
  42. Kohn, M.D.; Sassoon, A.A.; Fernando, N.D. Classifications in Brief: Kellgren-Lawrence Classification of Osteoarthritis. Clin. Orthop. Relat. Res. 2016, 474, 1886–1893. [Google Scholar] [CrossRef] [PubMed]
  43. Kraus, V.B.; McDaniel, G.; Huebner, J.L.; Stabler, T.V.; Pieper, C.F.; Shipes, S.W.; Petry, N.A.; Low, P.S.; Shen, J.; McNearney, T.A.; et al. Direct In Vivo evidence of activated macrophages in human osteoarthritis. Osteoarthr. Cartil. 2016, 24, 1613–1621. [Google Scholar] [CrossRef]
  44. Sofat, N.; Ejindu, V.; Heron, C.; Harrison, A.; Koushesh, S.; Assi, L.; Kuttapitiya, A.; Whitley, G.S.; Howe, F.A. Biomarkers in Painful Symptomatic Knee OA Demonstrate That MRI Assessed Joint Damage and Type II Collagen Degradation Products Are Linked to Disease Progression. Front. Neurosci. 2019, 13, 1016. [Google Scholar] [CrossRef]
  45. Serdar, C.C.; Cihan, M.; Yücel, D.; Serdar, M.A. Sample size, power and effect size revisited: Simplified and practical approaches in pre-clinical, clinical and laboratory studies. Biochem. Medica 2021, 31, 27–53. [Google Scholar] [CrossRef]
  46. BaHammam, A.S.; Almeneessier, A.S. Recent Evidence on the Impact of Ramadan Diurnal Intermittent Fasting, Mealtime, and Circadian Rhythm on Cardiometabolic Risk: A Review. Front. Nutr. 2020, 7, 28. [Google Scholar] [CrossRef]
  47. Hlaing, T.T.; Compston, J.E. Biochemical markers of bone turnover—Uses and limitations. Ann. Clin. Biochem. 2014, 51, 189–202. [Google Scholar] [CrossRef] [PubMed]
  48. Dığın, F.A.-O.; Kızılcık Özkan, Z.; Kalaycı, E. Intensive Care Experiences of Postoperative Patients. J. Patient Exp. 2022, 9, 23743735221092489. [Google Scholar] [CrossRef]
  49. Lee, S.-H.; Kao, C.-C.; Liang, H.-W.; Wu, H.-T. Validity of the Osteoarthritis Research Society International (OARSI) recommended performance-based tests of physical function in individuals with symptomatic Kellgren and Lawrence grade 0–2 knee osteoarthritis. BMC Musculoskelet. Disord. 2022, 23, 1040. [Google Scholar] [CrossRef] [PubMed]
  50. Choi, W.S.; Yang, J.I.; Kim, W.; Kim, H.E.; Kim, S.K.; Won, Y.; Son, Y.O.; Chun, C.H.; Chun, J.S. Critical role for arginase II in osteoarthritis pathogenesis. Ann. Rheum. Dis. 2019, 78, 421–428. [Google Scholar] [CrossRef] [PubMed]
  51. Kalogera, S.; Jansen, M.A.-O.; Bay-Jensen, A.A.-O.; Frederiksen, P.; Karsdal, M.A.; Thudium, C.S.; Mastbergen, S.C. Relevance of Biomarkers in Serum vs. Synovial Fluid in Patients with Knee Osteoarthritis. Int. J. Mol. Sci. 2023, 24, 9483. [Google Scholar] [CrossRef]
  52. Imamura, M.; Ezquerro, F.; Marcon Alfieri, F.; Vilas Boas, L.; Tozetto-Mendoza, T.R.; Chen, J.; Özçakar, L.; Arendt-Nielsen, L.; Rizzo Battistella, L.A.-O. Serum levels of proinflammatory cytokines in painful knee osteoarthritis and sensitization. Int. J. Inflamm. 2015, 2015, 329792. [Google Scholar] [CrossRef]
  53. Usher, K.M.; Zhu, S.; Mavropalias, G.; Carrino, J.A.; Zhao, J.; Xu, J. Pathological mechanisms and therapeutic outlooks for arthrofibrosis. Bone Res. 2019, 7, 9. [Google Scholar]
  54. Robinson, W.H.; Lepus, C.M.; Wang, Q.; Raghu, H.; Mao, R.; Lindstrom, T.M.; Sokolove, J. Low-grade inflammation as a key mediator of the pathogenesis of osteoarthritis. Nat. Rev. Rheumatol. 2016, 12, 580–592. [Google Scholar] [CrossRef]
  55. Silverwood, V.; Blagojevic-Bucknall, M.; Jinks, C.; Jordan, J.L.; Protheroe, J.; Jordan, K.P. Current evidence on risk factors for knee osteoarthritis in older adults: A systematic review and meta-analysis. Osteoarthr. Cartil. 2015, 23, 507–515. [Google Scholar] [CrossRef] [PubMed]
  56. Östlind, E.; Ekvall Hansson, E.; Eek, F.; Stigmar, K. Experiences of activity monitoring and perceptions of digital support among working individuals with hip and knee osteoarthritis—A focus group study. BMC Public Health 2022, 22, 1641. [Google Scholar] [CrossRef]
  57. Mabey, T.; Honsawek, S. Cytokines as biochemical markers for knee osteoarthritis. World J. Orthop. 2015, 6, 95–105. [Google Scholar] [CrossRef] [PubMed]
  58. Carlson, A.K.; Rawle, R.A.; Adams, E.; Greenwood, M.C.; Bothner, B.; June, R.K. Application of global metabolomic profiling of synovial fluid for osteoarthritis biomarkers. Biochem. Biophys. Res. Commun. 2018, 499, 182–188. [Google Scholar] [CrossRef] [PubMed]
  59. He, B.; Wu, J.P.; Kirk, T.B.; Carrino, J.A.; Xiang, C.; Xu, J. High-resolution measurements of the multilayer ultra-structure of articular cartilage and their translational potential. Arthritis Res. Ther. 2014, 16, 205. [Google Scholar] [CrossRef]
  60. Wu, J.P.; Swift, B.J.; Becker, T.; Squelch, A.; Wang, A.; Zheng, Y.C.; Zhao, X.; Xu, J.; Xue, W.; Zheng, M.; et al. High-resolution study of the 3D collagen fibrillary matrix of Achilles tendons without tissue labelling and dehydrating. J. Microsc. 2017, 266, 273–287. [Google Scholar] [CrossRef]
Figure 1. Comparative analysis of biomarker concentrations in patient and volunteer groups: serum vs. plasma. (A) IL-6, (B) TNF-α, and (C) MPO data presented as mean ± standard deviation (SD), with error bars representing the SD of the measurements.
Labmed 02 00008 g001
Disclaimer/Publisher’s Note: The statements, opinions and data contained in all publications are solely those of the individual author(s) and contributor(s) and not of MDPI and/or the editor(s). MDPI and/or the editor(s) disclaim responsibility for any injury to people or property resulting from any ideas, methods, instructions or products referred to in the content.

