Article

Performance Study of Anticoagulants and Animal Blood for Establishment of In Vitro Blood Circulation Loop System

Bio-Health Center (GLP), Korea Testing Certification Institute, Cheongju 28115, Republic of Korea
*
Author to whom correspondence should be addressed.
Submission received: 14 January 2025 / Revised: 7 March 2025 / Accepted: 2 April 2025 / Published: 16 April 2025

Abstract

:
Background: In vitro blood circulation loop systems are utilized to assess the hemocompatibility and performance of medical devices that come into contact with blood, in accordance with the international standards ASTM F1830 and ASTM F1841. However, a method for evaluating the specific type of anticoagulant and the blood characteristics of each animal species is necessary to ensure consistent and reliable results. Methods: Blood was collected from healthy rabbits, pigs, rhesus monkeys, and cynomolgus monkeys to evaluate whole blood preserved in anticoagulants (ACD-A, CPDA-1, and heparin). For each sample, red blood cells were monitored over time, and their morphological characteristics were documented. Results: The morphological grade of erythrocytes gradually decreased over time. Significant differences were observed based on the type of anticoagulant used in the experiment, and variations were noted among different animal species. Conclusions: The hemocompatibility of in vitro blood circulation loop systems may vary depending on the animal species. Observing erythrocyte morphology can serve as a control measure to ensure reproducible results.

1. Introduction

The international standard ASTM F1830 aims to provide a standardized method for collecting and preparing whole blood for the in vitro evaluation outlined in ASTM F1841: Assessment of Hemolysis in Continuous Flow Blood Pumps. The ASTM F1830 standard offers comprehensive guidelines for sourcing and preparing whole blood, including specifications regarding the range of experimental animals and types of anticoagulants used [1,2]. Although the applications of the ASTM F1841 standard have been reviewed and reported in the literature, significant deviations and poor reproducibility have been observed due to unstable data. Researchers have suggested that variations in blood properties and management practices can lead to inconsistent results [3]. Therefore, it is essential to systematically review the ASTM F1830 standard to further standardize and validate ASTM F1841 tests.
In the ASTM F1830 standard, it is strongly recommended to use large animals that can be collected in sufficient quantities as the target experimental subjects for whole blood [2]. While experimental animals are generally employed as substitutes for human blood, several studies have cautioned that differences in blood properties among animal species could lead to erroneous results during the dynamic in vitro evaluation of blood pumps using animal blood, ultimately jeopardizing patient safety [4]. The ASTM F1830 and ASTM F1841 standards specify ACD-A, CPDA-1, and heparin as anticoagulants for blood used to assess the in vitro hemolysis performance of clinical blood pumps [2]. However, detailed instructions for the use of each anticoagulant in individual tests are not provided. The use of different anticoagulants results in variations in blood characterization, and some studies reported that anticoagulants are one of the potential factors influencing in vitro hemolysis [5,6,7]. Therefore, it is crucial to verify the differences in blood preservability among various animal species and to ensure the accurate in vitro evaluation of continuous flow pumps.
The amount of ATP serves as an indicator for determining the quantity of normal red blood cells in preserved whole blood. ATP is closely related to the maintenance of erythrocyte morphology; when ATP levels decrease, the morphology of erythrocytes changes due to the dephosphorylation of spectrin, which subsequently reduces the number of normal erythrocytes [8]. Based on metabolic processes, a method was developed to observe the morphological changes in red blood cells using an optical microscope. In a previous study, the morphology score was calculated by categorizing the morphology of red blood cells into four groups, which serves as an index reflecting the survival rate of these cells [5,7]. Another study confirmed that the morphology score of preserved blood using the anticoagulant ACD showed a strong correlation with ATP levels in the blood, verifying that the morphology score could be effectively used as an indicator of preservation status [9]. In this study, erythrocyte morphology was considered an indicator of animal blood preservation to validate the method for collecting and preparing whole blood for the in vitro performance evaluation of clinical blood pumps, as specified in the international standard ASTM F1830. The morphological changes in erythrocytes were verified through observation with an optical microscope, and differences among four experimental animal blood samples preserved in three anticoagulants were compared.

2. Materials and Methods

2.1. Materials and Reagents

Acid citrate dextrose solution A (ACD-A) was purchased from CEPHAM Life Sciences (Fulton, MD, USA). Citrate phosphate dextrose solution with adenine (CPDA-1) and heparin were purchased from Sigma-Aldrich (St. Louis, MO, USA).

2.2. Blood Acquisition and Anticoagulant

Rabbit blood from healthy adult donors was obtained according to Institutional Review Board-approved protocols at the KTC. Porcine and monkey blood were purchased from the Korea National Primate Research Center of the Korea Research Institute of Bioscience and Biotechnology (KRIBB). Blood from each species was drawn into a blood collection container which contained a sufficient volume of anticoagulant, such as ACD-A (anticoagulant citrate dextrose solution A), CPDA-1 (citrate phosphate dextrose adenine anticoagulant solution), or heparin. The collected whole blood was mixed with an anticoagulant in a certain ratio in accordance with ASTM F1830. According to the standard ASTM F1830, the volume ratio of ACD-A solution to blood is approximately 1:5 to 1:8. The volume ratio of CPDA-1 solution to blood is approximately 1:7. Typical anticoagulation with heparin includes 4000 to 6000 USP units of heparin per liter of collected blood. On each test day, blood from a single donor was used for comparison of different anticoagulation conditions. Blood samples were stored in a refrigerator (2–4 °C) until testing. Since blood reactivity may vary between individual animals within the same species, tests were conducted using three animals for each species.

2.3. Observation of Red Blood Cells

Microscopic analyses of RBCs were performed using an Inverted Phase-Contrast Microscope (ECLIPSE Ts2; Nikon, Tokyo, Japan). Since red blood cells in blood are limited in observation under a microscope without staining, all cell types were used by diluting once with PBS solution. RBCs (10 μL) were resuspended in 990 μL PBS and transferred to a hemocytometer. Only normal RBCs (donut-shaped) were counted, and cell concentration was determined by multiplying the counted cells by the dilution factor. The morphology score was calculated as a percentage using the following equation:
M o r p h o l o g y   s c o r e = n N × 100 × D
where n is the number of viable cells, N is the total number of cells, and D is the dilution ratio of PBS solution. Quantified data were plotted with the morphology score curve, according to sampling time. Two slides were made per sample. To ensure inter-rater reliability, the slides were reviewed by two or more individuals [10,11].

2.4. Statistics

Statistical analyses were performed using two-way ANOVA, followed by Dunnett’s multiple comparisons test where appropriate, and the obtained values were recorded as mean ± standard deviation (SD). Differences were considered significant when p < 0.05.

3. Results

3.1. Comparison of Initial Erythrocyte Cell Number Among the Animal Species

The initial erythrocyte counts vary among different animal species. The average number of disc-shaped cells over time is presented in Table 1. The red blood cell count in rabbit blood was 5.0 × 10⁹ cells/mL, while in porcine blood, it was approximately 0.8 × 10⁹ cells/mL. The initial red blood cell counts for the two monkey species, the rhesus macaque and the cynomolgus macaque, were identified as 3.7 × 10⁹ cells/mL and 5.1 × 10⁹ cells/mL, respectively. The morphological scores of red blood cells differed significantly among the animal species (p-value < 0.05).

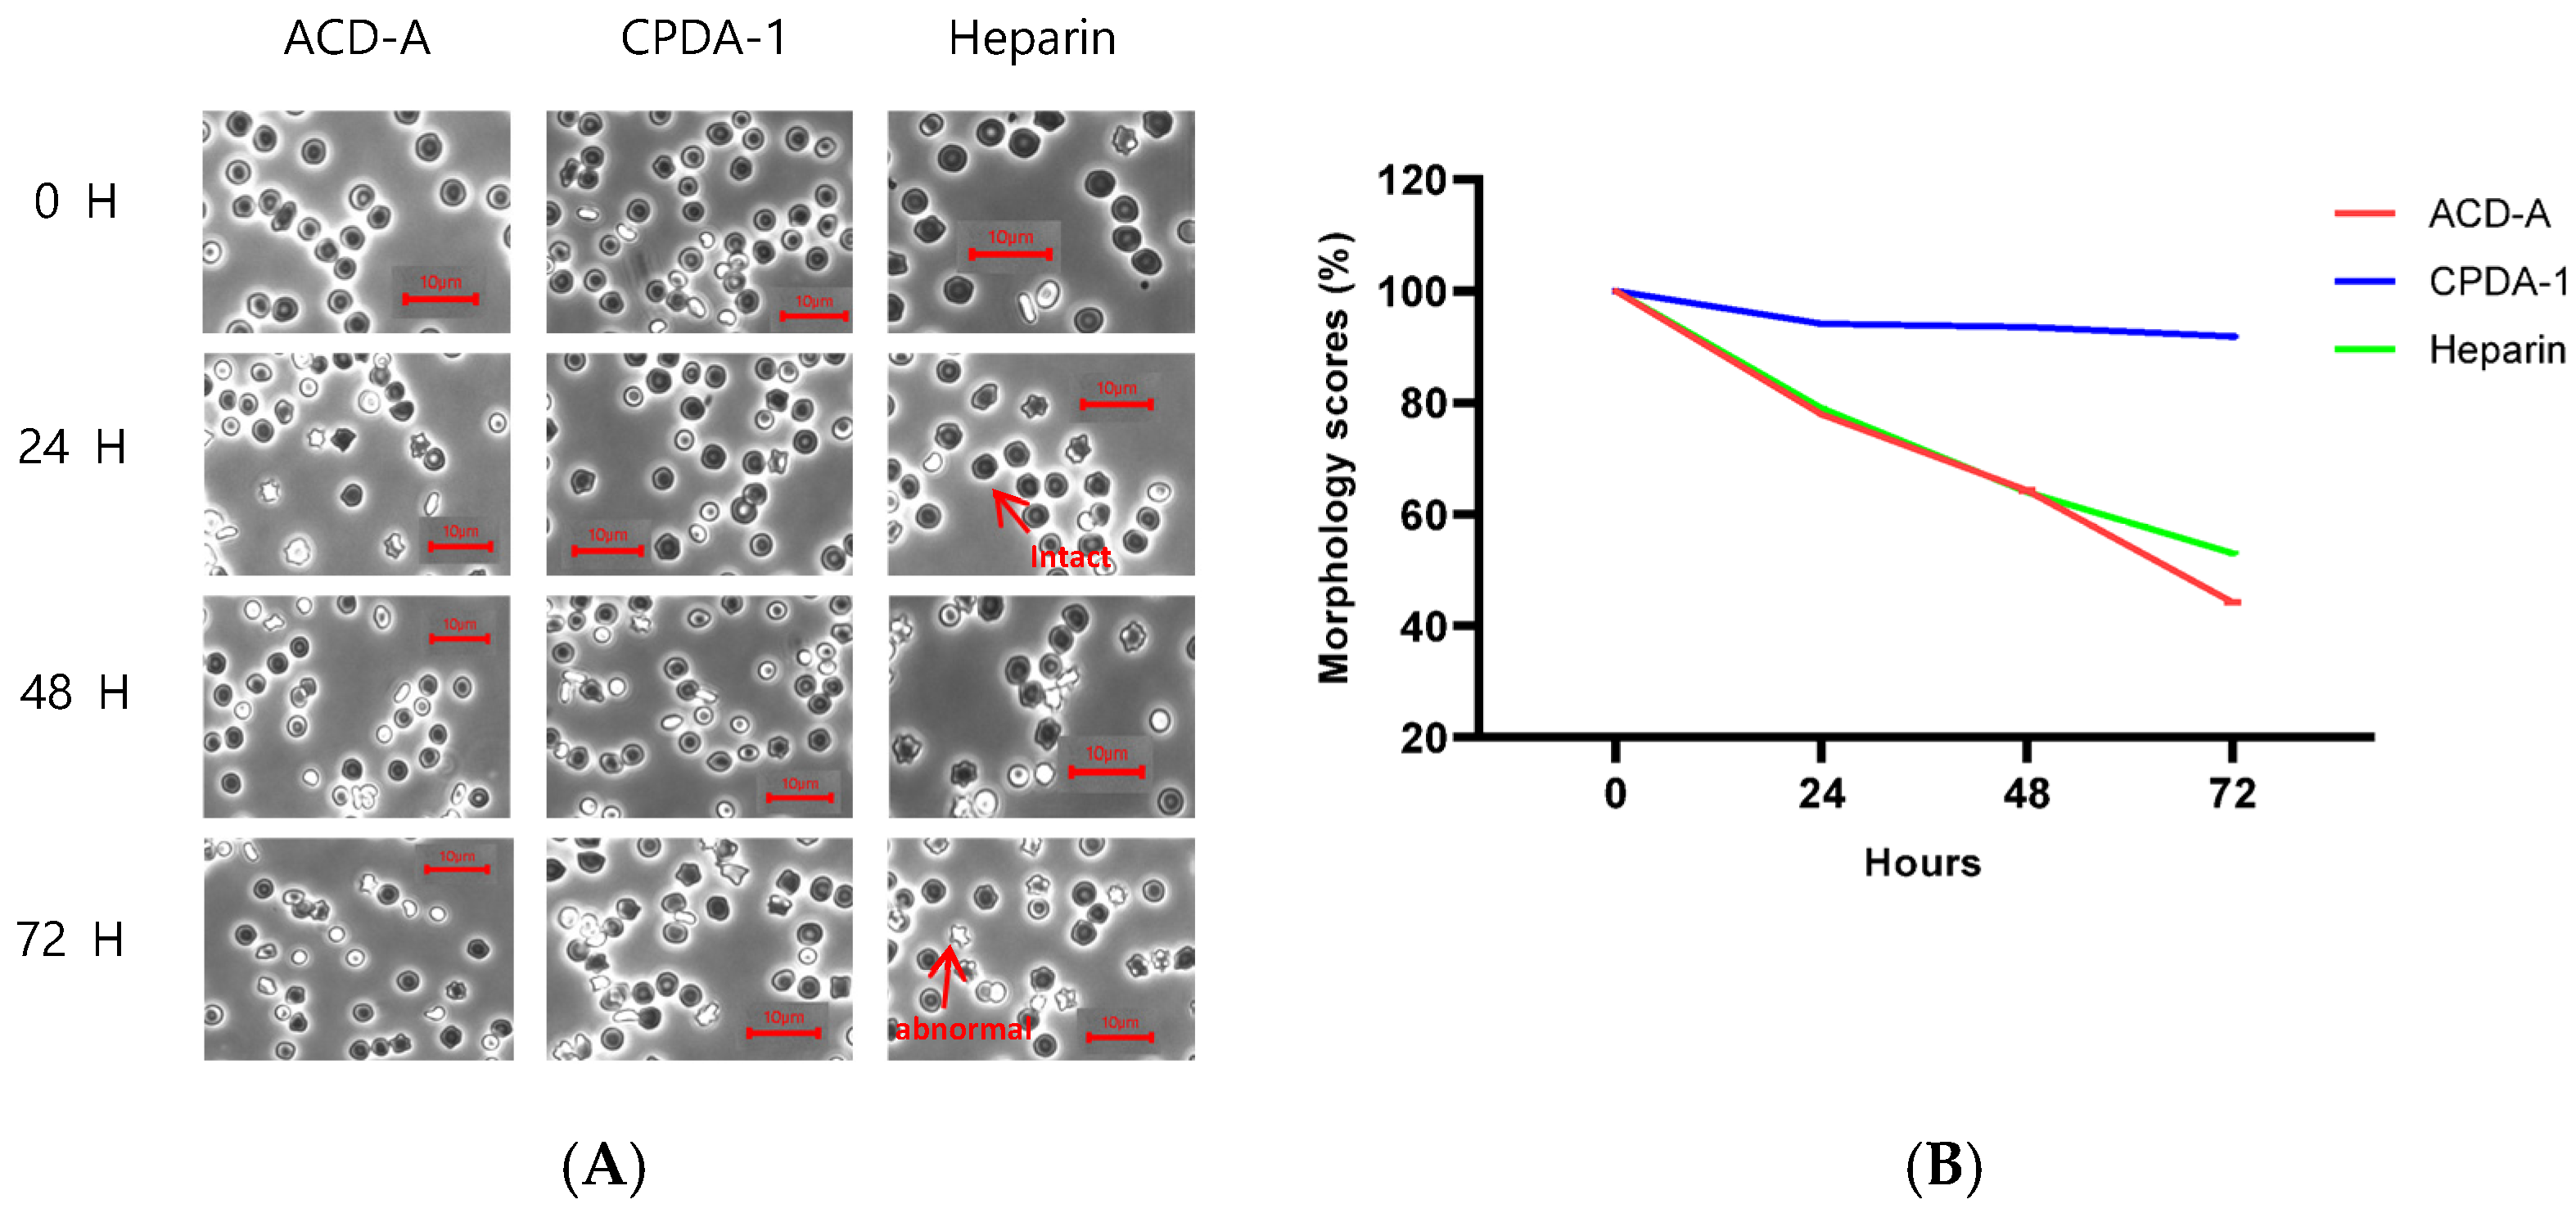
3.2. Morphology Score of Red Blood Cells in Rabbit

The morphological grade of rabbit erythrocytes gradually decreased over time, and the proportion of discocytes in rabbit blood varied depending on the anticoagulants used (Figure 1). In the ACD-A group, the number of discocytes decreased by 77.9% after 24 h, by more than 64.2% after 48 h, and by more than 44.2% after 72 h. Similarly, the morphology score of blood treated with heparin decreased over time from 79.6% to 53.8%. In the CPDA-1 group, the morphology score decreased from 94.2% after 24 h to a maximum of 91.9% after 72 h. This shows the survival rate (%) of cells over time. There was a significant difference in all anticoagulant groups (p < 0.05), and the CPDA-1 group exhibited a higher morphology score than the other two anticoagulants.

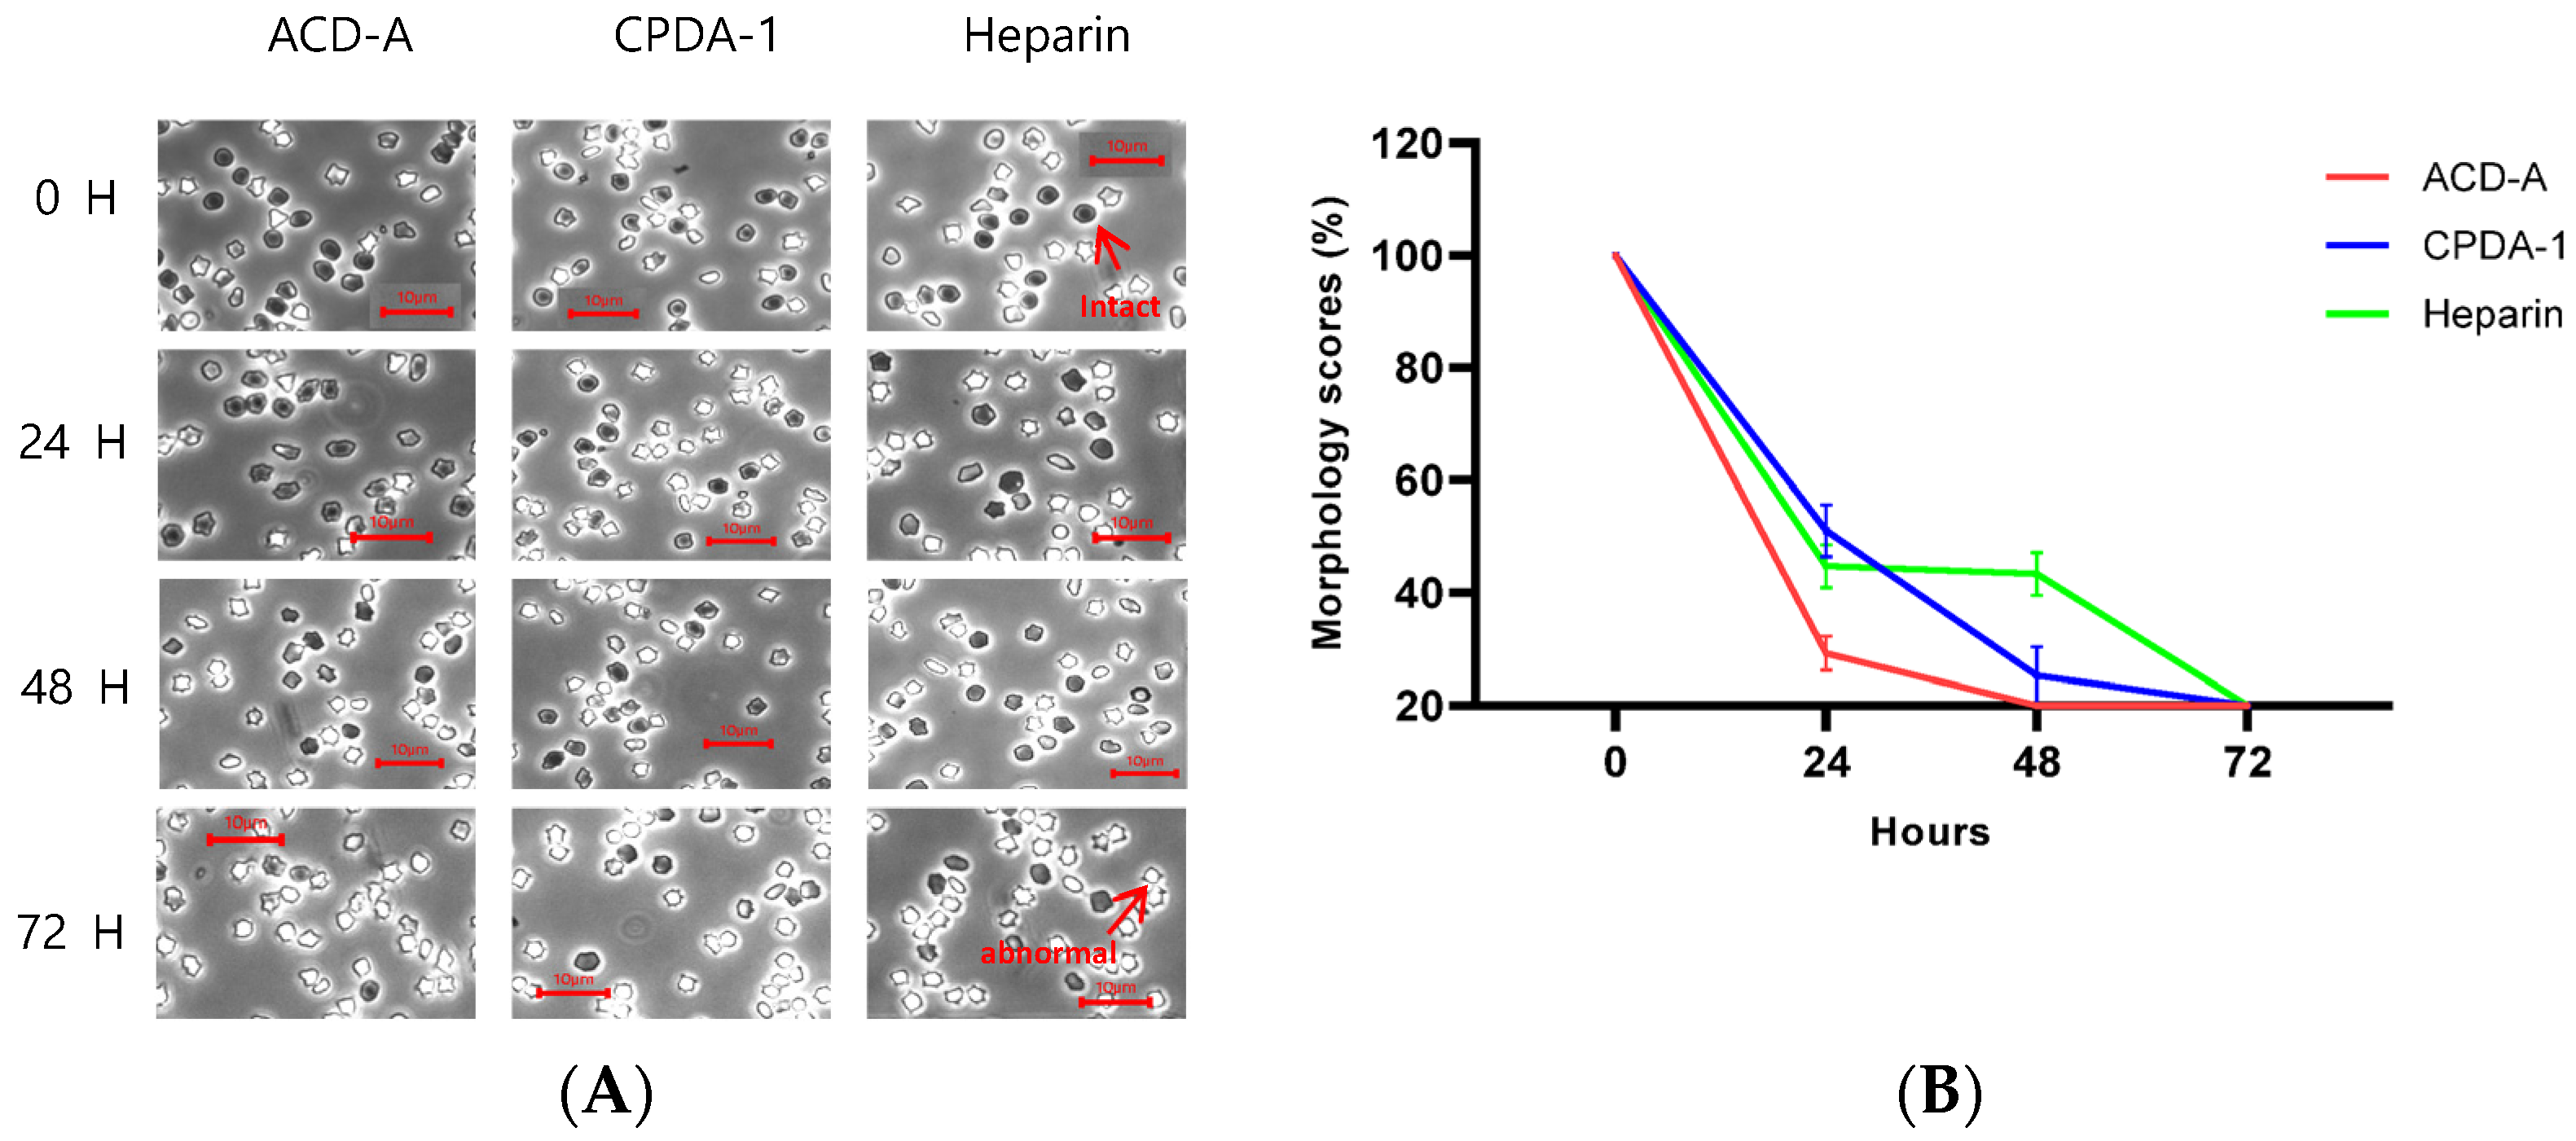
3.3. Morphology Score of Red Blood Cells in Pig

Porcine red blood cells have the following form: red blood cells often show artifactual crenation (sharp-pointed margins) with little to no central pallor and mild to moderate poikilocytosis. Therefore, only normal red blood cells were counted. The morphology scores of the porcine blood decreased rapidly with all anticoagulants (Figure 2). In the case of ACD-A, the morphology score was 29.2% after 24 h, 3.8% after 48 h, and 1.9% after 72 h. After 24 h, the decrease in discocytes was 51.0% in CPDA-1, followed by a reduction of 25.3% after 48 h and 6.3% after 72 h. For heparin, the morphology scores were 44.7%, 43.4%, and 7.3% at each respective time point. This shows the survival rate (%) of cells over time. Although all three anticoagulants exhibited a similar trend of decreasing morphology scores, there were significant differences only at 48 h (p < 0.05) among all anticoagulant groups.

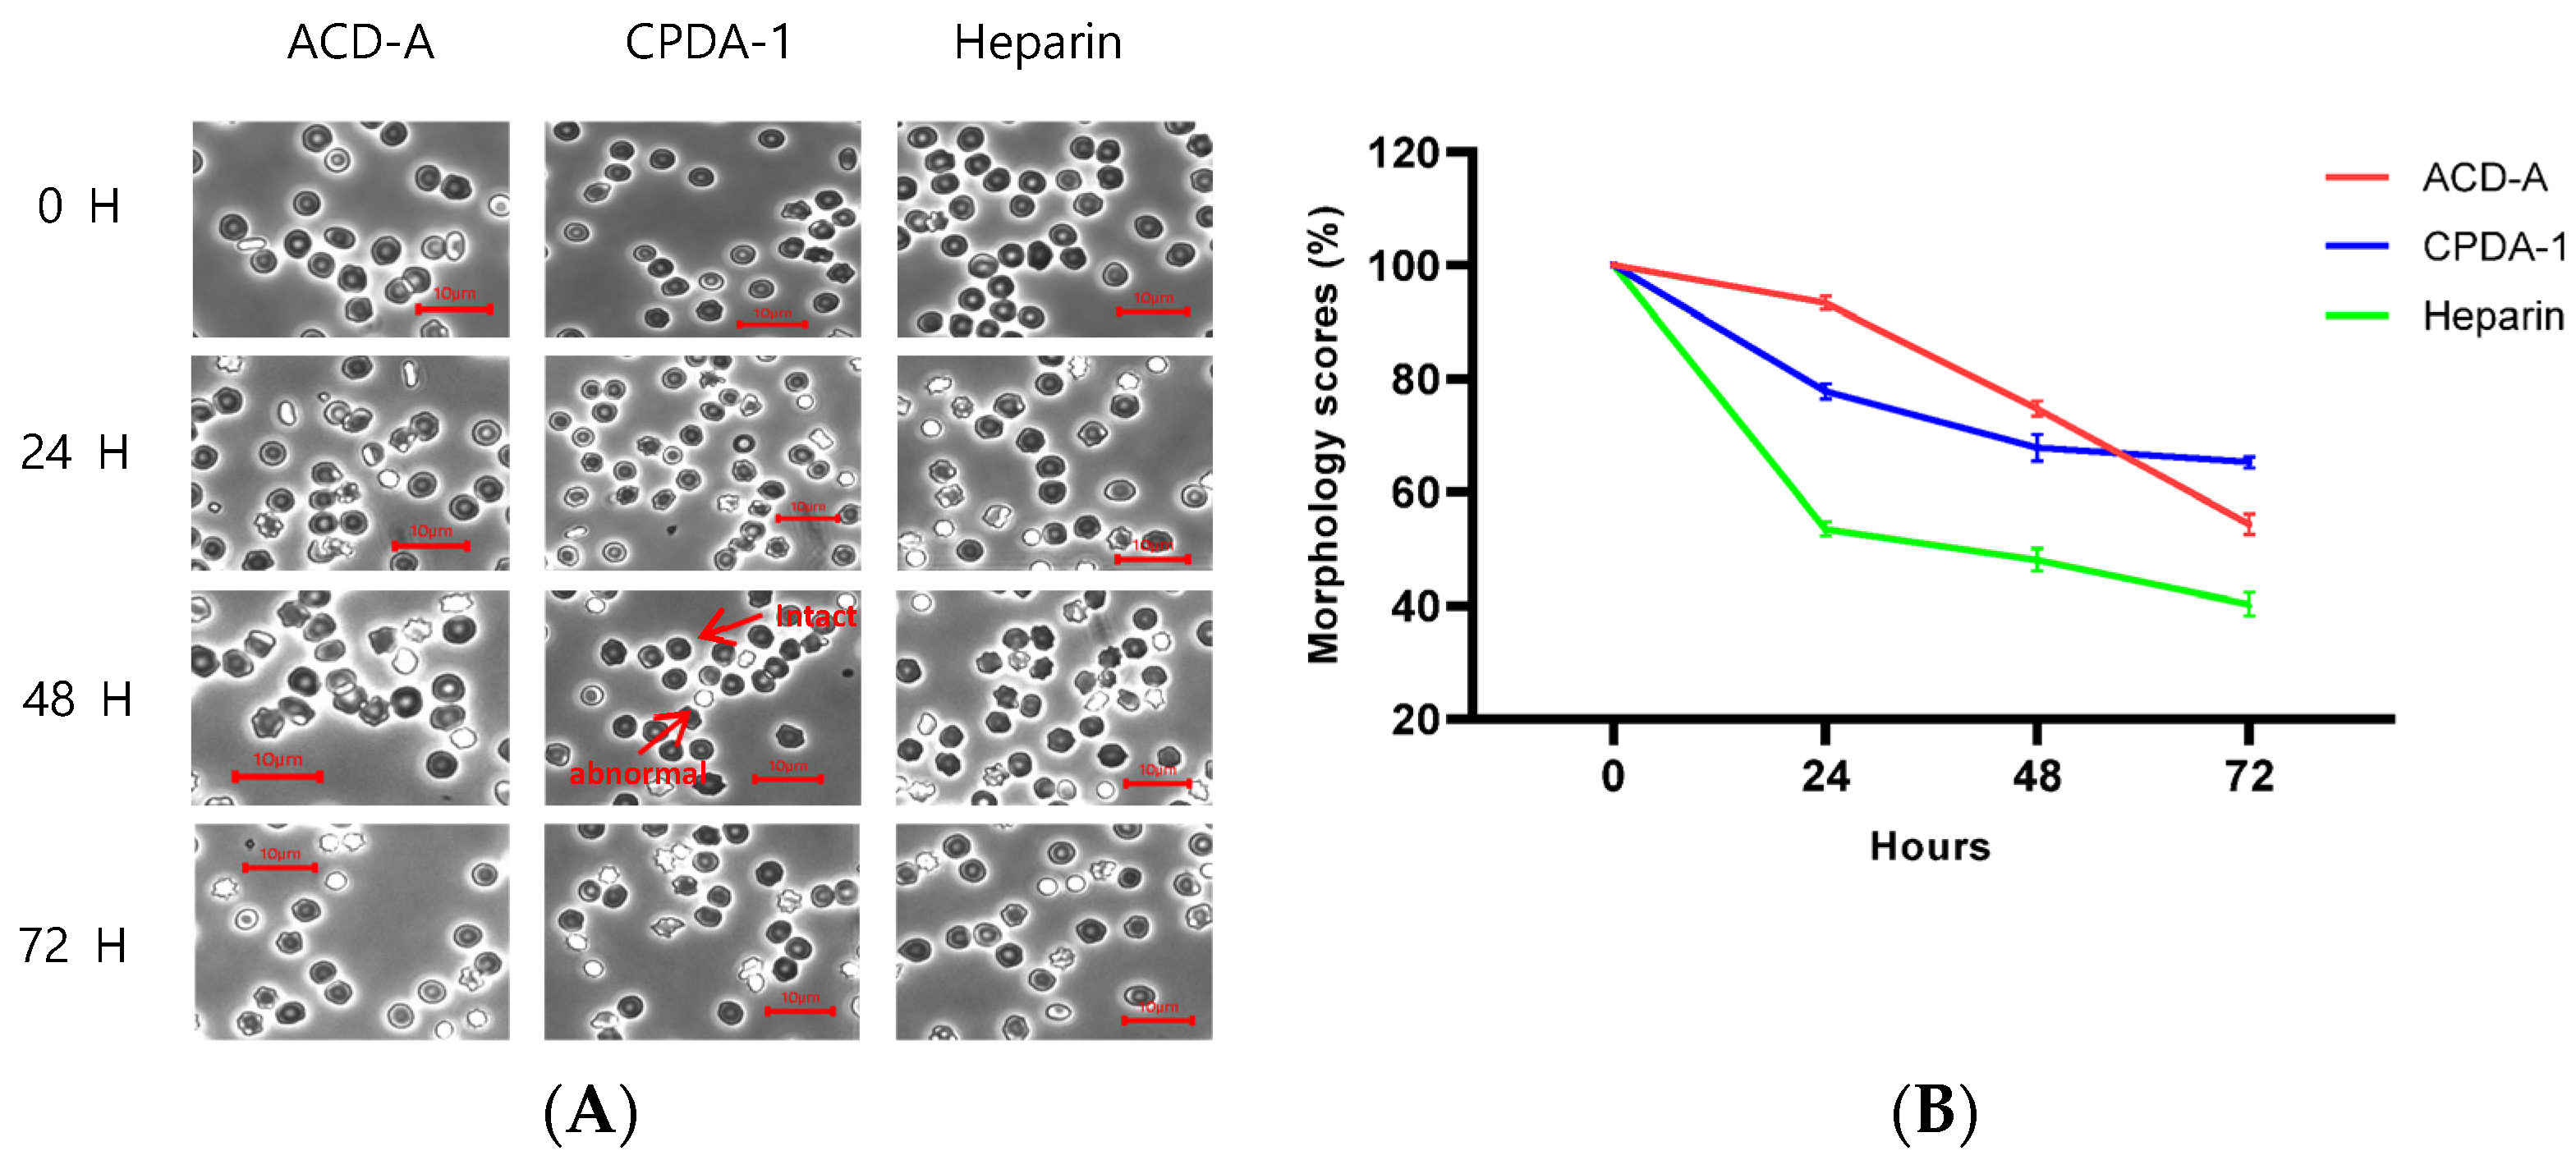
3.4. Morphology Score of Red Blood Cells in Rhesus Macaque

The discocyte count of rhesus macaques decreased by 93.3% after 24 h, 74.6% after 48 h, and 54.3% after 72 h in ACD-A. In the CPDA-1 anticoagulant, the decrease was measured at 77.7% after 24 h, 67.7% after 48 h, and 65.1% after 72 h. In the case of heparin, the reductions were 53.4% after 24 h, 48.0% after 48 h, and 40.2% after 72 h (Figure 3). This shows the survival rate (%) of cells over time. The blood of rhesus macaques showed a significant difference in all anticoagulant groups (p < 0.05).

3.5. Morphology Score of Red Blood Cells in Cynomolgus Macaque

In the ACD-A group, the number of discocytes in cynomolgus macaques decreased by 86.3% after 24 h, 86.7% after 48 h, and 86.2% after 72 h. In contrast, the reduction rate in the CPDA-1 group was 66.4% after 24 h, 65.6% after 48 h, and 65.0% after 72 h. The heparin anticoagulant exhibited a reduction of 82.5% after 24 h, 80.8% after 48 h, and 79.4% after 72 h (Figure 4). This shows the survival rate (%) of cells over time. The discocyte ratio in cynomolgus macaques showed a significant difference in all anticoagulant groups (p < 0.05).

4. Discussion

Generally, the red blood cell count in blood is measured using an automatic blood cell analyzer, which evaluates the number and size of erythrocytes through optical absorbance or the impedance of an electrical circuit. Although automated red blood cell counting can distinguish between schistocytes and reticulocytes and normal cells by analyzing the volume and refractive index of erythrocytes, it has a limitation in accuracy due to the fact that the shape factor of the blood cells is not taken into account [12]. The peripheral blood smear (PBS) test involves spreading peripheral blood onto glass slides to observe blood cells under a microscope. This test is necessary when qualitative and quantitative flags are identified in a complete blood count (CBC) [13].
The Bessis classification has served as a morphological classification system for erythrocytes since the 1970s and has suggested the utility of optical methods for measuring red blood cell (RBC) deformability [14,15]. Additionally, studies on erythrocyte damage caused by blood pumps have utilized scanning electron microscopy (SEM), while erythrocyte morphology index (MI) studies have employed phase-contrast microscopy. These studies were based on the observation and counting of erythrocyte morphology [16,17]. Electron microscopy has, for the first time, enabled the visualization of the organization of the red blood cell (RBC) cytoskeleton. However, the sample preparation required for this technique can compromise the integrity of the specimen and alter its structure. Consequently, practical studies have employed atomic force microscopy to visualize blood cells and investigate cell membranes [18,19]. Atomic force microscopy (AFM) is a cutting-edge technology used to study the morphology and biomechanical properties of blood components. Due to its validated feasibility and reliability, AFM is used to investigate the mechanical properties of different living cells qualitatively and quantitatively [20]. A discocyte is a donut-shaped, biconcave red blood cell that possesses an optimal surface area for the function and circulation of hemoglobin [21]. When hemolysis begins in stored blood, the membranes of red blood cells undergo changes, causing discocytes to transform into echinocytes and subsequently into spherocytes [22]. As a result, the number of discocytes in the blood decreases. However, spherocytes may perform their functions despite shape changes. Therefore, screening the proportion of discocytes among total red blood cells can serve as a straightforward method for estimating the preservation of stored blood.
In this study, a simple enumeration method using discocytes as the standard form of normal red blood cells was employed to compare the effects of anticoagulants in the blood of different animal species. The international standard ASTM F1830 specifies citrate dextrose solution A (ACD-A), citrate phosphate dextrose adenine solution (CPDA-1), and heparin as anticoagulants for the collection and preparation of blood samples in dynamic in vitro hemolysis evaluations of blood pumps [2]. Anticoagulants are substances that extend the clotting time by inhibiting or reducing blood coagulation. A few previous studies have suggested that the type of anticoagulant can affect various hematological characteristics, such as platelet activation and hemolysis [23,24]. To further standardize and validate the ASTM F1841 test, the applicability of a simple counting method using normal red blood cell morphology was examined to determine the effect of anticoagulants in blood from different animal species. This study observed differences in the reduction rate of discocytes based on the type of anticoagulant used, and the sensitivity of the anticoagulant varied over time for each experimental animal. The morphology of erythrocytes, particularly in porcine blood, exhibited distinct characteristics depending on the animal species, and the initial number of discocytes also varied among species.
The effect of anticoagulants was observed in blood from rabbits, pigs, rhesus monkeys, and cynomolgus monkeys using citrate dextrose solution A (ACD-A), citrate phosphate dextrose adenine solution (CPDA-1), and heparin. The absolute value of changes in normal red blood cell morphology in blood from rabbits, pigs, and primates in response to anticoagulants showed differences among animals. Although there are differences between animals, the normalized values—64% for rabbits, 3.8% for pigs, 74% for rhesus monkeys, and 86% for cynomolgus monkeys—appeared 48 h after blood collection.
The effect of anticoagulants indicates that the reactivity differs between species and provides important clues in the interpretation of the results of preclinical testing of blood-contacting medical devices and in the design of experiments. In addition, when substituting human blood with animal blood, it is essential to consider the properties of the animal blood and the type of anticoagulant used as critical variables for obtaining reliable experimental data in hemocompatibility testing. This study aims to provide insights into the differences in anticoagulant-based blood preservation techniques for whole blood collection and preparation, in accordance with the ASTM F1830-19 evaluation standards. Based on this information, hemolysis can be assessed in an in vitro blood circulation loop system using suitable anticoagulants and blood from various animal species, as outlined in the international standard ASTM F1841-19 [25].

5. Conclusions

It is usually specified in standards that blood tests should start within 4 h of blood collection [26]. Due to such conditions, tests using human blood have limitations in confirming repeatability. For this reason, animal blood is used instead of human blood in many in vitro blood reaction studies. This study suggests that the intrinsic properties of blood in different animal species, as well as the choice of anticoagulants, indicate variations in blood preservability. Using different anticoagulants or blood from various animal species may lead to inaccurate results in the evaluation of hemolysis within the in vitro blood circulation loop system described in the international standard ASTM F1841. Such inaccuracies could have adverse effects that may seriously threaten the safety of medical device users. Therefore, when selecting animal blood to replace human blood for evaluating the blood compatibility of medical devices, it is essential to consider the blood properties of each experimental animal and the type of anticoagulant used. Observing the morphology of erythrocytes is a convenient method for estimating blood integrity and can serve as a primary preventive measure to minimize data variation in hemolysis evaluations of blood pumps by screening the preservation state of the blood. This study confirmed that observing the morphological changes in red blood cells using an optical microscope can be an effective evaluation method for blood compatibility tests as a pre-evaluation.

Author Contributions

J.K. performed most of the in vitro experiments and wrote the original draft. J.K. and T.K. analyzed the final data and edited the final manuscript. All authors have read and agreed to the published version of the manuscript.

Funding

This research was supported by a grant (21174MFDS242) from the Ministry of Food and Drug Safety in 2022.

Institutional Review Board Statement

The animal study protocol was approved by the Institutional Review Board of the Futuristic Animal Resource and Research Center (FARRC-220401), the Korea Research Institute of Bioscience and Biotechnology (KRIBB) Institutional Animal Care and Use Committee (NPRC-220401), and the Korea Testing Certification Institutional Animal Care and Use Committee (Protocol-ETCS-02). Approved date: 12 April 2022.

Informed Consent Statement

Not applicable.

Data Availability Statement

Data are contained within the article.

Acknowledgments

We thank everyone who helped.

Conflicts of Interest

Authors, Jeonghwa Kim and Taewon Kim, is currently employed as a researchers and center di-rectors, respectively, at Korea Testing Certification Institute. J.K. and T.K. received research grants (21174MFDS242) from the Ministry of Food and Drug Safety in 2022. The authors declare no conflicts of interest.

References

  1. ASTM F1841-19; Standard Practice for Assessment of Hemolysis in Continuous Flow Blood Pumps. ASTM: West Conshohocken, PA, USA, 2019. [CrossRef]
  2. ASTM F1830-19; Standard Practice for Collection and Preparation of Blood for Dynamic in vitro Evaluation of Hemolysis in Blood Pumps. ASTM: West Conshohocken, PA, USA, 2019. [CrossRef]
  3. von Petersdorff-Campen, K.; Daners, M.S. Hemolysis Testing In Vitro: A Review of Challenges and Potential Improvements. ASAIO J. 2022, 68, 3–13. [Google Scholar] [CrossRef] [PubMed]
  4. Ding, J.; Niu, S.; Chen, Z.; Zhang, T.; Griffith, B.P.; Wu, Z.J. Shear-Induced Hemolysis: Species Differences. Artif. Organs 2015, 39, 795–802. [Google Scholar] [CrossRef] [PubMed]
  5. Ohkuma, S.; Uda, M. Effectiveness of a morphology score as an index of the storage condition of red blood cells. Jpn. J. Transfus. Cell Ther. 1986, 32, 523–527. [Google Scholar]
  6. Chan, C.H.H.; Ki, K.K.; Zhang, M.; Asnicar, C.; Cho, H.J.; Ainola, C.; Bouquet, M.; Heinsar, S.; Pauls, J.P.; Li Bassi, G.; et al. Extracorporeal membrane oxygenation-induced hemolysis: An in vitro study to appraise causative factors. Membranes 2021, 11, 313. [Google Scholar] [CrossRef]
  7. Uda, M.; Ohkuma, S.; Ishii, A.; Nishizaki, T. Preparation of blood components with saline-adenine-glucose-phosphate-maltose quadruple-pack system. Transfusion 1985, 25, 325–329. [Google Scholar] [CrossRef]
  8. Gov, N.S.; Safran, S.A. Red blood cell membrane fluctuations and shape controlled by ATP-induced cytoskeletal defects. Biophys. J. 2005, 88, 1859–1874. [Google Scholar] [CrossRef]
  9. Choi, T.Y.; Kim, W.B.; Kang, D.Y.; Oh, Y.C.; Cho, M.J. Study on Effectiveness of a Morphology Score as an Index of the Storage Condition of Red Blood Cells Preserved with ACD. Korean J. Hematol. 1988, 23, 35–42. [Google Scholar]
  10. Vierordt, K. Neue methode der quantitativen mikroskopischen Analyse des Blutes. Arch. Physiol. Heilk. 1852, 26, 9. [Google Scholar]
  11. Vierordt, K. Zählungen der Blutkörperchen des Menschen. Arch. Physiol. Heilk. 1852, 26, 327. [Google Scholar]
  12. Lesesve, J.-F.; Salignac, S.; Alla, F.; Defente, M.; Benbih, M.; Bordigoni, P.; Lecompte, T. Comparative evaluation of schistocyte counting by an automated method and by microscopic determination. Am. J. Clin. Pathol. 2004, 121, 739–745. [Google Scholar] [CrossRef]
  13. Deline, S.; Schatz, T.; Grove, K.; Howard, S.; Smith, M. Development of a Novel Positive Control for the Standard Test Method for the Platelet Leukocyte Assay: An In Vitro Hemocompatibility Assessment of Blood-Contacting Medical Devices. J. Med. Device 2016, 10, 020909. [Google Scholar] [CrossRef]
  14. Bessis, M. Erythrocyte form and deformability for normal blood and some hereditary hemolytic anemias (author’s transl). Nouv. Rev. Française D’hématologie Blood Cells 1977, 18, 75–94. [Google Scholar]
  15. Bessis, M.; Feo, C.; Jones, E. Quantitation of red cell deformability during progressive deoxygenation and oxygenation in sickling disorders (the use of an automated Ektacytometer). Blood Cells 1982, 8, 17–28. [Google Scholar]
  16. Putter, J.S.; Seghatchian, J. Cumulative erythrocyte damage in blood storage and relevance to massive transfusions: Selective insights into serial morphological and biochemical findings. Blood Transfus. 2017, 15, 348. [Google Scholar] [PubMed]
  17. Calzavara, P.; de Angeli, S.; Nieri, A.; Furlan, C.; Bolzonella, R.; da Porto, A. Alterations in erythrocyte morphology induced by blood pumps. Int. J. Artif. Organs 1993, 16, 653–658. [Google Scholar] [CrossRef]
  18. Byers, T.J.; Branton, D. Visualization of the protein associations in the erythrocyte membrane skeleton. Proc. Natl. Acad. Sci. USA 1985, 82, 6153–6157. [Google Scholar] [CrossRef]
  19. Liu, F.; Burgess, J.; Mizukami, H.; Ostafin, A. Sample Preparation and Imaging of Erythrocyte Cytoskeleton with the Atomic Force Microscopy. Cell Biochem. Biophys. 2003, 38, 251–270. [Google Scholar] [CrossRef]
  20. Chen, X.; Feng, L.; Jin, H.; Feng, S.; Yu, Y. Quantification of the erythrocyte deformability using atomic force microscopy: Correlation study of the erythrocyte deformability with atomic force micros-copy and hemorheology. Clin. Hemorheol. Microcirc. 2009, 43, 243–251. [Google Scholar] [CrossRef] [PubMed]
  21. Delves, P.J.; Roitt, I.M. Encyclopedia of Immunology; Academic Press: Cambridge, MA, USA, 1998. [Google Scholar]
  22. Bessis, M. Erythrocytic series. In Blood Smears Reinterpreted; Springer: Berlin/Heidelberg, Germany, 1977; pp. 25–104. [Google Scholar]
  23. Chalmers, C.; Russell, W.J. When does blood haemolyse?: A temperature study. BJA Br. J. Anaesth. 1974, 46, 742–746. [Google Scholar] [CrossRef]
  24. Golański, J.; Pietrucha, T.; Baj, Z.; Greger, J.; Watala, C. Molecular insights into the anticoagulant-induced spontaneous activation of platelets in whole blood-various anticoagulants are not equal. Thromb. Res. 1996, 83, 199–216. [Google Scholar] [CrossRef]
  25. Kim, J.; Kim, T.; Kim, S.; Eom, J.; Kim, T. Effectiveness of Erythrocyte Morphology Observation as an Indicator for the Selection and Qualification of Blood in a Mechanically Induced Hemolysis Test. Appl. Sci. 2024, 14, 4695. [Google Scholar] [CrossRef]
  26. ISO 10993-4; Biological Evaluation of Medical Devices—Part 4: Selection of Tests for Interactions with Blood. The International Organization for Standardization (ISO): Arlington, TX, USA, 2017.
Figure 1. Red blood cell observation in rabbit. (A) Light microscopy observations of untreated red blood cells (scale bar: 10 µm). (B) The percentages of morphologically intact red blood cells over time.
Labmed 02 00007 g001
Figure 2. Red blood cell observation in pig (Sus scrofa). (A) Light microscopy observations of untreated red blood cells (scale bar: 10 µm). (B) The percentages of morphologically intact red blood cells over time.
Labmed 02 00007 g002
Figure 3. Red blood cell observation in rhesus macaque. (A) Light microscopy observations of untreated red blood cells (scale bar: 10 µm). (B) The percentages of morphologically intact red blood cells over time.
Labmed 02 00007 g003
Figure 4. Red blood cell observation in cynomolgus macaque. (A) Light microscopy observations of untreated red blood cells (scale bar: 10 µm). (B) The percentages of morphologically intact red blood cells over time.
Labmed 02 00007 g004
Table 1. Counts of red blood cells stored in various anticoagulants (× 109 cell/mL).
Day of Storage
0 H24 H48 H72 H
ACD-ARabbit5.504.293.542.43
Porcine0.860.260.030.02
Rhesus3.553.342.661.94
Cynomolgus4.513.973.953.89
CPDA-1Rabbit4.934.644.614.53
Porcine0.800.400.210.05
Rhesus3.072.372.132.00
Cynomolgus6.584.424.374.34
HeparinRabbit4.463.552.862.40
Porcine0.860.380.370.06
Rhesus4.462.422.141.81
Cynomolgus4.063.343.313.23
Disclaimer/Publisher’s Note: The statements, opinions and data contained in all publications are solely those of the individual author(s) and contributor(s) and not of MDPI and/or the editor(s). MDPI and/or the editor(s) disclaim responsibility for any injury to people or property resulting from any ideas, methods, instructions or products referred to in the content.

