
A Data Analysis of the Relationship Between Life Quality Indicators and the Real Estate Market in Italian Provincial Capitals


 ,
,  ,
,  and
and 
Abstract
1. Introduction
2. Aims
3. Literature Review
4. Case Study
4.1. Methodology
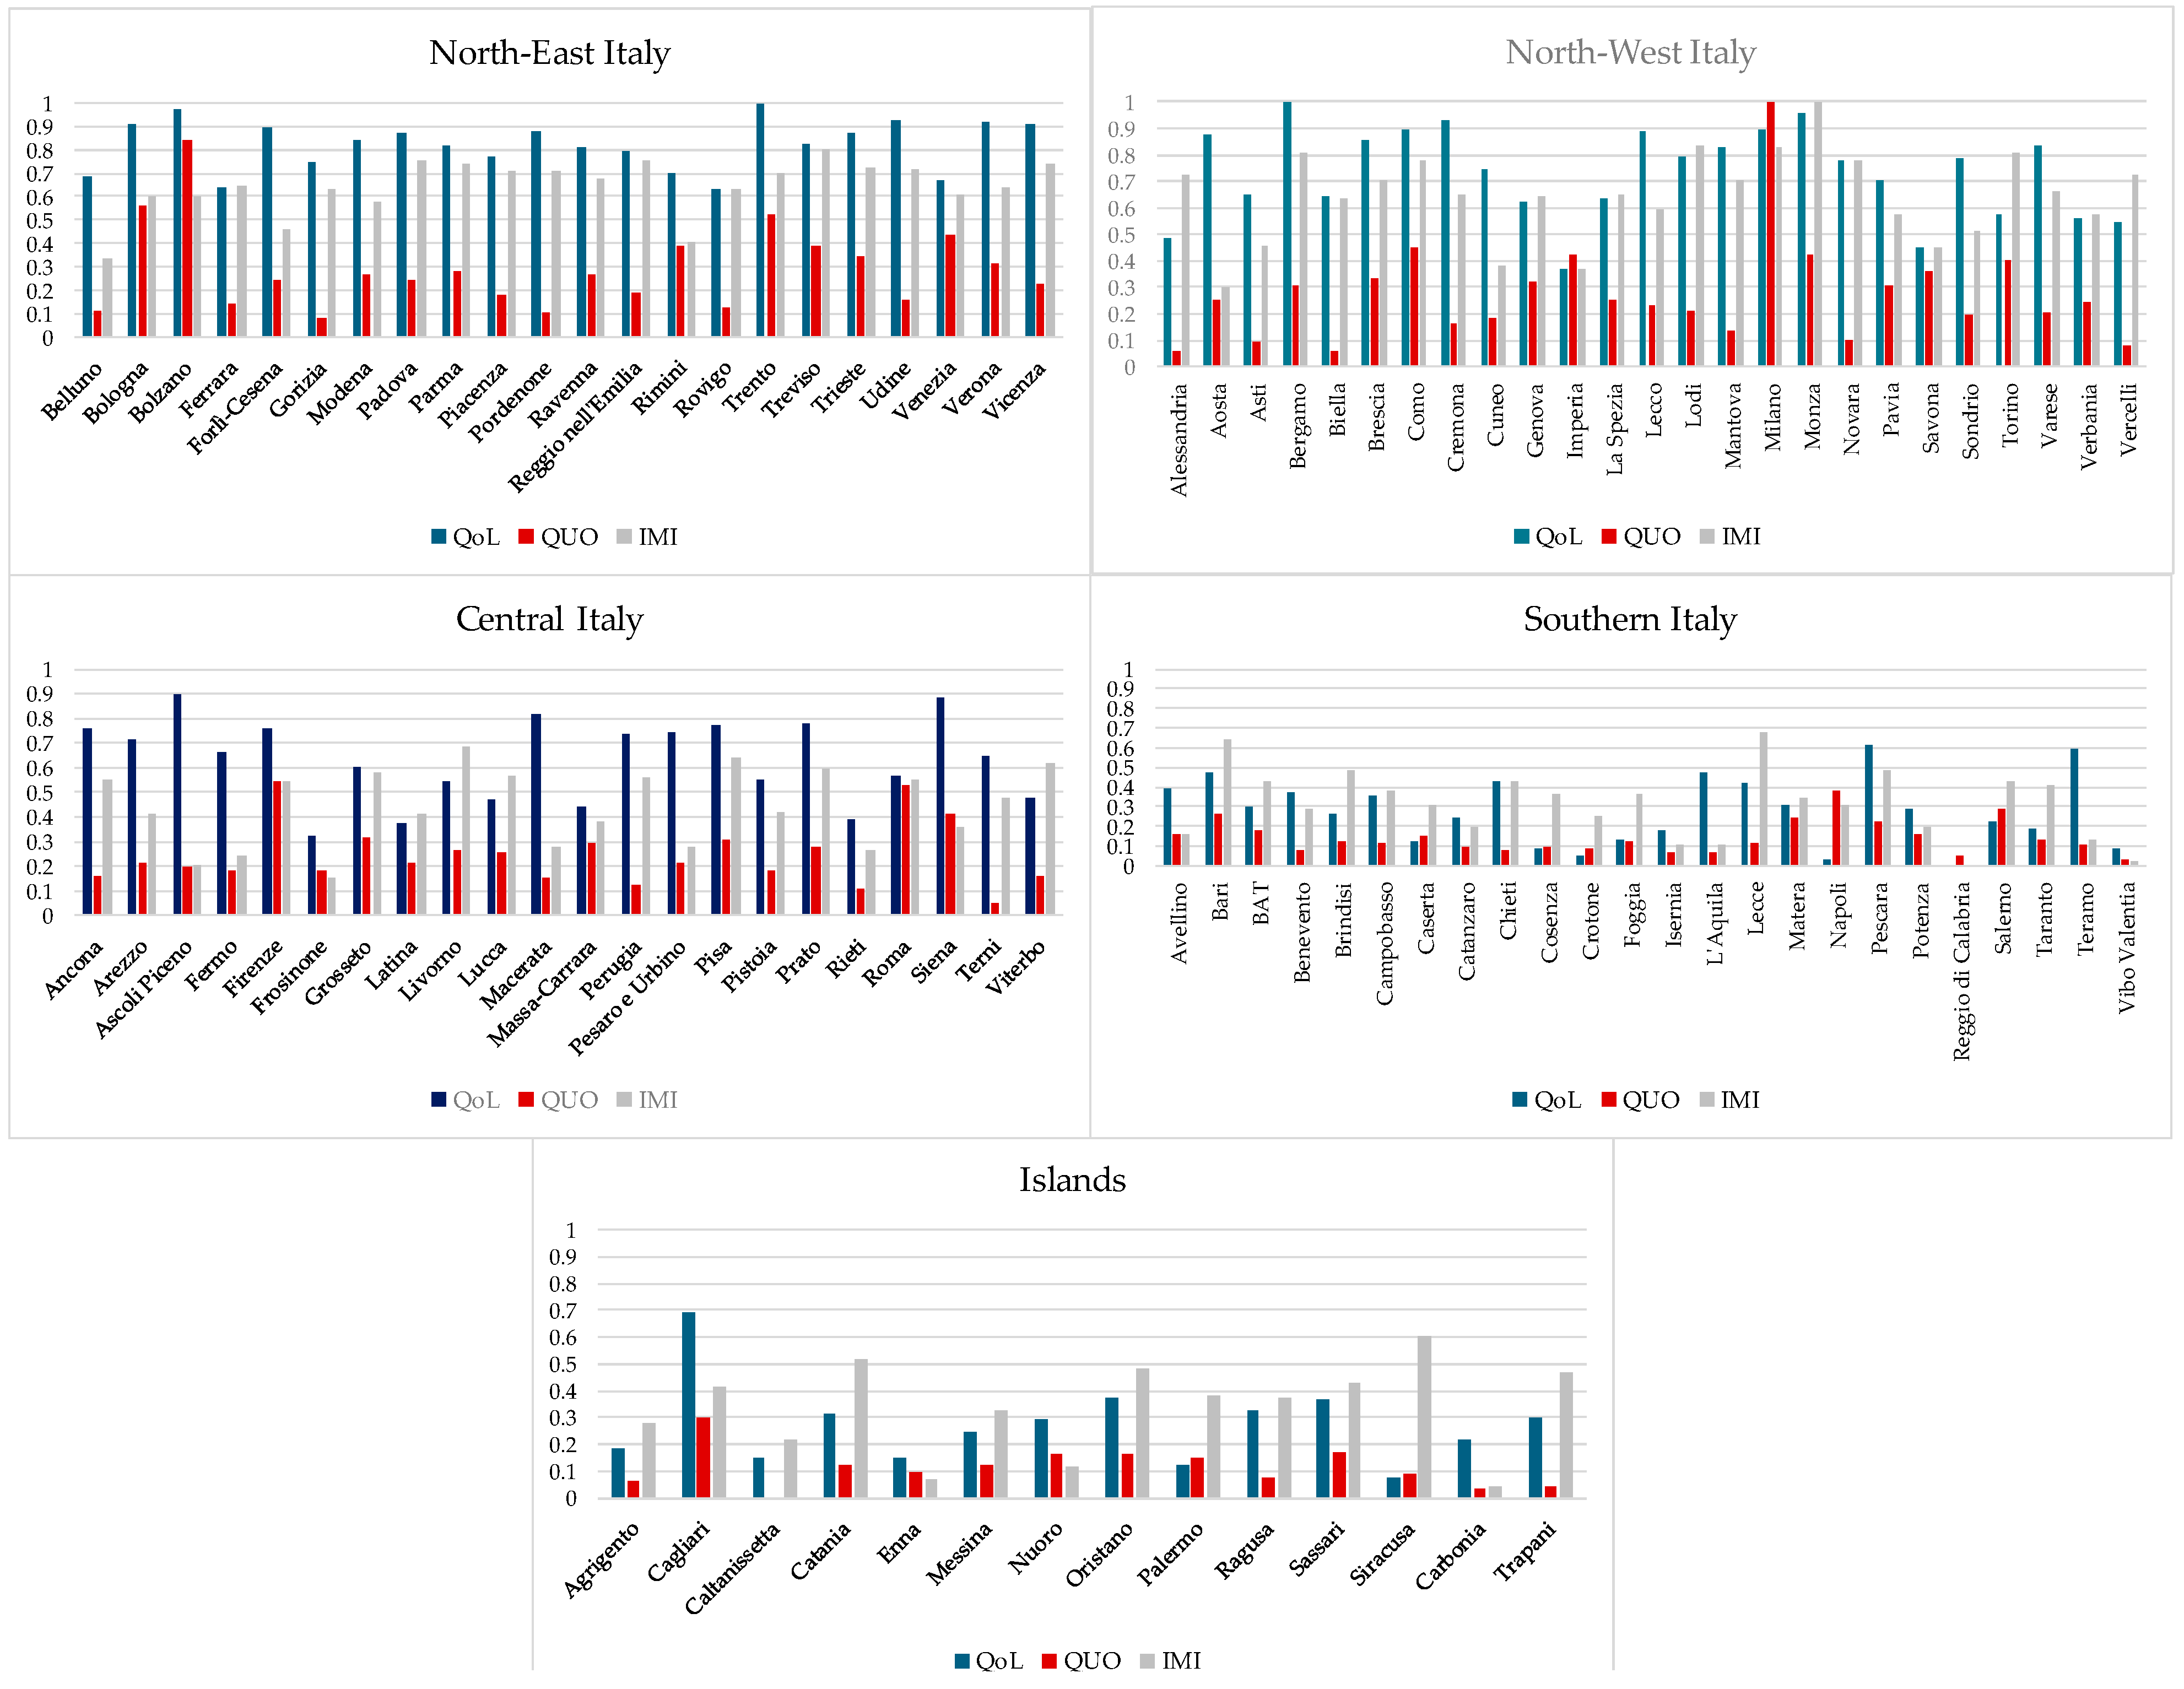
4.2. Results
5. Conclusions
Supplementary Materials
Author Contributions
Funding
Institutional Review Board Statement
Informed Consent Statement
Data Availability Statement
Conflicts of Interest
References
- Ludlow, D. Ensuring Quality of Life in Europe’s Cities and Towns—Tackling the Environmental Challenges Driven by European and Global Change; European Environment Agency: Copenhagen, Denmark, 2009. [Google Scholar]
- Lambiri, D.; Biagi, B.; Royuela, V. Quality of life in the economic and urban economic literature. Soc. Indic. Res. 2007, 84, 1–25. [Google Scholar] [CrossRef]
- Dissart, J.C.; Deller, S.C. Quality of life in the planning literature. J. Plan. Lit. 2000, 15, 135–161. [Google Scholar] [CrossRef]
- Giannias, D.; Liargovas, P.; Manolas, G. Quality of life indices for analysing convergence in the European Union. Reg. Stud. 1999, 33, 27–35. [Google Scholar] [CrossRef]
- Moreno, R.; Royuela, V.; Vaya, E. Monitoring the Lisbon strategy’s targets. Investig. Reg. 2005, 7, 155–192. [Google Scholar]
- Rogerson, R.J. Quality of life and city competitiveness. Urban Stud. 1999, 36, 969–985. [Google Scholar] [CrossRef]
- Hall, P. Towards a general urban theory. In Cities in Competition: Productive and Sustainable Cities for the 21st Century; Brotchie, J., Batty, M., Blakely, E., Hall, P., Newton, P., Eds.; Longman: Melbourne, Australia, 1995; pp. 3–31. [Google Scholar]
- Shin, D.C.; Rutkowski, C.P.; Park, C.M. The Quality of Life in Korea: Comparative and Dynamic Perspectives. Social Indicators Research Series; Springer: Berlin/Heidelberg, Germany, 2003. [Google Scholar]
- D’Acci, L. A mathematical aid for efficient distribution of social benefit in urban planning. In Advances in Models and Methods for Planning; Pitagora: Bologna, Italy, 2009. [Google Scholar]
- D’Acci, L. Spatial distribution of social benefit given by urban attractions: A test of UrAD model. In Proceedings of the International Conference on Computational Science and Its Applications–ICCSA 2009, Seoul, Korea, 29 June–2 July 2009; Springer: Berlin, Heidelberg, 2009; pp. 237–252. [Google Scholar]
- Das, D. Urban quality of life: A case study of Guwahati. Soc. Indic. Res. 2008, 88, 297–310. [Google Scholar] [CrossRef]
- D’Acci, L. Simulating future societies in Isobenefit Cities: Social isobenefit scenarios. Futures 2013, 54, 3–18. [Google Scholar] [CrossRef]
- D’Acci, L. Monetary, subjective and quantitative approaches to assess urban quality of life and pleasantness in cities (hedonic price, willingness-to-pay, positional value, life satisfaction, isobenefit lines). Soc. Indic. Res. 2014, 115, 531–559. [Google Scholar] [CrossRef]
- Observatory of the Real Estate Market OMI of the Italian Revenue Agency. Available online: https://www.agenziaentrate.gov.it/portale/web/guest/schede/fabbricatiterreni/omi/banche-dati/quotazioni-immobiliari (accessed on 4 February 2025).
- Il Sole 24 Ore. La Classifica dei Territori più Vivibili. Qualità della Vita. Available online: https://lab24.ilsole24ore.com/qualita-della-vita/ (accessed on 4 February 2025).
- Carbonara, S.; Faustoferri, M.; Stefano, D. Real Estate Values and Urban Quality: A Multiple Linear Regression Model for Defining an Urban Quality Index. Sustainability 2021, 13, 13635. [Google Scholar] [CrossRef]
- Barreca, A.; Curto, R.; Rolando, D. Urban Vibrancy: An Emerging Factor that Spatially Influences the Real Estate Market. Sustainability 2020, 12, 346. [Google Scholar] [CrossRef]
- Barreca, A.; Curto, R.; Rolando, D. Assessing social and territorial vulnerability on real estate submarkets. Buildings 2017, 7, 94. [Google Scholar] [CrossRef]
- Can, A. The measurement of neighborhood dynamics in urban house prices. Econ. Geogr. 1990, 66, 254–272. [Google Scholar] [CrossRef]
- Ismail, S. Spatial Autocorrelation and Real Estate Studies: A Literature Review. Malays. J. Real Estate 2006, 1, 1–3. [Google Scholar]
- Geipele, I.; Kauškaleb, L.; Lepkovac, N.; Liias, R. Interaction of socio-economic factors and real estate market in the context of sustainable urban development. In Proceedings of the 9th Conference on Environmental Engineering—ICEE, Vilnius, Lithuania, 22–23 May 2014. Selected Papers, Article number: Enviro2014.117. [Google Scholar]
- Nguyen, M.N.; Le Doan, M.D.; Ngueyen, H.T.; Vu, M.H. The relevance of factors affecting real estate investment decisions for post pandemic time. Int. J. Bus. Glob. 2022, 1, 1–5. [Google Scholar] [CrossRef]
- Nguyen, M.N. Real estate market and issues for the period 2013–2015. J. Econ. Dev. 2013, 34, 45–59. [Google Scholar]
- Kueh, C.C.; Chiew, F.H. Factors Influencing House Buyers’ Purchasing Decision. Unpublished Research Reports. 2005. [Google Scholar]
- Lieser, K.; Groh, A.P. The Determinants of International Commercial Real Estate Investments. 2011a. IESE Research Papers D/935, IESE Business School. Available online: https://www.iese.edu/media/research/pdfs/DI-0935-E.pdf (accessed on 5 February 2025).
- Castriota, S. The Impact of Real Estate and Stock Market Fluctuations on Human Well-Being. 2007. Available online: http://hdl.handle.net/2108/538 (accessed on 10 February 2025).
- Skinner, J. Housing Wealth and Aggregate Saving. Reg. Sci. Urban Econ. 1989, 19, 305–324. [Google Scholar] [CrossRef]
- Yashikawa, H.; Ohtake, F. Female Labor Supply, Housing Demand, and the Saving Rate in Japan. Eur. Econ. Rev. 1989, 33, 997–1023. [Google Scholar] [CrossRef]
- Case, K.E. The Real Estate Cycle and the Economy: Consequences of the Massachussets Boom of 1984–1987. Urban Stud. 1992, 29, 171–183. [Google Scholar] [CrossRef]
- Brodin, P.A.; Nymoen, R. Wealth Effects and Exogeneity: The Norwegian Consumption Function 1966(1)-1989(4). Oxf. Bull. Econ. Stat. 1992, 54, 431–454. [Google Scholar] [CrossRef]
- Koskela, E.; Loikkanen, H.; Viren, M. House Prices, Household Saving and Financial Market Liberalization in Finland. Eur. Econ. Rev. 1992, 36, 549–558. [Google Scholar] [CrossRef]
- Bayoumi, T. Financial Deregulation and Household Saving. Econ. J. 1993, 103, 1432–1443. [Google Scholar] [CrossRef]
- Engelhardt, G.V. House Prices and the Decision to Save for Down Payments. N. Engl. Econ. Rev. 1994, 36, 47–58. [Google Scholar] [CrossRef]
- Berg, L.; Bergström, R. Housing and Financial Wealth, Financial Deregulation, and Consumption-The Swedish Case. Scand. J. Econ. 1995, 97, 421–439. [Google Scholar] [CrossRef]
- Smith, D. Geography of Social Wellbeing; McGraw-Hill: New York, NY, USA, 1973. [Google Scholar]
- Liu, B.-C. Quality of Life Indicators in US Metropolitan Areas: A Statistical Analysis; Praeger: New York, NY, USA, 1976. [Google Scholar]
- Boyer, R.; Savageau, D. Places Rated Almanac: Your Guide to Finding the Best Places to Live in America; Rand McNally: Chicago, IL, USA, 1981. [Google Scholar]
- Rogerson, R.; Findlay, A.; Morris, A. Quality of Life in British Cities: A Summary Report; University of Glasgow: Glasgow, UK, 1988. [Google Scholar]
- Harvey, D. The Condition of Postmodernity; Blackwell: Oxford, UK, 1989. [Google Scholar]
- Peterson, P. City Limits; University of Chicago Press: Chicago, IL, USA, 1981. [Google Scholar]
- Logan, J.; Molotoch, H. Urban Fortunes; University of California Press: Berkeley, CA, USA, 1987. [Google Scholar]
- Ministry of the Interior, Public Security 2022. Available online: https://www.interno.gov.it/it/stampa-e-comunicazione/dati-e-statistiche (accessed on 20 February 2025).
- Ministry of Justice. 2022. Available online: https://www.giustizia.it/cmsresources/cms/documents/Adozioni_2022_parziale_G.pdf (accessed on 24 February 2025).
- Italian National Institute of Statistics. Available online: https://www.istat.it/dati/banche-dati/ (accessed on 14 February 2025).
- Scenari Immobiliari—Real Estate Market Analysis. 2022. Available online: https://www.scenari-immobiliari.it/ (accessed on 4 February 2025).
- Prometeia Observatory—Findomestic. 2022. Available online: https://www.osservatoriofindomestic.it/media/OSSERVATORIO-FINDOMESTIC_2022.pdf (accessed on 4 February 2025).
- Infocamere 2023. Available online: https://www.infocamere.it/ (accessed on 25 February 2025).
- Department of Public Security of the Ministry of Interior. Available online: https://www.interno.gov.it/it/ministero/dipartimenti/dipartimento-pubblica-sicurezza (accessed on 12 February 2025).
- Legambiente, Environment Italy. 2023. Available online: https://www.legambiente.it/wp-content/uploads/2023/10/Ecosistema-Urbano-2023.pdf (accessed on 25 February 2025).
- Morano, P.; Tajani, F.; Di Liddo, F.; Ranieri, R.; Amoruso, P. The contribution of the most influencing factors on the housing rents: An analysis in the city of Milan (Italy). In Proceedings of the International Conference on Computational Science and Its Applications–ICCSA 2021, Cagliari, Italy, 13–16 September 2021; Springer International Publishing: Cham, Germany, 2021; pp. 63–76. [Google Scholar]
- Morano, P.; Tajani, F.; Di Liddo, F.; Amoruso, P. The public role for the effectiveness of the territorial enhancement initiatives: A case study on the redevelopment of a building in disuse in an Italian small town. Buildings 2021, 11, 87. [Google Scholar] [CrossRef]


| Variable | Acronym | Source (Accessed on 25 March 2025) |
|---|---|---|
| Life Quality index | QoL | https://lab24.ilsole24ore.com |
| Real Estate Market Intensity | IMI | https://www.agenziaentrate.gov.it |
| OMI real estate quotations | QUO | https://www.agenziaentrate.gov.it/portale/schede/fabbricatiterreni/omi/banche-dati/quotazioni-immobiliari |
| Household expenditure on the consumption of durable goods | SPE | https://www.osservatoriofindomestic.it/ |
| Employment rate | OCC | https://www.istat.it/ |
| Crime indicator | CRI | https://www.interno.gov.it/it/ministero/dipartimenti/dipartimento-pubblica-sicurezza + https://www.istat.it/ |
| Total migration balance | MIG | https://www.istat.it/ |
| Urban ecosystem indicator | ECO | https://www.legambiente.it/ |
| Accessibility of essential services indicator | ACC | https://www.istat.it/ |
| SPE | OCC | CRI | MIG | ECO | ACC | QoL | QUO | IMI | I-Moran | ||
|---|---|---|---|---|---|---|---|---|---|---|---|
| SPE | 1.00 | 0.92 | 0.29 | 0.79 | 0.57 | −0.36 | 0.85 | 0.43 | 0.64 | 0.84 | |
| OCC | 1.00 | 0.26 | 0.84 | 0.64 | −0.35 | 0.91 | 0.47 | 0.59 | 0.71 | ||
| CRI | 1.00 | 0.36 | −0.01 | −0.21 | 0.17 | 0.61 | 0.35 | 0.15 | |||
| MIG | 1.00 | 0.53 | −0.39 | 0.73 | 0.34 | 0.59 | 0.76 | ||||
| ECO | 1.00 | −0.13 | 0.69 | 0.25 | 0.42 | 0.31 | |||||
| ACC | 1.00 | −0.42 | −0.16 | −0.41 | 0.34 | ||||||
| QoL | 1.00 | 0.47 | 0.64 | 0.71 | |||||||
| QUO | 1.00 | 0.41 | 0.24 | ||||||||
| IMI | 1.00 | 0.71 | |||||||||
| −1.00 | 0.00 | 1.00 |
Disclaimer/Publisher’s Note: The statements, opinions and data contained in all publications are solely those of the individual author(s) and contributor(s) and not of MDPI and/or the editor(s). MDPI and/or the editor(s) disclaim responsibility for any injury to people or property resulting from any ideas, methods, instructions or products referred to in the content. |
© 2025 by the authors. Licensee MDPI, Basel, Switzerland. This article is an open access article distributed under the terms and conditions of the Creative Commons Attribution (CC BY) license (https://creativecommons.org/licenses/by/4.0/).
Share and Cite
Di Liddo, F.; Amoruso, P.; Morano, P.; Tajani, F.; Locurcio, M. A Data Analysis of the Relationship Between Life Quality Indicators and the Real Estate Market in Italian Provincial Capitals. Real Estate 2025, 2, 4. https://doi.org/10.3390/realestate2020004
Di Liddo F, Amoruso P, Morano P, Tajani F, Locurcio M. A Data Analysis of the Relationship Between Life Quality Indicators and the Real Estate Market in Italian Provincial Capitals. Real Estate. 2025; 2(2):4. https://doi.org/10.3390/realestate2020004
Chicago/Turabian StyleDi Liddo, Felicia, Paola Amoruso, Pierluigi Morano, Francesco Tajani, and Marco Locurcio. 2025. "A Data Analysis of the Relationship Between Life Quality Indicators and the Real Estate Market in Italian Provincial Capitals" Real Estate 2, no. 2: 4. https://doi.org/10.3390/realestate2020004
APA StyleDi Liddo, F., Amoruso, P., Morano, P., Tajani, F., & Locurcio, M. (2025). A Data Analysis of the Relationship Between Life Quality Indicators and the Real Estate Market in Italian Provincial Capitals. Real Estate, 2(2), 4. https://doi.org/10.3390/realestate2020004