1. Introduction
Rigorous systematic analysis of existing medical records has advanced clinical research, enhanced healthcare knowledge through methodological rigor, and improved patient outcomes through evidence-based practice [
1,
2,
3]. The use of historical data is well established in epidemiology, quality improvement and health services evaluation, professional education, and emergency care research [
1,
3,
4,
5,
6,
7,
8,
9,
10,
11]. The main advantage of this design is its easy access to existing data, eliminating the time and cost of collecting new data. Chart reviews also allow clinicians to address clinical questions that are uncommon, difficult or unethical to study in prospective or randomized trials, such as those involving rare or harmful exposures [
12,
13,
14].
Retrospective studies including audits, chart reviews and observational research use existing clinical data in different ways and for different reasons. Clinical audit formalizes the longstanding tradition of healthcare professionals reviewing case records to improve practice through structured, data-driven evaluation. By measuring care against specific standards with the goal of quality improvement through an iterative cycle, clinical audit is an indispensable tool for advancing patient safety and service quality in emergency care [
15]. Retrospective observational research, on the other hand, aims to generate new knowledge or test hypotheses and often requires ethical approval and the use of inferential statistics [
2,
12,
16]. Such designs therefore suit estimation of prevalence, identification of associations, and hypothesis generation. Due to the retrospective nature, establishing causality or temporality between exposures and outcomes is often impossible. Chart reviews are a data collection method used in both clinical audits and retrospective observational research, depending on the study’s intent [
5,
12].
The purpose of this article is to present a practical guide for conducting high-quality clinical audits and retrospective observational research in the emergency care setting.
2. Key Steps for Performing a Retrospective Project
An 11-step process (
Table 1) is described as a practical and accessible starting point (or reminder) for clinicians undertaking retrospective studies. Achieving high-quality results requires a systematic and well-organized approach, best represented as a study protocol. A study protocol (sometimes referred to as a study plan) may seem unnecessary, but it is essential for maintaining a systematic and transparent approach to any project or audit. It provides prescriptive details that serve as a reference for the team throughout the study and when replicating the work in the future. The stepped approach mirrors the standard sections of a study protocol but reframes them as guiding questions to make each section’s content and purpose more practical, intuitive, and clear for users. If one seeks to publish, the Standards for Quality Improvement Reporting Excellence (SQuIRE) guidelines or STROBE (Strengthening the Reporting of Observational Studies in Epidemiology) guidelines should also be used [
17,
18].
Appendix A provides a worked example of these steps.
2.1. Step 1: What Is the Question? Aims, Objectives, Outcomes
A common approach to prioritizing audit focus is to select problems that are
high volume, high cost, or high risk, ensuring that resources are allocated to areas with the greatest potential to improve safety, effectiveness, and patient experience [
19]. Once an area of focus has been decided, aims, objectives and outcomes must be clearly articulated. Aims provide a broad statement of the overall purpose. For example, an audit might seek to determine whether clinical practice aligns with current standards for fractured neck of femur care [
20]. Objectives are specific, measurable steps in achieving the aim, and in the previous example, might serve to assess time to analgesia administration within 30 min of diagnosis. Outcomes represent the expected results, with primary outcomes being the main measure of success (for example, proportion of patients receiving analgesia within 30 min) and secondary outcomes measuring additional metrics (such as pain score reduction or time to orthopedic review).
Clinicians often risk deviating from their original aims and objectives by attempting to address multiple questions. It is therefore crucial to focus on a single primary outcome, which serves as a clear point of reference to maintain direction and coherence throughout the process. As you go through the steps, your primary outcome may need to be adjusted based on the availability and feasibility of collecting relevant data.
Once the aims, objectives, and outcomes have been drafted, a feasibility check is necessary.
Table 2 poses some questions to assess if moving to the next step is worthwhile, or if refining the aims, objectives and outcomes are necessary.
2.2. Step 2: How Long Will This Take? Timeline
It is important to align project expectations with practical constraints with limitations often related to resourced time and data availability (see Step 7). Gantt charts provide a structured means to establish realistic timelines, particularly when prior experience is limited [
21]. They enable accurate estimation of required durations, align team expectations, and offer a comprehensive visual roadmap of project demands.
2.3. Step 3: Who Is Helping? Team Composition
Even small-scale clinical audits benefit from a dedicated project team. This may simply include you and a supervisor or mentor or can be quite comprehensive depending on your experience and study methodology. The composition should reflect the multidisciplinary nature of healthcare delivery, incorporating staff with complementary expertise and practical knowledge of the system under review. In addition to identifying members of the study team, an outline of individual responsibilities is also essential.
When quality improvement is central to the study, a multidisciplinary group directly involved in relevant care processes should participate, either as study team members or stakeholders. This inclusive approach provides operational insights critical for implementing practical service enhancements in addition to establishing validity with the data collected [
16].
2.4. Step 4: What Is Already Known? Literature Review
A comprehensive review of the existing literature is an essential foundation for any study, including retrospective studies. The purpose of the literature review is to ensure that the planned study is contextually grounded, scientifically justified, and methodologically informed by prior research. An additional advantage of the review process is that it may provide reproducible methods (including defining and measuring key variables) and statistical approaches to reduce the burden of having to create this de novo. For quality improvement studies, reviews may also offer standards of care for which to benchmark against [
1,
6,
19,
22,
23,
24,
25,
26].
Investigators unfamiliar with search techniques may collaborate with medical librarians who can provide expert guidance on database selection, phrasing of search terms, reference management, and useful tools such as large language models (artificial intelligence) [
27].
2.5. Step 5: Who Should I Include? Inclusion and Exclusion Criteria
Retrospective studies utilize data originally generated for medical record-keeping, rendering data collection inherently challenging due to inconsistencies in documentation and completeness [
6,
11]. Explicit inclusion and exclusion criteria are therefore essential, with justifications underscoring their selection to ensure that captured data accurately reflects the intended study population and purpose.
Inclusion criteria define the key characteristics of the target population that eligible medical records must possess to address the study question (
Table 3). These criteria ensure homogeneity among selected charts, enhancing the study’s internal validity and generalizability to the intended patient population.
Exclusion criteria, on the other hand, are often used incorrectly and expressed as the opposite of the inclusion criteria. Exclusion criteria should instead be defined as criteria that should be excluded from the population identified from the inclusion criteria. For example, a study investigating techniques to remove foreign bodies from the eye may have included a patient who had a complication with their contact lens, which was not considered within the scope of the study aims and objectives and therefore should be excluded from the final population.
2.6. Step 6: How Many Samples Should I Use? Sample Size, Power Considerations and Sampling Strategy
A representative sample is often required to allow inferences about the broader population. Two fundamental questions inform how well represented the data is: what approach will ensure that it accurately represents the study population (sampling technique) and how large should the sample be (sample size)?
2.6.1. Step 6.1 Sampling Techniques
Broadly, three sampling techniques exist and include convenience, quota, and systematic sampling (
Table 4). Choice of technique is often based on feasibility of probability-based sampling and available resources but is also dependent on the study’s objectives and epidemiologic frequency. For emergency medicine, convenience sampling is the most frequently used approach and involves selecting all eligible cases within a defined time period or data availability window. Be careful to account for seasonal and temporal factors (such as large workforce changes at the start of each year). Quota sampling entails identifying a predetermined number of cases from specific subgroups to ensure that critical strata are adequately represented. In systematic sampling, investigators select every
nth record from a complete list of eligible cases, yielding a quasi-random distribution of observations.
More novel sampling techniques include interval sampling (beginning with a small sample and expanding only if results are inconclusive) and rapid-cycle sampling (using small sample sizes at increased frequency).
2.6.2. Step 6.2 Sample Size
The required sample size depends primarily on the desired confidence in the findings and the available resources for data collection. In audit studies, sample size calculations frequently involve comparing proportions of patients who meet predefined care criteria before and after implementation of an intervention. A general rule of thumb for audits is to sample at least ten cases or events per variable to produce results that are both reliable and clinically interpretable [
28]. This “ten-per-variable” rule is commonly applied in regression modeling and other multivariable analyses [
29,
30].
2.7. Step 7: Where Do I Find the Data? Data Sources and Data Collection Tools
Clinical data is frequently dispersed across multiple media and stored in different departments or even separate institutions. The required information is often unavailable in an analyzable manner and requires collecting, linking, and/or cleaning. At other times, the data may be missing or no longer exists.
2.7.1. Step 7.1 Data Sources
Many existing health information systems already contain data suitable for audit and quality-improvement purposes. Hospital and departmental management systems commonly capture performance and process measures and should be the first port of call for understanding what routinely collected data is available for extraction [
3,
10]. Understanding what data is available will also assist in understanding feasibility of the study.
2.7.2. Step 7.2 Data Collection Tools
Once an understanding of what data is routinely available and extractable, customized data collection tools should be used. This can be in paper form or electronic form. A popular electronic form often used in research is RedCap and should fulfill most ethical and research governance requirements [
31]. When designing a data collection tool, it is important to define the type of data (numerical or categorical) you will be collecting as this will inform the statistical analysis (see Step 10). Outlining a table or graph by creating a ‘dummy table’ can often help contextualize what critical information is required and save you the effort of having to review records for a second or third time to collect additional data. Standardizing the collection options and minimizing free text will also help when it comes time for data analysis.
It is important that data collection tools are informed by a detailed abstraction manual or coding guide. This guide should provide explicit coding rules and decision criteria for each data element to ensure consistency across abstractors. When reporting study methods, clinicians should describe these coding procedures clearly and, when feasible, include the coding guide and data dictionary as appendices to enhance transparency and reproducibility.
Once the tool has been created, testing the tool with either dummy data or a few cases (10 cases is ample) will help determine usability. Conducting a pilot review before full data collection can help identify areas prone to missingness and inform feasible strategies to mitigate its impact. If pilot testing was not performed, this omission should be acknowledged as a study limitation.
2.8. Step 8: Do I Have Permission to Do This? Ethical and Governance Considerations
Prior to collecting data, it is important to understand ethical, legal and organizational requirements. For internally focused audits and chart reviews, organizations may have established processes addressing both ethical and governance requirements. Approval is often delegated to departmental heads and may range from something as simple as verbal confirmation to a formal application, including study plan.
Should you wish to publish, most academic journals will require an ethical review process that may include a waiver or procession through low or high-risk pathways. Whilst an ethical review seeks to protect the patient, research governance adds an additional layer of protection for the organization, including compliance with local legislation. Most organizations will require research governance approval once ethical approval has been granted. More progressive organizations will have both ethical and research governance reviews in a single application. In some countries (such as Australia), ethical approval from only one ethics committee is enough to cover multiple sites and organizations [
32].
2.9. Step 9: How Do I Make the Data Usable? Data Collection and Cleaning
2.9.1. Step 9.1 Data Collection
Among the most significant threats to validity in chart review research are biases introduced during the data collection phase. Standardized instructions, abstractor training, and regular meetings between investigators and abstractors to resolve ambiguities and reinforce coding rules with periodic monitoring should be utilized to minimize this bias.
The most common method to quantify the degree of potential bias is to perform a test for interrater reliability, which is the degree of agreement between two or more independent abstractors examining the same record [
6]. There is no formal standard that dictates what proportion of records should be extracted by two independent abstractors, although 5% is often considered adequate [
33].
Depending on the type and scale of the variables, reliability may be expressed using Cohen’s kappa for categorical measures or an intraclass correlation coefficient (ICC) for continuous data. The acceptable degree of interrater reliability is set by the study investigators and, as a rule of thumb, an 85% agreement could be considered the minimum while 90–95% is preferable [
6,
34,
35]. Revising the methodological approach or even the study aims should be considered if interrater reliability falls below 70% [
34].
2.9.2. Step 9.2 Data Cleaning
Following collection, all data should undergo systematic cleaning to ensure completeness, accuracy, and internal consistency. Prior to cleaning, it is important to preserve the original, unaltered dataset in its entirety, with any cleaning or manipulation performed on duplicate copies. Data cleaning involves detecting and correcting errors (e.g., age 999), inconsistencies (e.g., merging Y and Yes responses), duplicates, or missing values in abstracted data to ensure analytical reliability.
Missing data can introduce bias, particularly if cases with incomplete records differ systematically from those with complete data [
13,
14,
36]. Two common strategies used to address missing data during cleaning include deletion and imputation. Deletion is more commonly used and excludes the case and/or variable if data is missing and often defined as an exclusion criteria. Although straightforward, deletion can substantially reduce sample size and exacerbate selection bias [
37]. Imputation can handle missing data in a variety of ways such as replacing missing data with the mean of the data available (mean substitution) or fitting the missing data to a statistical model such as a maximum likelihood ratio or Bayesian Monte Carlo simulation [
38]. Imputation methods are more commonly used in large electronic datasets and rely on the assumption that data are missing at random [
14].
2.10. Step 10: What Does the Data Mean? Data Analysis, Figures, and Charts
Data are often analyzed through two broad approaches: descriptive and inferential statistics [
39]. Descriptive statistics summarize and describe the characteristics of a dataset, such as measures of central tendency and range, without making any predictions (such as associations). Descriptive statistics are often enough for audits and chart reviews. They are also a necessary step when conducting inferential analysis and, in this context, are often referred to as summary statistics. Inferential statistics use sample data to draw conclusions, test hypotheses, measure association, or make predictions about a larger population (see step 11) [
40]. Inferential calculations are often categorized as parametric or non-parametric. Parametric calculations require that the data have a normal distribution and are often more accurate than non-parametric.
2.10.1. Step 10.1 Proportions
Proportions are another measure that can be either descriptive or inferential, depending on context. For example, a finding where 25% of 100 ED patients were diagnosed with sepsis is descriptive, summarizing the observed data. For the same cohort, a population proportion estimate can be calculated such that a finding of 25% (95% CI: 17–33%) of ED patients were diagnosed with sepsis.
For audits that compare performance against a predefined standard, results are usually presented as proportions or percentages. Both the absolute numbers and corresponding percentages should be reported; for example: adherence n = 40/50 (80%). When sample sizes are small, decimals beyond a single significant figure should be avoided to prevent false precision.
2.10.2. Step 10.2 Descriptive Statistics
Selecting the correct measure of central tendency (mean, median, mode) requires categorization of the data type (continuous, discrete, ordinal, nominal) and distribution of the data (normal versus skewed). Based on these values, the correct method can be calculated (
Table 5). Calculating the variance is also important and should be based on the calculation used (standard deviation for mean, interquartile range for median and minimum/maximum for mode).
Data can be described as four types within two categories (
Table 6). The type of data will determine the approaches to both descriptive and inferential statistics. Although most types are intuitive, confusion can often arise when transforming ordinal data into numerical form for analysis. For example, pain scores can be mild, moderate, and severe (ordinal) and are converted to numerical values where 1 is mild, 2 is moderate and 3 is severe. The numerical scores are still ordinal (categories with a defined order).
Once the data type has been identified, the next step is to determine the type of distribution of the data. There are a variety of ways to determine distribution, with the simplest being plotting a histogram and determining symmetry through visual opinion, which is often enough for smaller studies and audits. Statistical confirmation of distribution can be performed through a variety of tests, including Shapiro–Wilk and Kolmogorov–Smirnov, but lack precision at sample sizes less than 20 or more than 50 [
41,
42].
Calculating the central tendency is often the focus when summarizing a study outcome. The type and distribution of data identified in the previous steps determines the most appropriate calculation of central tendency and their equivalent assessment of variability (
Table 5). Note that for nominal data, rather than central tendency, a frequency (%) is expressed.
2.10.3. Step 10.3 Inferential Statistics
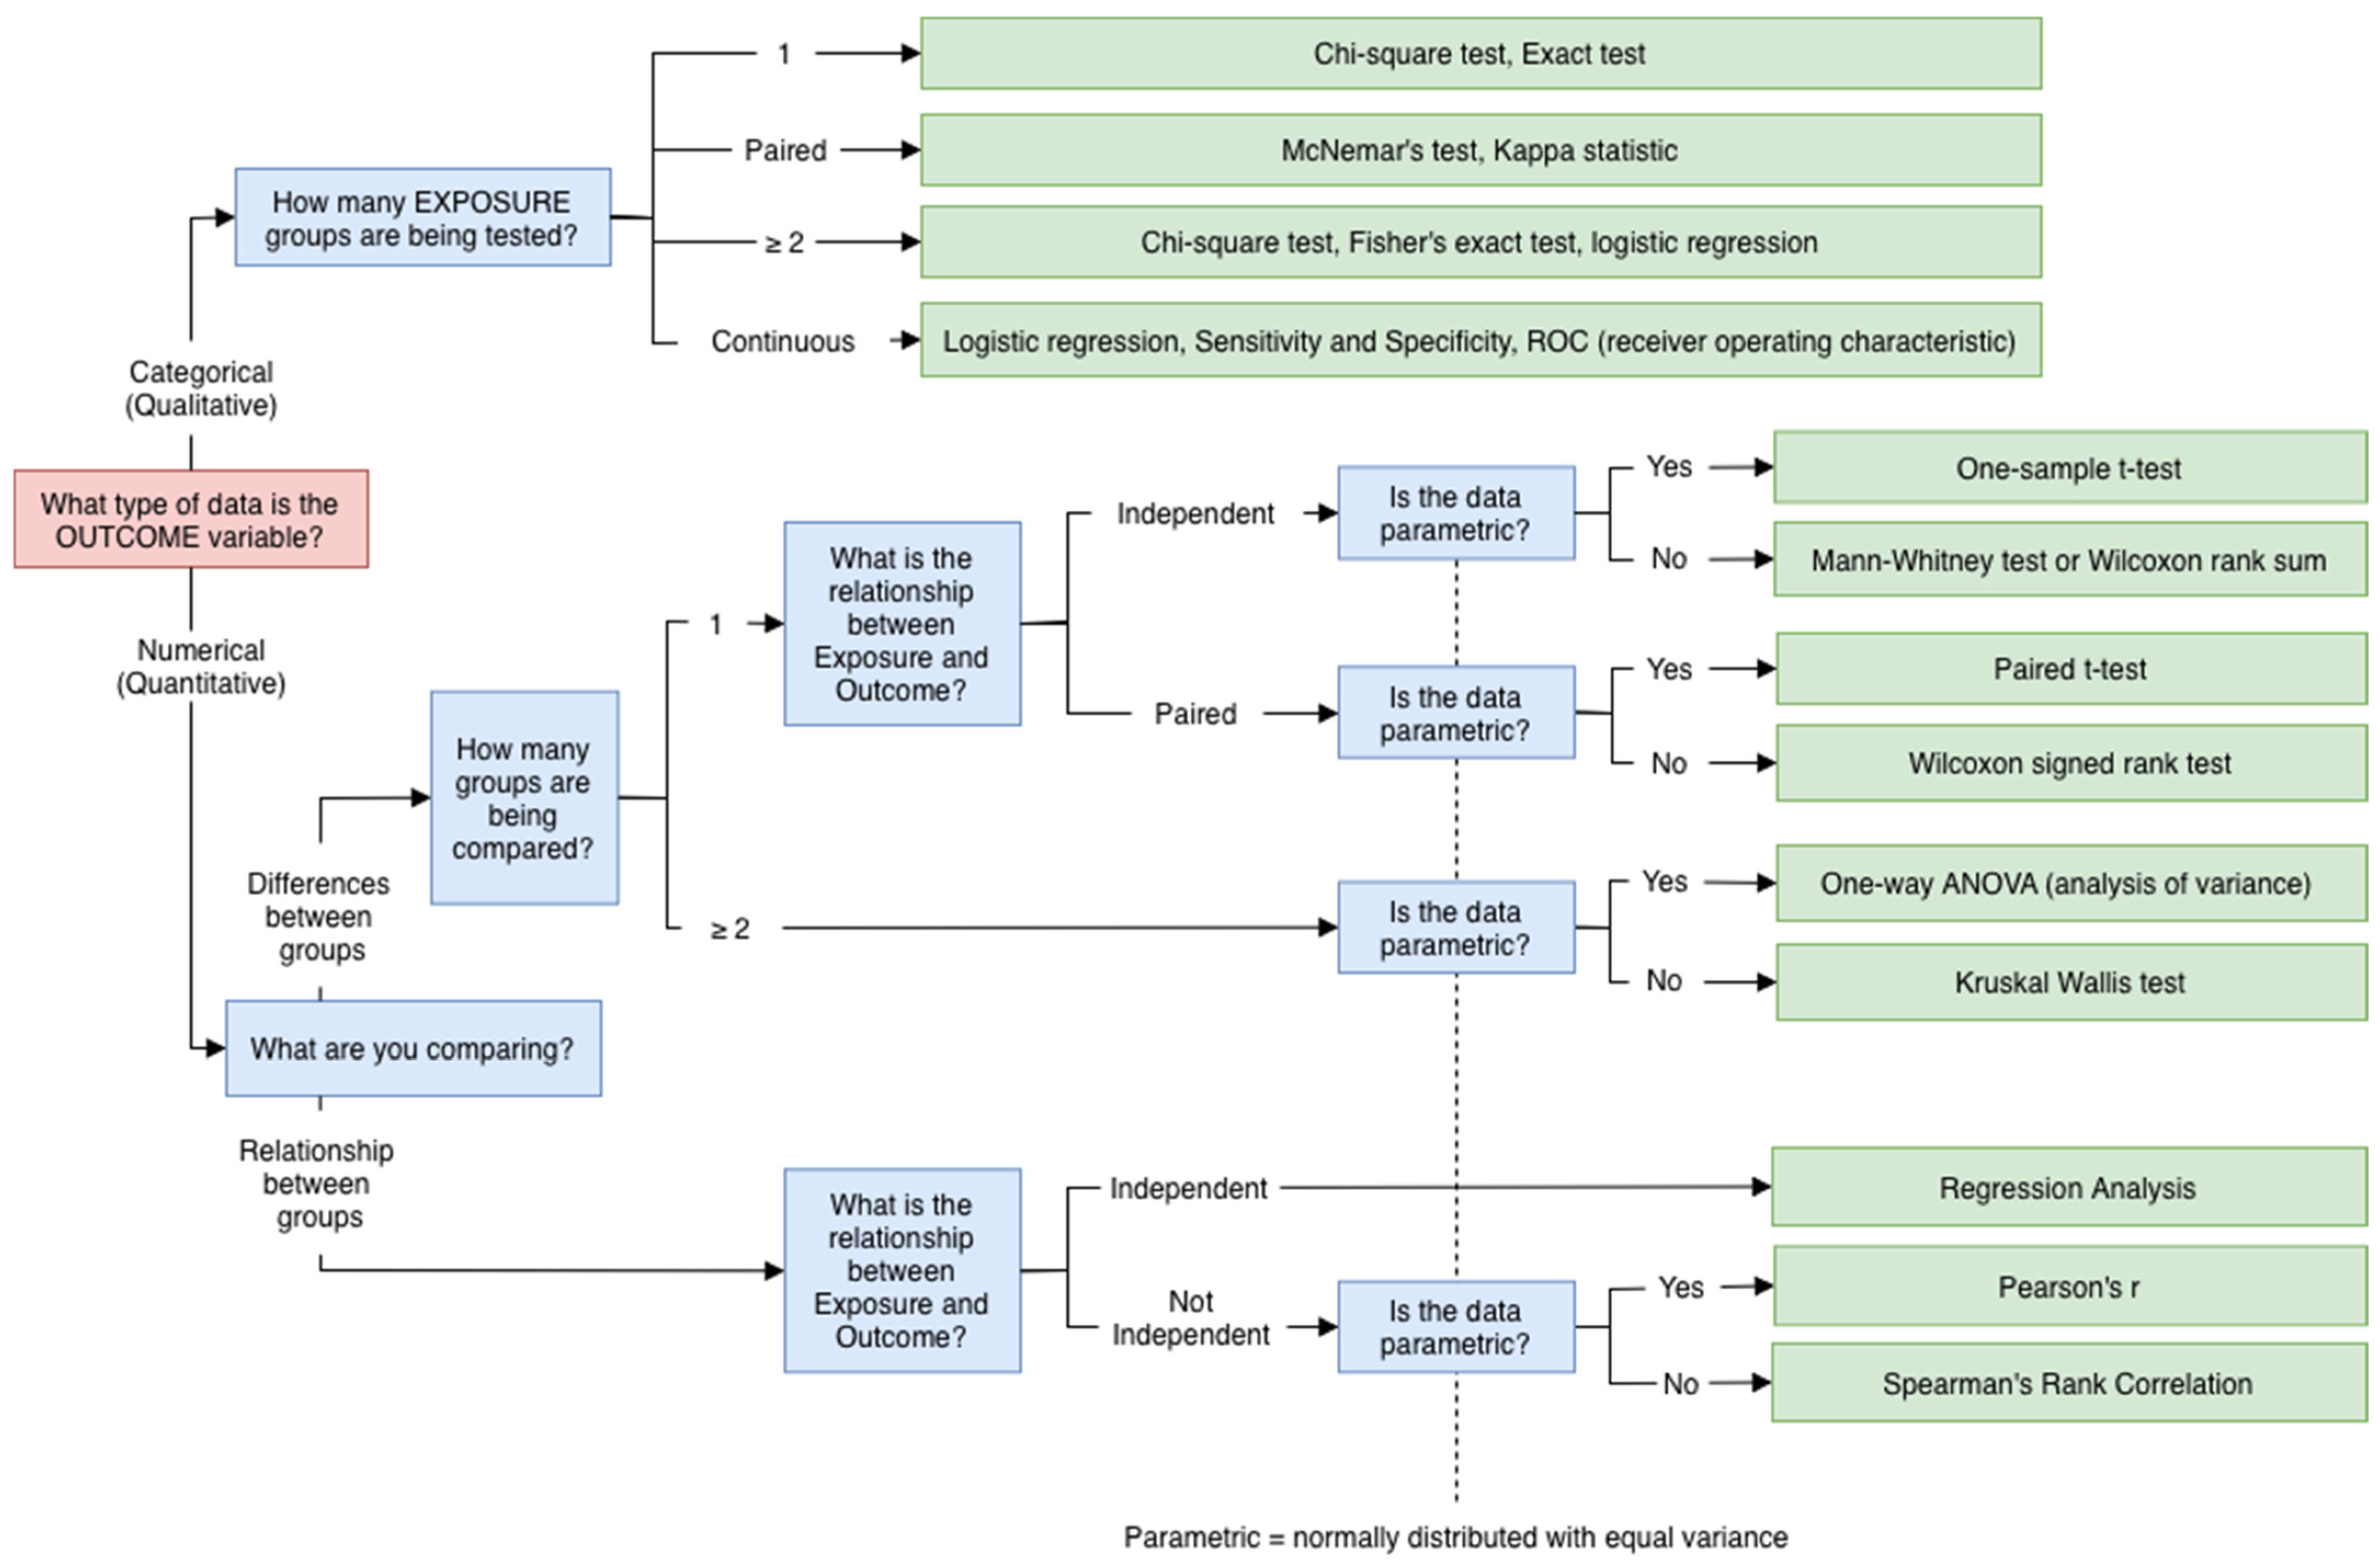
Determining the degree of association and generalizing to population estimates requires more advanced statistical interrogation. Like descriptive analysis, the statistical test is reliant on the type of data, number of groups, and type of distribution.
Figure 1 describes a flow chart for commonly used statistics based on these variables.
2.10.4. Step 10.4 Figures
Figures can be effective in describing the data more than (or in conjunction with) statistical analysis. It is important to use the right graphical representation method for your data, which includes a concise but descriptive title, axis labels, and legend. A summary of when to use each method based on type of data is provided in
Table 7.
2.10.5. Step 10.5 Control Charts
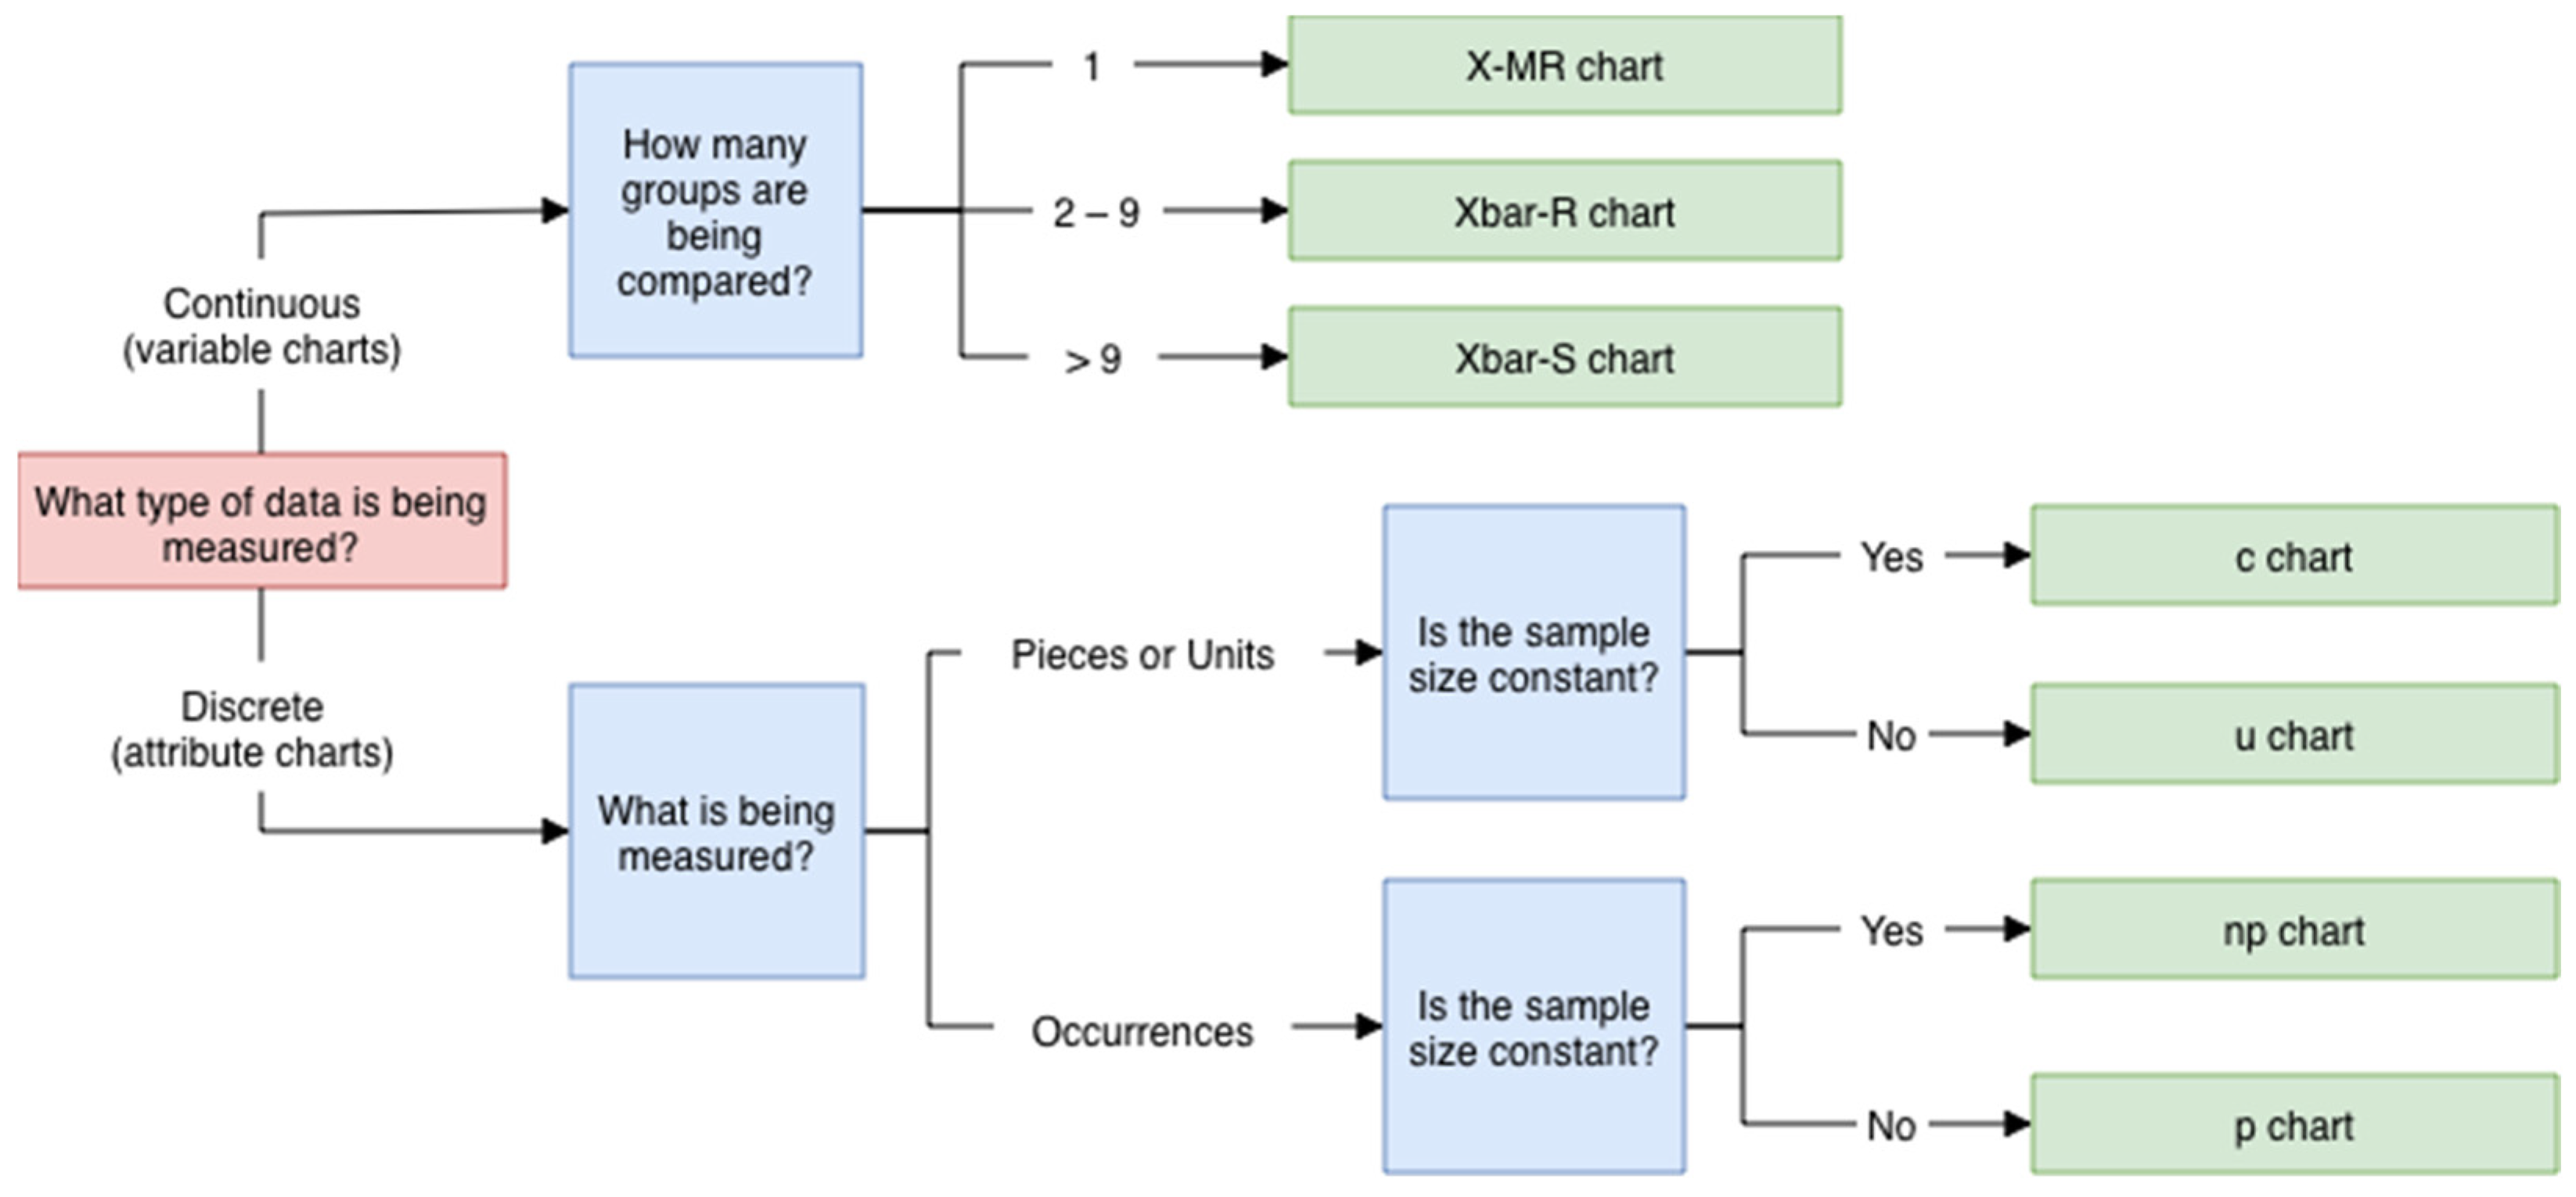
For longitudinal monitoring, and, in particular,, audits and quality improvement studies, control charts are often used to distinguish normal variation from significant process changes (
Figure 2) [
43].
2.11. Step 11: What Does the Data Really Mean? Significance and Limitations
2.11.1. Step 11.1 Association, Strength, and Causation
Association describes a statistical linkage between variables where they co-occur more frequently than expected by chance, with common analysis of association provided in
Figure 1. The strength of these associations is also important in appreciating any clinical significance that may not have statistically significant association (for example, when the sample size is low). For binominal data (such as those seen in case–control studies) and logistic regression analysis, strength can be quantified through relative risk and odds ratios. For continuous data with a linear relationship, correlation calculations measure the strength of association. None of these measures prove effective. Causation is proof of effect and demands rigorous evidence of temporality (exposure precedes outcome), dose–response gradients, biological plausibility, and consistency across studies. This typically requires prospective or randomized designs rather than the retrospective snapshots common in audits, where concurrent data collection confounds inference [
2,
6,
37].
When reporting results from retrospective data, interpretations must also remain proportional to the strength of the underlying evidence. It is appropriate to describe observed changes in adherence or performance but not to attribute these changes to causal factors unless supported by a study design capable of establishing cause and effect (and statistical analysis confirming it).
2.11.2. Step 11.2 Probability of Results: Confidence Intervals and p-Values
Inferential statistics must include a probability of the results being correct. This is often referred to as the
p-value, with a threshold of
p < 0.05 conventionally used to denote statistical significance. This value is arbitrary and should not replace sound scientific judgment. Moreover,
p-values are strongly influenced by sample size where larger samples can produce small
p-values even when observed differences are not clinically meaningful [
14].
p-values should always be presented alongside a corresponding confidence interval (CI) to assess the practical importance of findings, emphasizing whether the plausible range of effect sizes includes values that are clinically relevant.
When studies use sample data to estimate population parameters, CIs serve to quantify the precision and reliability of those estimates. The 95% CI is conventionally reported, indicating that if the study were repeated many times, 95% of the calculated intervals would contain the true population value. Narrower CIs denote greater precision and are influenced primarily by sample size and data variability.
2.11.3. Step 11.3 Statistical Versus Clinical Significance
The
p-value remains one of the most frequently misinterpreted and overutilized statistical measures [
40]. Statistical significance does not necessarily imply clinical relevance as it may reflect an effect too small to influence patient care. Clinical significance should instead be judged by the magnitude of effect and its capacity to change care. In the absence of established benchmarks, clinically important differences can often be context-specific.
2.11.4. Step 11.4 Limitations
Despite their value, retrospective designs are often undervalued owing to concerns over data quality and interpretability. Each step in the pathway from patient interaction to the final dataset introduces potential for error. Patients disclose information, which clinicians must understand correctly and record accurately in medical records. If clinical documentation is inaccurate, no amount of analysis will be able to compensate. Abstractors then interpret these records and extract key variables using standardized tools. Abstractors can be prone to fatigue and misinterpretation, especially when dealing with large volumes of complex medical records. Errors such as omissions, misinterpretations, or miscoding at any stage can accumulate, causing systematic biases that distort outcome measures from true effect estimates [
9,
12,
13,
37]. Recognizing these limitations is essential when analyzing and reporting audit or retrospective observational data to ensure conclusions accurately reflect the study design’s capabilities. Implementing strong methodological controls to detect and reduce bias is therefore crucial for producing reliable and high-quality results [
9,
44]. A core tenant set out in the 11 steps for performing a retrospective study is to create meaningful data that is robust and minimizes the limitations of such a methodology [
45].
Table 8 summarizes these potential biases and limitations that can also act as a checklist.
3. Conclusions
This framework serves as a practical and accessible starting point (or reminder) for clinicians undertaking retrospective audit or research. It provides structured direction and integrates experiential insights drawn from established practice to offer guidance on methodological nuances, common pitfalls, and strategies that bridge conceptual understanding with real-world application. In doing so, it aims to demystify the audit process and equip clinicians with the foundational knowledge and confidence required to initiate high-quality retrospective projects.
When performed according to these principles, retrospective methodologies become both an efficient and feasible approach as well as a scientifically robust method for addressing clinically relevant questions in health care. Far from being a secondary design, it remains an essential tool for characterizing practice patterns, evaluating novel interventions, and driving evidence-based quality improvement that shapes the ongoing evolution of health care.
Funding
This research was funded by the Medical Research Future Fund (MRFF), grant number MRF2018041.
Institutional Review Board Statement
Not applicable.
Informed Consent Statement
Not applicable.
Data Availability Statement
No new data were created or analyzed in this study. Data sharing is not applicable to this article.
Conflicts of Interest
The author declares no conflicts of interest. The funders had no role in the design of the study, or in the writing of the manuscript.
Abbreviations
The following abbreviations are used in this manuscript:
| ANOVA | Analysis of Variance |
| CI | Confidence Interval |
| ED | Emergency Department |
| ICC | Intraclass correlation coefficient |
| REDCap | Research Electronic Data Capture |
| ROC | Receiver Operating Characteristic |
| SQuIRE | Standards for Quality Improvement Reporting Excellence |
| STROBE | Strengthening the Reporting of Observational Studies in Epidemiology |
Appendix A. Worked Example of Applying This Guide
The following is a worked example of this guide based on the published study ‘The Epidemiology of Emergency Calls in a Tertiary Emergency Department for Admitted Patients: A TECOR Study” [
23].
Appendix A.1. Step 1: What Is the Question? Aims, Objectives, Outcome
The primary objective of this study was to evaluate the incidence of emergency calls in our ED. Secondary objectives included evaluating the indications for an emergency call, demographic relationships, ED length of stay (LOS), diagnosis, and management during the review.
Appendix A.2. Step 2: How Long Will This Take? Timeline
There were no external time pressures such as limited time in a rotation or due date for submission. For practical reasons, we chose 6 months in order to complete the project to allow for results to be analyzed and reported in a timely manner to influence change if needed.
Appendix A.3. Step 3: Who Is Helping? Team Composition
Our team represented a diversity of roles including emergency physician, emergency nurses, postdoctoral research fellow, and a critical care nurse who leads the emergency call portfolio for the department. As in most situations, the team composition was driven by availability and influenced by individual desire for the subject matter.
Appendix A.4. Step 4: What Is Already Known? Literature Review
A rapid review of the literature was performed and summarized in the introduction of the manuscript.
Appendix A.5. Step 5: Who Should I Include? Inclusion and Exclusion Criteria
Inclusion and exclusion criteria were set out clearly in the manuscript, as was study location and period used.
Appendix A.6. Step 6: How Many Samples Should I Use? Sample Size, Power Considerations and Sampling Strategy
As this study was an epidemiological survey, the time range for data collection was set was based on data availability of the (then) new Tasmanian Emergency Care Outcomes Registry [
10].
Appendix A.7. Step 7: Where Do I Find the Data? Data Sources and Data Collection Tools
Data points were identified and then mapped based on a previous mapping exercise [
3]. A combination of automated entry for demographic details and other routinely collected ED data for federal reporting. The remaining data was manually entered.
Appendix A.8. Step 8: Do I Have Permission to Do This? Ethical and Governance Consideration
Ethical approval was sought and granted through the University of Tasmanian Human Research Ethics Committee (HREA30260, 26 February 2024). This was followed by Research Governance Approval by the Department of Health (Tasmania, Australia).
Appendix A.9. Step 9: How Do I Make the Data Usable? Data Collection and Cleaning
Data collection was performed through a REDCap form and predefined data dictionary. Automated data such as demographics was auto populated whereas other fields used a combination of categorical and numerical variables with free text entries in limited areas.
Appendix A.10. Step 10: What Does the Data Mean? Data Analysis, Figures, and Charts
Dummy data tables were created. Based on the data dictionary with final tables and figures available in the manuscript. As with many manuscripts using the same methodology, population characteristics dominated the first table before addressing the aims in subsequent tables and figures.
Appendix A.11. Step 11: What Does the Data Really Mean? Significance and Limitations
The discussion created the opportunity to reflect on local findings, compare with published data, and justify potential reasons for any differences. New findings not already published could also be discussed for future studies to compare against. Limitations were articulated in a stepwise approach incorporating the elements of
Table 8.
References
- Wu, L.; Ashton, C.M. Chart Review. Eval. Health Prof. 1997, 20, 146–163. [Google Scholar] [CrossRef] [PubMed]
- Butler, J.J.; Quinlan, J.W. Internal audit in the department of medicine of a community hospital: Two years’ experience. J. Am. Méd. Assoc. 1958, 167, 567–572. [Google Scholar] [CrossRef] [PubMed]
- Tran, V.; Thurlow, L.; Page, S.; Barrington, G. Framework for a Modular Emergency Departments Registry: A Case Study of the Tasmanian Emergency Care Outcomes Registry (TECOR). Hospitals 2025, 2, 18. [Google Scholar] [CrossRef]
- Haley, R.W.; Quade, D.; Freeman, H.E.; Bennett, J.V. Study on the efficacy of nosocomial infection control (SENIC project): Summary of study design. Am. J. Epidemiol. 1980, 111, 472–485. [Google Scholar] [CrossRef]
- Jansen, L.A. A Closer Look at the Bad Deal Trial: Beyond Clinical Equipoise. Hastings Cent. Rep. 2005, 35, 29–36. [Google Scholar] [CrossRef] [PubMed]
- Allison, J.J.; Wall, T.C.; Spettell, C.M.; Calhoun, J.; Fargason, C.A.; Kobylinski, R.W.; Farmer, R.; Kiefe, C. The Art and Science of Chart Review. Jt. Comm. J. Qual. Improv. 2000, 26, 115–136. [Google Scholar] [CrossRef] [PubMed]
- Krikorian, J. Quality Control Enhanced by Chart Review. Hospitals 1979, 53, 97–98, 102, 104. [Google Scholar]
- Holmboe, E.; Gross, R.; Hawkins, R. Chart Review for Residents. Acad. Med. 1996, 71, 1139–1140. [Google Scholar] [CrossRef]
- Pan, L.; Fergusson, D.; Schweitzer, I.; Hebert, P.C. Ensuring High Accuracy of Data Abstracted from Patient Charts: The Use of a Standardized Medical Record as a Training Tool. J. Clin. Epidemiol. 2005, 58, 918–923. [Google Scholar] [CrossRef]
- Tran, V.; Barrington, G.; Page, S. The Tasmanian Emergency Care Outcomes Registry (TECOR) Protocol. Emerg. Care Med. 2024, 1, 153–164. [Google Scholar] [CrossRef]
- Tran, V.; Barrington, G.; Page, S. Emergency Department Clinical Quality Registries: A Scoping Review. Healthcare 2025, 13, 1022. [Google Scholar] [CrossRef]
- Hess, D.R. Retrospective Studies and Chart Reviews. Respir. Care 2004, 49, 1171–1174. [Google Scholar] [CrossRef] [PubMed]
- Krowchuk, H.V.; Moore, M.L.; Richardson, L. Using Health Care Records as Sources of Data for Research. J. Nurs. Meas. 1995, 3, 3–12. [Google Scholar] [CrossRef]
- Worster, A.; Haines, T. Advanced Statistics: Understanding Medical Record Review (MRR) Studies. Acad. Emerg. Med. 2004, 11, 187–192. [Google Scholar] [CrossRef] [PubMed]
- Abu-Jeyyab, M.; Al-Jafari, M.; Moawad, M.H.E.D.; Alrosan, S.; Mse’adeen, M.A. The Role of Clinical Audits in Advancing Quality and Safety in Healthcare Services: A Multiproject Analysis From a Jordanian Hospital. Cureus 2024, 16, e54764. [Google Scholar] [CrossRef]
- Gearing, R.E.; Mian, I.A.; Barber, J.; Ickowicz, A. A Methodology for Conducting Retrospective Chart Review Research in Child and Adolescent Psychiatry. J. Can. Acad. Child Adolesc. Psychiatry 2006, 15, 126–134. [Google Scholar]
- Ogrinc, G.; Davies, L.; Goodman, D.; Batalden, P.; Davidoff, F.; Stevens, D. SQUIRE 2.0 (Standards for QUality Improvement Reporting Excellence): Revised Publication Guidelines from a Detailed Consensus Process. BMJ Qual. Saf. 2016, 25, 986–992. [Google Scholar] [CrossRef] [PubMed]
- Von Elm, E.; Altman, D.G.; Egger, M.; Pocock, S.J.; Gøtzsche, P.C.; Vandenbroucke, J.P. The Strengthening the Reporting of Observational Studies in Epidemiology (STROBE) Statement: Guidelines for Reporting Observational Studies. J. Clin. Epidemiol. 2008, 61, 344–349. [Google Scholar] [CrossRef]
- Benjamin, A. Audit: How to Do It in Practice. BMJ 2008, 336, 1241. [Google Scholar] [CrossRef]
- Mudzingwa, I.T.; Prior, S.J.; Griffin, P.; Tavender, E.; Tran, V. Fractured Neck of Femur Clinical Pathway Use in Tasmanian Emergency Departments: A Retrospective Study. Emerg. Med. Australas. 2025, 37, e70155. [Google Scholar] [CrossRef]
- Clark, G.T.; Mulligan, R. Fifteen Common Mistakes Encountered in Clinical Research. J. Prosthodont. Res. 2011, 55, 1–6. [Google Scholar] [CrossRef]
- Matt, V.; Matthew, H. The Retrospective Chart Review: Important Methodological Considerations. J. Educ. Eval. Health Prof. 2013, 10, 12. [Google Scholar] [CrossRef]
- Tran, V.; Dunbabin, T.; Page, S.; Thurlow, L.; Barrington, G. The Epidemiology of Emergency Calls in a Tertiary Emergency Department for Admitted Patients: A TECOR Study. Healthcare 2025, 13, 1670. [Google Scholar] [CrossRef]
- Tran, V.; Neil, A.; Prior, S.; Tavender, E.; Unwin, M.; Page, S.; Radford, J.; Sharman, J.E.; Mitra, B.; Stankovich, J.; et al. The Implementing Clinical Pathways for Acute Care in Tasmania (IMPACT) Project. Emerg. Med. Australas. 2025, 37, e70119. [Google Scholar] [CrossRef]
- Tran, V.; Whitfield, J.; Askaroff, N.; Barrington, G. Procedural Sedation and Analgesia in an Australian Emergency Department: Results of the First 3 Months of a Procedural Sedation Registry. Anesthesia Res. 2024, 1, 157–167. [Google Scholar] [CrossRef]
- Tran, V.; Barrington, G.; Aandahl, Z.; Lawrence, A.; Wijewardena, S.; Doyle, B.; Cooley, L. Evaluation of the Abbott PanbioTM COVID-19 Ag Rapid Antigen Test for Asymptomatic Patients during the Omicron Wave. J 2023, 6, 198–206. [Google Scholar] [CrossRef]
- van Dijk, S.H.B.; Brusse-Keizer, M.G.J.; Bucsán, C.C.; van der Palen, J.; Doggen, C.J.M.; Lenferink, A. Artificial Intelligence in Systematic Reviews: Promising When Appropriately Used. BMJ Open 2023, 13, e072254. [Google Scholar] [CrossRef] [PubMed]
- Sackett, D.L. Clinical Epidemiology: A Basic Science for Clinical Medicine, 2nd ed.; Little, Brown: Boston, MA, USA, 1985. [Google Scholar]
- Findley, T.W.; Daum, M.C. Research in Physical Medicine and Rehabilitation. Am. J. Phys. Med. Rehabil. 1989, 68, 150–157. [Google Scholar] [CrossRef]
- Harrell, F.E.; Lee, K.L.; Matchar, D.B.; Reichert, T.A. Regression Models for Prognostic Prediction: Advantages, Problems, and Suggested Solutions. Cancer Treat. Rep. 1985, 69, 1071–1077. [Google Scholar] [PubMed]
- Harris, P.A.; Taylor, R.; Minor, B.L.; Elliott, V.; Fernandez, M.; O’Neal, L.; McLeod, L.; Delacqua, G.; Delacqua, F.; Kirby, J.; et al. The REDCap Consortium: Building an International Community of Software Platform Partners. J. Biomed. Inform. 2019, 95, 103208. [Google Scholar] [CrossRef]
- Duplancic, C.; Crough, T.; Bell, S.C.; Australian Non-Tuberculous Mycobacteria in Cystic Fibrosis Study Group; Thomson, R.; Wainwright, C.; Clements, A.; Floto, A.; Rogers, G.; Sly, P.; et al. Multi-centre Ethics and Research Governance Review Can Impede Non-interventional Clinical Research. Intern. Med. J. 2019, 49, 722–728. [Google Scholar] [CrossRef]
- Liddy, C.; Wiens, M.; Hogg, W. Methods to Achieve High Interrater Reliability in Data Collection From Primary Care Medical Records. Ann. Fam. Med. 2011, 9, 57–62. [Google Scholar] [CrossRef] [PubMed]
- Shiloach, M.; Frencher, S.K.; Steeger, J.E.; Rowell, K.S.; Bartzokis, K.; Tomeh, M.G.; Richards, K.E.; Ko, C.Y.; Hall, B.L. Toward Robust Information: Data Quality and Inter-Rater Reliability in the American College of Surgeons National Surgical Quality Improvement Program. J. Am. Coll. Surg. 2010, 210, 6–16. [Google Scholar] [CrossRef]
- Banks, N.J. Designing Medical Record Abstraction Forms. Int. J. Qual. Health Care 1998, 10, 163–167. [Google Scholar] [CrossRef]
- Hellings, P. A Rich Source of Clinical Research Data Medical Records and Telephone Logs. J. Pediatr. Health Care 2004, 18, 154–155. [Google Scholar] [CrossRef]
- Dworkin, R.J. Hidden Bias in the Use of Archival Data. Eval. Health Prof. 1987, 10, 173–185. [Google Scholar] [CrossRef]
- Pan, S.; Chen, S. Empirical Comparison of Imputation Methods for Multivariate Missing Data in Public Health. Int. J. Environ. Res. Public Health 2023, 20, 1524. [Google Scholar] [CrossRef]
- Plsek, P. Innovative Thinking for the Improvement of Medical Systems. Ann. Intern. Med. 1999, 131, 438–444. [Google Scholar] [CrossRef] [PubMed]
- Gardner, M.J.; Altman, D.G. Statistics with Confidence: Confidence Intervals and Statistical Guidelines; John Wiley & Sons: Hoboken, NJ, USA, 1989. [Google Scholar]
- Aslam, M. Introducing Kolmogorov–Smirnov Tests under Uncertainty: An Application to Radioactive Data. ACS Omega 2020, 5, 914–917. [Google Scholar] [CrossRef] [PubMed]
- Shapiro, S.S.; Wilk, M.B. An Analysis of Variance Test for Normality (Complete Samples). Biometrika 1965, 52, 591–611. [Google Scholar] [CrossRef]
- Benneyan, J.C. Statistical Quality Control Methods in Infection Control and Hospital Epidemiology, Part I Introduction and Basic Theory. Infect. Control Hosp. Epidemiol. 1998, 19, 194–214. [Google Scholar] [CrossRef] [PubMed]
- Chen, Y.; Yang, K.; Marušic, A.; Qaseem, A.; Meerpohl, J.J.; Flottorp, S.; Akl, E.A.; Schünemann, H.J.; Chan, E.S.Y.; Falck-Ytter, Y.; et al. A Reporting Tool for Practice Guidelines in Health Care: The RIGHT Statement. Ann. Intern. Med. 2017, 166, 128–132. [Google Scholar] [CrossRef] [PubMed]
- Kaji, A.H.; Schriger, D.; Green, S. Looking Through the Retrospectoscope: Reducing Bias in Emergency Medicine Chart Review Studies. Ann. Emerg. Med. 2014, 64, 292–298. [Google Scholar] [CrossRef] [PubMed]
| Disclaimer/Publisher’s Note: The statements, opinions and data contained in all publications are solely those of the individual author(s) and contributor(s) and not of MDPI and/or the editor(s). MDPI and/or the editor(s) disclaim responsibility for any injury to people or property resulting from any ideas, methods, instructions or products referred to in the content. |