Article

Horizontal Test Stand for Bone Screw Insertion

by
Jack Wilkie
1,2,*,
Georg Rauter
2 and
Knut Möller
1,3,4
1
Institute for Technical Medicine, Hochschule Furtwangen University, 78056 Schwenningen, Germany
2
BIROMED-Lab, Department of Biomedical Engineering, University of Basel, 4123 Allschwil, Switzerland
3
Department of Microsystems Engineering, University of Freiburg, 79110 Freiburg, Germany
4
Center for Bioengineering, Department of Mechanical Engineering, University of Canterbury, Christchurch 8041, New Zealand
*
Author to whom correspondence should be addressed.
Hardware 2024, 2(3), 223-255; https://doi.org/10.3390/hardware2030011
Submission received: 7 May 2024 / Revised: 6 August 2024 / Accepted: 28 August 2024 / Published: 9 September 2024

Abstract

:
Screws are a versatile method of fixation and are often used in orthopaedic surgery. Various specialised geometries are often used for bone screws to optimise their fixation strengths in limited spaces at the expense of manufacturing costs. Additionally, ongoing research is looking to develop systems/models to automatically optimise bone screw tightening torques. For both applications, it is desirable to have a test rig for inserting screws in a regulated, instrumented, and repeatable manner. This work presents such a test rig primarily used for the validation of optimal torque models; however, other applications like the above are easily foreseeable. Key features include controllable insertion velocity profiles, and a high rate measurement of screw torque, angular displacement, and linear displacement. The test rig is constructed from mostly inexpensive components, with the primary costs being the rotational torque sensor (approx. 2000 €), and the remainder being approximately 1000 €. This is in comparison to a biaxial universal testing machine which may exceed 100,000 €. Additionally, the firmware and interface software are designed to be easily extendable. The angular velocity profiling and linear measurement repeatability of the test rig is tested and the torque readings are compared to an off-the-shelf static torque sensor.

1. Introduction

Screws are one of the most versatile and widely used fixation methods. Depending on the context, they can directly provide alignment and axial (in tension) or transverse (in shear) fixation via their inherent geometry and strength, or transverse fixation via axial compression leading to friction in flat joints (more typical of bolts than screws), or simple axial compression (e.g., in orthopedic lag screws). Sparing uses of screws as fasteners are known from as early as the 1480s in armour and firearms, with automation and mechanisation from 1780–1850 leading to widespread usage [1]. Screws historically competed with and had advantages over simpler/cheaper nails due to their superior holding characteristics, especially in thin materials and precise mechanisms or those that may be subject to vibration/shock [1]. Presently competing techniques include welding, press-fitting, snap-fitting, and adhesives, which all occupy different niches in manufacturing and assembly due to their unique advantages and disadvantages.
Bone screws are specialised screws designed to be threaded into bone. As bone is often much weaker than the typical engineering materials used in normal screws, the thread profiles are more complex and optimised to limit the stresses induced in bone and provide the maximum fixation strength in a given space; although this results in more expensive screws. This is in contrast to the engineering solution of simply using a bigger screw or higher-rated material; as anatomical geometry is generally predetermined, and bone cannot simply be substituted with a stronger material, the specialised screws are a necessity.
Bone screws are used in a variety of ways. Individual screws can be used to fuse small fragments of fractured bones and in less strength-critical regions [2]. Screws can be combined with plates or more complex devices [3,4] to distribute the load of larger fractures over more holes and to fix more complex fractures with specifically shaped plates. Screws can also be used to hold implants in place [5], although non-screw-based methods are also popular [6].
With bone screws, the tightening torque used can be important for the fixation quality. If the screw is too loose, it may come out over time, compromising longevity [7]. If it is too tight then the threads in the bone may be partly or fully damaged, compromising the strength of the fixation [8]. This is especially important in the soft cancellous bone, in patients with low bone density such as sedentary elderly people, those with osteoporosis [9], or any combination thereof.
The current state-of-the-art in surgery generally involves surgeons tightening screws ad-hoc, and using their experience and tactile feedback to decide on the tightness. While this often gives good results, it is a subjective judgement, and human factors like stress, and fatigue may affect it; furthermore, less experienced or skilled surgeons may not achieve the same results as more skilled or experienced ones [10]. In the future, medicine may also incorporate robotic surgery, in which case a system may be required to regulate torque without a surgeon in the loop. For these reasons, it may be desirable to develop an algorithm to provide consistent and objective torque recommendations that can be implemented into a torque indicator (e.g., a visual or auditory indication of sufficient torque) or torque limiter (e.g., electro-mechanical clutch in the screwdriver).
A number of approaches to regulate bone screw torque have been attempted. An empirical method of detecting tightening by a change in the torque time derivative was developed by Thomas et al. [11]. Another empirical method estimating the stripping torque as a multiple of the “plateau” torque was proposed and tested by Reynolds et al. [12]. Wright et al. [13] showed a relationship between acoustic emissions during insertion and the stripping torque. Wilkie et al. [14] developed a simple model-based method to determine the bone strength through parameter identification, which was later extended to handle arbitrary geometry [15], then the strength was used to calculate the maximum torque [16].
Any proposed model must be tested in practice. The gold standard would be in a clinical trial; however, this requires initial feasibility testing in a more controlled environment. Hence, there is a requirement to develop a test rig for the purpose of collecting data to validate the aforementioned approaches offline, which can be used to test the methods online. Such a test rig may also be useful for examining many other aspects of screw fixation, such as the relationship between insertion speed and insertion torque [17].
Due to the necessity of a test rig, researchers have also developed their own solutions in the past. Depending on the needs of the research, these have exhibited different features [11,18]. For example, measuring axial force may be prioritised [18], or screw compressive force measurement may be needed [11]. Commercial general-purpose products are also available, for example, a suitable device may be the bi-axial (linear/torsion) Instron Electropuls E3000; however, these universal testing machines are bulky and expensive (in excess of 100,000 € without fixtures [19]) compared to a purpose-built device if the generality is not required.
In the test rig developed herein, the key required features were torque and rotation measurement, and repeatable screw insertion. The torque and rotation measurements were achieved with a rotational torque sensor with an inbuilt rotary encoder. The repeatable insertions were achieved with a direct-drive closed-loop controlled stepper motor and a counterweight on a pulley for constant axial force. Secondary features were velocity profiling of the insertion with a wide range of supported speeds, and axial position measurement. Velocity profiling/control was achieved through the firmware (and facilitated through the motor/controller selection), and axial position measurement was achieved with a draw wire encoder.
This paper covers the design and construction of a test rig for screw insertion testing, with justification for the decisions taken and alternatives presented where relevant, if the design is to be adapted for other purposes. The final built test rig is also compared with an off-the-shelf non-rotational torque sensor for accuracy, and the motor velocity profiling is validated.

2. Design

2.1. Concept

The application for this test rig requires repeatable and measurable screw insertion into test samples. This was achieved using a closed-loop stepper motor running through a rotational torque sensor. The screw-driving components were mounted on an aluminium plate that slid along two linear guide rails, with a counterweight to provide axial force. A clamp was also built on the same base as the rails to hold the test samples at an appropriate height.
For real-time motor control and data acquisition, and to safely package the power supply and motor driver, a control box was designed with a microcontroller inside. A USB-serial interface was used to connect to a desktop application on a PC for higher-level functions and to give a simple GUI for controlling the test stand.
Considerations were made with the hardware and software design to streamline the testing process. Additionally, the firmware was developed to support constant- and profiled-velocity insertion.

2.2. Test Stand

The first main component of the test stand hardware is the motor (A in Figure 1). A high-torque-capacity closed loop stepper motor (34HS46-6004D-E100, OMC Co., Ltd., Jiangning Nanjing City, China) was used as it was affordable and versatile, and able to provide at least 5 Nm with the 48 V power supply used. The motor driver (CL86T, OMC Co., Ltd.) uses feedback from a 1000 PPR quadrature encoder (4000 CPR) built into the motor to intelligently control the stepper motor, providing only the required current to maintain positional accuracy, reducing heat and noise compared to a traditional open loop stepper driver, and compensating for any potential missed steps. This closed-loop stepper motor provides similar functionality to an industrial servo motor, but at a lower price, with the disadvantage of lower efficiency and performance; however, these disadvantages are non-critical for this application.
The second main component is the torque sensor (B in Figure 1). The final version of the test rig utilised a 5 Nm range rotational torque sensor (NCTE-2300-5-1-AU-0-0, NCTE AG, Oberhaching, Germany), although testing was also conducted using a 20 Nm sensor (NCTE-2300-20-1-AU-0-0, NCTE AG) before finding that the 5 Nm range was sufficient, and changing to the lower range sensor to improve accuracy. A higher capacity like 10 or 20 Nm could still be used if durability is a concern or if stronger materials requiring higher torque were to be tested; however, the motor would also need to be upgraded in the latter case to provide the increased torque. This torque sensor also contained a 360 PPR (1440 CPR) quadrature encoder which was used in the data collection, providing 0.25 deg resolution. The torque sensor provides analogue 1–9 V output (linearly mapped to −5 to +5 Nm), and a digital USB interface for torque readings; for ease of use, the analogue output was used to route the signal through the microcontroller and provide an integrated control and data-acquisition experience, and also allow additional data correction (specifically, calibrating rotational variation out of the torque signal).
To allow easy interchanging of different screws, a magnetic 1/4″ hexagonal drive socket was attached after the torque sensor to allow interchangeable screwdriver tips to be used (C in Figure 1).
To connect the rotational components, off-the-shelf couplers were used (D in Figure 1). They are listed in the BOM (Bill of Materials) below. The type of coupler was not strongly considered, as the availability of couplers with the correct sizes was too limited. The stepper motor to torque sensor connection had an adaptor from the 14 mm shaft with a key to a 9 mm shaft with a key (only set screws to prevent axial slippage), and between the sensor and screw bit holder was a coupler with a 9 mm keyed connection to a 10 mm clamp/friction connection. If any substitutions are to be made with these parts, the coupler selections should be re-evaluated. The couplers allow a small degree of misalignment; however, they were not specifically selected to allow large misalignments, so care should be taken in assembly. As the motor shaft height with respect to the mounting surface was greater than that for the torque sensor, a 3D-printed stand-off/mount was made for the torque sensor.
To measure the linear motion of the screw, a draw-wire encoder was used (E in Figure 1). This contains a spring-loaded 100 mm circumference drum with 2000 mm of wire wound around it attached to a 1000 PPR (4000 CPR) quadrature encoder. The wire is pulled through a grommet in the side of the sensor, rotating the drum proportional to the wire extension, with a linear resolution of 0.025 mm.
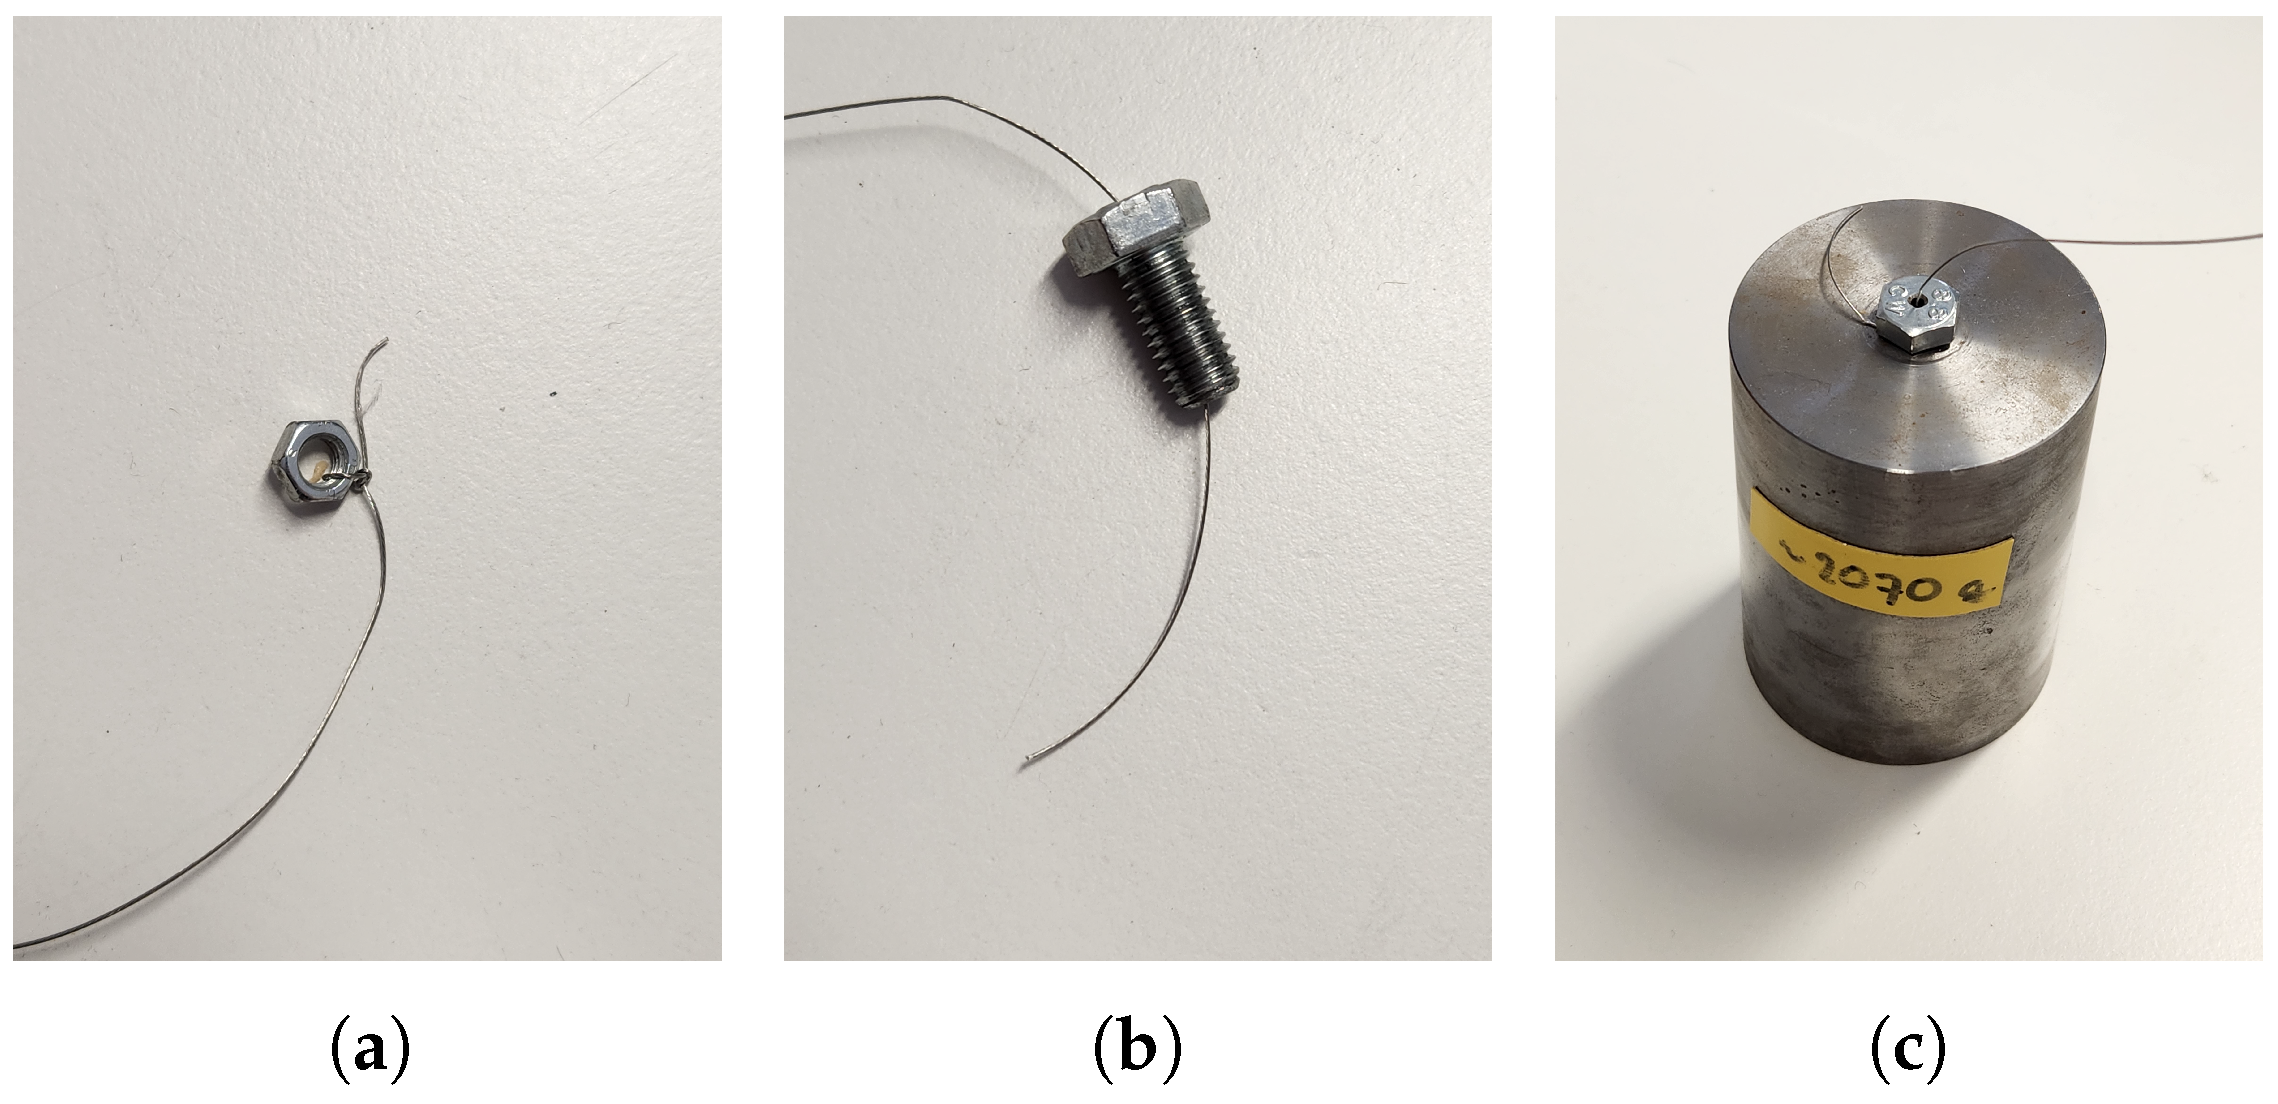
The motor, torque sensor, and draw-wire encoder were all mounted on an aluminium plate (F in Figure 1). The torque sensor (on the stand-off) and the motor were mounted with screws through slots to allow the exact spacing to be adjusted and allow a little alignment. This plate was then mounted with linear bearing blocks on 16 mm cylindrical linear rails (G in Figure 1). A metal wire was attached through a hole in a small block screwed underneath the platform; this was then run over a pulley and connected to a counterweight (H in Figure 1) to pull the sliding platform into the test samples and provide axial force. The counterweight was a simple steel cylinder machined to be approximately 2.0 kg, a threaded hole was made in the top of the counterweight, and the wire was threaded through and bent around a hollow screw, which was then screwed into the counterweight to secure the wire.
The base of the test rig (I in Figure 1) was made out of aluminium extrusion sections. These were secured together with screws and T-nuts to form the frame and base of the sample clamp as shown in the build instructions below. The counterweight pulley was attached on the opposite side of the clamp with a hole through the clamp base to pass the wire through.
The clamp (J in Figure 1) was formed with two milled aluminium plates. Technical drawings are supplied in the Supplementary Information. The lower plate had a step milled in it to align test samples against. The upper plate also had the back-end milled, to focus the clamping forces on the test sample. Threaded rods were used to make the clamping mechanism with a metal block at the back to keep the plate flat. The lower clamping plate was screwed onto the aluminium extrusion with spacers so that the holes in the test samples were aligned with the screwdriver shaft on the sliding platform.
The overall dimensions of the text stand including clearance for cabling and excluding the counterweight are 700 mm × 300 mm × 300 mm. The device weighs approx 30 kg. This is in comparison to the previously-mentioned Instron E3000 Universal testing machine which is approximately 700 mm × 450 mm × 1800 mm including clearances, and weighs 250 kg; also with a substantially larger and heavier controller. This cannot be compared quantitatively with the designs from Betts et al. [18] and Thomas et al. [11] as they do not list dimensions or weight, however, qualitatively Betts et al. [18] appears lighter and more compact, and Thomas et al. [11] appears heavier and a little larger. In all cases, the size/weight differences are in combination with different functionalities and load capacities, so care should be taken to interpret the comparison.

2.3. Controller Hardware

The test rig controller, shown in Figure 2, safely packages the power supply and motor driver, and provides an interface between these, the PC, and the sensors on the test stand.
Note, that this design contains an AC-DC power supply with 220 V/110 V input. These electrical voltages are hazardous and usage may be subject to safety regulations. The controller box should always be unplugged before the case is opened.
Based on the stepper motor/driver requirements (48 VDC, 6 A), a 300 W, 48 VDC PSU was selected (A in Figure 2). A switched and fused electrical socket (B in Figure 2) was installed in the back of the case, and wires with appropriately crimped connectors were used between the connector and the PSU, with insulated spade connectors to the power socket connector, and ferrule crimps to the power-supply clamp terminals.
The stepper motor driver (C in Figure 2) was purchased as part of a kit with the stepper motor (CL86T, OMC Co., Ltd.). This was wired to the 48V DC output of the PSU with appropriately sized wires. The motor power and feedback encoder cables were passed through individual grommets (D in Figure 2) in the front of the case and then directly wired to the driver. The grommets provided a degree of strain relief for the cables, however, excessive force must still be avoided.
The “Tiva” Launchpad/EK-TM4C123GXL development board (E in Figure 2) was used as the micro-controller for the test rig. This contained some notable features, such as hardware quadrature encoder peripherals, and a built-in ADC peripheral. The 80 MHz Arm Cortex-M4F core and DMA functionality also provides the required performance for real-time signal processing, and the 32 KB RAM was also sufficient for the application.
Connectors were mounted on the front of the control box as much as possible to allow easy attachment/detachment of the test stand for storage or transport. The motor cables were the exception to this; however, they still had inline connectors to detach the motor. A female case mount plug for the torque sensor used a circular connector (F in Figure 2) to match the torque sensor. The torque sensor came with a single-end female terminated cable, and the other end was terminated with a matching male connector. Although any (ideally shielded) 8-pin connector could be used, as long as the cable termination and case connector mate. An additional male was intended for USB pass-through; however, this remains unimplemented, so it is visible in the pictures but will not be discussed further. The draw-wire encoder cable came unterminated, so an 8-pin standard DIN connector (G in Figure 2) was used with a case-mount connector on the control box and a cable connector to terminate the cable; however, any appropriate connector could be used. See BOM for the exact part numbers used.
The signal from the torque sensor had a range of 0–10 V (1–9 V outside of the error state). A voltage divider was used to reduce this within the range of the Tiva ADC. 56 k Ω and 27 k Ω resistors were used to convert 0–10 V to approximately 0–3.25 V. Inexpensive 5% resistors were used and then the ADC values were calibrated with a linear correction using a precision voltage source. The input resistance exceeding 56 k Ω and the output resistance of the torque sensor being specified less than 1 Ω resulted in little loading on the signal, and the resistance was still small enough for the thermal (Johnson) noise from the resistors to be on the order of 1 µV.
Everything was mounted in an RS PRO Instrument Case, mainly using 3D printed parts (H in Figure 2), or screws as appropriate for case connectors. This case was chosen as it fit all of the components with little room for connection. Any similar (or dissimilar) case could have been used instead, however, all provided 3D print files for mounting components were based on this model. The components were mounted to the sides of the case, allowing the top or bottom to be removed (not both at once for stability reasons) to allow easy access to internal hardware if needed. All connections were made through the front/back plates. The vent grates were positioned over the power supply fan to promote airflow there. The details are in the assembly section.

2.4. Controller Firmware

The firmware was developed in Code Composer Studio (CCS) which is an eclipse-based IDE by Texas Instruments (TI) for C/C++. CCS supports GCC or the proprietary TI compiler; in this case, the TI compiler was used. The code is provided in a Zip archive below.
FreeRTOS was used to make the firmware. This is a preemptive multitasking real-time operating system. This allows a number of functions of the firmware to be separated into independent “Tasks” for simpler design and modularity. Simple C++ object-oriented programming principles were used to simplify/modularise the design as appropriate. The tasks and main interfaces are summarised in Figure 3.
The “void main()” entry function serves to create all “globally” shared resources, and tasks with appropriate pointers to the shared resources and peripherals (defined in “PeriphDefines(.cpp/.hpp)”), then it passes control to the task scheduler. Where practical, peripherals and RTOS functions were wrapped in helper classes to abstract/simplify access and allow easier porting. The tasks were all instantiated from classes derived from “BaseTask”, which handles setting task priority, memory, etc. All tasks had a “Setup()” method to run startup code before the scheduler began, and a “TaskMethod()” method to be run from the scheduler. As is common with FreeRTOS, generally the tasks ran infinite loops with a FreeRTOS delay function at the end of the loop block to control their repetition frequency and prevent them from using all the CPU time. If a slow task takes a long time and other higher-priority tasks are due, the FreeRTOS scheduler could pause the slower/low-priority task to quickly run the faster/high-priority task before returning to the lower-priority one. FreeRTOS did this by periodically interrupting the running task and checking if other tasks were due to run; by default, this was conducted 1000 times per second to reduce the overhead from the interrupts/context-switching, but here the frequency was increased to 10,000 as some tasks in this firmware were designed to run with sub-millisecond timing.
A “Settings” and “Status” class was made to provide access to common global variables, with one instance of each being made in “main()” and pointers being passed to all tasks that needed them. The Settings class was intended for more persistent variables/preferences that could be saved and loaded from EEPROM. The settings were generally all directly externally configurable with the exception of the “Raw Mode” settings (described below) which had some additional logic. The Status object was for more transient/rapidly changing variables like sensor readings or status text; these were generally only changed by the firmware and could not be externally controlled.
One of the lower-level tasks was “MotorTask” which directly controlled the GPIO pins to the stepper driver. Notably, this task had two modes selected by a pre-processor flag “PWM_BASED”. If PWM_BASED is not defined, the function will simply send the appropriate number of pulses to the stepper motor as fast as possible (allowed by the driver data sheet) at the beginning of every 1 ms using the standard GPIO pin-set functions. This worked well but led to slightly less smooth/louder motor control, and resulted in the task using more CPU time as the motor needed to spin faster and obtain more pulses per millisecond, possibly preventing other tasks running as needed. If PWM_BASED was defined, it instead used the device-specific PWM peripheral functions to generate a pulse train at the appropriate frequency to spread the same number of pulses out over the whole 1 ms period; setting this frequency only required a few small calculations/instructions/register writes within a few microseconds, then the task suspended for the rest of the 1 ms period, leading to a constant CPU load regardless of motor speed. This potentially allowed a few motor steps to be missed due to quantisation in the pulse frequency calculations/settings; however, this amounts to only a degree or so over a full insertion and the advantages are considered worthwhile. In the event that perfect positional accuracy is more pertinent, or when porting to a device without appropriate PWM (or for easier porting without needing the device-specific PWM API calls), the PWM_BASED mode can be simply disabled at the top of MotorTask.hpp.
A higher-level task is “MotionTask”, which was closely related to motor control. This used FreeRTOS queues and read high-level commands (Start, Stop, Reset, etc.) from an event queue, and based on the current Settings it generated motion profiles as ramping velocity segments to pass to the MotorTask using another queue. The current code was designed for constant velocity or repeating trapezoidal velocity profiles; however, further types could be implemented in this task as needed (e.g., using an arbitrary waveform). When idle it checked every 10 ms for commands, and when running it continually enqueued motion segments, blocking the task and consuming no CPU time whenever the queue is filled. Only a shallow queue of 2 was used for motion segments; however, the control queue length is 16 to ensure events are not dropped (there should not be large numbers of commands in quick succession, normally at most 2 or 3 if stop and reset commands are enqueued simultaneously, for example).
The “DatalogTask” was another low-level task designed to read sensor inputs. It interfaced with the quadrature encoder interfaces (QEIs) of the microcontroller to read the linear and angular displacements from the test rig. It also utilised direct memory access (DMA) and associated interrupts to allow high-rate sampling of the analogue torque input at 1 MSa (Mega-sample/s) and applied an FIR filter to the data to anti-alias the data before down-sampling to 1000 Hz via decimation. The sensor values were always written to the Status object. Depending on the mode of operation, this task also outputs values over the serial connection. If “Raw Mode” was enabled, then for every cycle (1 ms) the task would output a compact form of the current sensor values. Raw mode was primarily used to stream data to the desktop application during experiments, allowing high-rate measurements with minimal text processing overhead; in this mode, the DatalogTask also took over reporting status text to avoid conflicts with using the serial port. Outside of Raw Mode, the data and status text were reported by “UartStatusTask” in a more human-readable manner. This task did not use the FreeRTOS timing functions and instead ran based on the timing of DMA operations (which trigger an interrupt every 250 data points) which were, in turn, regulated by the speed of ADC readings which ran at the maximum rate of 1 MSa, with four-sample hardware averaging to 250 kSa. Fixed-point operations were used to apply the filter to torque data in an efficient way, and the hard-coded voltage calibration was applied to the resulting fixed-point value before it was converted into a decimal value for serial output. The coefficients of the FIR filter were stored in the FirCoeffs.cpp file, and only half of the coefficients are stored as the filter is symmetric. These coefficients were designed using the MATLAB R2020a fixed-point toolbox (script linked in Supplementary Files). The 4-point hardware average was utilised to reduce the computation requirements/filter length when down-sampling. The simulated filter including hardware down-sampling exceeded 60 dB stop-band attenuation.
Some additional code in the DatalogTask was used to self-calibrate/zero the torque sensor. It was noted that there was some rotation-dependent offset on the torque sensor, so this code worked with the UartControlTask and MotionTask to record unloaded torque samples while rotating the sensor. The averages were saved in a lookup array and were applied as corrections to the readings during data recording.
The “UartStatusTask” operated when Raw Mode was disabled to provide a user interface over a serial console. This was used in earlier stages of development but is mostly unused due to the current GUI. It printed the current sensor readings and status text to a serial console every 100 ms. Special terminal control sequences were used to move the cursor around and overwrite the previous readings to make the display smoother when using a compatible console.
The “UartControlTask” was the interface to send commands to the test rig. Most of the commands were reflected as buttons in the GUI described below. The “set” and “get” commands were used to directly change the settings in the Settings object based on three-character variable names, e.g., “set ind 4000” set the insertion distance to 4000 motor pulses (1 revolution). “start”, “stop”, “pause”, and “jog” sent commands to the MotionTask and set the status as appropriate to enable or disable the motor. “selfcal” initiated the previously mentioned self-calibration/zeroing. “zero” performed a quick re-zero of an encoder axis. “sysrst” rebooted the micro-controller. “rawmode [0/1]” controlled the previously mentioned Raw Mode. “save_eeprom”, “load_eeprom” and “reset_eeprom” saved or loaded the persistent settings in the micro-controller that were configured on boot, or reset the hard-coded defaults.

2.5. Software

The main functions of the interface software were to coordinate data between a variety of input devices (e.g., this test rig) and outputs (usually files), and to handle any synchronisation/triggering of dissimilar devices. Some additional ad-hoc functions have been added to aid other research tasks.
Devices could either be set as polling or interrupting. Polling devices send a data point whenever they receive a trigger signal while interrupting devices send them periodically (or aperiodically) regardless of triggers. The software was set up so that any interrupting device can be used to trigger other devices when a data-point is sent. The software offered some options to save data in one file together, or multiple files with one per device; additionally the data could be synchronised at the file saving stage (useful in the case of multiple interrupting devices), in which one devices data point would save a row with the last data point received from all other devices. The software timestamps all data-points saved using the time from the beginning of the recording and the filenames with the current date/time to simplify data labelling. If only polling devices were used, the software provided an “internal trigger” function to regularly trigger the sampling.
All of the devices were programmed as implementations of the “IDevice” interface (which includes the “ITriggerSource” interface). As serial devices were expected to be common, and were already implemented twice in the software, lower level/common serial functionality was incorporated in the “BaseSerialDevice” class to avoid repeating it. The devices had a number of events that were used for the devices to update a common user interface (e.g., buttons enabled/disabled) based on the status of the device in an abstracted/encapsulated manner (e.g., a “Connected” serial device will not allow the port to be changed). The devices also had a number of functions that must be implemented to allow the user interface to control the devices. To differentiate base classes like “BaseSerialDevice” from real devices like “BoneScrewTestRigDevice”, an attribute was applied to the classes that should be listed in the device types list, also allowing a user-friendly name string to be set.
The main important device for the test rig was the “BoneScrewTestRigDevice”. This was based on the “BaseSerialDevice” class. Notably, when connecting to the test rig, it set it into “Raw Mode” described above. Then, all serial lines from the test rig were processed either as status messages (lines beginning with “!”), or sensor readings (always in the form “T:[Torque];R:[Rotation];D[Linear position];\r\n”). The test rig also used the software functionality to support a custom dialogue to configure it and control it in a simple manner. The custom dialog (Demonstrated in Section 4) was relatively simple, displaying all values from the test rig and allowing most commands to be accessed with individual buttons. Some functions were intended to enhance ease of use, for example, the settings were referred to using human-readable names instead of their three-letter acronyms, and a slider allowed the UI to be locked to prevent accidental changes during long (e.g., low-speed) tests.
As discussed in Section 5.1, the torque sensor in the test rig was compared to an off-the-shelf stationary torque sensor. This was also implemented in this software as another derived class from “BaseSerialDevice” as “SauterTorqueSensor”. As most of the serial complexities were already contained in the “BaseSerialDevice” class, the interface required less than 50 lines of code (including generous white space) to simply configure options, parse readings, and send basic commands.
A prototype smart screwdriver was also interfaced with. This used a notably different interface using HTTP server-sent events. As previous devices all had a form of port number, and this used an IP address, an empty “IIPDevice” interface was added to indicate a device used IP instead of Serial. This indicated that the UI should semantically interpret the “Port” of the device as an IP address, and the display was changed slightly. In this case, HTTP was used but this could feasibly be used for any IP/URL address input. The implementation of this device opened an HTTP stream to receive data points from the specified IP. As the points were received, they were parsed and sent to the rest of the software.
Some project-specific functionality was added to the software to demonstrate insertion torque optimisation models at a trade show. These are shown in Figure A4 and Figure A5 in Appendix B.
Some example Test/Simulated devices were also added to verify the functioning of the software when a test rig was unavailable or inconvenient. The test device was simply a minimal implementation of a serial device and can be used as a template for adding other serial devices. The simulated device emulated a test rig with basic torque-rotation data to test that the torque-optimisation demos are working, e.g., for presentations, videos, or similar, where an experimental demonstration may be impractical.

2.6. Modification

See Appendix A for information and suggestions regarding hardware substitutions and modifications.

3. Build Instructions

3.1. Bill of Materials/Tools

The required tools are listed in Table 1 and the parts/materials are in Table 2 and Table 3.

3.2. Test Stand

Prepare all metal parts in accordance with mechanical drawings if not done so already. Additionally, for both of the 700 mm aluminium extrusions, drill parallel holes through the center at 75 mm, 225 mm, and 375 mm from one end with a 6.5 mm drill bit for M6 screws later. For the 100 × 100 aluminium section, drill centred 8.5 mm holes through one side at 20 mm from each end for M8 screws later; on the two perpendicular sides drill 5 mm holes in the exact center for the counterweight cable to pass through. Break any rough edges on the holes as much as is feasible. Cut the M6 threaded rod into two lengths of 75 mm and smooth the burrs with a hand file.
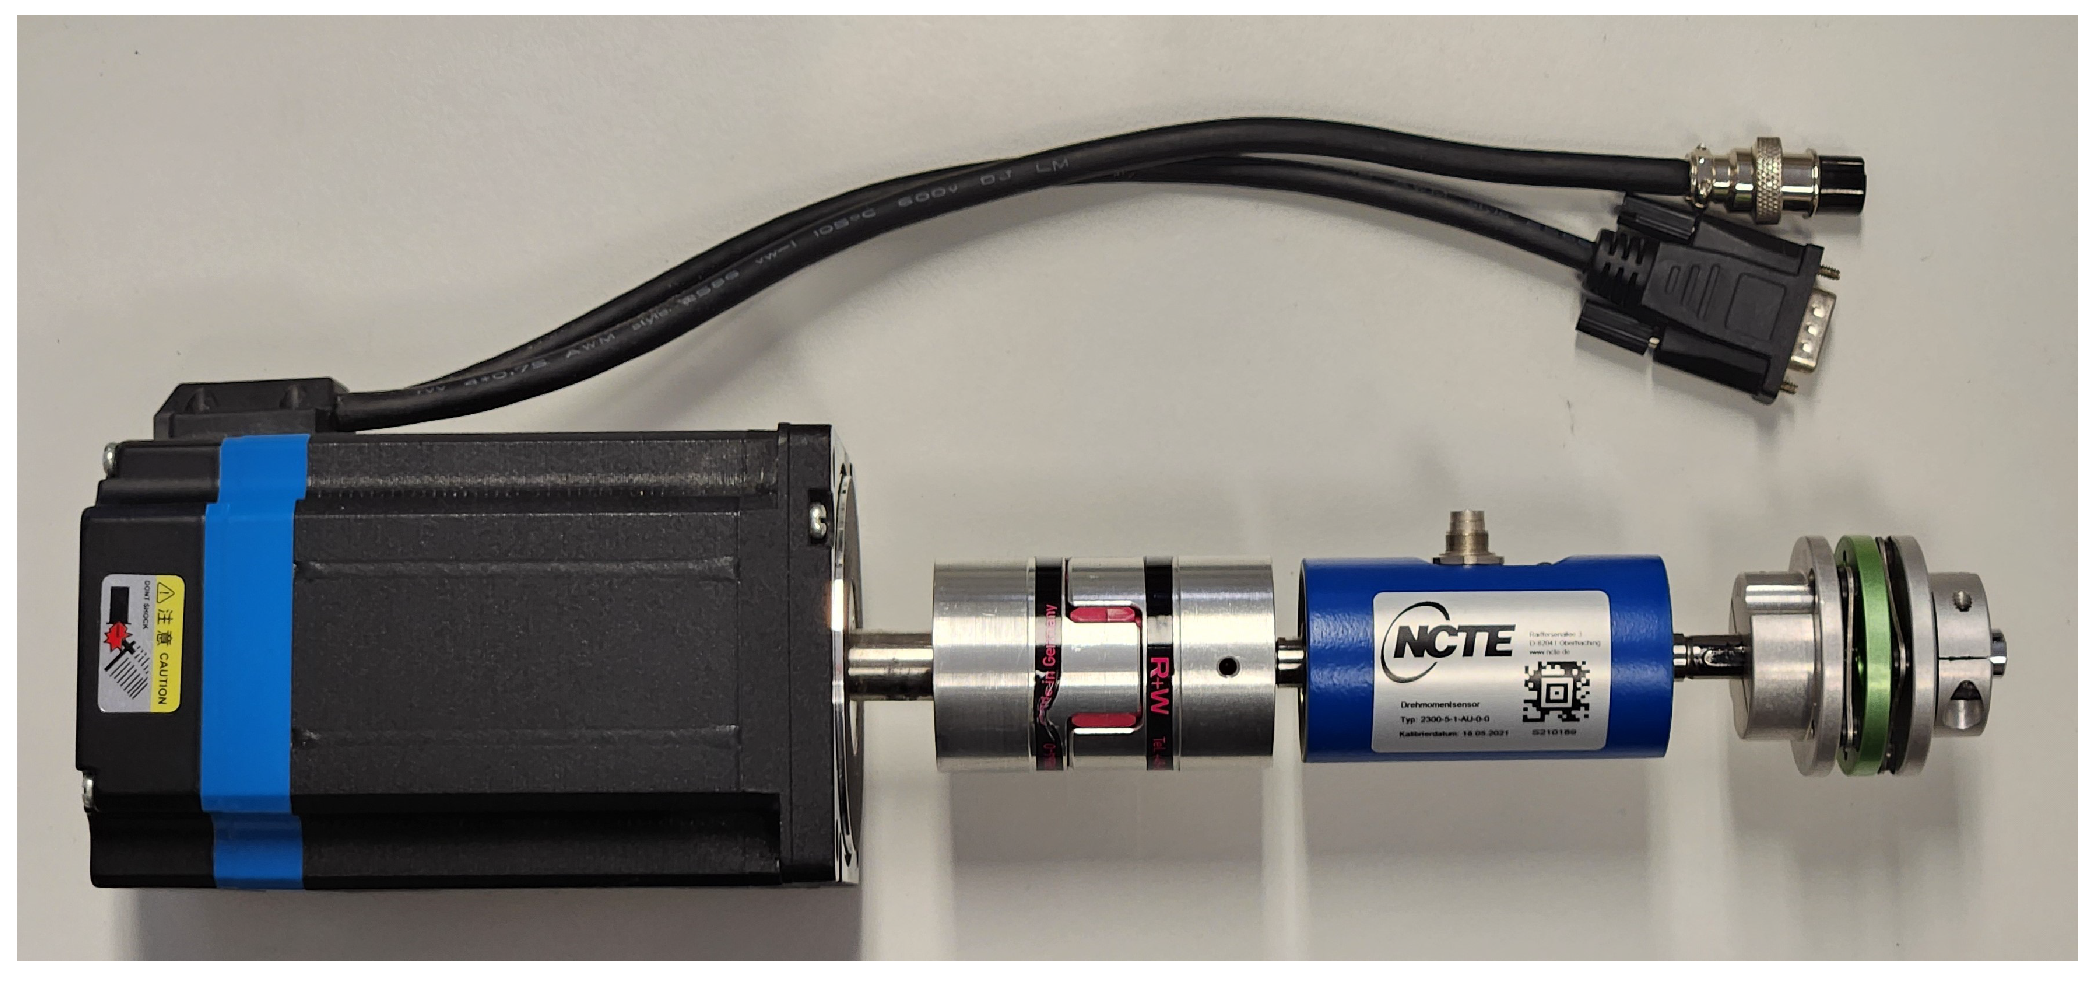
Start by coupling the rotating components as shown in Figure 4. The couplers can be tightened a little to stop them from falling apart, but it may be good to adjust the exact spacing later so final tightening is not yet necessary. Take care not to apply excessive bending forces to the motor or torque sensor shafts.
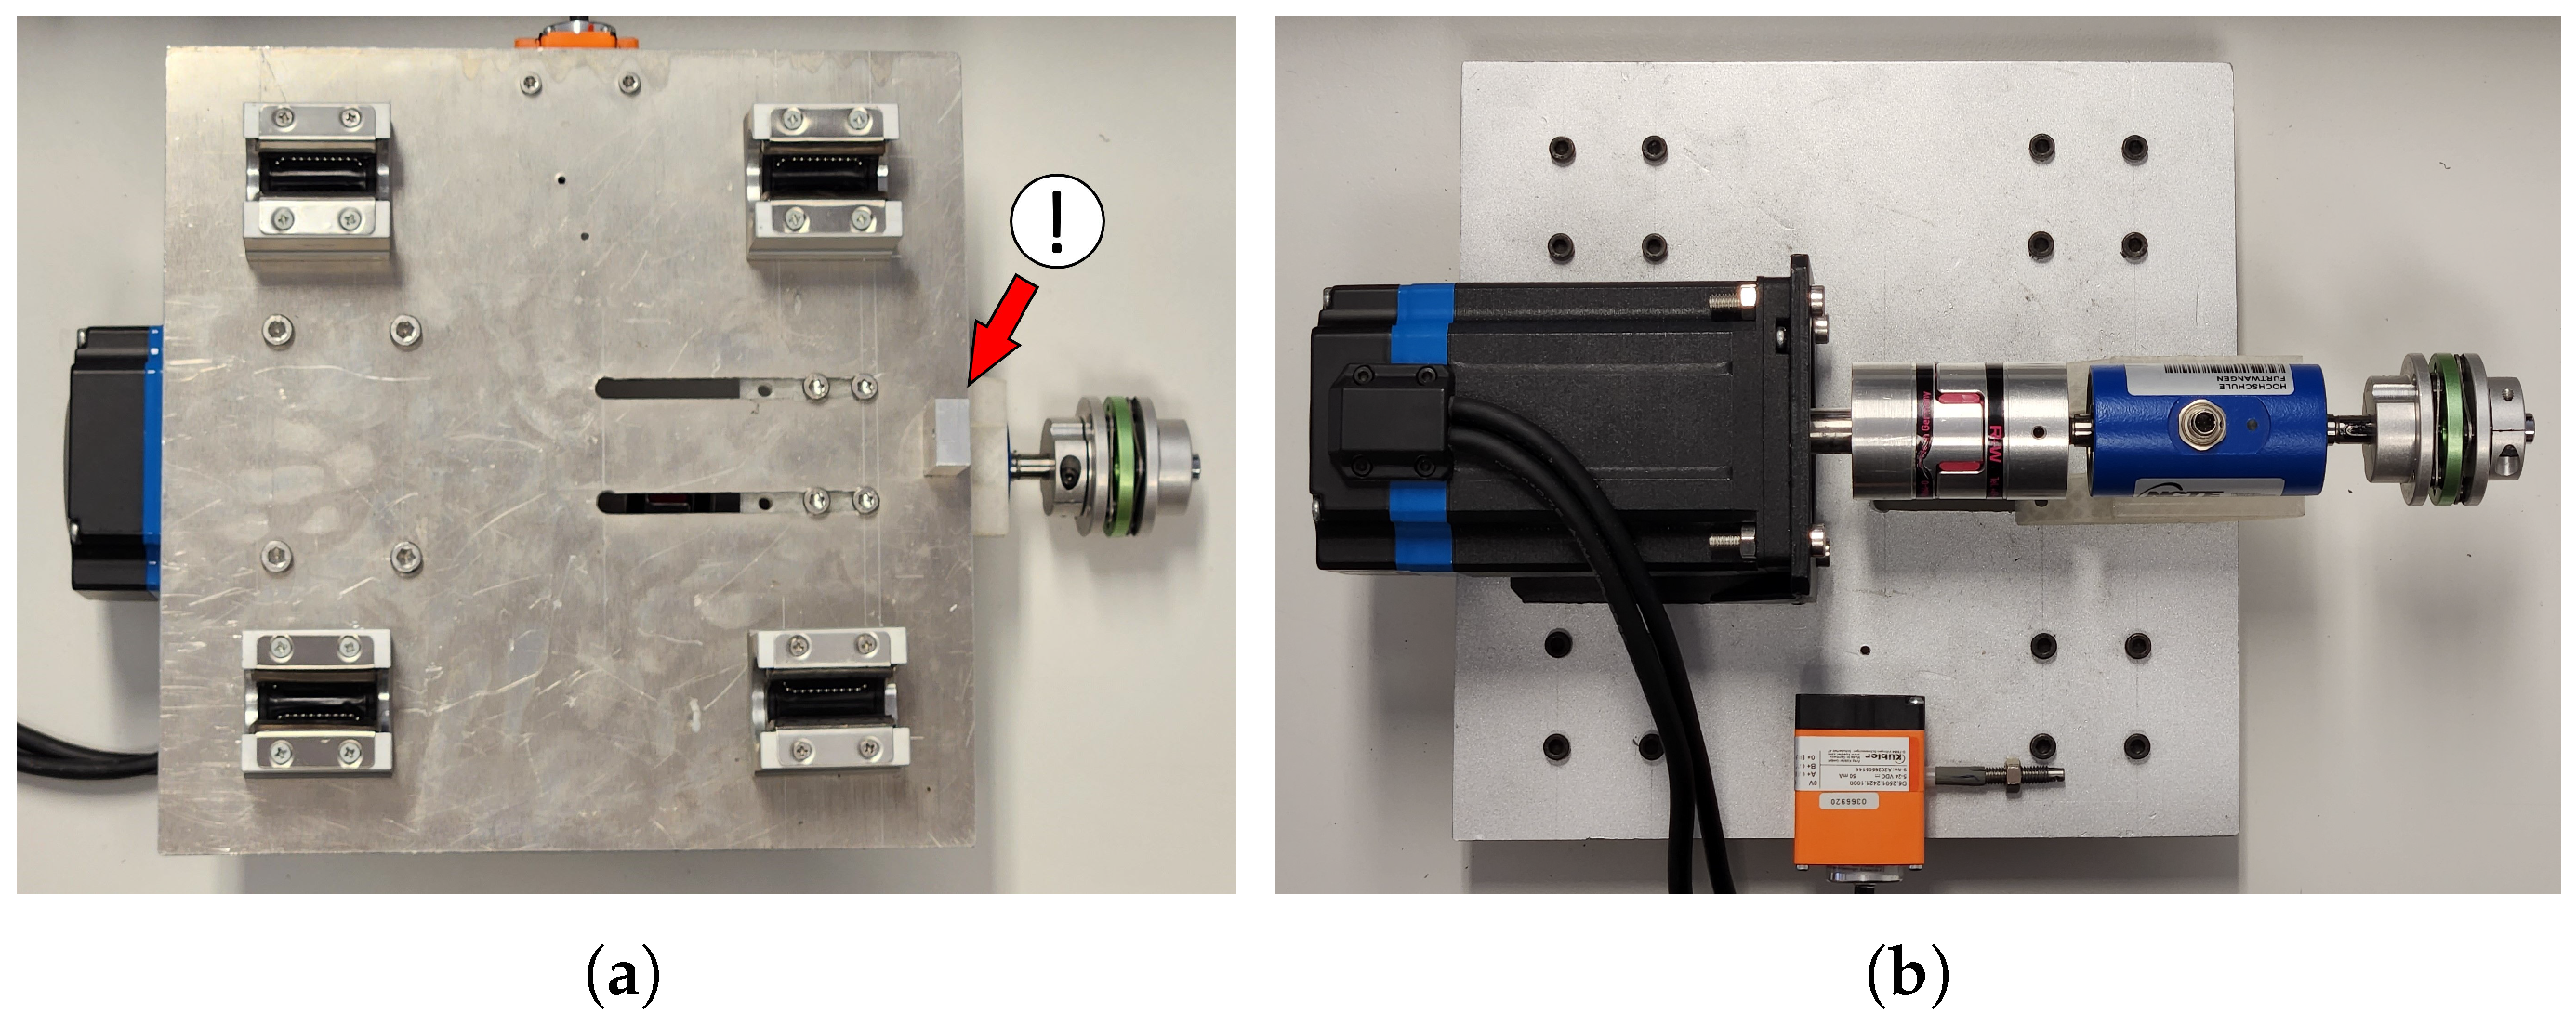
Then, add the mounting plate to the motor, secured with M6x30 screws and nuts. Also, add the stand-off 3D print to the torque sensor with M4x12 screws. Then, before mounting the rotating components, mount the wire holding block to the bottom of the platform using two M3.5x10 screws. Then, the motor and torque sensor on their mounts can be screwed into the sliding plate (with nuts for the motor mount). Adjust the coupler spacing as desired and tighten the coupler screws as needed. The keyed connections need minimal tightening to prevent axial slippage as the key transfers the torque. The coupler clamping the screw bit holder needs more torque to prevent rotational slippage, and perhaps some shimming if the fit is not tight enough. Also, add the draw-wire encoder and secure it with M4x12 screws to the sliding plate making sure the wire comes out in the correct direction. The assembly should look like Figure 5.
Build up the base of the test stand. Mount the 30 × 30 mm cross supports to the 700 mm long extrusions where the previously drilled holes are. Pass the screws through the holes from underneath and tighten them into the “8 B-Type” M6 T-nuts slotted into the 30 × 30 channels. Align the ends of the cross supports with the edges of the long extrusion, and make sure the connections are square and not parallelogram-angled. Add the linear rails on top of the cross supports and loosely attach them to the cross support passing M5x10 screws from above into “8 B-Type” M5 T-nuts in the channels; it may help to position the nuts before placing the rails on top. Only loosely attach the rails. The base should look like Figure 6.
Loosely mount the bearing blocks on the sliding plate with M5x10 screws, do not tighten yet. Slide the bearing blocks onto the linear rails; if they do not go on easily, try loosening the connections more. Carefully and slowly tighten the screws on the base and bearing blocks progressively while wiggling and sliding the platform regularly up and down to ensure all parts of the bearing blocks and rails are aligned. If the sliding platform becomes difficult to slide, it has probably been unevenly tightened; so try again after loosening the screws slightly again. The combined assembly should look like Figure 7.
At the opposite end of the long support rails, add the M8 t-nuts at the top of the channel and pass the M8x16 screws through from the inside of the holes in the 100 × 100 extrusion into the nuts; don’t tighten yet. Also, attach the 90-degree angle brackets to the top of the long support rails with M6x16 screws and “10 B-Type” M6 t-nuts with the flat side facing towards the large 100 × 100 extrusion. Slide the 100 × 100 extrusion flush against the angle brackets and align the ends of the angle brackets with the ends of the 700 mm extrusion. Tighten the screws holding the extrusion and the brackets tightly to avoid the sample clamp sliding in use. This should now look like Figure 8a.
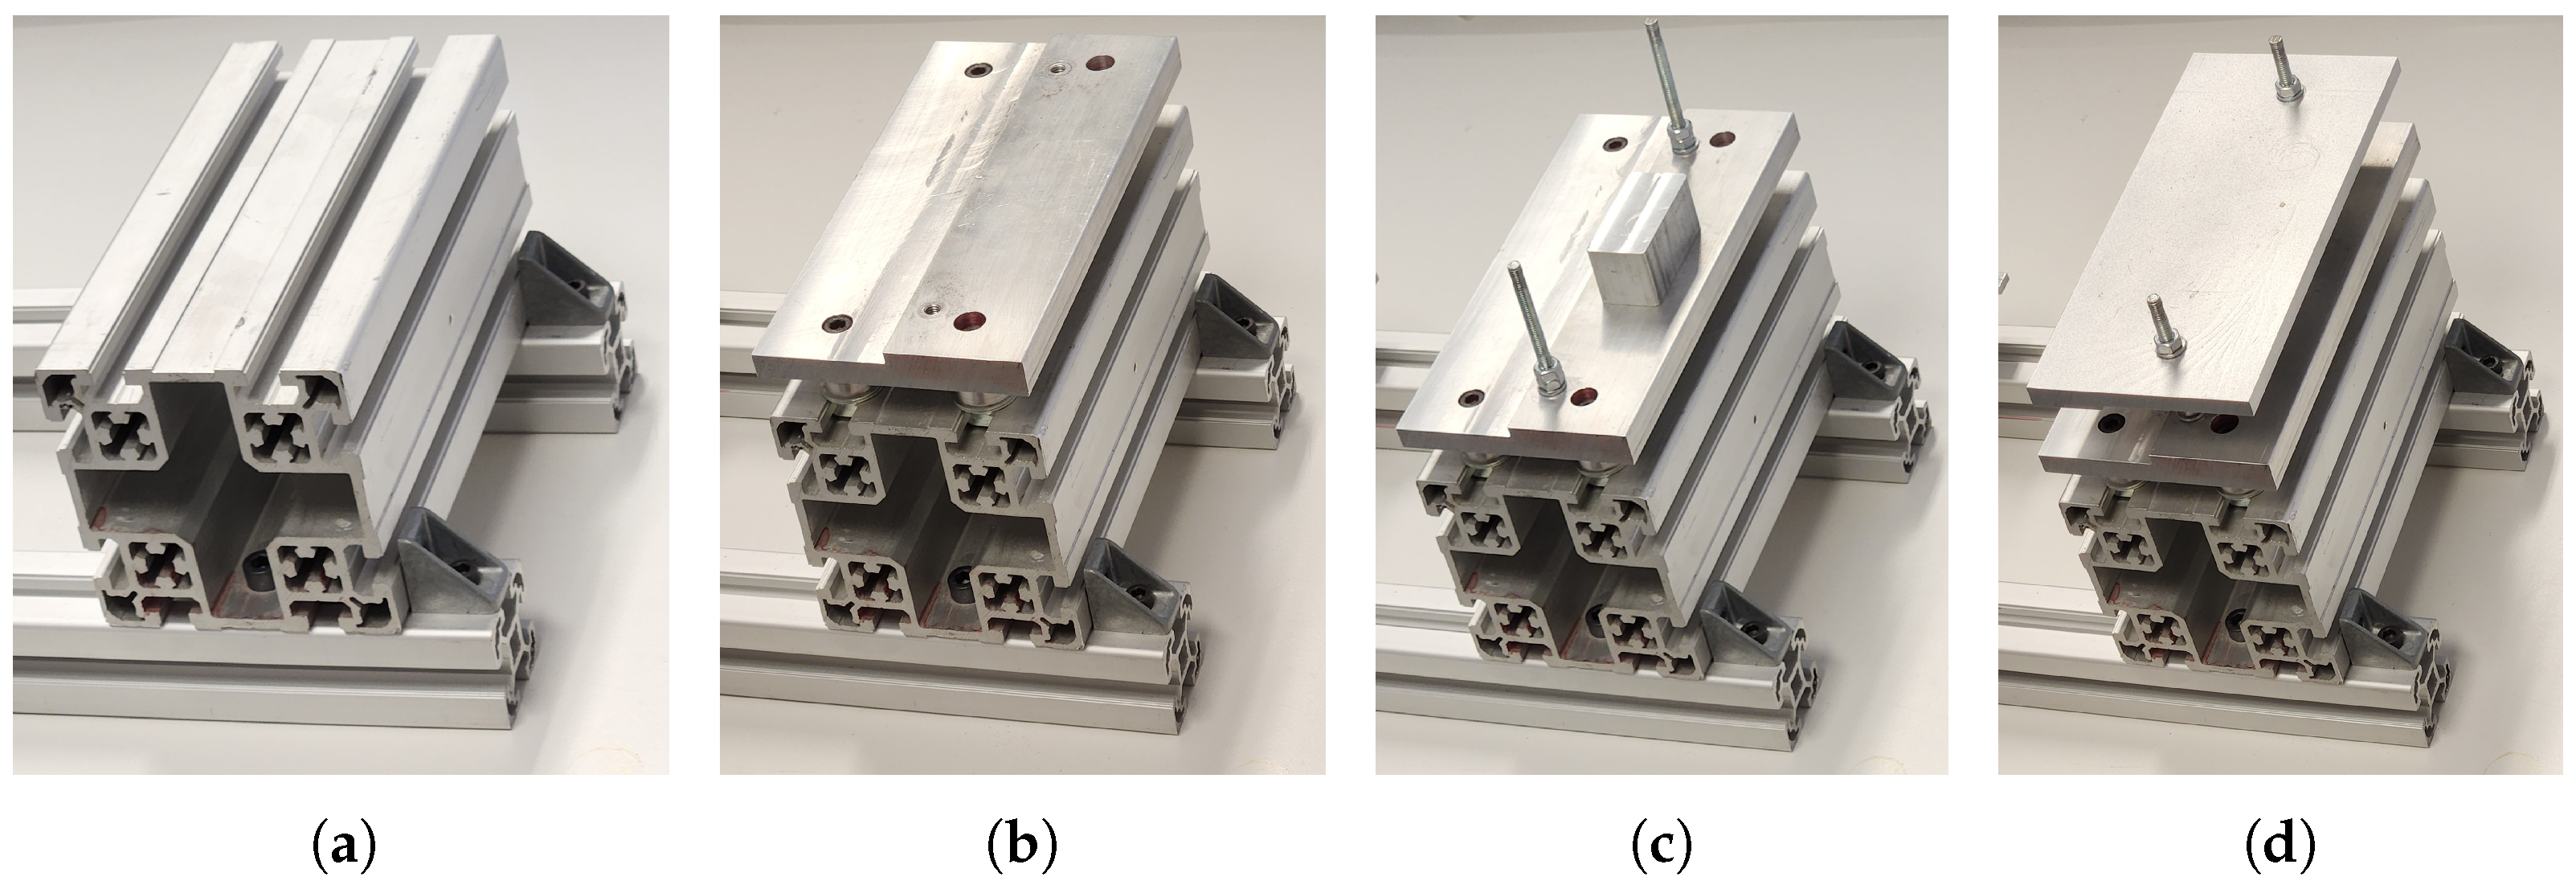
The Base plate of the sample clamp can now be mounted on the 100 × 100 extrusion. Pass M6x30 screws down through the holes in the base plate of the sample clamp, and each through approximately eight M8 washers, then into M6 T-nuts in the extrusion channels. The exact number of washers can be adjusted to obtain the right vertical alignment between the sample clamp and the screwdriver shaft. The base should look like Figure 8b. Thread the M6 rod into the threaded holes on the sample clamp base plate, add M6 washers on top and then securely tighten a nut on top of each washer; add a second nut to lock the first in place as in Figure 8c. If there are issues with the rods loosening, consider adding a thread-locking glue. The top plate of the sample clamp can be slid over the rods and then a washer and nut can be added; these are tightened when needed to secure samples. The finally assembly should look like Figure 8d.
Add the pulley wheel and insert/tighten the M5x40 screw for the pulley to rotate on, as shown in Figure 9a. Add the pulley block to the back of the 100 × 100 extrusion (opposite from the screwdriver side) as shown in Figure 9b, and align it so the pulley is centered in front of the previously drilled hole for the pulley wire. To add the pulley weight when needed, thread the wire through the wire-holding block and tie it repeatedly around a nut like in Figure 10a, so it cannot pull back through. Then, thread the wire through the holes in the 100 × 100 extrusion towards the pulley; this may be difficult, consider using a stiff wire with a hook to pull the wire through. Lastly, thread the wire through the drilled bolt for the counterweight, like in Figure 10b, and fold it back around the threads and screw the nut into the counterweight to secure this end of the wire, like in Figure 10c.
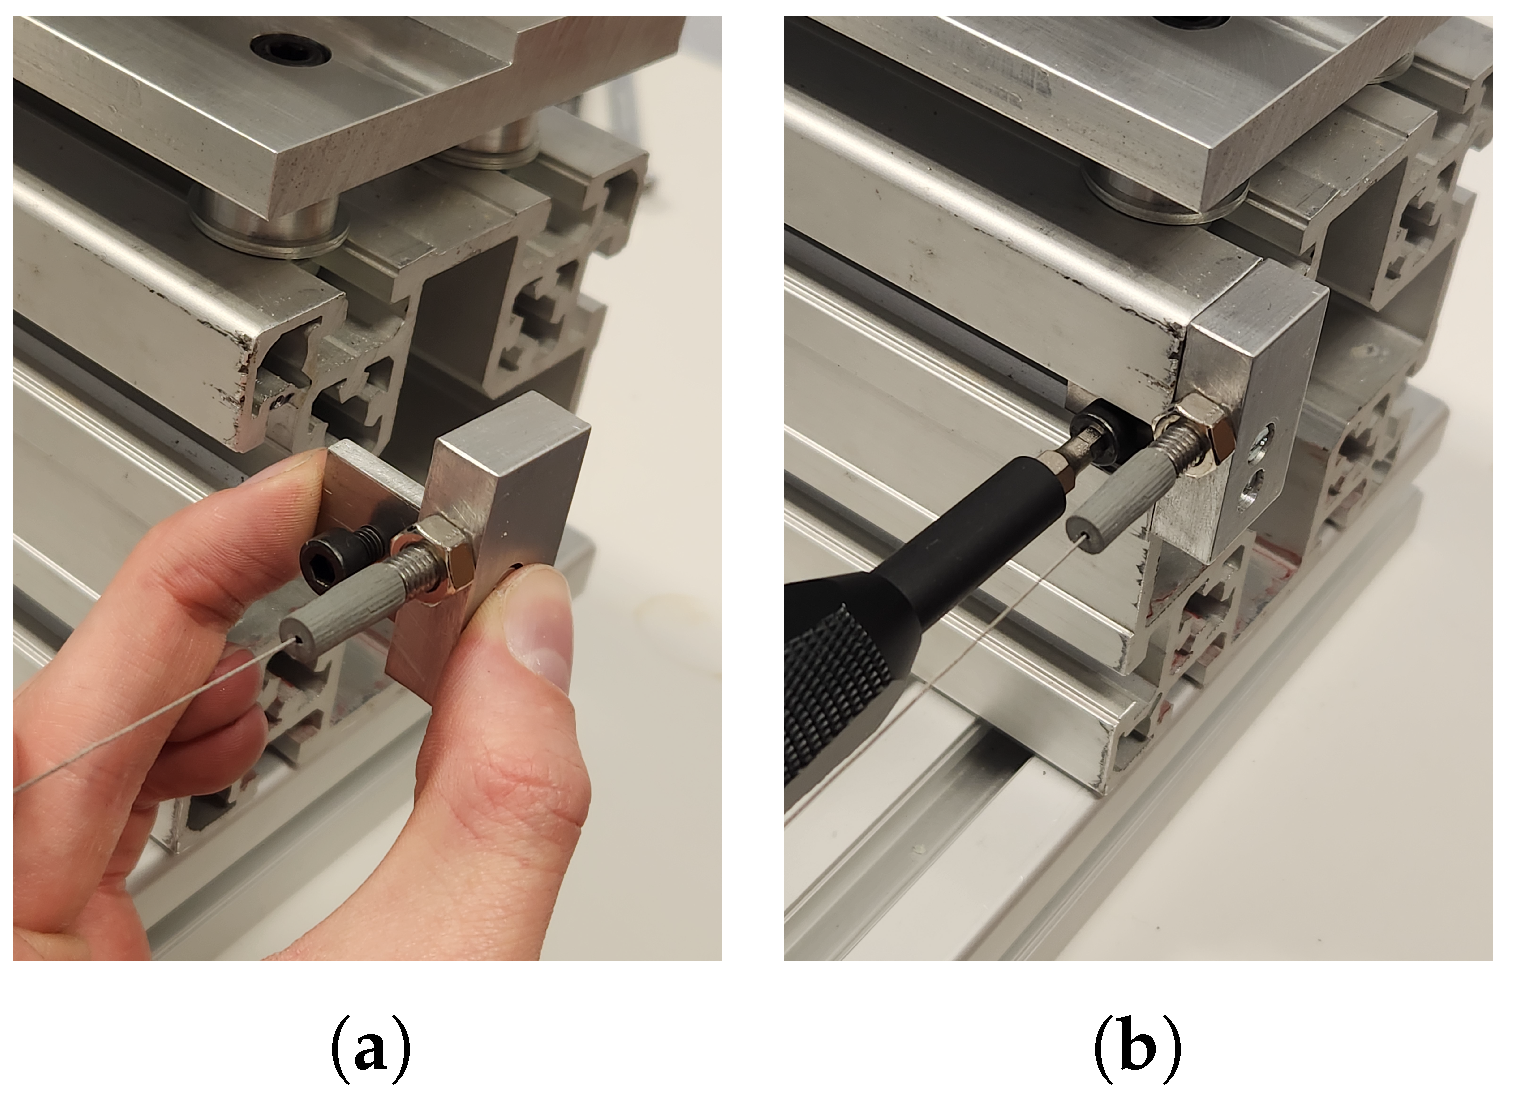
Add the draw-wire attachment point to the side of the 100 × 100 extrusion. The larger block is screwed into the smaller block with two M3x10 screws, then screw in the draw-wire cable, giving the assembly shown in Figure 11a. Note, that we want to avoid unwinding the draw wire encoder twisted steel cable, so screw the block onto the cable instead of vice-versa. Then, this is slid into the channel and a M5x10 Screw is used to secure it in the channel as shown in Figure 11b. Tighten the locking nut on the encoder wire against the block.

3.3. Controller

Again, note that this design contains an AC-DC power supply with 220 V/110 V input. These electrical voltages are hazardous and usage may be subject to safety regulations. The controller box should always be unplugged before the case is opened.
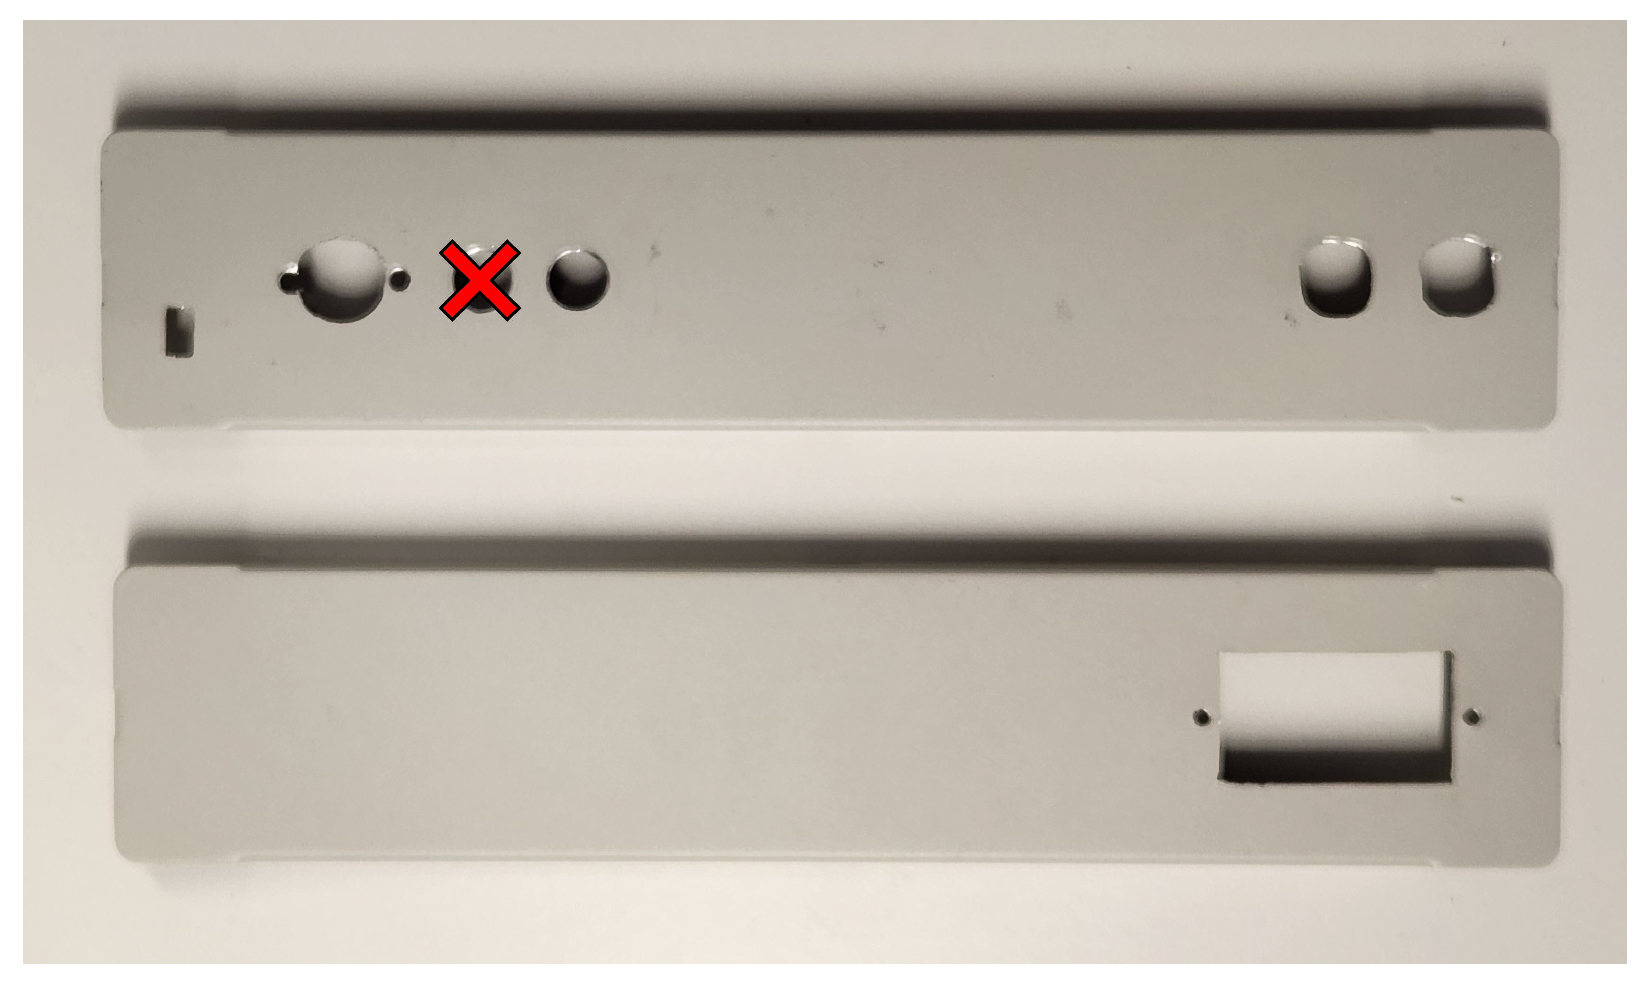
Disassemble the case into the different parts. The front and rear of the case should be prepared with cut-outs as shown in Figure 12 as per the connector data sheets.
Carefully solder jumper wires to the front panel connectors as shown in Figure 13a,b, using tape as necessary to cover adjacent wires to prevent shorts. In the photos cellophane tape is used for visibility, however, electrical tape is recommended for its adhesion and durability properties. Pass the wires carefully through the cut holes and screw the connectors into place. Also, pass the motor cables through the grommets as in Figure 13c.
Terminate the power wires with ferrules on one end and spade connectors on the other end (insulated spades for the live and neutral connections); attach the wires to the power connector and fit the fuse and fuse holder as in Figure 14a, screw the power connector into the case and wire it into the PSU as in Figure 14b.
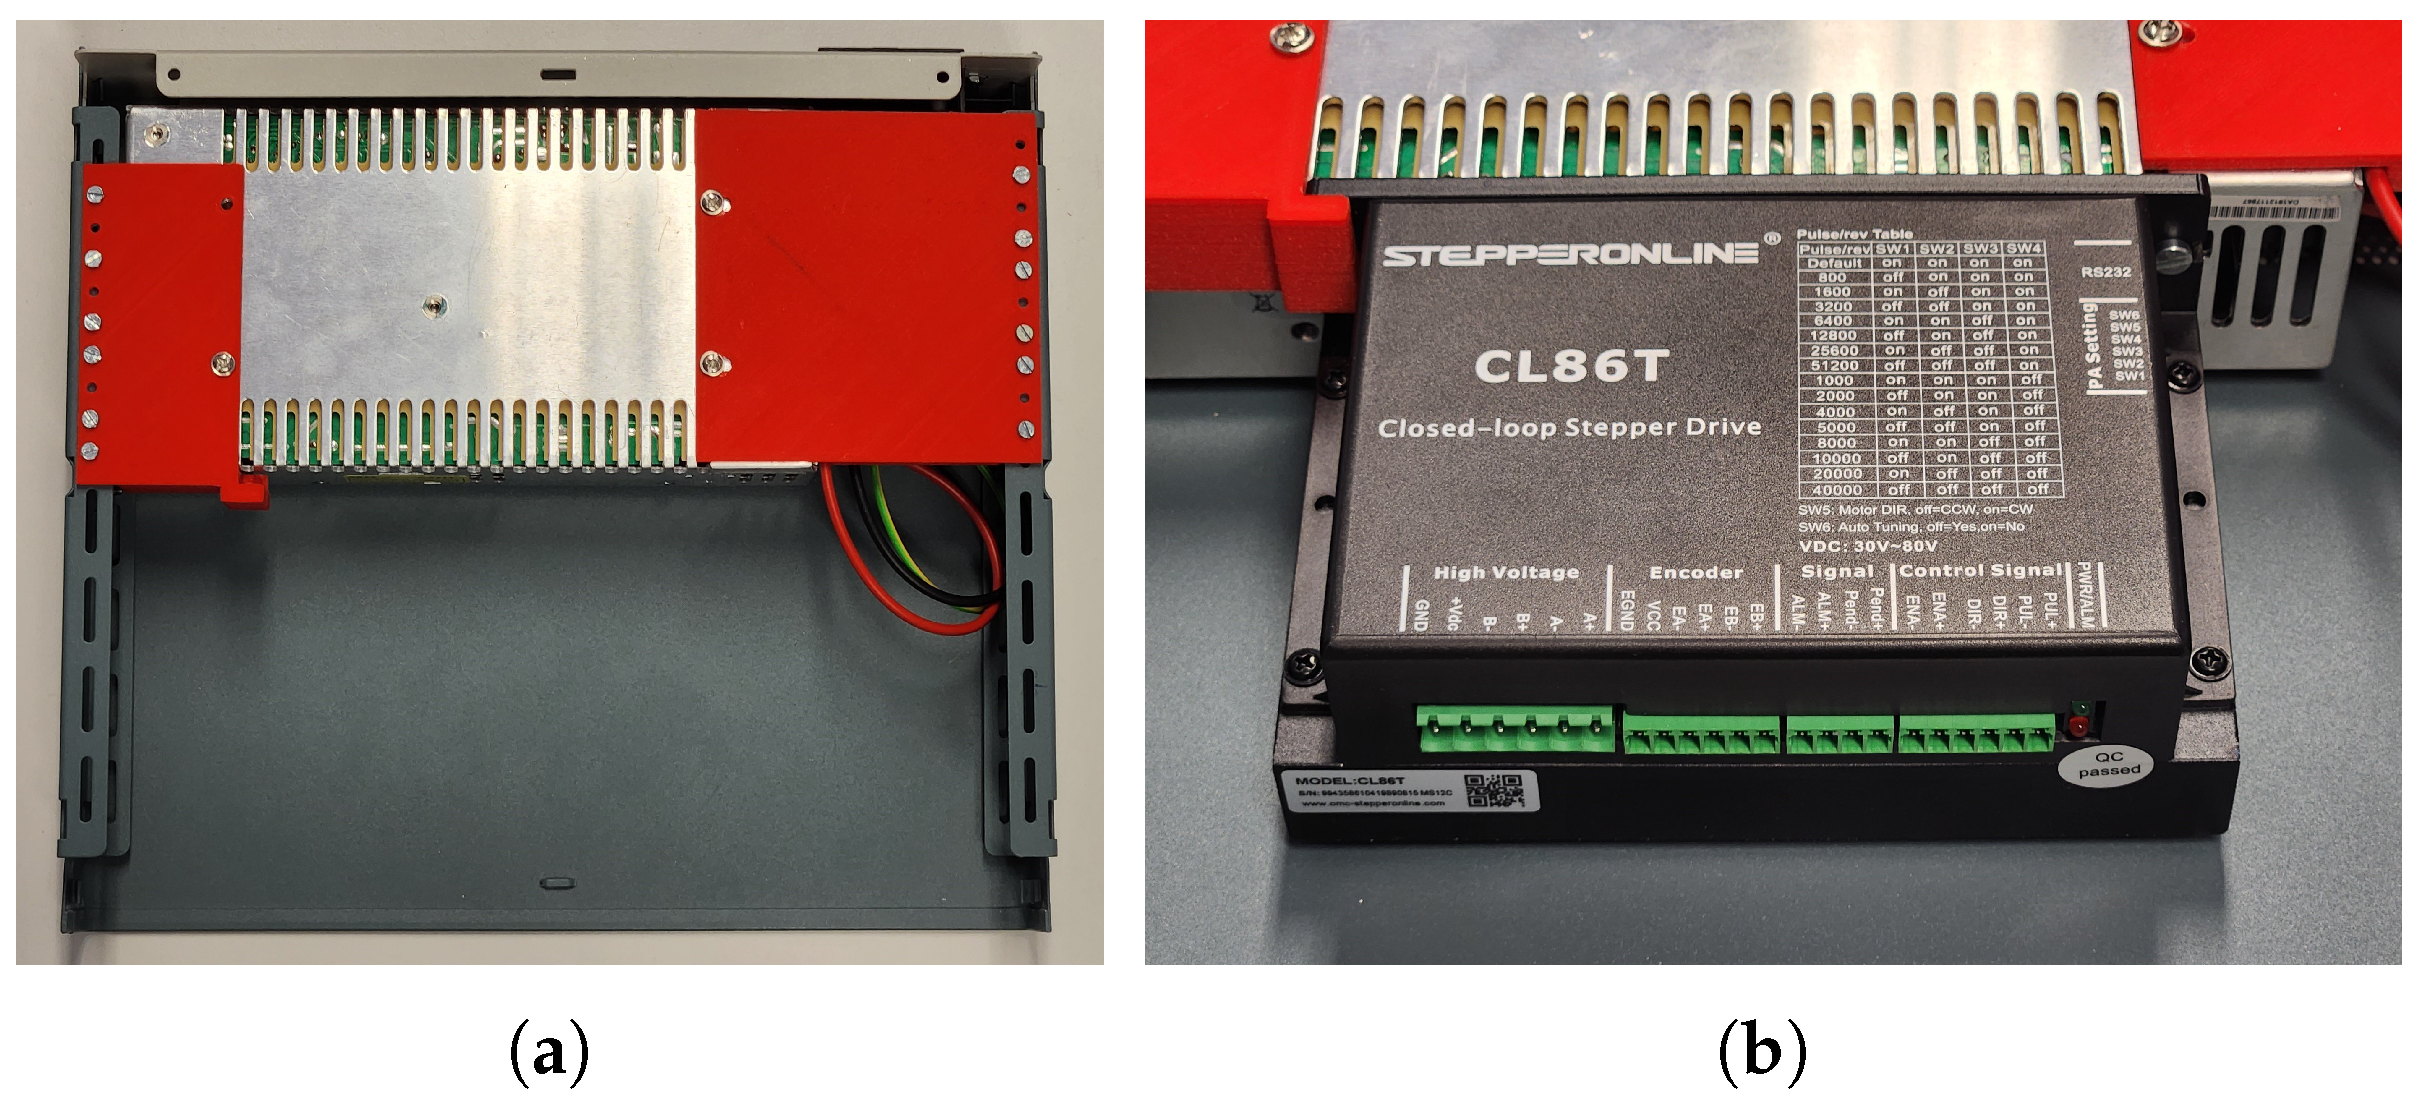
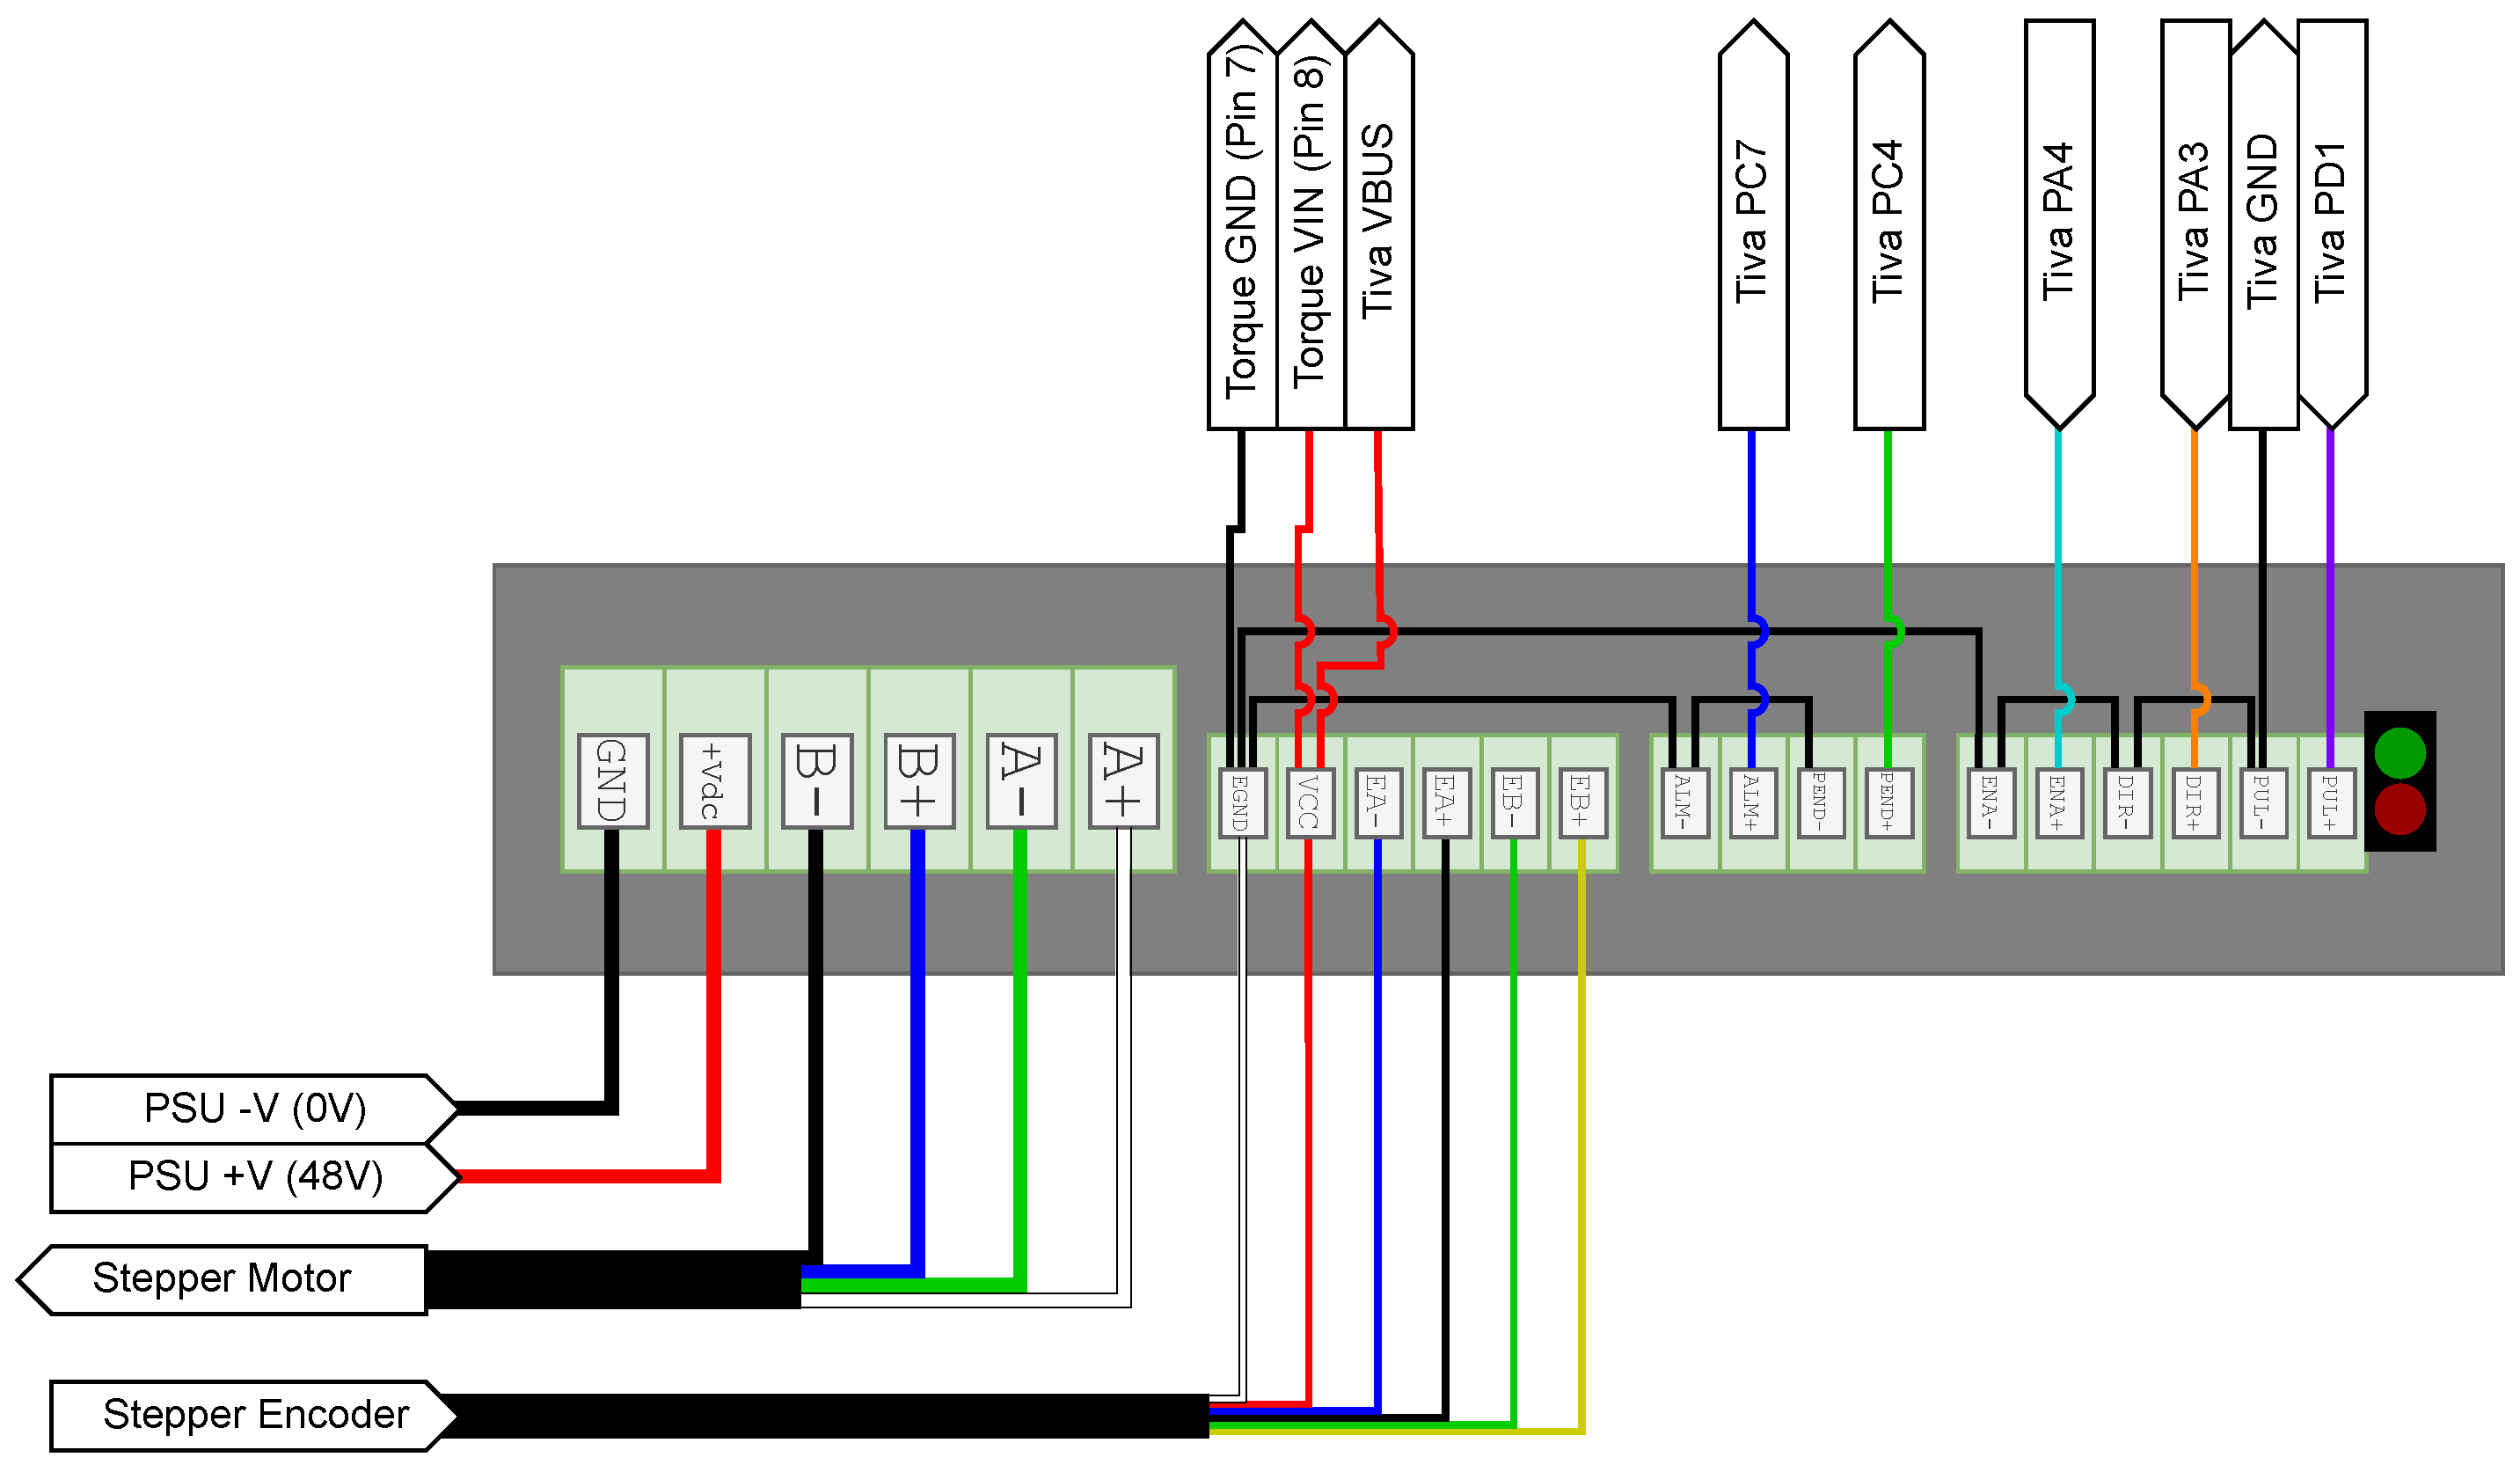
Screw the 3D printed PSU mounts to the power supply and sides of the case as shown in Figure 15a. Mount the motor driver as shown in Figure 15b to the side of the PSU. Mount the sides to the bottom of the case as shown in Figure 15a. Attach the 48 V power cables between the PSU and motor driver. Take care to make the correct connections. Connect the motor power and encoder wires to the motor driver, taking care not to reverse the connections; as the wire colours may change depending on the motor/controller revision, reference the lower cables in Figure 16 for the connections to make to the motor driver. Also, check the DIP-switch settings on the motor to ensure the pulses per revolution are 4000.
Before mounting the Tiva, make sure the correct firmware is uploaded so it does not send nonsensical/undefined outputs to the test rig. You may compile from the source. In that case, see the online documentation for installing Code Composer Studio and Tivaware. Then, open the project in the Supplementary Files, compile and flash the firmware to the Tiva, and verify it is sending the correct serial output at 2,000,000 baud. Alternatively, a compiled .bin file is provided which can be used with the Texas Instruments LM Flash Programmer Utility (https://www.ti.com/tool/LMFLASHPROGRAMMER, accessed on 27 August 2024), select “TM4C123G LaunchPad” on the Configuration tab, find the bin file on the Program tab, then press Program. Lastly, click Hardware Reset to boot the firmware. Use the USB connection on the end of the board, not the side, and ensure the power supply switch is set to use this port.
The Tiva board can be attached to the side of the case using the 3D printed mounts as shown in Figure 17.
Make the pin connections to the Tiva listed in Table 4 and Table 5, also referencing Figure 16, Figure 18 and Figure 19; also solder the inline resistor divider as shown in Figure 20, making substitutions if you have deemed it necessary. Ensure the USB port is accessible to be plugged into from the front panel; otherwise, the panel may need to be filed, or the mounting position of the PCB should be shifted forward/back.
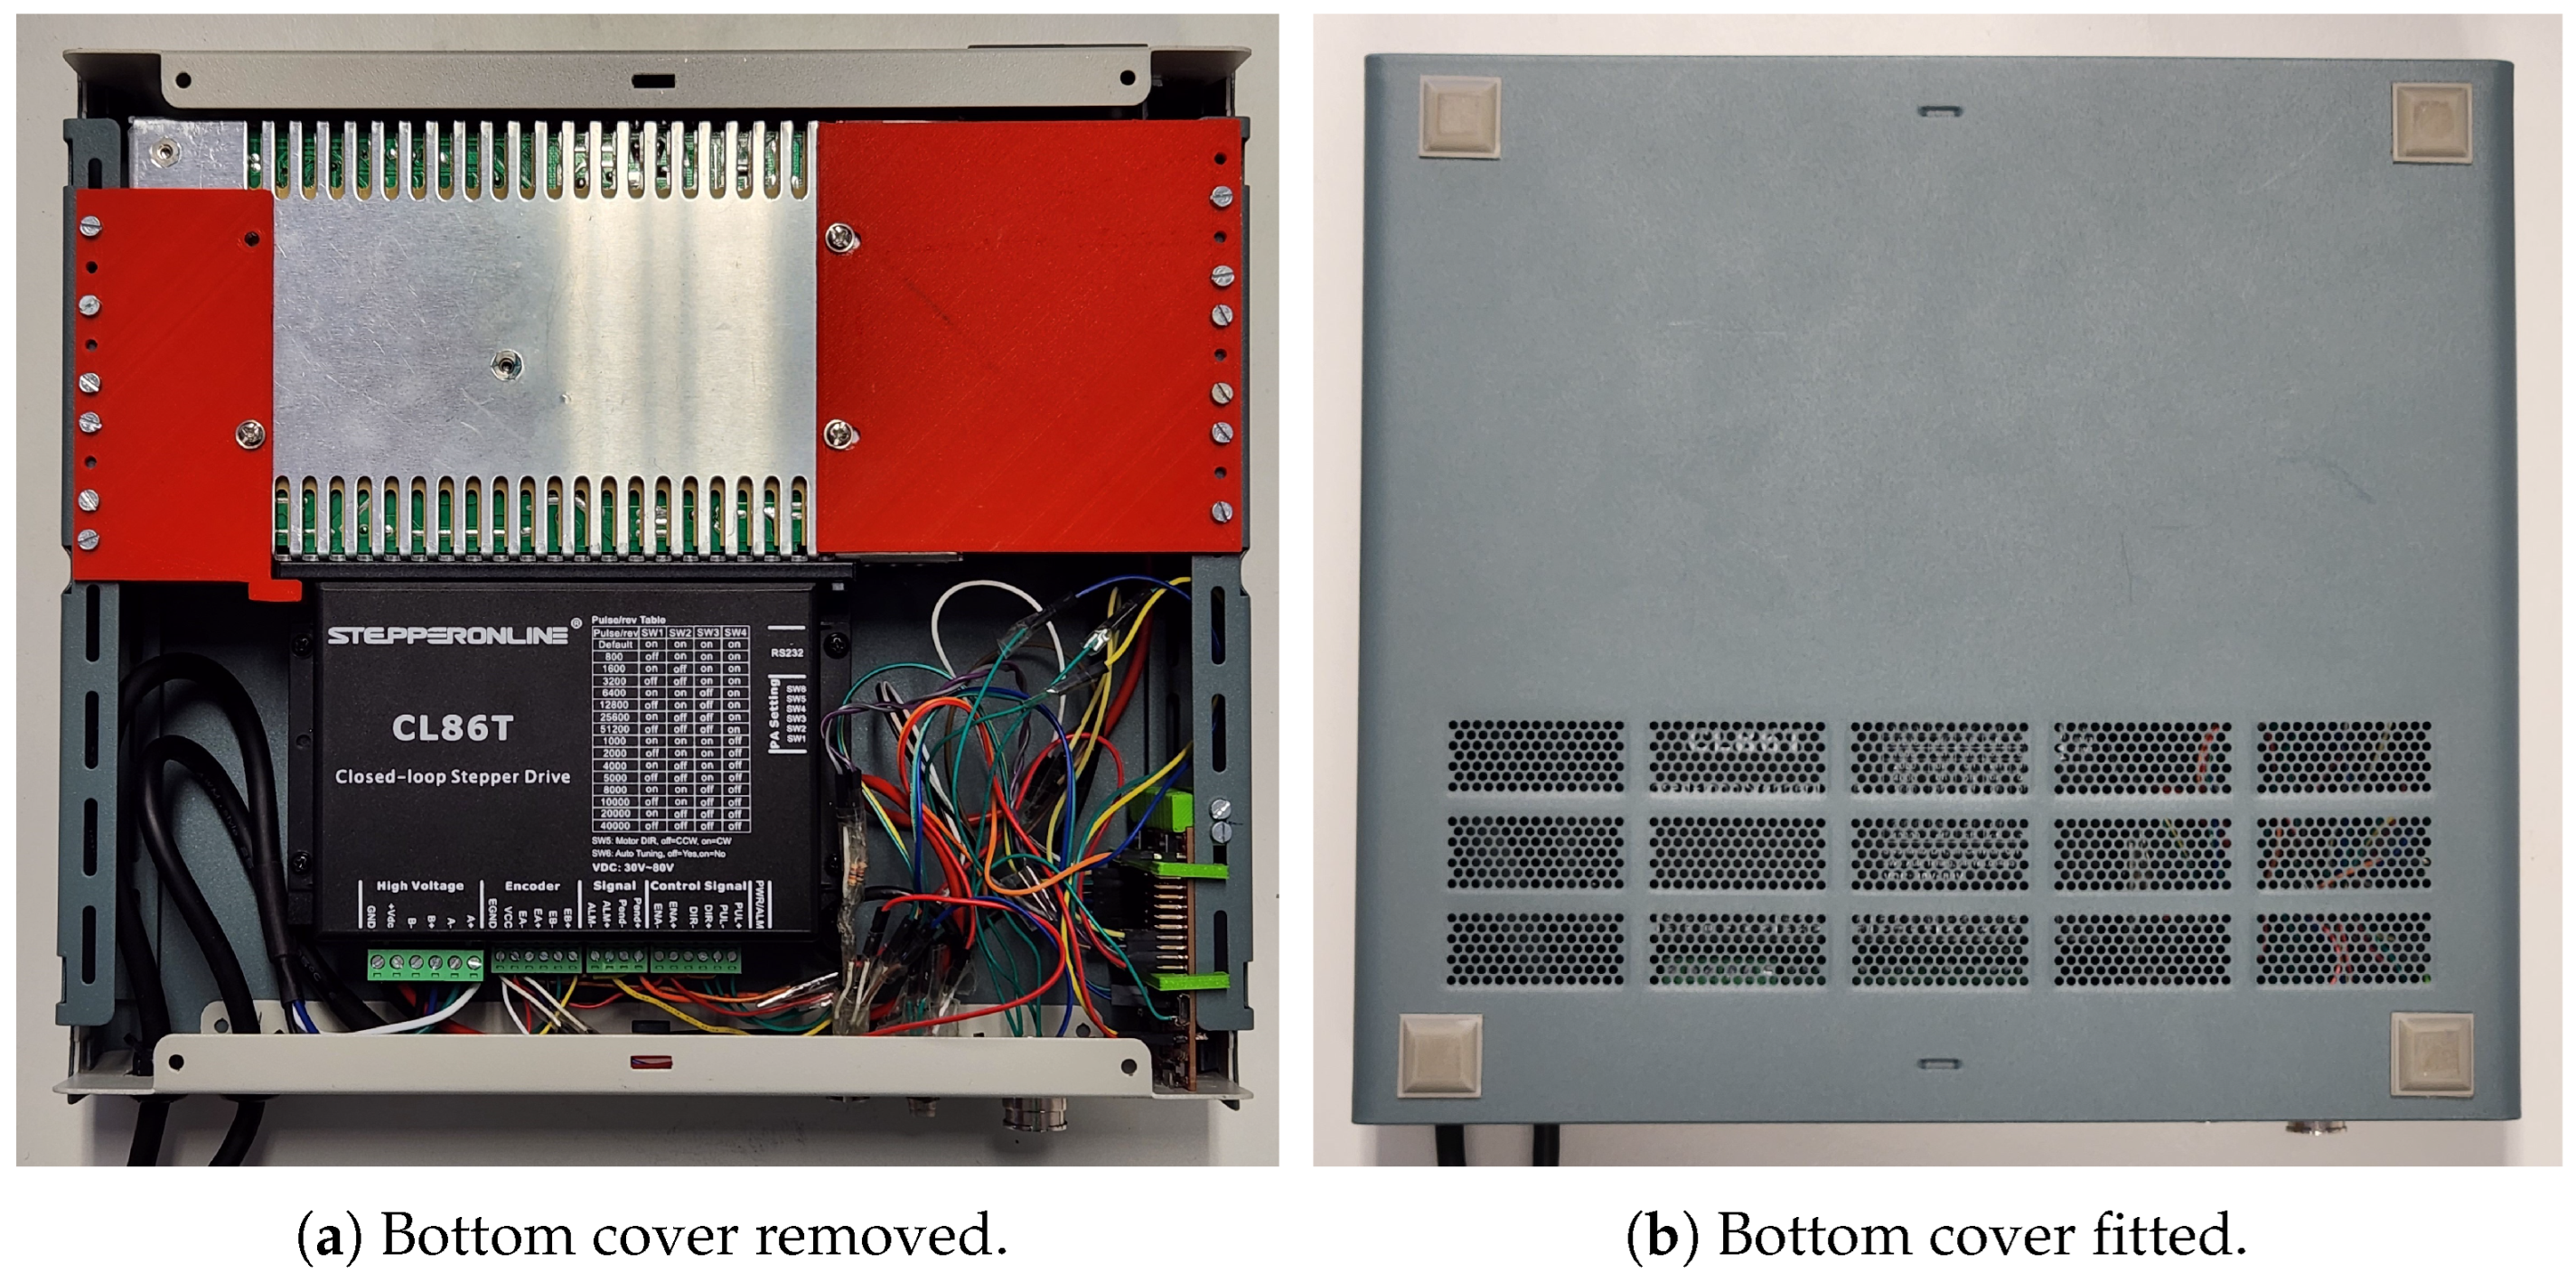
Attach the bottom of the case with the vent aligned over the motor driver as shown in Figure 21 so some airflow from the PSU pulls air over its heat-sink. If necessary for health and safety or regulatory reasons, ask a qualified person to electrically test the control box now; make any changes that they recommend for electrical safety.

3.4. Connection

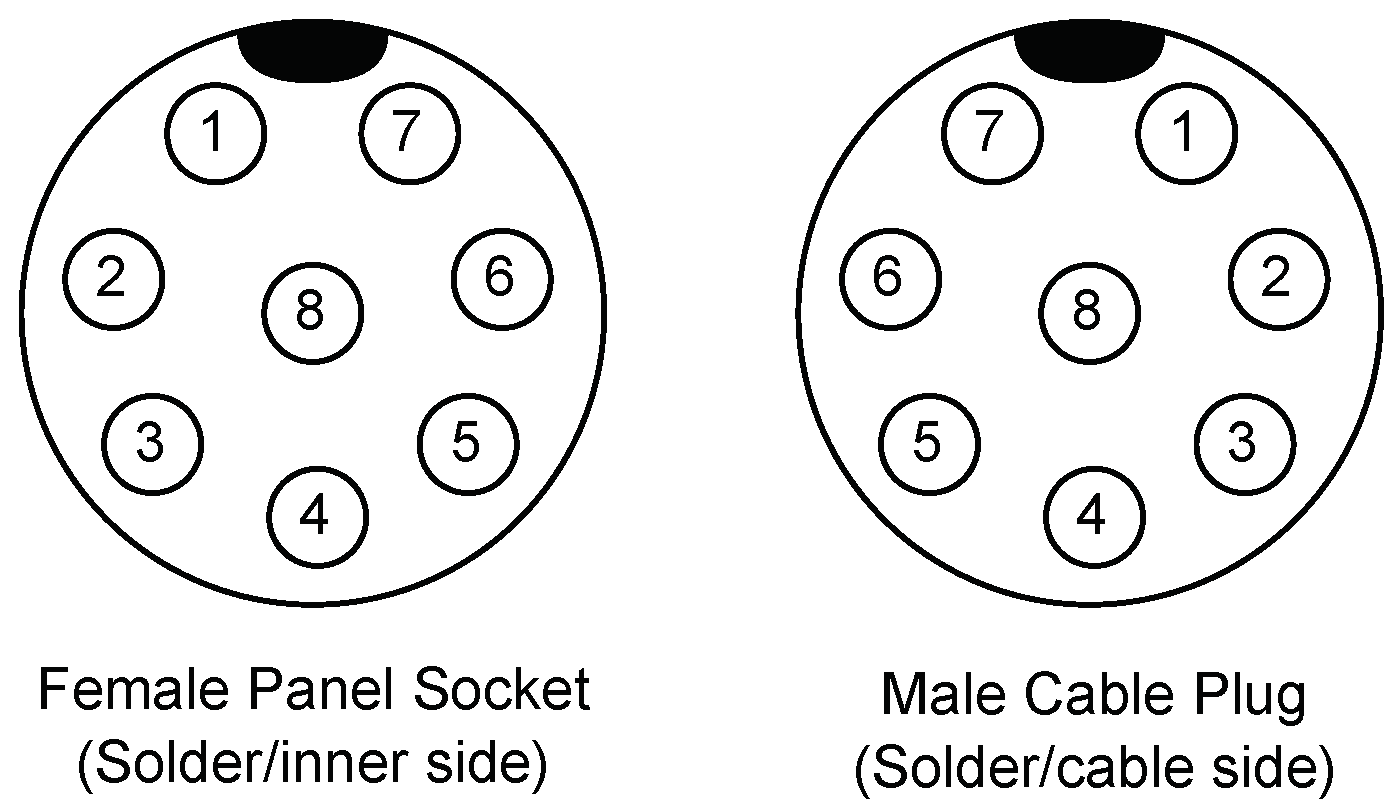
Terminate the cable from the draw-wire encoder with the plug matching the receptacle on the control box. Also, terminate the torque sensor cable with the appropriate plug. Make sure all necessary parts of the plug assemblies are placed on the cables before you begin soldering as they may be impossible to fit after; it may help to conduct a ’dry-run’ of the assembly process without soldering. Take care to use the stress relief features, and do not strip excessively long segments of insulation that may interfere with this. Take care the wire numbering matches that in the test rig enclosure. Keep in mind that the cable solder points are mirrored compared to the case-mount ones.
Once all cables are assembled and the controller box is tested and closed and the firmware is loaded, everything can be connected. At this stage the test stand needs four cables connected to the control box, which should be clearly different, so mate the matching cables. Then, the controller should be plugged into the power and switched on before the USB is connected. The serial output can again be verified at 2,000,000 baud.

4. Operating Instructions

4.1. Note on Power Sequencing

Every time the test rig is turned on, the power should be switched on before the USB cable is connected. When power-cycling, do not forget to remove the USB cable, and wait 5–10 s for the test stand to fully lose power before turning it back on.

4.2. Initial Setup/Testing

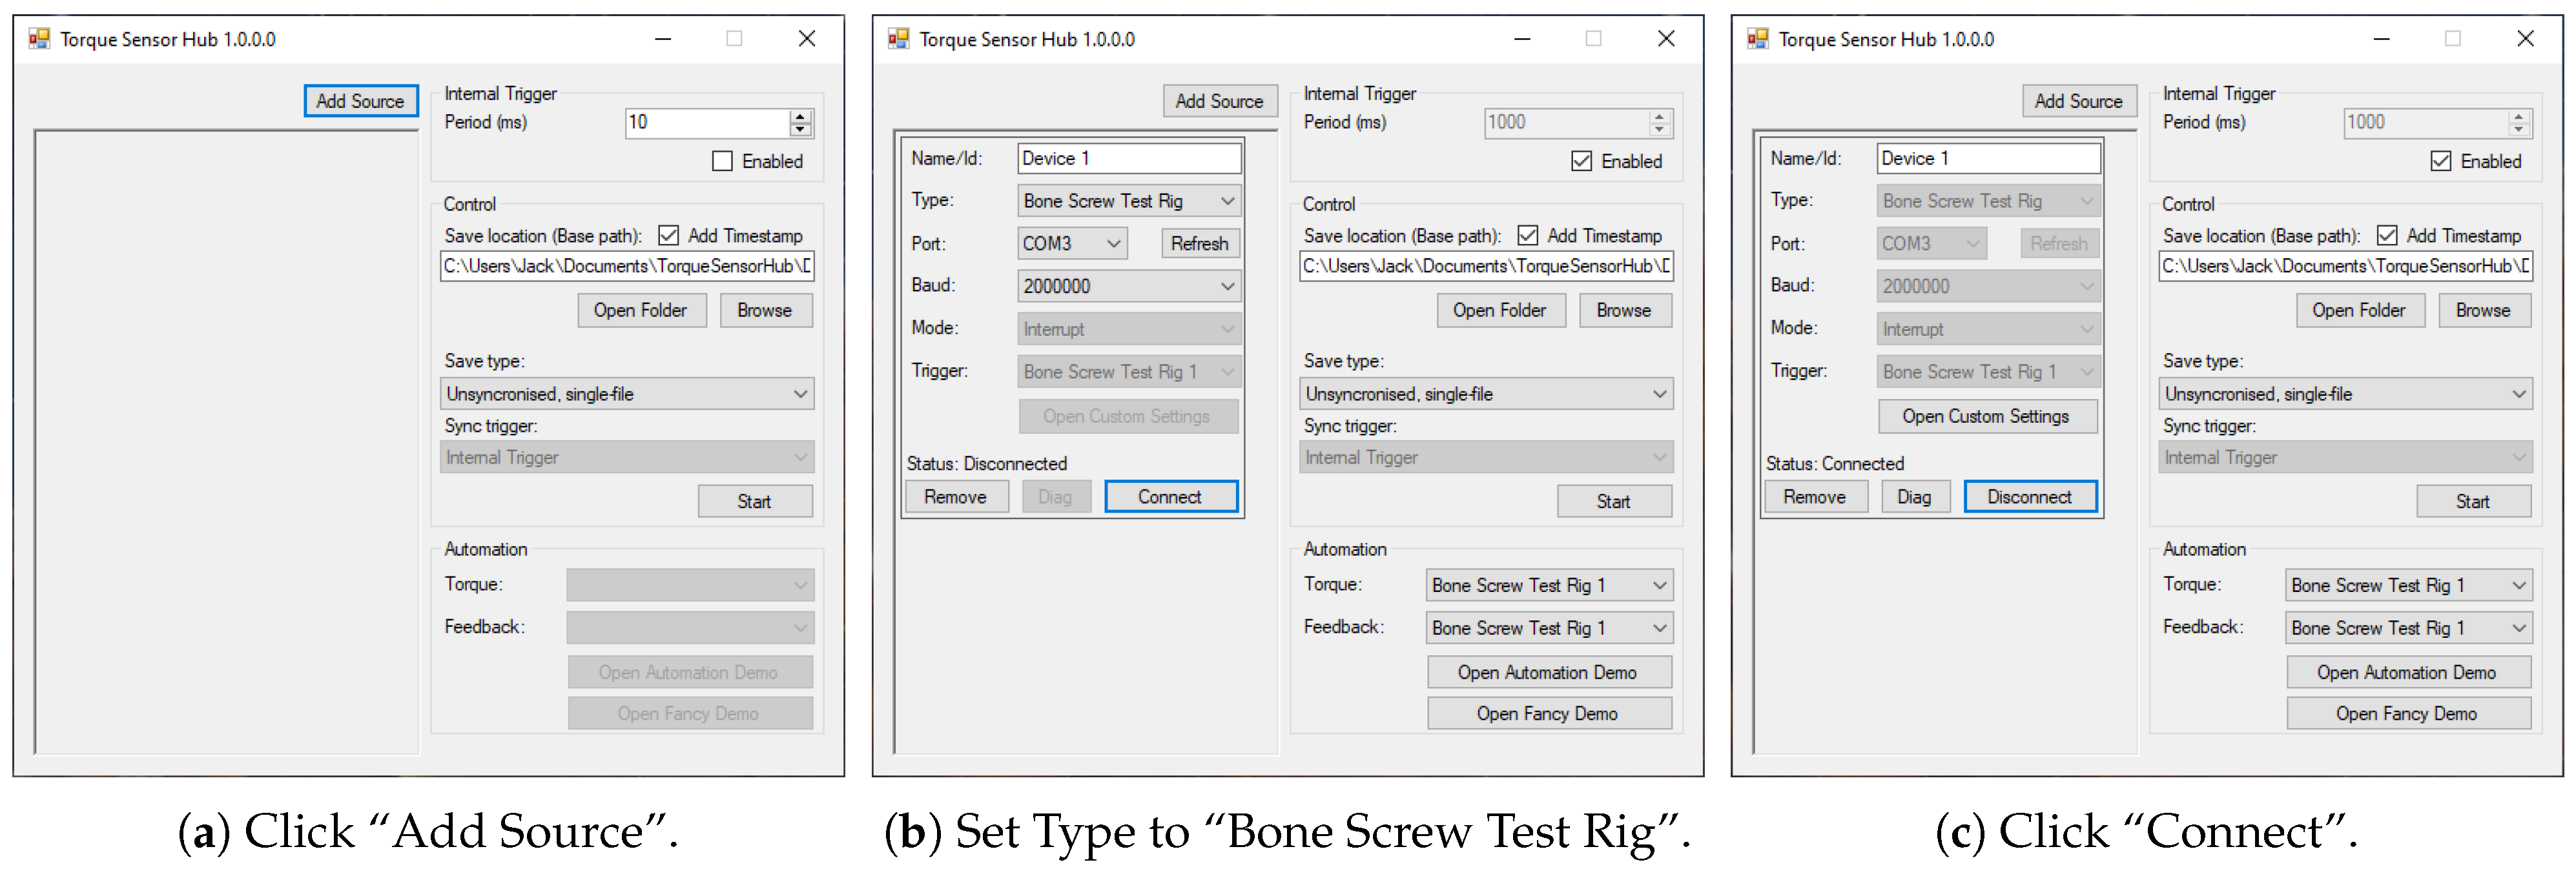
After the test rig is connected, it can be added to in the Torque Sensor Hub software v1.0.0.0 (Supplementary Files) as “Bone Screw Test Rig” as shown in Figure 22. Check the port is correct, and the default baud rate should be appropriate for the firmware as supplied.
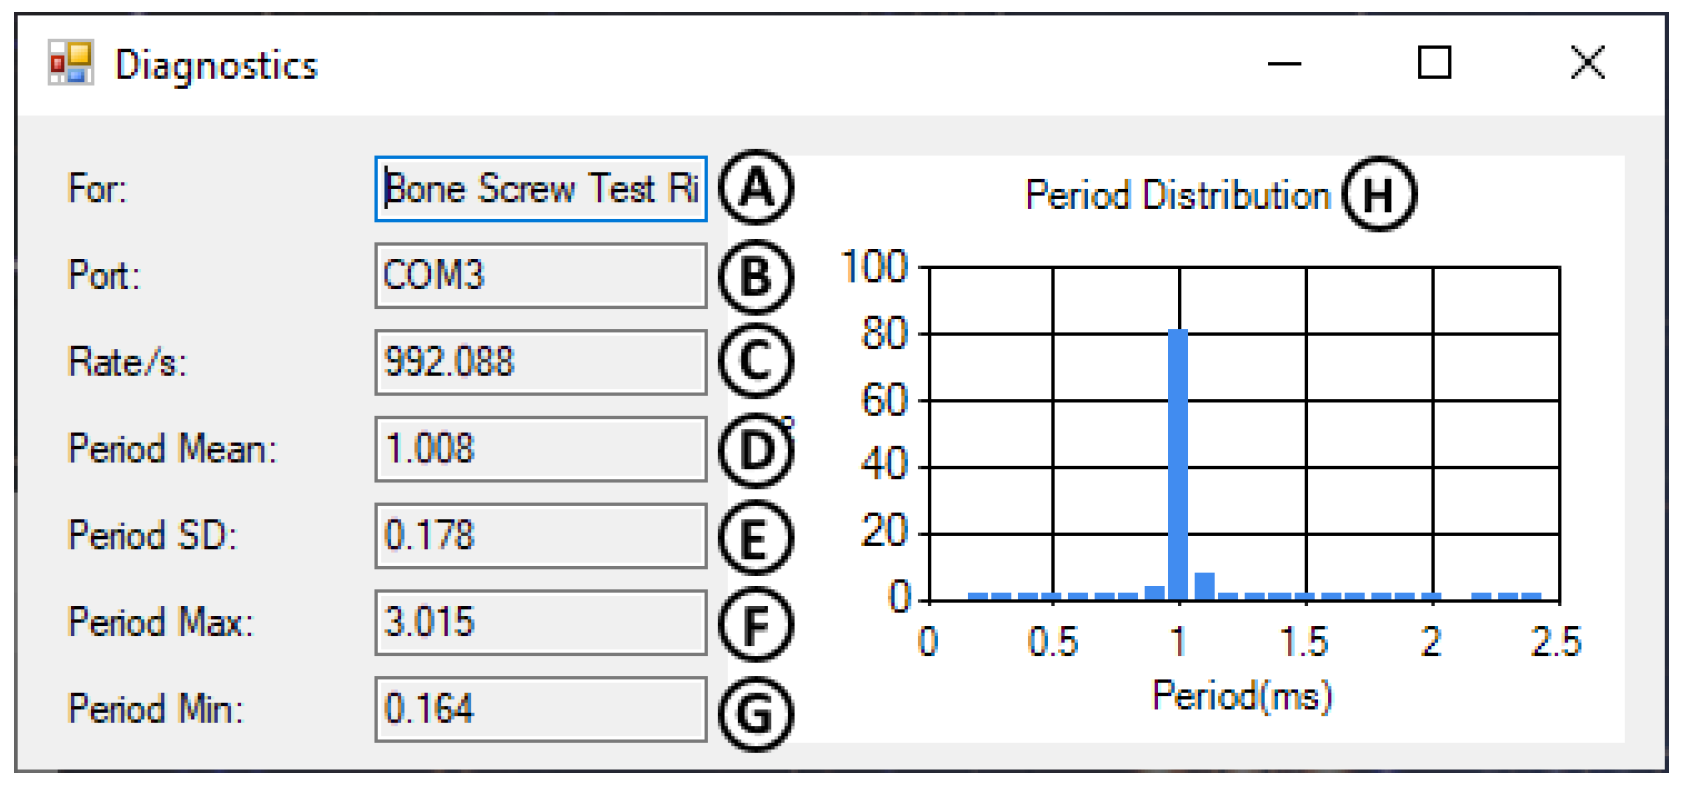
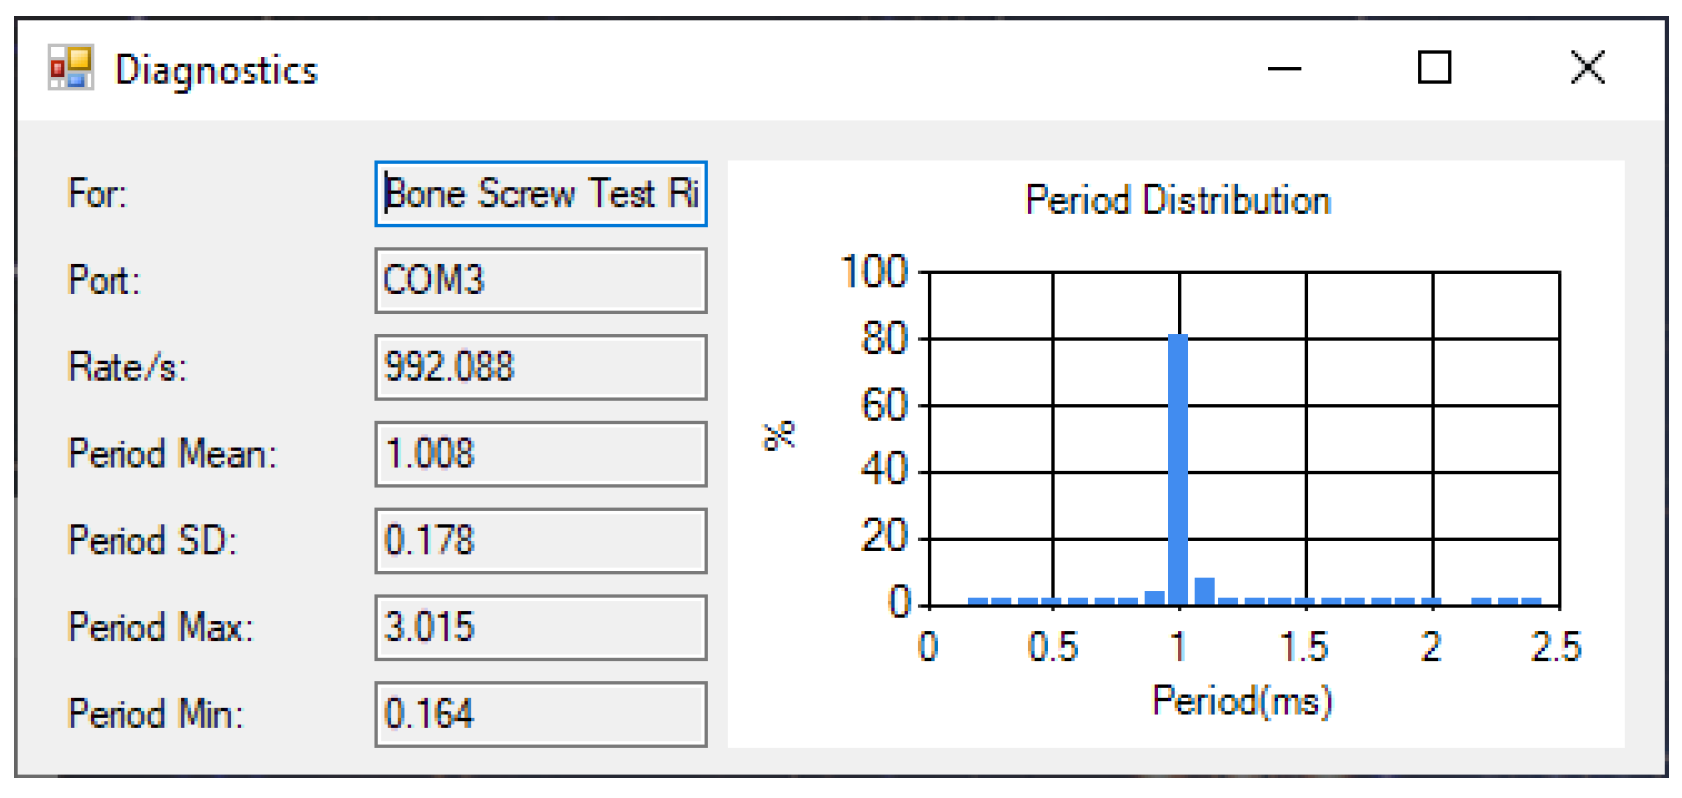
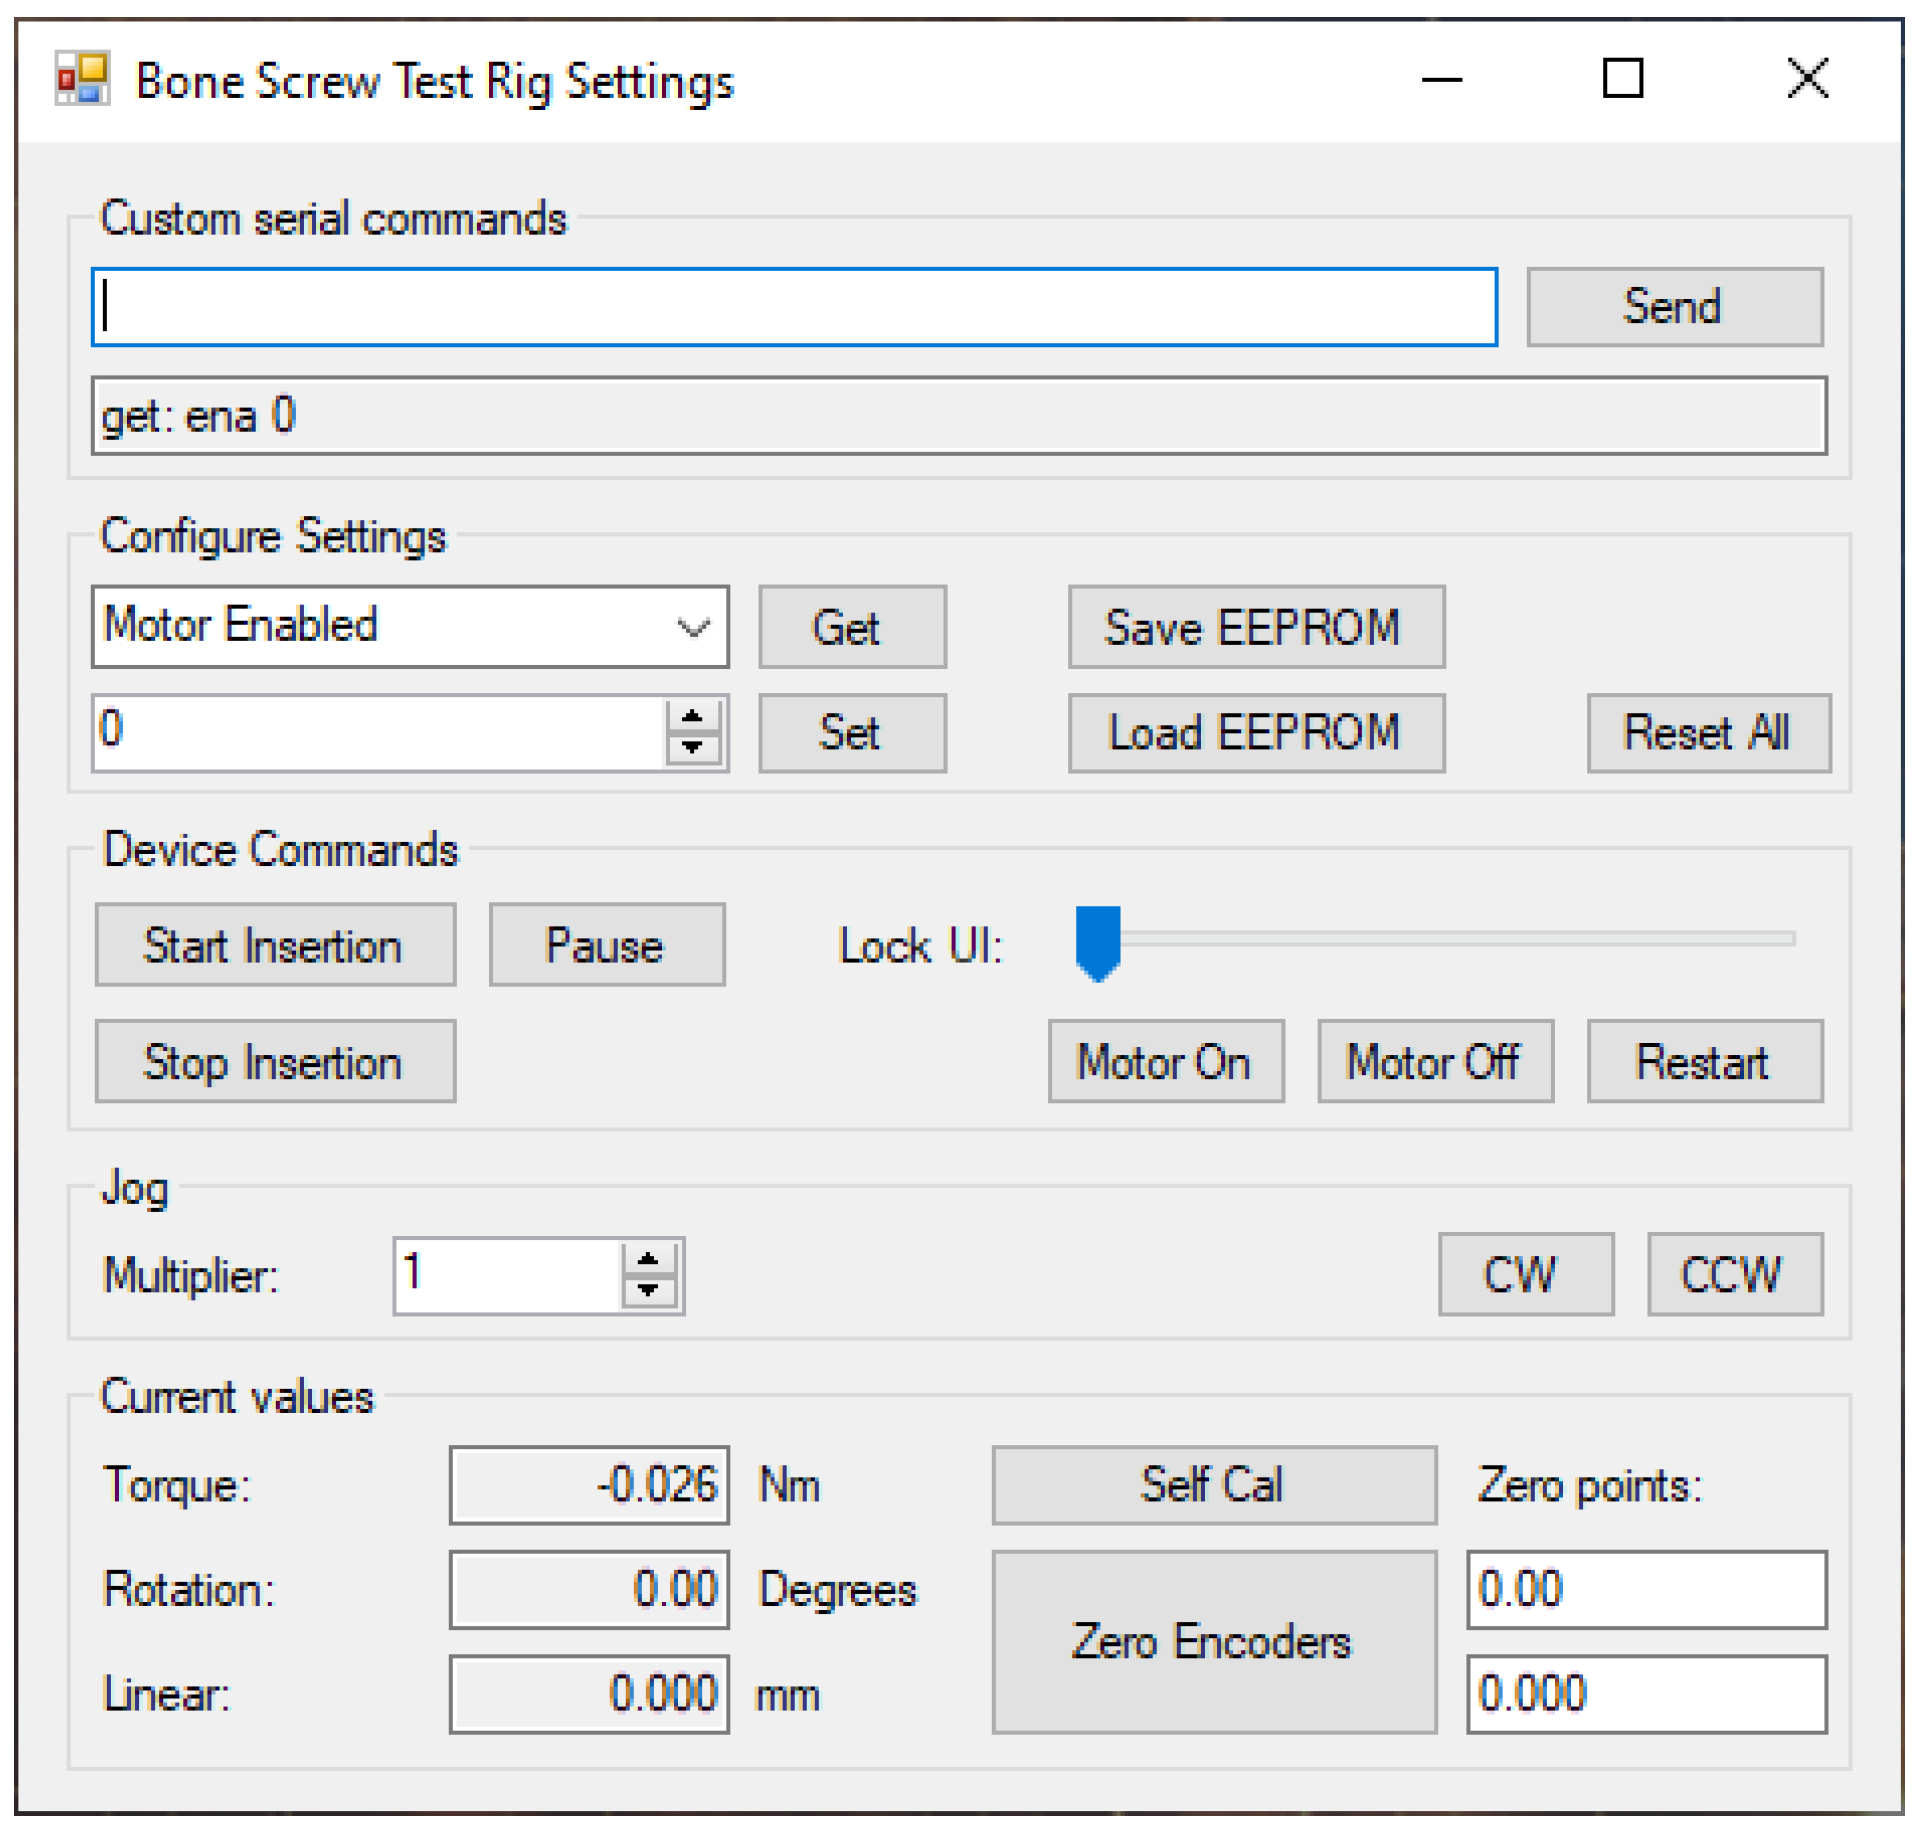
The test rig can be connected with the “Connect” button. Then, the diagnostic information should show it outputting data at approximately 1000 Hz (testing shows the timing is not perfectly accurate and gives 992 Hz), similar to Figure 23. The custom settings (Figure 24) can be opened to preview the sensor output; you can verify the encoders’ functionality by rotating the shaft and moving the carriage forward/back. The torque sensor will show some low amplitude noise, and if you try to physically twist the couplers on both sides of the sensor in opposite directions you should notice an increase in the torque magnitude displayed.
WARNING: Be careful when first turning on the motor in case the connections are incorrect, as it could make a sudden movement which may be powerful enough to launch objects or cause personal injury. Keep hands and clothing away from the rotating shaft as much as possible to avoid entanglement and injuries. Take care to choose safe values for the motor speeds as the direct drive stepper motor can move quickly with enough torque to cause serious injury.
The motor can be initially tested with some simple jog motions. Note, that, when the motor was off/stopped before a command, there is an additional approx. 2 s delay before it starts moving. The speed and size of the jogs can be adjusted in the settings drop-down by selecting the appropriate setting, entering the desired value, and clicking “set”. The distance is in motor pulses which corresponds to 4000 pulses per revolution. The default jog distance is 1, which is a fraction of a degree, but should produce an audible step. The speed is in pulses per second (4000 is 60 RPM), and the jog speed is controlled by the insertion speed, which is 2000 by default (30 RPM). You can zero the rotational encoder before jogging and verify that the rotation amount is as expected; if not the step settings on the motor driver might be misconfigured, check the DIP switches on the side and consult the printed table to set this to 4000 pulses per revolution.

Setup Summary

  • Power and connect the test rig.
  • Open the software and add a new device.
  • Set the “Bone Screw Test Rig” device type and check the port; Connect to the device.
  • Open the custom settings window and verify measurements are working.
  • Carefully test the motor with small jog commands. If the direction is incorrect or the motor spins violently, check the wiring of the motor and the configuration of the motor driver.

4.3. General Use

Before testing configure the test rig settings as needed for your purposes. Notably change the insertion distance depending on the number of thread turns on your screw, and either add four to eight turns if you want to test thread stripping, or subtract a few when you want to avoid it; the insertion distance should be 4000 × No. of turns. Set the Reverse distance to the same or more than the insertion distance unless you wish to leave the screw in, in which case set it to zero. Set the insertion speed in pulses per second with 4000 PPS = 60 RPM (4000 pulses per revolution). If the reversal is not important for the testing, you may want to set a faster reverse speed to reduce test time; setting it to −1 (default) will make it equal to the insertion speed. By default there is a 1 s pause between insertion/reversal, you may want to adjust this setting (in milliseconds). If you wish the insertion to follow a trapezoidal velocity profile, set enable trapezoidal to 1 (true) instead of 0 (false, default); then you can configure ramp time, high dwell time, and low dwell time which change the times for the velocity ramp up/down, full-speed, and stopped segments of the trapezoidal velocity profile (in milliseconds), and distance per trapezoid will control how much rotation to conduct in total during these times, and therefore, controls the speed. In the event of swapped wiring phases or left-handed threads, the invert rotation option can be set to 1 to invert all motor rotation and torque/rotational displacement values; avoid using negative velocity settings as they are not supported.
You may wish to conduct a “dry-run” of the insertion without any screws or sample to verify that it behaves as expected.
Once the test rig settings are configured, you may wish to save them to EEPROM (internal memory on the Tiva) so that they are automatically loaded on start-up. The hard-coded defaults can also be restored to the EEPROM with the reset all button; however, this will not update the current settings until a load or restart.
The data saving is controlled on the main window of the software. When using just the test rig, the simplest setting of “Unsynchronised, single-file” can be used; it is recommended to be consistent as different saving options may change column names in the saved data. Set the save directory and filename to something meaningful. The “Add Timestamp” option will insert the current date and time after the filename and before the extension in the format “_yyyy-MM-ddTHH-mm-ss”.
Before running a test you can verify the data are recording by clicking “Start” in the main window and then “Stop” shortly after. This should create a file in the intended directory (open directly by clicking “Open Folder”) with the current time; if you open this in a text editor you should see some sensor values logged.
The general procedure for a test is to set up everything in the test rig, with the sample securely clamped and aligned with a screw positioned in the appropriate place (e.g., resting in the pre-drilled hole with some pre-load force from the counterweight). Horizontal alignment can be achieved by sliding the sample, while vertical alignment can be adjusted less easily by changing the number of washers under the sample clamp. Once everything is physically ready, check that the sensor values in the test rig settings are still updating, then click “Start” in the main window of the software to start recording data, and then click “Start Insertion” in the test rig settings to trigger the insertion. Once the insertion (and reversal if necessary) finishes, click “Stop” in the main window to stop recording and close the file.

General Use Summary

  • Power test rig, add the device in software and connect.
  • Open custom settings and configure experimental parameters as necessary. A test run is advised before using a specimen. See above or Appendix B for descriptions of settings.
  • Set data saving settings (notable folder/filename) in the main window.
  • For each experiment:
    (a)
    Set up the sample in the clamp, and place the screw in position.
    (b)
    Zero positions as desired.
    (c)
    Click “Start” in the main window to begin recording.
    (d)
    Click “Start Insertion” in test rig settings to begin insertion.
    (e)
    Wait for the experiment to finish.
    (f)
    Click “Stop” in the main window to finish recording.

4.4. Software Use Reference

See Appendix B for reference for all UI elements in the software and Appendix C for common troubleshooting steps.

4.5. New Device Classes

See Appendix D for more information on implementing new device types in the software.

5. Validation

Prior works have clearly demonstrated that the test rig functions and is useful for collecting scientific data [16,17,20]. However, a few tests focusing specifically on selected functionality points of the test rig are presented below.

5.1. Torque Comparison

As the torque sensor in the test rig uses a magnetostrictive measurement technology, external magnetic fields (such as in the screw bit holder) were noted to offset the torque readings. Tests were performed to ensure this was only an offset and did not affect sensor linearity, and hence prove that simply zeroing the offset is sufficient compensation for this effect.
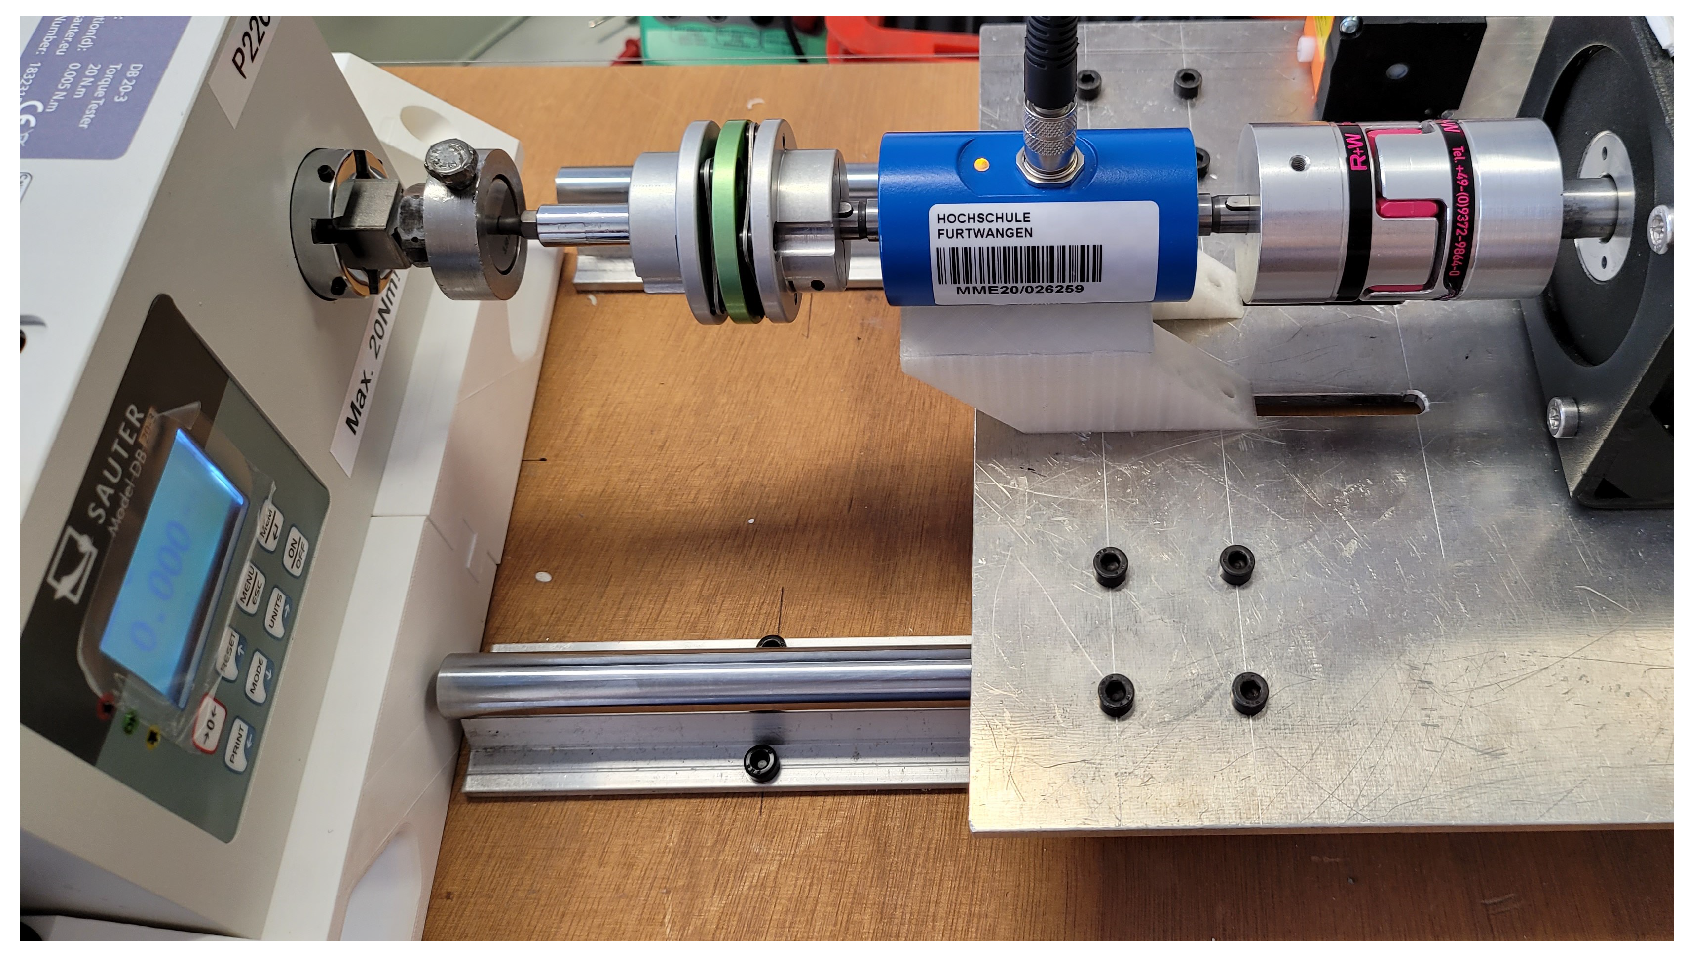
An off-the-shelf stationary (non-rotating) torque sensor (Sauter DB 20-3, KERN & SOHN GmbH) based on strain gauges (not affected by static magnetic fields) was mounted to the sample clamp, and the driven shaft was adapted to fit it as shown in Figure 25. The motor was turned on and minimum steps (1/4000 rotation) were conducted at a rate of approx 1 per second. Due to the elasticity in the load chain, this resulted in the torque slowly ramping up. A 20 Nm range torque sensor was used in the test rig for this experiment.
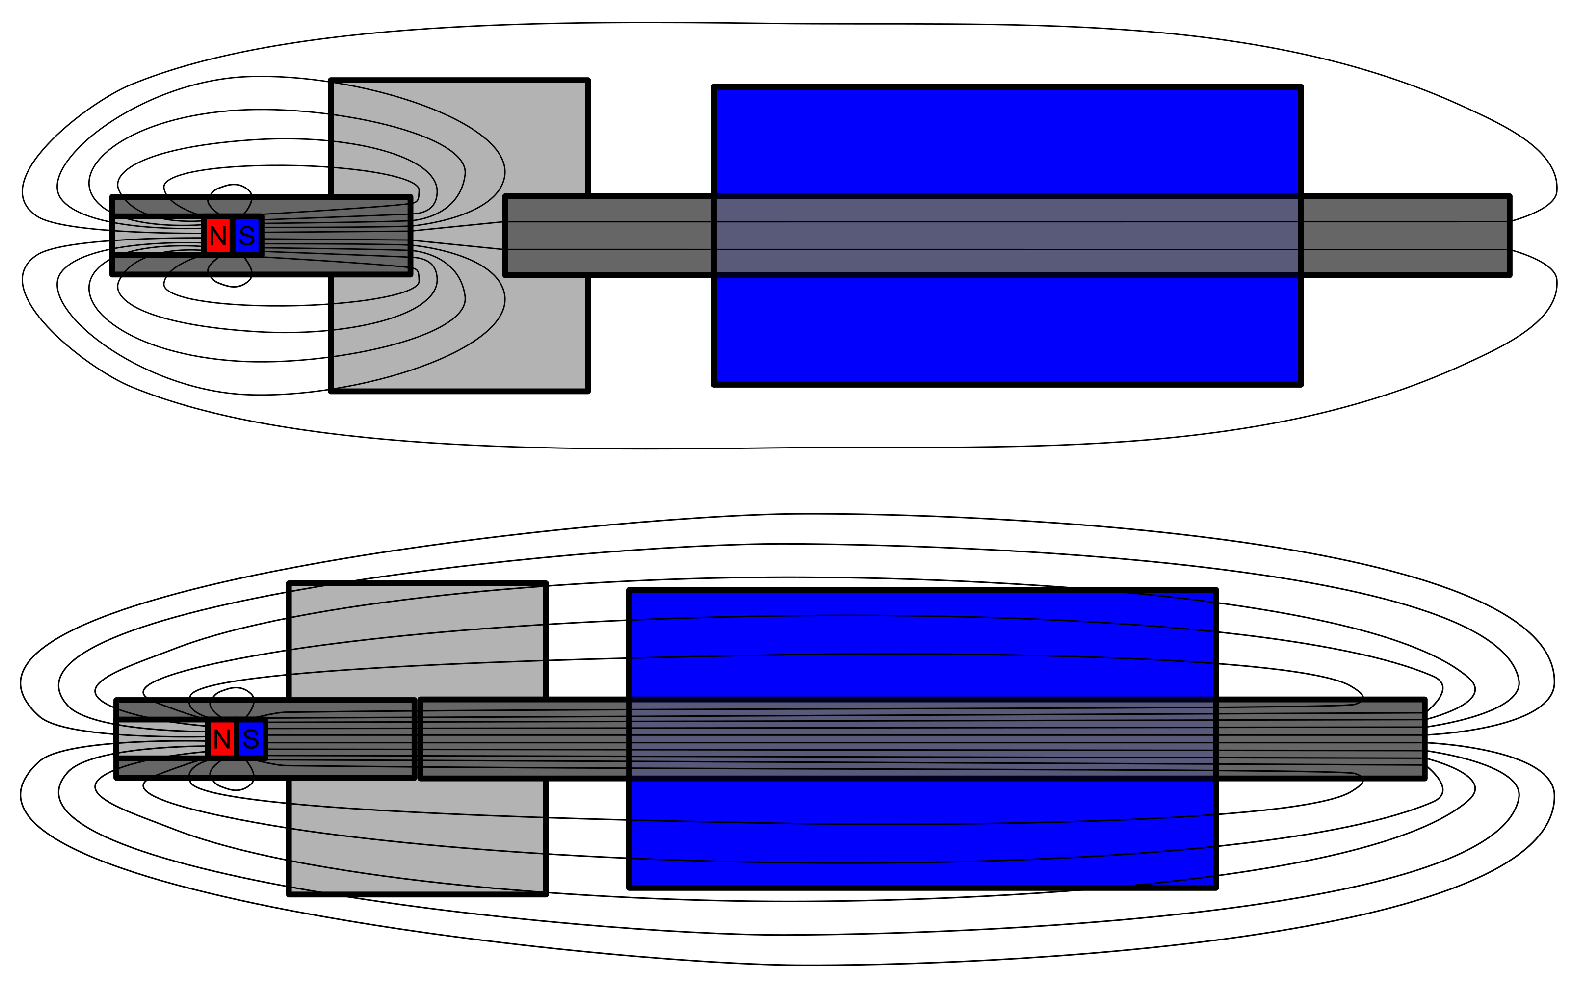
Three cases were tested, with different spacing between the magnetic bit-holder and the sensor to alter the magnetic coupling as illustrated in Figure 26. The “Min spacing” case has the shafts touching like the lower case in Figure 26, and the “Max spacing” case has the coupler adjusted to maximize the gap like the upper case in Figure 26 (without compromising torque capacity). The “Mid spacing” case is approximately halfway between the other two spacing distances.
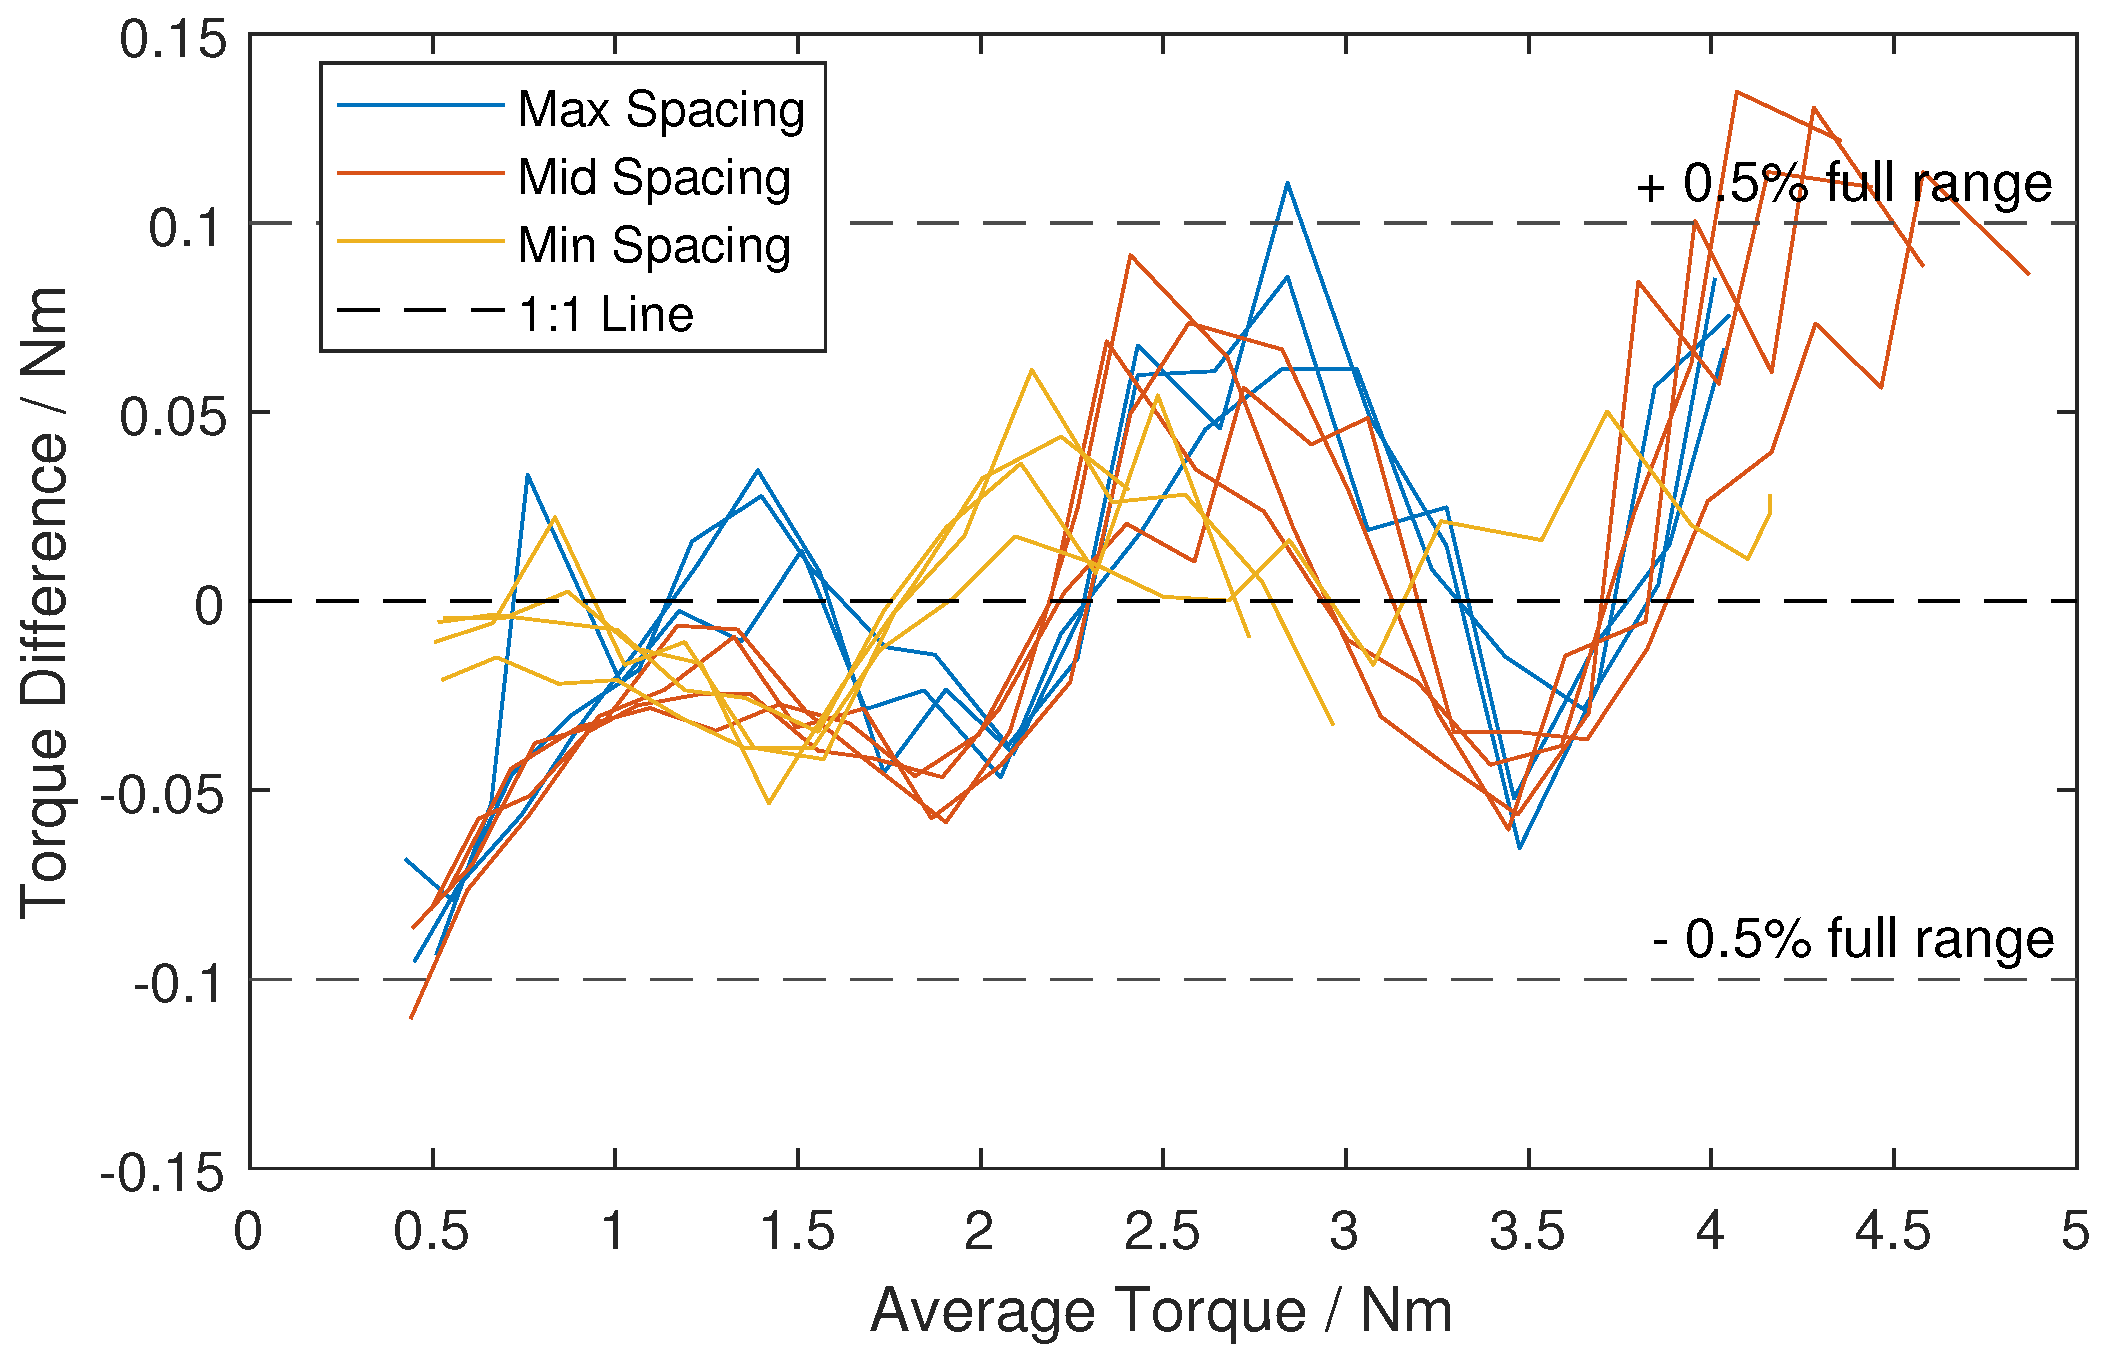
The data were processed to extract a point from each step after the torque stabilised from both sensors. Using the off-the-shelf stationary sensor as a reference, and after applying a zeroing correction, a Bland–Altman plot of the data was produced, shown in Figure 27. ±0.5% of the sensors’ full range was used for the error limits as the sensor data sheet does not guarantee better performance than this, and if the specification is maintained then the sensor can be considered functioning as normal. The 1:1 line represents an ideal perfect match between the tested and reference sensors.
For all spacing conditions tested, the sensor generally remained within 0.5% of the reference value over the range relevant to the test rig. Some small excursions were noted at the extreme values; however, they are close enough to the ±0.5% that we considered them negligible. The error shows some non-linearity; however, due to the proprietary design of the sensors, the reasons for this are unknown.

5.2. Positional Repeatability

To test the repeatability of the draw-wire encoder, the test rig was set up with a solid object in the sample clamp, and the 2 kg counterweight in use. The draw-wire encoder was zeroed while the carriage rested against the sample clamp under the tension of the counterweight. Then, 10 times each, the cart was pulled back to a set point and carefully slid forward again to the clamp. The carriage was pulled back 10, 50, 100, and 250 (max travel) mm.
In every case, the only deviations were ±0.025 mm, which is a single (quadrature) count of the encoder. Possibly as we are using a small fraction of the sensor range of 2000 mm, this is much better than the data-sheet specification of ±0.15 mm.

5.3. Velocity Profile Accuracy

This test checks how accurately the motor follows the commanded profile under different loading conditions.
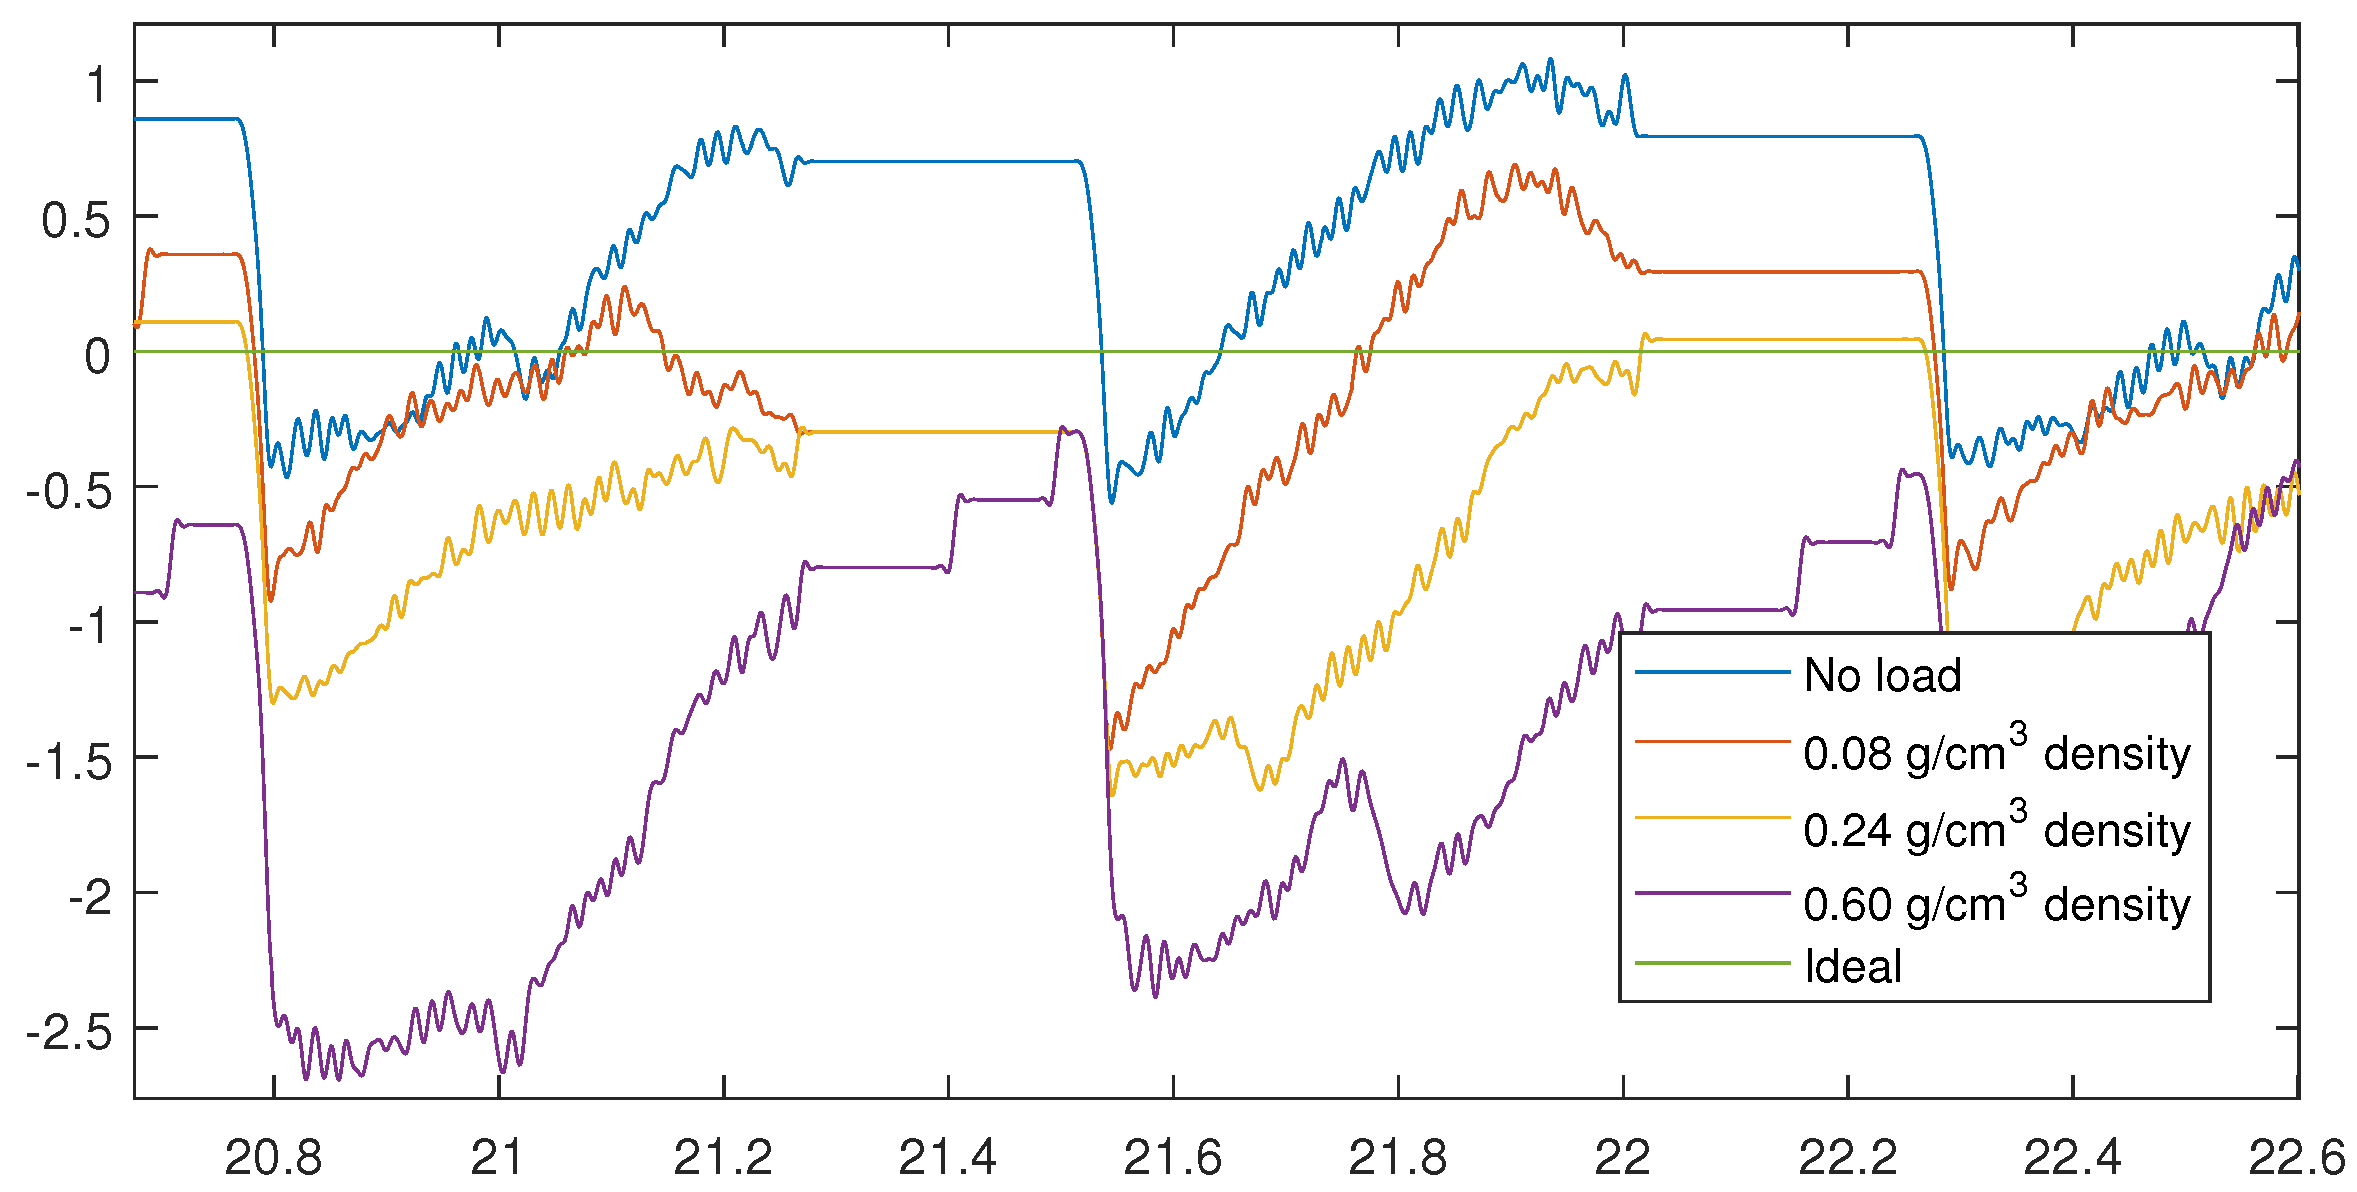
The trapezoidal profile was used with the parameters: low dwell time of 0.25 s, ramp time of 0.15 s, high dwell time of 0.20 s, and distance per trapezoid of 2000 pulses (0.5 revolutions). This was run for 20 revolutions under four different conditions: no load, and inserting a screw into three different densities of PU foam to see how loading affected tracking accuracy. The displacement over time was compared to an ideal mathematically constructed curve; the timing and positional accuracy were not perfect, so to compare the shapes of the curves, the ideal curve was scaled slightly in time (shortened 0.38%) and distance (shortened 0.89%) to properly fit the data, all curves were aligned in time, and the differences from the ideal curve were plotted in Figure 28. Note, that as there is no absolute reference for the motor position set-point, the relative differences between the curves are the main point of interest.
It can be seen that there are slight differences in the tracking performance under different loading. In all cases, the higher loads lead to relatively more lag behind the set point. However, the best vs. worst case performance is only on the order of 2–3 degrees, so we consider this to be negligible. Additionally, in real experiments the actual position is measured by an encoder on the shaft, instead of assuming it perfectly follows the programmed profile, so these errors can be easily considered in any data processing conducted after an experiment.

6. Conclusions

A test rig was developed for testing various aspects of screw insertion. The primary capabilities are a high-torque (5 nm) and accurately controllable direct-drive motor for driving the screws into samples with velocity profiling, with instrumentation of torque, rotation, and linear displacement. The design/component selection for the mechanical, firmware, and software components of the system was discussed. The final price is around 3000 €, not including labor for preparing parts and assembly. The various components were designed with flexibility in mind, so the designs herein can be modified to suit the readers’ purposes or available materials/components.
The test rig has been already used to collect data for a number of studies, and specific results verifying the torque measurement, positional measurement repeatability, and velocity profiling/tracking were reported here.
Data from using this test rig will allow validation and improvements to the various models used to optimize bone screw torque. With this further development, a product could be brought to market to improve success rates in orthopedic surgery and improve the quality of life for patients.

Supplementary Materials

The following supporting information can be downloaded at: www.mdpi.com/xxx/S1.
NameTypeDescription
S1ZIP Archive (.zip).stl files for 3D printing.
S2ZIP Archive (.zip).step files for machinable parts.
S3ZIP Archive (.zip).pdf drawings for machinable parts.
S4ZIP Archive (.zip)CCS Project for Controller Firmware.
S5Binary File (.bin)Compiled Controller Firmware.
S6ZIP Archive (.zip)Visual Studio Project for Controller Interface Software.
S7ZIP Archive (.zip)Compiled Controller Interface Software.
S8MATLAB Script (.m)MATLAB Script used to generate FIR filter coefficients.

Author Contributions

Conceptualisation, J.W.; Funding acquisition, K.M.; Investigation, J.W.; Methodology, J.W.; Project administration, K.M.; Supervision, G.R. and K.M.; Visualisation, J.W.; Writing—original draft preparation, G.R. and J.W.; Writing—review & editing, G.R. and K.M. All authors have read and agreed to the published version of the manuscript.

Funding

Partial support by grants “CiD” and “Digitalisation in the OR” from BMBF (Project numbers 13FH5E02IA and 13FH5I05IA).

Institutional Review Board Statement

Not applicable.

Informed Consent Statement

Not applicable.

Data Availability Statement

Data are contained within the article and Supplementary Materials.

Acknowledgments

Many thanks to Norbert Gut and the workshop at Hochschule Furtwangen Schwenningen Campus for helping with assembling the test rig and fabricating parts.

Conflicts of Interest

The authors declare no conflict of interest.

Abbreviations

The following abbreviations are used in this manuscript:
(G)UI(Graphical) User Interface
PCPersonal Computer
CPRCounts per Revolution
PPRPulses per Revolution
BOMBill of Materials
USBUniversal Serial Bus
PSUPower Supply Unit
(V)DC(Volts) Direct Current
DMADirect Memory Access
DINDeutsches Institut für Normung
ADCAnalog-to-Digital Converter
CPUCentral Processing Unit
EEPROMElectronically-Erasable and Programmable Read-Only-Memory
GPIOGeneral Purpose Input/Output
PWMPulse-Width Modulation
APIApplication Programming Interface
FIRFinite Impulse Response
HTTPHypertext Transfer Protocol
IPInternet Protocol
URLUniform Resource Locator
FDMFused Deposition Molding
DIPDual Inline Package
MACMedium Access Control
CADComputer-Aided Design
STLSTereoLithography

Appendix A. Hardware Modification

As local market conditions, changes in supply chains, and deprecation of old products may affect specific part availability, it should be noted that many alternatives can be considered. Any motor with an appropriate mount, shaft fitting, and sufficient torque/speed for the intended purpose can be substituted as long as the motor controller is logically compatible (in this case the firmware is set up for direction + pulse control, however, this is always modifiable). Changing the motor may require changing the power supply and consideration should be given to whether the voltage levels of the inputs are compatible with the microcontroller (for the Tiva, 0 V to 3.3 V). Any analogue-output torque sensor should be compatible as long as the voltage levels can be converted with a voltage divider (i.e., non-negative signals), and with firmware modification, serial interfaces can also be used.
In principle it is possible to change the microcontroller, but probably difficult. The similarity to the current model will impact the complexity of this. Other Arm Cortex-M4F-based microcontrollers are likely the best candidates; however, different manufacturers may have markedly different peripherals. The peripheral wrappers and device-dependant code will need to be ported, and FreeRTOS compatibility is likely required to prevent a near-complete rewrite of the firmware.
Some test rigs in literature use vertical orientation to provide axial force. This can be achieved with only minor physical changes to the current design. In general, stability should be considered to prevent tipping and injury potential.
In the current model, axial force is only generally regulated by a counterweight with a simple displacement measurement of the axial position. It would not be particularly difficult to control the axial position, for example, with a lead screw or belt, if needed. Axial force measurement could then also be added through the use of load cells; while the implementation details are outside the scope of this paper, this could be implemented in the sample clamp, in the shaft, or in a combined mount for the motor/torque sensor, as examples.

Appendix B. Software UI Reference

Table A1 for a description of all settings in the firmware.
Table A1. Test rig settings reference.
CodeNameDefault ValueRemarks
enaMotor Enabled.00 = Motor shut down, 1 = Motor powered. Not saved/loaded in EEPROM.
indInsert Distance.12 × 4000How many pulses in insertion (4000 per revolution).
rvdReverse Distance.14 × 4000How many pulses to reverse insertion (4000 per revolution).
jgdJog Distance.1How many pulses per jog action (4000 per revolution).
pauFull Insertion Pause.1000Wait time between insertion and reversal in ms.
trpTrapezoidal Enabled.00 = constant profile, 1 = trapezoidal profile.
insInsert Speed.2000How fast to insert screw (4000 = 60 RPM).
rmpTrapezoid Ramp Time.150Time in trapezoidal ramp segments in ms.
hdtTrapezoid High Dwell Time.200Time in trapezoidal full-speed segments in ms.
ldtTrapezoid Low Dwell Time.250Time in trapezoidal stopped segments in ms.
dptDistance Per Trapezoid.200Total pulses to travel per trapezoidal cycle (4000 per revolution).
tlmTorque Limit.1000Unimplemented.
rvsReverse Speed.−1−1 = Same as insert speed, otherwise sets reverse speed (4000 = 60 RPM).
invInvert Rotation.00 = normal, 1 = invert all motion and rotational sensors (e.g., left-handed screw thread).
See Table A2, Table A3, Table A4, Table A5 and Table A6 for a brief description of all UI elements in the software corresponding to the element labeling in Figure A1, Figure A2, Figure A3, Figure A4 and Figure A5, respectively.
Table A2. Main window reference.
IDNameDescription
AAdd source buttonAdds a device to the device list below.
BDevice nameUsed to identify device in output file.
CDevice typeUsed to select what class this device is.
DPort/AddressUsed to specify which port/address the device can be accessed at.
ERefresh portsRefresh the port list after plugging/unplugging a device.
FBaud rateSelect baud rate to use for serial devices.
GDevice mode(If multiple) select whether device sends data on its own(Interrupt), or when requested(Poll).
HDevice trigger(When polling device) Select what triggers a polled data-point.
ICustom settings(If supported) Open custom device-specific settings window. This is used extensively for controlling the test rig.
JRemove deviceDelete entry from devices list.
KDiagnosticsOpen diagnostics window for device (Described below).
LConnect/DisconnectStart/stop link between software and device.
MInternal trigger periodSelects how often polling devices with the “Internal” trigger will send data.
NInternal trigger enableSelects whether internal trigger is currently triggering devices. If not needed it is best to leave this off for performance reasons.
OAdd timestampAdds current time between filename and extension so every output file is uniquely named and traceable.
PFilenameFilename to save output files. If multiple files are generated a folder with the name will be created instead with files named after device Ids. If timestamp is enabled this will be appended to the file/folder name.
QOpen folderOpens system file explorer in the output files’ directory/folder.
RBrowseOpens dialog to select file location/name.
SSave typeSelect between: single/multifile, with single file using column name prefixes for multiple devices, and multi-file using no prefix but saving different devices outputs in different files; and synchronised/unsynchronised, with synchronised buffering the most recent point and writing to files once on each specified sync trigger, and unsynchronised writing points from each device as they are received.
TSync triggerUsed for synchronised file recording settings.
UStart/Stop recordingStarts or stops recording device data to file(s). Files are created with the timestamp when start is clicked.
VDemo data sourceDevice to use for torque/position data in smart-screwdriver demo.
WDemo feedback targetDevice to control from smart-screwdriver demo.
XOpen basic demoOpens simple smart-screwdriver demo with graphed data for debugging.
YOpen fancy demoOpens smart-screwdriver demo with “fancy” graphics for presentations, trade shows, etc.
Figure A1. Main window with labeled controls.
Hardware 02 00011 g0a1
Table A3. Settings window reference.
IDNameDescription
ACommand inputEnter customs commands to send over serial link.
BSend buttonSends command that was typed (also by pressing enter/return).
CCommand feedbackStatus sent from test-rig after running command also shows any status from commands run by all other buttons.
DSetting selectionSelect setting to change (automatically retrieves current value when selected).
ESetting valueValue retrieved from test rig or value to send to test rig.
FGet setting buttonRetrieve selected setting.
GSet setting buttonUpdate test rig setting with given value.
HSave EEPROMSave current settings to test rig EEPROM, so they will be loaded on startup, otherwise, they will be restored to the previously saved values when power-cycling (which can also be desirable).
ILoad EEPROMRestore saved settings from EEPROM.
JReset to defaultsRestore saved EEPROM setting to hard-coded default settings, however, currently active settings will not be reset until EEPROM load or power cycle.
KStart insertionTurns on motor and starts controlled motion with motor according to currently active settings.
LStop insertionStops current controlled motion and turns off motor.
MPause insertionSuspends current insertion, but keeps current state. There may be a few seconds delay as the motor completes the current motion segments first. Clicking start again will resume from the current position and complete the programmed insertion. Up to 2 motion segments are queued in the firmware, with each phase of a trapezoidal profile being one segment, and constant-velocity profiles are split into segments as per the “distance per trapezoid” setting (default 2000 or 0.5 revolutions).
NLock UIPrevents accidentally clicking buttons (e.g., stop). Useful for long-running tests. Click and drag to lock or unlock.
OMotor onEnable motor power. Will prevent hand-turning of the motor up to its holding torque.
PMotor offDisable motor power, e.g., to allow hand-turning.
QRestartReboot micro-controller. Similar to a power cycle but notably may not clear motor driver faults.
RJog multiplierRepeats the “jog distance” this many times when jogged clockwise or counter clockwise.
SClockwise JogRotates the motor clockwise based on jog distance setting and jog multiplier. Will be reversed by “invert motion” setting.
TCounterclockwise jogAs above but opposite direction.
UTorque valueCurrent value of measured torque. Should fluctuate slightly due to noise; no fluctuation may indicate the firmware has crashed.
VRotation valueCurrent incremental rotation in degrees.
WLinear position valueCurrent incremental position in mm.
XRun self-calibrationRuns the firmware torque self-calibration routine. This corrects for zero-point and rotational modulation of the torque signal by rotating the shaft and sampling the offsets from zero. Once complete an internal lookup-table provides correction in the firmware. Run this with screwdriver bits fitted, but otherwise no load.
YZero encodersResets zero point of position and rotation to current position.
ZRotation zero offsetInstead of resetting encoder value to zero, it is reset to this value.
AALinear zero offsetInstead of resetting encoder value to zero, it is reset to this value.
Figure A2. Settings window with labeled controls.
Hardware 02 00011 g0a2
Table A4. Diagnostics window reference.
IDNameDescription
ADevice nameWhich device the diagnostics are being shown for.
BPortWhich port/address the device is using.
CData rateHow many data points received in 1 s.
DAverage periodAverage time between point in ms.
EPeriod standard deviationStandard deviation in period times in ms.
FMax periodLongest period in the last second.
GMin periodShortest period int he last second.
HPeriod distributionGraph of periods between data points in last 1 s. Scaled for 1 ms expected average.
Figure A3. Diagnostics window with labeled controls.
Hardware 02 00011 g0a3
Table A5. Basic demo window reference.
IDNameDescription
AStart insertionSend command to controlled device to start insertion (for test rig this is the same as the button in the customs settings). Will also start plotting data and estimating stripping torque.
BStop insertionSend command to controlled device to stop insertion. Also, stops plotting data.
CAuto stopStops insertion automatically when estimated limit is exceeded. This condition is suppressed for the first 10 revolutions to allow the estimate to stabilize.
DScrew type selectionReference screw for “Known Value” plot, used as a-priori geometry information for the torque limit algorithm.
EMaterial selectionReference material for “Known Value” plot.
FTorque plotShows measured torque values and progressively updated estimated limit.
GStrength plotShows estimated strength from torque-rotation values and screw geometry compared to an estimate of the known value based on material datasheet properties.
Figure A4. Basic demo window with labeled controls.
Hardware 02 00011 g0a4
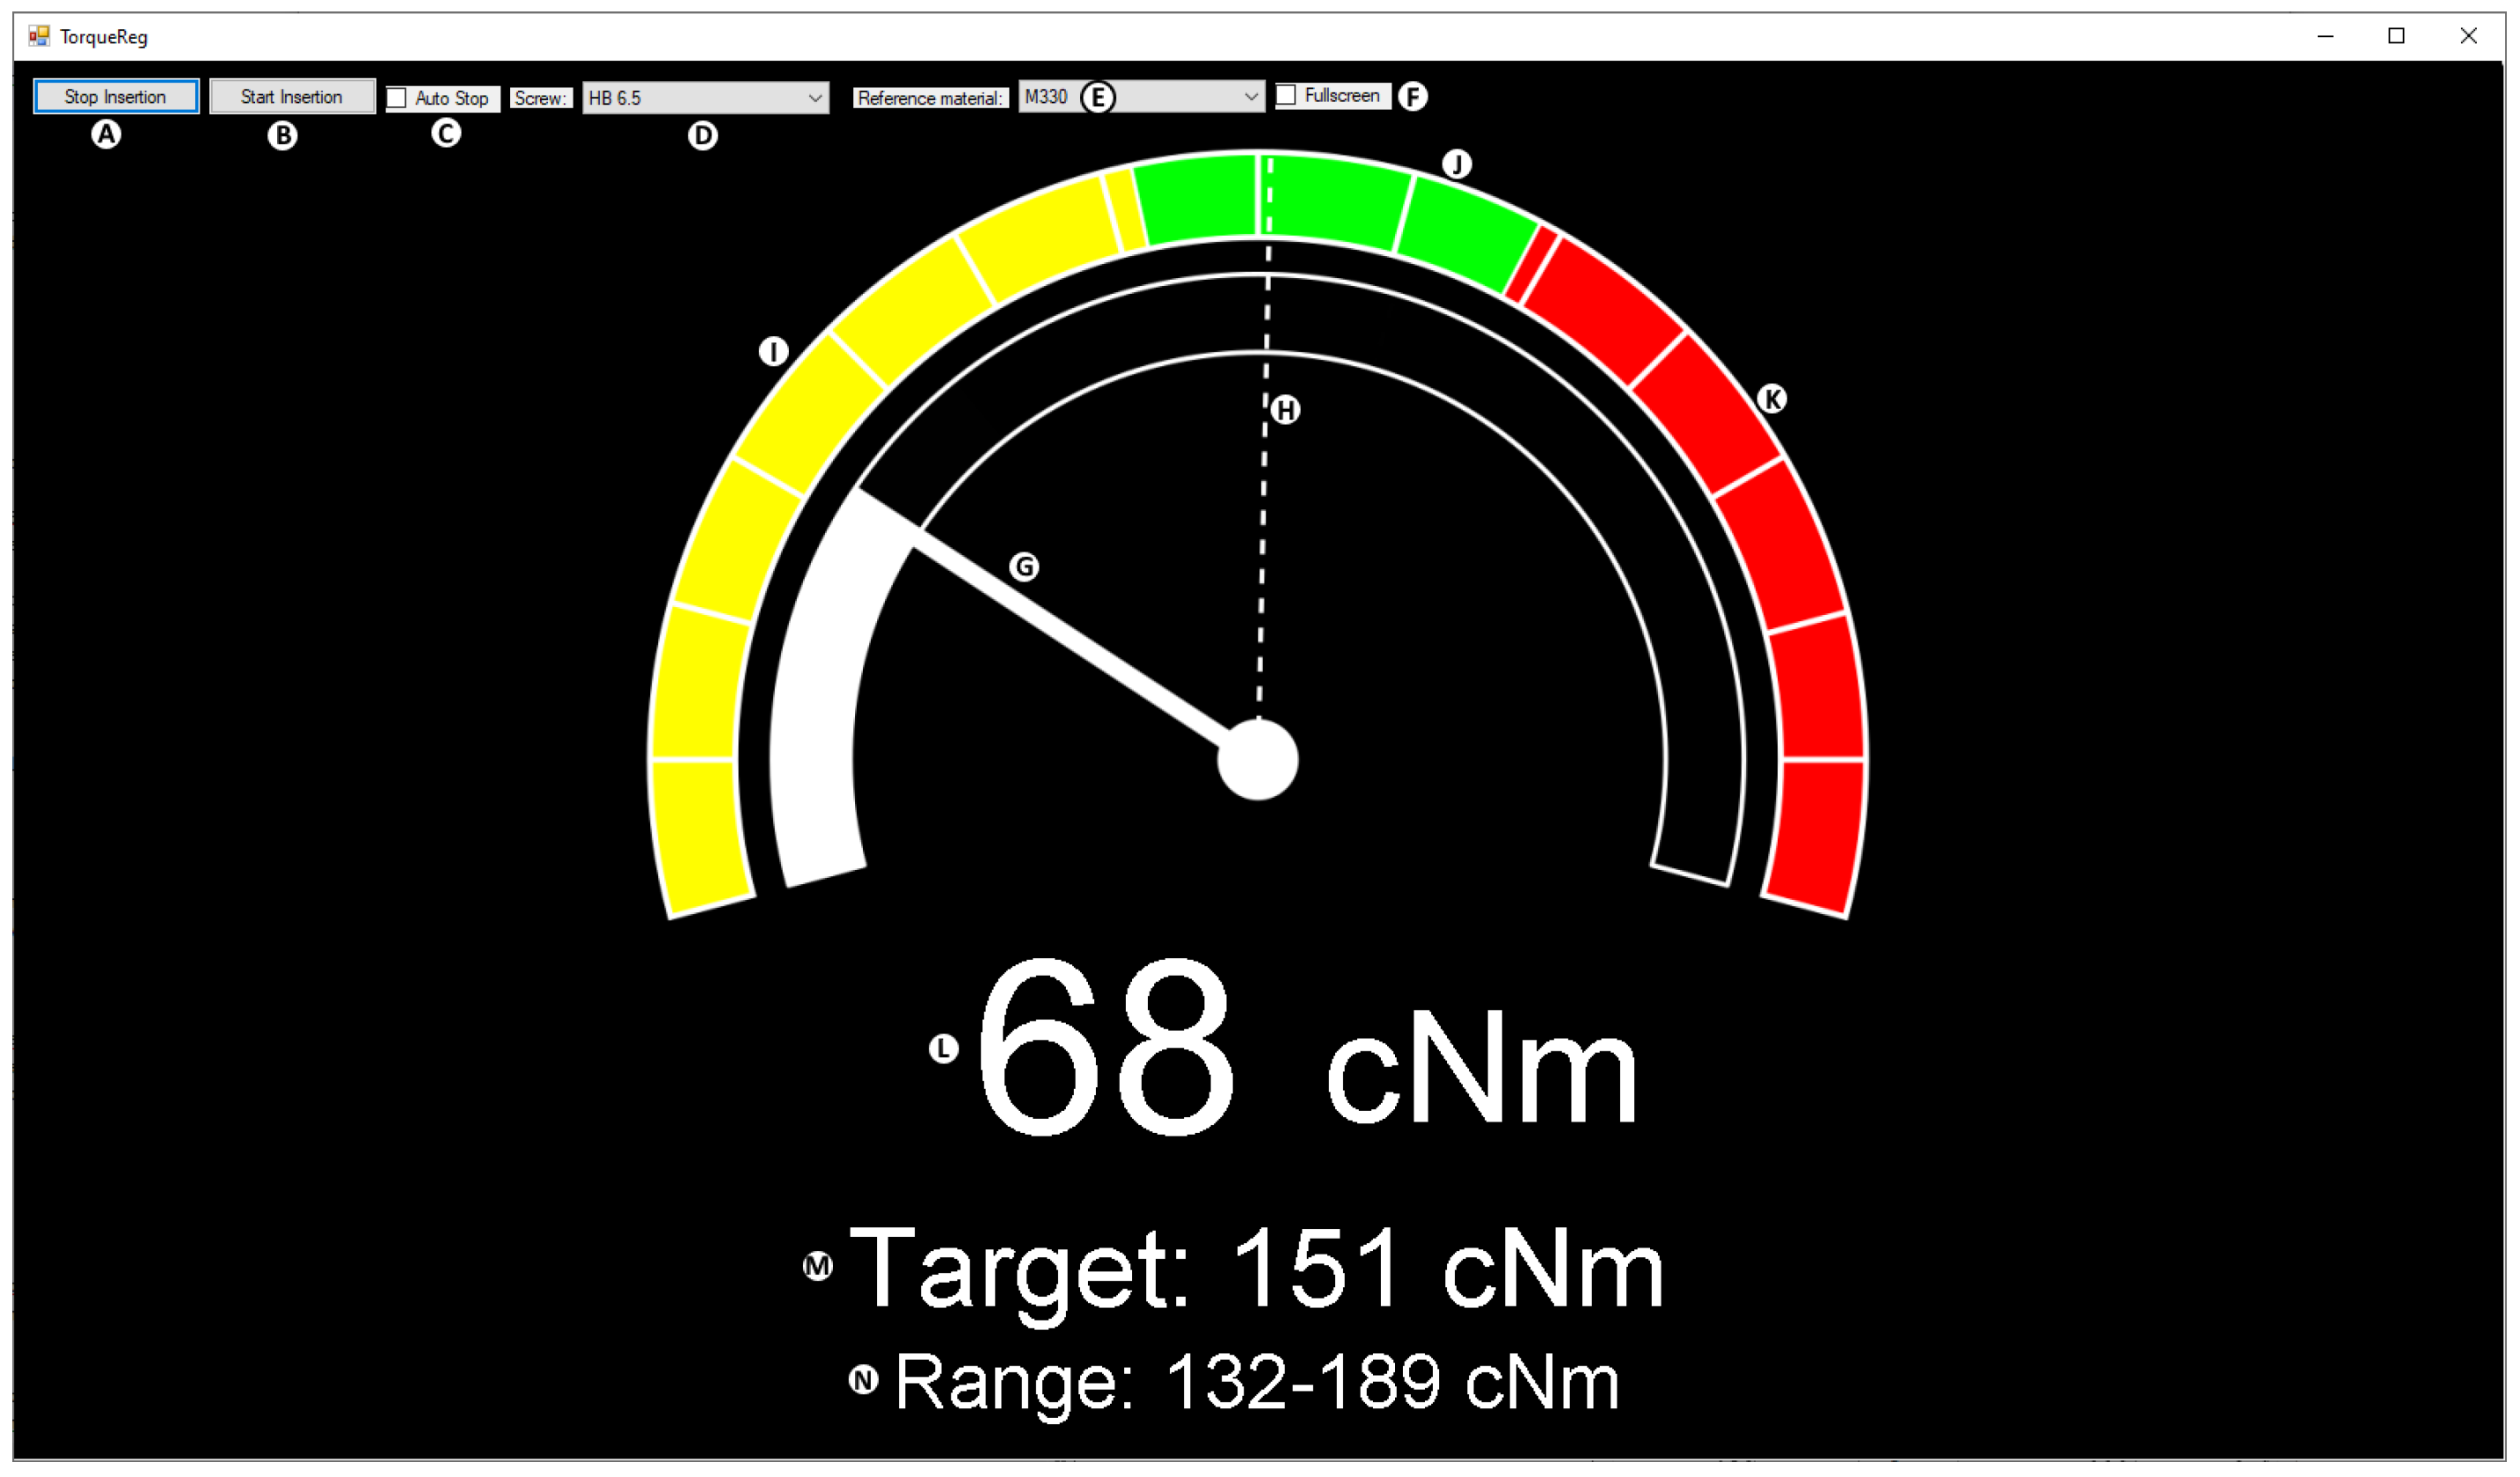
Table A6. Fancy demo window reference. As this was originally made on short-notice for a trade show and not for scientific measurement purposes, there is a hard-coded calibration factor of 1.2 for the torque limit prediction in the TorqueRegNice.cs class of the software.
IDNameDescription
AStart insertionSend command to controlled device to start insertion (for test rig this is the same as the button in the customs settings). Will also start plotting data and estimating stripping torque.
BStop insertionSend command to controlled device to stop insertion. Also, stops plotting data.
CAuto stopStops insertion automatically when 80% of estimated limit is exceeded. This condition is suppressed for the first 10 revolutions to allow the estimate to stabilize.
DScrew type selectionReference screw for gauge visual scaling, used as a-priori geometry information for the torque limit algorithm.
EMaterial selectionReference material for gauge visual scaling.
FFullscreenShow gauge in fullscreen, e.g., for demos/trade shows.
GTorque indicatorIndicates currently measured torque value.
HTorque targetIndicates 80% of torque limit.
IUnder-torque rangeYellow area indicates less than 70% of estimated limit.
JIdeal torque rangeGreen area indicates 70–100% of estimated limit.
KOver-torque rangeRed area indicates exceeding 100% of the estimated torque limit.
LTorque valueNumeric value for current torque.
MTarget valueNumeric value for 80% of estimated torque limit.
NTarget rangeNumeric values for 70% to 100% of estimated torque limit.
Figure A5. Fancy demo window with labeled controls.
Hardware 02 00011 g0a5

Appendix C. Troubleshooting

Troubleshooting Common troubleshooting steps are summarised in Table A7.
Table A7. Common troubleshooting steps.
ProblemPossible CauseRemedy
Controller
Data from test rig not updating/empty output file.Test rig firmware crashed.Power cycle test rig and re-connect.
USB connection failed.Disconnect USB, power cycle test rig, then re-connect cable and re-connect in software.
Specific sensor data stuck at zero.Sensor cable disconnected.Check cable correctly plugged in.
Wiring error.Check internal connections in controller against reference (unplug power cable first!).
Motor not turning.Motor driver power fault.Power-cycle and reconnect test-rig in software, making sure to remove USB cable during power-cycle.
Other transient motor fault.
Incorrect power sequencing.Ensure controller box is turned on and wait a few seconds before connecting USB cable.
Motor or feedback cable disconnected.Ensure cables are securely connected and screwed together. Check that cable connections have not been pulled out of motor driver inside the controller.
Data from interrupt-based source not updating/empty output file.No interrupt set/enabled.Check interrupt settings and if using internal trigger check that it is turned on.

Appendix D. New Device Guide

In case of uncertainty, it is recommended to look through the existing devices for examples. Although there is no one perfect way to implement everything, the below guide/recommendations should be a good start for most foreseeable use cases; however, it is difficult to predict all possible applications and difficulties.

Appendix D.1. General

A new sensor can be added to the software code by creating a class in the “Drivers” folder/namespace (recommended). The class should at a minimum inherit IDevice or BaseSerialDevice.
At a bare minimum, to record data correctly and not crash, the software framework requires that the device must:
  • report its data format by implementing the GetFormat() method;
  • report “Interrupt” or “Poll” mode by implementing the GetModes() method, or overriding the “PollSupported” or “InterruptSupported” properties from BaseSerialDevice;
  • if “Polling”, implement the SetTrigger() method (IDevice) to listen for triggers from the passed object, or use the Triggered() method (BaseSerialDevce), and send data points in response (or trigger the reading if necessary and send as soon as possible);
  • if “Interrupt”, send data points whenever ready;
  • if IDevice, report custom settings support by implementing the the SupportCustomDialog() method, and if true must implement the OpenCustomDialog() method;
  • implement all methods in the IDevice or all abstract methods in BaseSerialDevice (depending on inheritance);
  • if IDevice, assign all EventHandlers to “delegate { }”;
  • use the LoggingDevice attribute to give the device a user-friendly name and make it appear in the device list.

Appendix D.2. Serial Interface

The BaseSerialDevice class handles most connection/disconnection and configuration logic expected for serial devices. If it does not cover your case you may need to reimplement it or (messy) duplicate/rename the class and make adjustments as needed.
To function fully, a serial device should:
  • implement the SetupDevice()/StopDevice() methods to perform any required connection/disconnection commands;
  • implement the ProcessLine() method to parse data from the device and send data points;
  • implement the DefaultBaud() method to configure the device’s normal baud rate.

Appendix D.3. Other Interfaces

To function fully, the device should:
  • implement SelectedType() / DeselectedType() to enable or disable the relevant configuration options by invoking the “Enable[…]Select”, “Disable[…]Select”, and enable/disable button events; make sure to disable anything that was enabled when the type is deselected;
  • when configured as polling/interrupt by default or through a setting, enable either trigger selection(polling) or trigger use(interrupt);
  • when sending a data point as an interrupt, also invoke the trigger event to synchronously trigger other connected devices;
  • implement Connect() /Disconnect() to connect or disconnect the device; also locking/disabling settings as necessary and using the Connected/Disconnected events to report the success of this;
  • if needing a non-serializable port/address, implement the IIPDevice interface to allow free text entry in the port field (useful for IP, URL, MAC); then GetPort() / SetPort() semantically refer to this address;
  • implement GetBauds() / GetModes() / GetPorts() / SetBaud() / SetMode() / SetPort() / GetPort() / DefaultBaud() as relevant to the required settings; GetPorts() may list serial ports, or can foreseeably list some other serialised device list (e.g., discovered Bluetooth devices, although completely unimplemented currently);
You may want to allow interrupting devices to allow configuration in a polling mode to simplify synchronisation with other devices. This can be conducted by storing data points in a variable instead of sending them immediately, and only sending the latest data point when a trigger is received. However, this can also be achieved by using synchronised file-saving modes.

References

  1. Rybczynski, W. One Good Turn: A Natural History of the Screwdriver and the Screw; Simon & Schuster: New York, NY, USA, 2000. [Google Scholar]
  2. Fernandez, D.L. Anterior Bone Grafting and Conventional Lag Screw Fixation to Treat Scaphoid Nonunions. J. Hand Surg. 1990, 15, 140–147. [Google Scholar] [CrossRef] [PubMed]
  3. Cuny, C.; Scarlat, M.M.; Irrazi, M.; Beau, P.; Wenger, V.; Ionescu, N.; Berrichi, A. The Telegraph Nail for Proximal Humeral Fractures: A Prospective Four-Year Study. J. Shoulder Elb. Surg. 2008, 17, 539–545. [Google Scholar] [CrossRef] [PubMed]
  4. Barber, F.A.; Herbert, M.A.; Beavis, R.C.; Barrera Oro, F. Suture Anchor Materials, Eyelets, and Designs: Update 2008. Arthrosc. J. Arthrosc. Relat. Surg. 2008, 24, 859–867. [Google Scholar] [CrossRef] [PubMed]
  5. Kieser, D.C.; Ailabouni, R.; Kieser, S.C.; Wyatt, M.C.; Armour, P.C.; Coates, M.H.; Hooper, G.J. The Use of an Ossis Custom 3D-printed Tri-Flanged Acetabular Implant for Major Bone Loss: Minimum 2-Year Follow-Up. Hip Int. 2018, 28, 668–674. [Google Scholar] [CrossRef] [PubMed]
  6. Yang, C.; Han, X.; Wang, J.; Yuan, Z.; Wang, T.; Zhao, M.; Han, G. Cemented versus Uncemented Femoral Component Total Hip Arthroplasty in Elderly Patients with Primary Osteoporosis: Retrospective Analysis with 5-Year Follow-Up. J. Int. Med. Res. 2019, 47, 1610–1619. [Google Scholar] [CrossRef] [PubMed]
  7. Evans, M.; Spencer, M.; Wang, Q.; White, S.H.; Cunningham, J.L. Design and Testing of External Fixator Bone Screws. J. Biomed. Eng. 1990, 12, 457–462. [Google Scholar] [CrossRef] [PubMed]
  8. Feroz Dinah, A.; Mears, S.C.; Knight, T.A.; Soin, S.P.; Campbell, J.T.; Belkoff, S.M. Inadvertent Screw Stripping During Ankle Fracture Fixation in Elderly Bone. Geriatr. Orthop. Surg. Rehabil. 2011, 2, 86–89. [Google Scholar] [CrossRef] [PubMed]
  9. Li, B.; Aspden, R.M. Composition and Mechanical Properties of Cancellous Bone from the Femoral Head of Patients with Osteoporosis or Osteoarthritis. J. Bone Miner. Res. 1997, 12, 641–651. [Google Scholar] [CrossRef] [PubMed]
  10. Stoesz, M.J.; Gustafson, P.A.; Patel, B.V.; Jastifer, J.R.; Chess, J.L. Surgeon Perception of Cancellous Screw Fixation. J. Orthop. Trauma 2014, 28, e1. [Google Scholar] [CrossRef] [PubMed]
  11. Thomas, R.L.; Bouazza-Marouf, K.; Taylor, G.J.S. Automated Surgical Screwdriver: Automated Screw Placement. Proc. Inst. Mech. Eng. Part H J. Eng. Med. 2008, 222, 817–827. [Google Scholar] [CrossRef] [PubMed]
  12. Reynolds, K.J.; Mohtar, A.A.; Cleek, T.M.; Ryan, M.K.; Hearn, T.C. Automated Bone Screw Tightening to Adaptive Levels of Stripping Torque. J. Orthop. Trauma 2017, 31, 321–325. [Google Scholar] [CrossRef] [PubMed]
  13. Wright, B.J.; Grigg, S.; Bergsaker, A.S.; Brattgjerd, J.E.; Steen, H.; Pullin, R. Real Time Monitoring of Screw Insertion Using Acoustic Emission Can Predict Screw Stripping in Human Cancellous Bone. Clin. Biomech. 2020, 76, 105026. [Google Scholar] [CrossRef] [PubMed]
  14. Wilkie, J.; Docherty, P.D.; Möller, K. A Simple Screwing Process Model for Bone Material Identification. In Proceedings of the 14th Symposium on Automation in Medical Engineering, AUTOMED, Lübeck, Germany, 2–3 March 2020; Volume 1, p. 038. [Google Scholar] [CrossRef]
  15. Wilkie, J.; Docherty, P.D.; Stieglitz, T.; Möller, K. Geometric Generalization of Self Tapping Screw Insertion Model. In Proceedings of the 2021 43rd Annual International Conference of the IEEE Engineering in Medicine Biology Society (EMBC), Virtual, 1–5 November 2021; pp. 4339–4387. [Google Scholar] [CrossRef]
  16. Wilkie, J.; Docherty, P.D.; Möller, K. Stripping Torque Model for Bone Screws. IFAC-PapersOnLine 2021, 54, 442–447. [Google Scholar] [CrossRef]
  17. Wilkie, J.A.; Rauter, G.; Möller, K. Determining Relationship between Bone Screw Insertion Torque and Insertion Speed: Bestimmung Des Zusammenhangs Zwischen Dem Drehmoment Beim Eindrehen von Knochenschrauben Und Der Eindrehgeschwindigkeit. at - Automatisierungstechnik 2022, 70, 976–991. [Google Scholar] [CrossRef]
  18. Betts, J.L.; Brinkley, F.M.; Priddy, L.B.; Priddy, M.W. Low-Speed Instrumented Drill Press for Bone Screw Insertion. HardwareX 2023, 16, e00474. [Google Scholar] [CrossRef] [PubMed]
  19. Calcagno, B.O. Acquisition of an Instron Electropuls E3000 Instrument for Mechanical Testing; University of Puerto Rico at Mayaguez Mayaguez: Mayagüez, Puerto Rico, 2015. [Google Scholar] [CrossRef]
  20. Wilkie, J.; Docherty, P.D.; Stieglitz, T.; Möller, K. Quantifying Accuracy of Self-Tapping Screw Models. In Proceedings of the 2021 43rd Annual International Conference of the IEEE Engineering in Medicine Biology Society (EMBC), Virtual, 1–5 November 2021; pp. 4391–4394. [Google Scholar] [CrossRef]
Figure 1. Complete test rig design with labeled parts referred to below. Length excluding the counterweight (H) is 700 mm, width is approximately 300 mm including clearance for the draw-wire encoder (E) wire, and height is 235 mm with extra clearance required for the torque sensor (B) plug totaling approximately 300 mm unless a right-angle connector is used which would remain within 235 mm.
Hardware 02 00011 g001
Figure 2. Test rig controller with labeled components referred to below.
Hardware 02 00011 g002
Figure 3. Diagram of the designs of the devices, tasks, data, and their interactions in the firmware. This is simplified to show the most important relationships.
Hardware 02 00011 g003
Figure 4. Coupled rotational components.
Hardware 02 00011 g004
Figure 5. Assembled sliding platform. (a) Bottom view. Don’t overlook indicated part. (b) Top view.
Hardware 02 00011 g005
Figure 6. Assembled base of test stand.
Hardware 02 00011 g006
Figure 7. Base with sliding platform mounted on test stand.
Hardware 02 00011 g007
Figure 8. Visualisation of steps for assembling the sample mount on the test stand. (a) Base mounted. (b) Lower plate added. (c) Threaded rods added. (d) Upper plate added.
Hardware 02 00011 g008
Figure 9. (a) Pulley block assembly. (b) Block mounted on test stand.
Hardware 02 00011 g009
Figure 10. Steps for assembling counterweight wire. (a) Wire tied around nut to secure in siding platform wire holder. (b) Wire threaded through hole drilled in bolt. (c) Threaded nut screwed into counterweight.
Hardware 02 00011 g010
Figure 11. Steps for fitting draw-wire holding block. (a) Assembled draw-wire holding block. (b) Holding block mounted to test stand.
Hardware 02 00011 g011
Figure 12. Front and back cut-outs in controller box. Indicated hole is not part of final design.
Hardware 02 00011 g012
Figure 13. Front panel connectors/wires. Indicated connectors are not part of the final design. (a) Connectors fitted to front panel with wires soldered. (b) Front view of front panel connectors. (c) Motor connection cables fitted through cable grommets.
Hardware 02 00011 g013
Figure 14. Power supply connections assembly. (a) Wires attached to plug. (b) Plug attached to rear panel and PSU terminals.
Hardware 02 00011 g014
Figure 15. Power supply and motor driver mounting. (a) Attached case sides and base to power supply. (b) Mounted motor driver onto side of power supply.
Hardware 02 00011 g015
Figure 16. Wire connections for the motor driver. The Tiva ground for power is connected via the PUL- port to minimise loop size for this rapidly switching signal.
Hardware 02 00011 g016
Figure 17. Tiva mounting. (a) Back-stop added. (b) Back-stop secured with screws and Tiva inserted. (c) First clip fitted and second half-on to demonstrate process. (d) Tiva fully secured.
Hardware 02 00011 g017
Figure 18. Pin connection positions on the Tiva board. Note, power source selection switch position.
Hardware 02 00011 g018
Figure 19. Pin numbering used on 8-pin circular connectors.
Hardware 02 00011 g019
Figure 20. Inline voltage divider for Torque sensor output to Tiva input. Shaded areas show where to cover connections with electrical tape. Silver ovals show soldering locations.
Hardware 02 00011 g020
Figure 21. Fully wired controller box.
Hardware 02 00011 g021
Figure 22. Interactions with main window to add, and connect to, the test rig.
Hardware 02 00011 g022
Figure 23. Diagnostics window with normal display.
Hardware 02 00011 g023
Figure 24. Bone screw test rig settings/control window.
Hardware 02 00011 g024
Figure 25. Experimental setup with off-the-shelf torque sensor connected to test rig shaft.
Hardware 02 00011 g025
Figure 26. Visual clarification of how changing the spacing in the coupler changes the amount of magnetic field coupling into the torque sensor shaft. The magnetic permeability of the air and aluminium is very low and similar in comparison to that of the steel screw-bit holder and torque sensor shaft.
Hardware 02 00011 g026
Figure 27. Error in torque measurement over tested range with different magnetic coupling.
Hardware 02 00011 g027
Figure 28. Error from perfect profile under different loading conditions.
Hardware 02 00011 g028
Table 1. Tools for manufacturing/assembly.
Intended ToolAlternative(s)Remarks
Basic FDM 3D printer.Order 3D printed parts online.For 3D printed mounts.
Milling machine + Lathe.Order machined parts online.For machined parts.
Tap and die set. For threaded holes.
Screwdriver with bit set.Allen key set.Depending on the screw heads ordered.
Hand file.
Soldering station + solder.Soldering iron + solder.Leaded solder may be easier to work with, however, consider if you have any toxicity/RoHS requirements/regulations to follow.
Electrical tape.Cellulose-tape.Insulating solder joints and holding connections together.
Table 2. Bill of materials for test stand. Quantities in Brackets indicate a smaller amount needed than the minimum order.
PartUnit (EUR)QtyTotal (EUR)Reference SupplierRemarks/Specifics
Test Rig Sensors 2543.66
Torque sensor2230.0612230.06NCTE AGNCTE 2300-5-1-AU-0-0
Draw-wire encoder313.601313.60Fritz Kübler GmbHD5.2501.2421.1000
Test Rig Motion 276.65
Stepper motor64.84164.84STEPPERONLINE34HS46-6004D-E1000
Linear Bearings14.82456.29Tuli d.o.o.SME 16 UU
Linear Rails25.82251.63Tuli d.o.o.SA 16 (0.45 m)
Sensor-Bit Coupler53.00153.00MISUMI Europa GmbHSDWA-47C-9K3X10
Motor-Sensor Coupler44.50144.50MISUMI Europa GmbHEK1/20/A/14/9
Motor bracket6.3916.39STEPPERONLINEST-M7
Test Rig Structure + Fasteners163.91
Main Supports10.91221.83myaluprofil.de40 × 40 × 700 groove 10 B-type
Clamp Base20.44120.44myaluprofil.de100 × 100 × 200 groove 10 B-type
Main Cross-Supports2.2436.71myaluprofil.de30 × 30 × 200 groove 8 B-type
8 B-type M5 T-nuts0.20122.40myaluprofil.deH208HM5
8 B-type M6 T-nuts0.2061.20myaluprofil.deH208HM6
10 B-type M6 T-nuts0.2782.16myaluprofil.deH210HM6
10 B-type M8 T-nuts0.2720.54myaluprofil.deH210HM8
Angle 30 × 30 8 B-type0.8021.60myaluprofil.deH208W30A
Aluminium Plate 5 mm24.70124.70metallstore24.de240 × 240 × 5 mm
Aluminium Plate 20 mm13.87113.87metallstore24.de100 × 100 × 20 mm
M3x10 Screw 50(2)4.09screwsandmore.deDIN 912 A2 M3X10
M3.5x16 Screw 25(2)12.49screwsandmore.deDIN 912 A2 M3.5X10
M4x12 Socket Screw 50(4)3.19screwsandmore.deDIN 912 A2 M4X12
M5x10 Socket Screw 50(29)6.99screwsandmore.deDIN 912 A2 M5X10
M5x40 Socket Screw 10(1)3.49screwsandmore.deDIN 912 A2 M5X40
M6x16 Socket Screw 10(6)2.69screwsandmore.deDIN 912 A2 M6X16
M6x30 Socket Screw 104.09screwsandmore.deDIN 912 A2 M6X30
M6x35 Socket Screw 104.09screwsandmore.deDIN 912 A2 M6X35
M8x16 Socket Screw 10(2)3.49screwsandmore.deDIN 912 A2 M8X16
M6 Nut 50(14)3.59screwsandmore.deDIN 934 A2 M6
M6 Threaded Rod5.5915.59screwsandmore.deDIN 976 A2 M6X250
M6 Washer 50(4)4.99screwsandmore.deDIN 9021 A2 6.4
M8 Washer 50(32)6.99screwsandmore.deDIN 9021 A2 8.4
M6x16 Hex Bolt 10(1)2.69screwsandmore.deDIN 933 A2 M6X16
Total 2984.22
Table 3. Bill of materials for controller. Quantities in Brackets indicate a smaller amount needed than the minimum order.
PartUnit (EUR)QtyTotal (EUR)Reference SupplierRemarks/Specifics
Controller 347.61
Chassis131.961131.96RS Online1.5Ux279Dx305W
Motor Driver51.79151.79STEPPERONLINECL86T V4.1 (Authors have V3.0)
Microcontroller31.86131.86RS OnlineEK-TM4C123GXL
PSU30.04130.04STEPPERONLINES-350-48
Plug Module10.47110.57RS OnlineRS Part 870-3271
10 A Fuse0.48104.82RS OnlineRS Part 563-592
Fuse Holder3.8813.88RS OnlineRS Part 498-2653
0.254″ Header Cables 202.31DigikeyDigikey Part 1568-1513-ND
Jumper Wires 1407.07DigikeyDigikey Part 438-1049-ND
M2.5 Nut 100(16)4.19screwsandmore.deDIN 934 A2 M2.5
M2.5x10 Slot Screw 50(16)4.09screwsandmore.deDIN 85 A2 M2.5X10
M4x6 Slot Screw 25(4)2.69screwsandmore.deDIN 85 A2 M4X6
M4x10 Slot Screw 25(1)2.69screwsandmore.deDIN 85 A2 M4X10
THT ResistorsNegligibleGenericFor voltage divider (56k + 27k)
3D Printed MountsVariableSelf-made
Case Cable Grommets5.4325(2)5.43RS OnlineRS Part 817-8877
Torque cable plug20.71120.71RS OnlineRS Part 734-5555
Torque panel receptacle22.21122.21RS OnlineRS Part 734-5785
Draw-wire cable plug5.8415.84RS OnlineRS Part 786-3454
Draw-wire receptacle5.4615.46RS OnlineRS Part 786-3435
Test Stand Total 2984.22
Grand Total 3331.83
Table 4. Torque sensor connections.
PinWire ColourNameConnected to
1WhiteUSB D−N.C.
2BrownUSB D+N.C.
3GreenEncoder ATiva PD6
4YellowEncoder BTiva PD7
5GreyAnalogue GNDTiva GND
6PinkTorqueTiva PD0 (Through voltage divider)
7BluePower GroundStepper Driver EGND
8RedVCC InStepper Driver VCC
Table 5. Draw wire encoder connections.
PinWire ColourNameConnected to
1White0VTiva GND
2BlueChannel ON.C.
3PinkChannel B ¯ N.C.
4GrayChannel BTiva PC6
5YellowChannel A ¯ N.C.
6GreenChannel ATiva PC5
7Brown+VTiva VBUS
8RedChannel O ¯ N.C.
Disclaimer/Publisher’s Note: The statements, opinions and data contained in all publications are solely those of the individual author(s) and contributor(s) and not of MDPI and/or the editor(s). MDPI and/or the editor(s) disclaim responsibility for any injury to people or property resulting from any ideas, methods, instructions or products referred to in the content.