1. Introduction
There has been a rapid increase in the discovery of fossil human footprints in recent years (e.g., [
1,
2,
3,
4,
5,
6,
7]). In particular, sequences from the North American Southwest preserve multiple footprint-bearing horizons within stratigraphic successions [
8]. These surfaces provide direct evidence of human presence and can support biometric and behavioural inferences, including group composition, movement patterns, and activity structure.
Despite this potential, the interpretation of repeated footprint horizons remains uncertain. Do such surfaces reflect population abundance, sustained occupation, or repeated use of a landscape? Or are they primarily structured by environmental and taphonomic processes? More fundamentally, do footprint assemblages provide a representative sample of past populations, or are they filtered records shaped by the conditions under which footprints form and are preserved?
These questions are central to the archaeological and palaeontological use of footprint evidence. In particular, it remains unclear how footprint-bearing surfaces relate to environmental change, and whether their repetition through time reflects continuity of occupation or instead episodic presence governed by preservation opportunities.
The sedimentological context of vertebrate tracks has long been recognised as fundamental to their preservation. Early work by Laporte and Behrensmeyer demonstrated the importance of substrate properties and depositional environment in controlling the formation and survival of vertebrate tracks [
9], while Ashley and co-workers showed how fluctuating groundwater-fed wetlands and lake-margin sedimentary environments create complex depositional settings in which vertebrate traces may be produced, modified and ultimately preserved (e.g., [
10]). Together these studies established many of the sedimentological principles that underpin modern investigations of fossil footprint preservation.
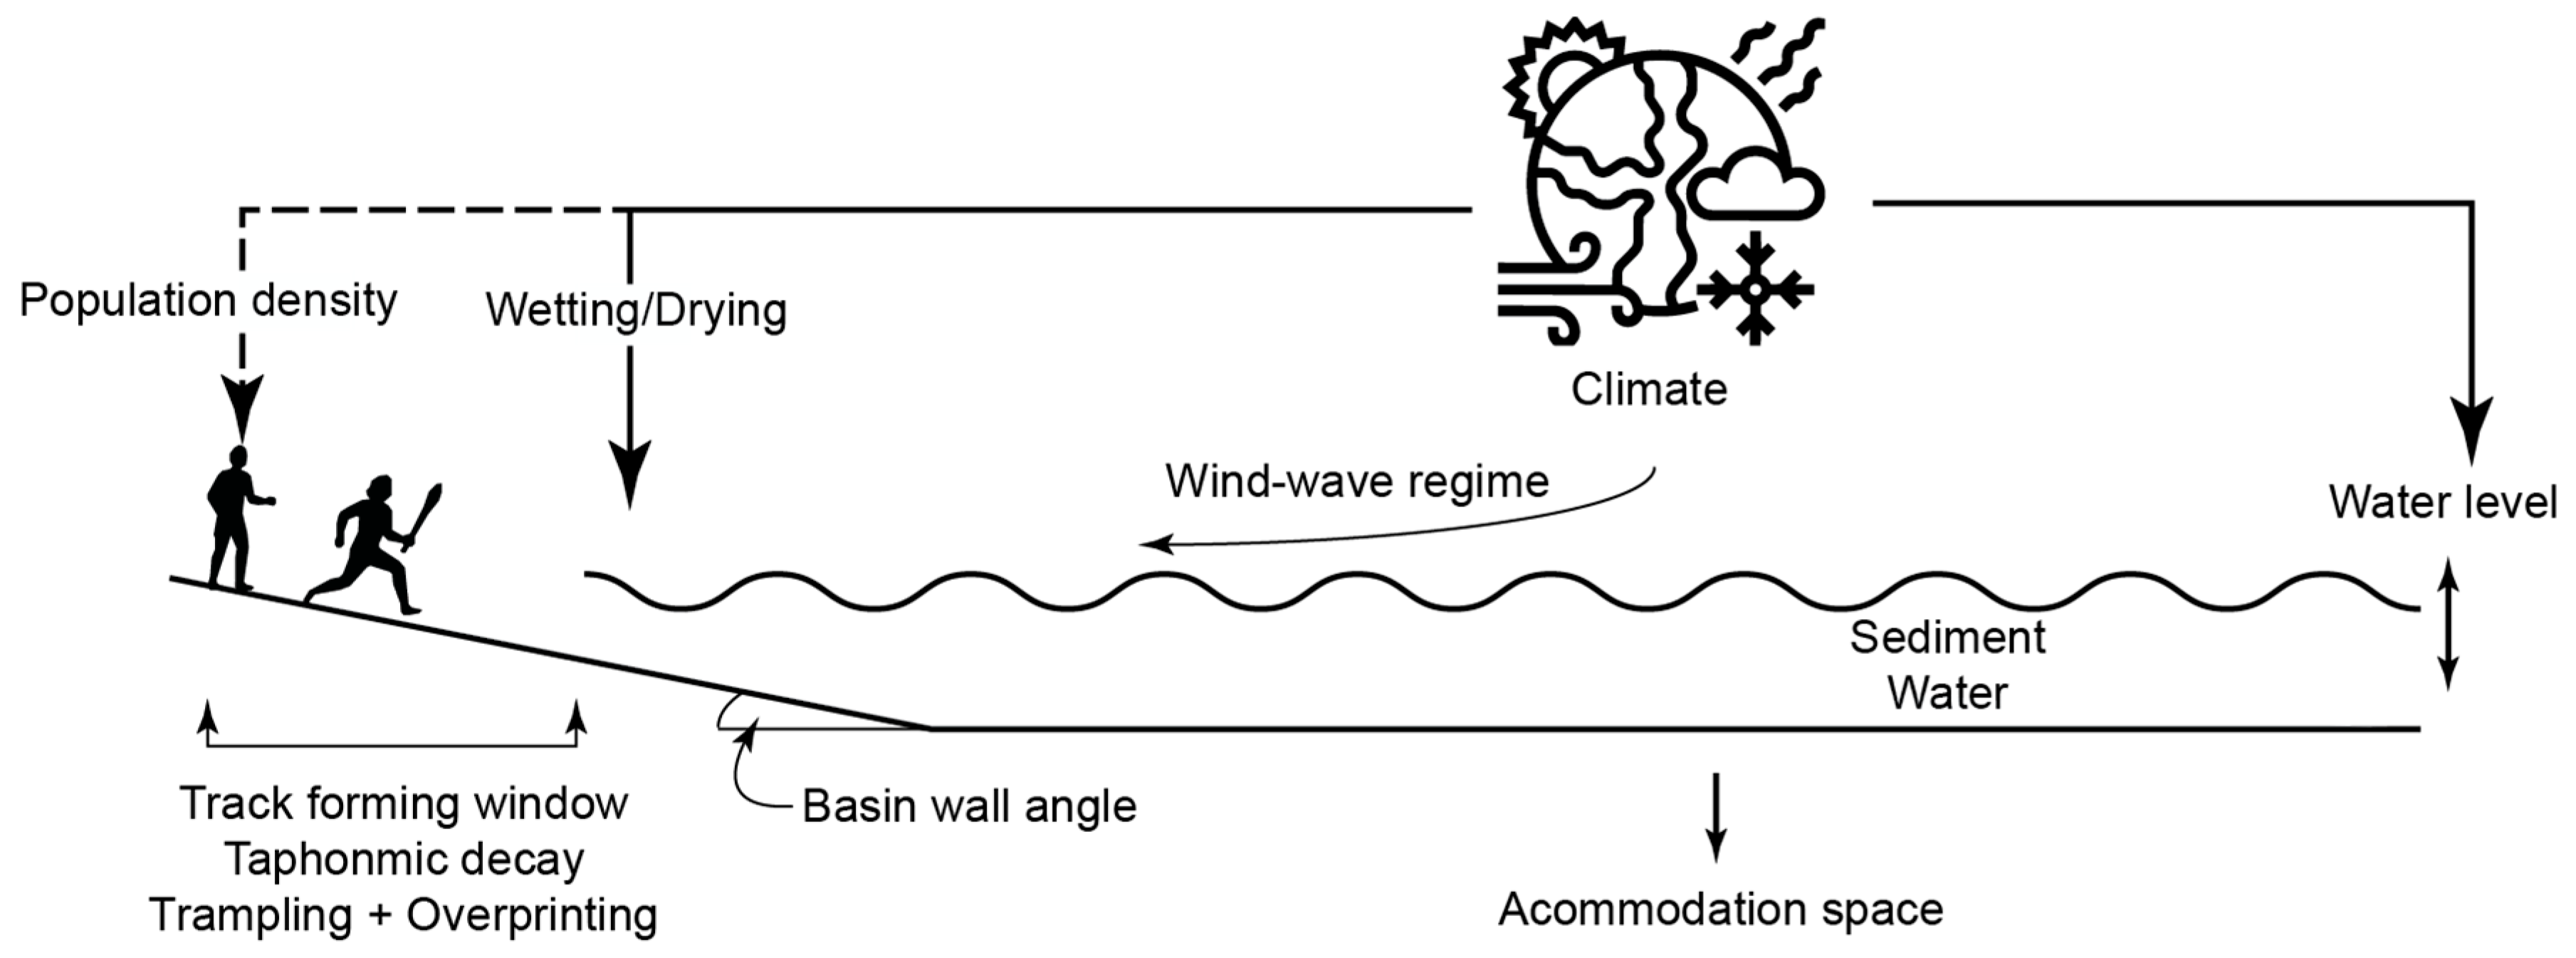
Footprint formation and preservation depend on a set of interacting controls (
Figure 1). Substrates must lie within a “footprint-forming state”, described by Falkingham et al. [
11] as a Goldilocks condition: not too wet and not too dry. For a given body mass, substrate strength must be sufficient to deform under load, but not so weak that individuals flounder, nor so firm or elastic that no impression is retained [
12]. As a result, the ichnological record represents a filtered subset of the original fauna, structured by the interaction between body mass and substrate conditions [
13].
Preservation introduces an additional filter. Footprints typically require both a stabilisation event (e.g., drying, mineral precipitation, or biological binding) and a subsequent burial event, often in rapid succession [
14]. Without stabilisation, prints degrade through slumping, puddling, and erosion [
15]. If stabilised surfaces remain exposed, they are subject to cracking, fragmentation, and overprinting, producing degraded and time-averaged assemblages [
12]. The preserved record therefore reflects not continuous activity, but those moments when environmental conditions permit both footprint formation and preservation.
The generation of multiple footprint horizons further depends on landscape dynamics. In lacustrine and fluvial settings, fluctuations in water level drive cycles of exposure and inundation, creating repeated opportunities for footprint formation and burial. Basin morphology plays a key role: low-gradient margins promote extensive mudflats and large footprint-forming windows, whereas steep margins restrict exposure. Hydrological regime, sediment supply, and surface stability further influence both the formation and survival of tracks.
Within this framework, footprint assemblages arise only when two processes coincide: the presence of track-making individuals and the occurrence of suitable preservation conditions. The fossil record therefore captures moments of intersection between behaviour and environment, rather than a continuous record of activity. Repeated footprint-bearing surfaces may therefore reflect not sustained occupation, but recurring alignment between human presence and preservation windows.
To explore how these interacting processes shape the footprint record, this paper uses an agent-based model (ABM) of footprint formation and preservation around a simplified lake-margin environment. The model is not designed to replicate any specific site, but to investigate the emergent properties of footprint accumulation under controlled environmental forcing and occupation regimes. In particular, it seeks to quantify the temporal structure of footprint-bearing surfaces and to assess what such surfaces can reliably record human activity. This paper asks not simply how footprints are preserved, but what kind of record footprint surfaces actually represent. Specifically, the model asks: (1) how does climate variability structure preservation events; (2) how do basin geometry and footprint decay influence preservation potential; and (3) how does behavioural organisation affect the relationship between human activity and preserved footprint assemblages?
2. Methods
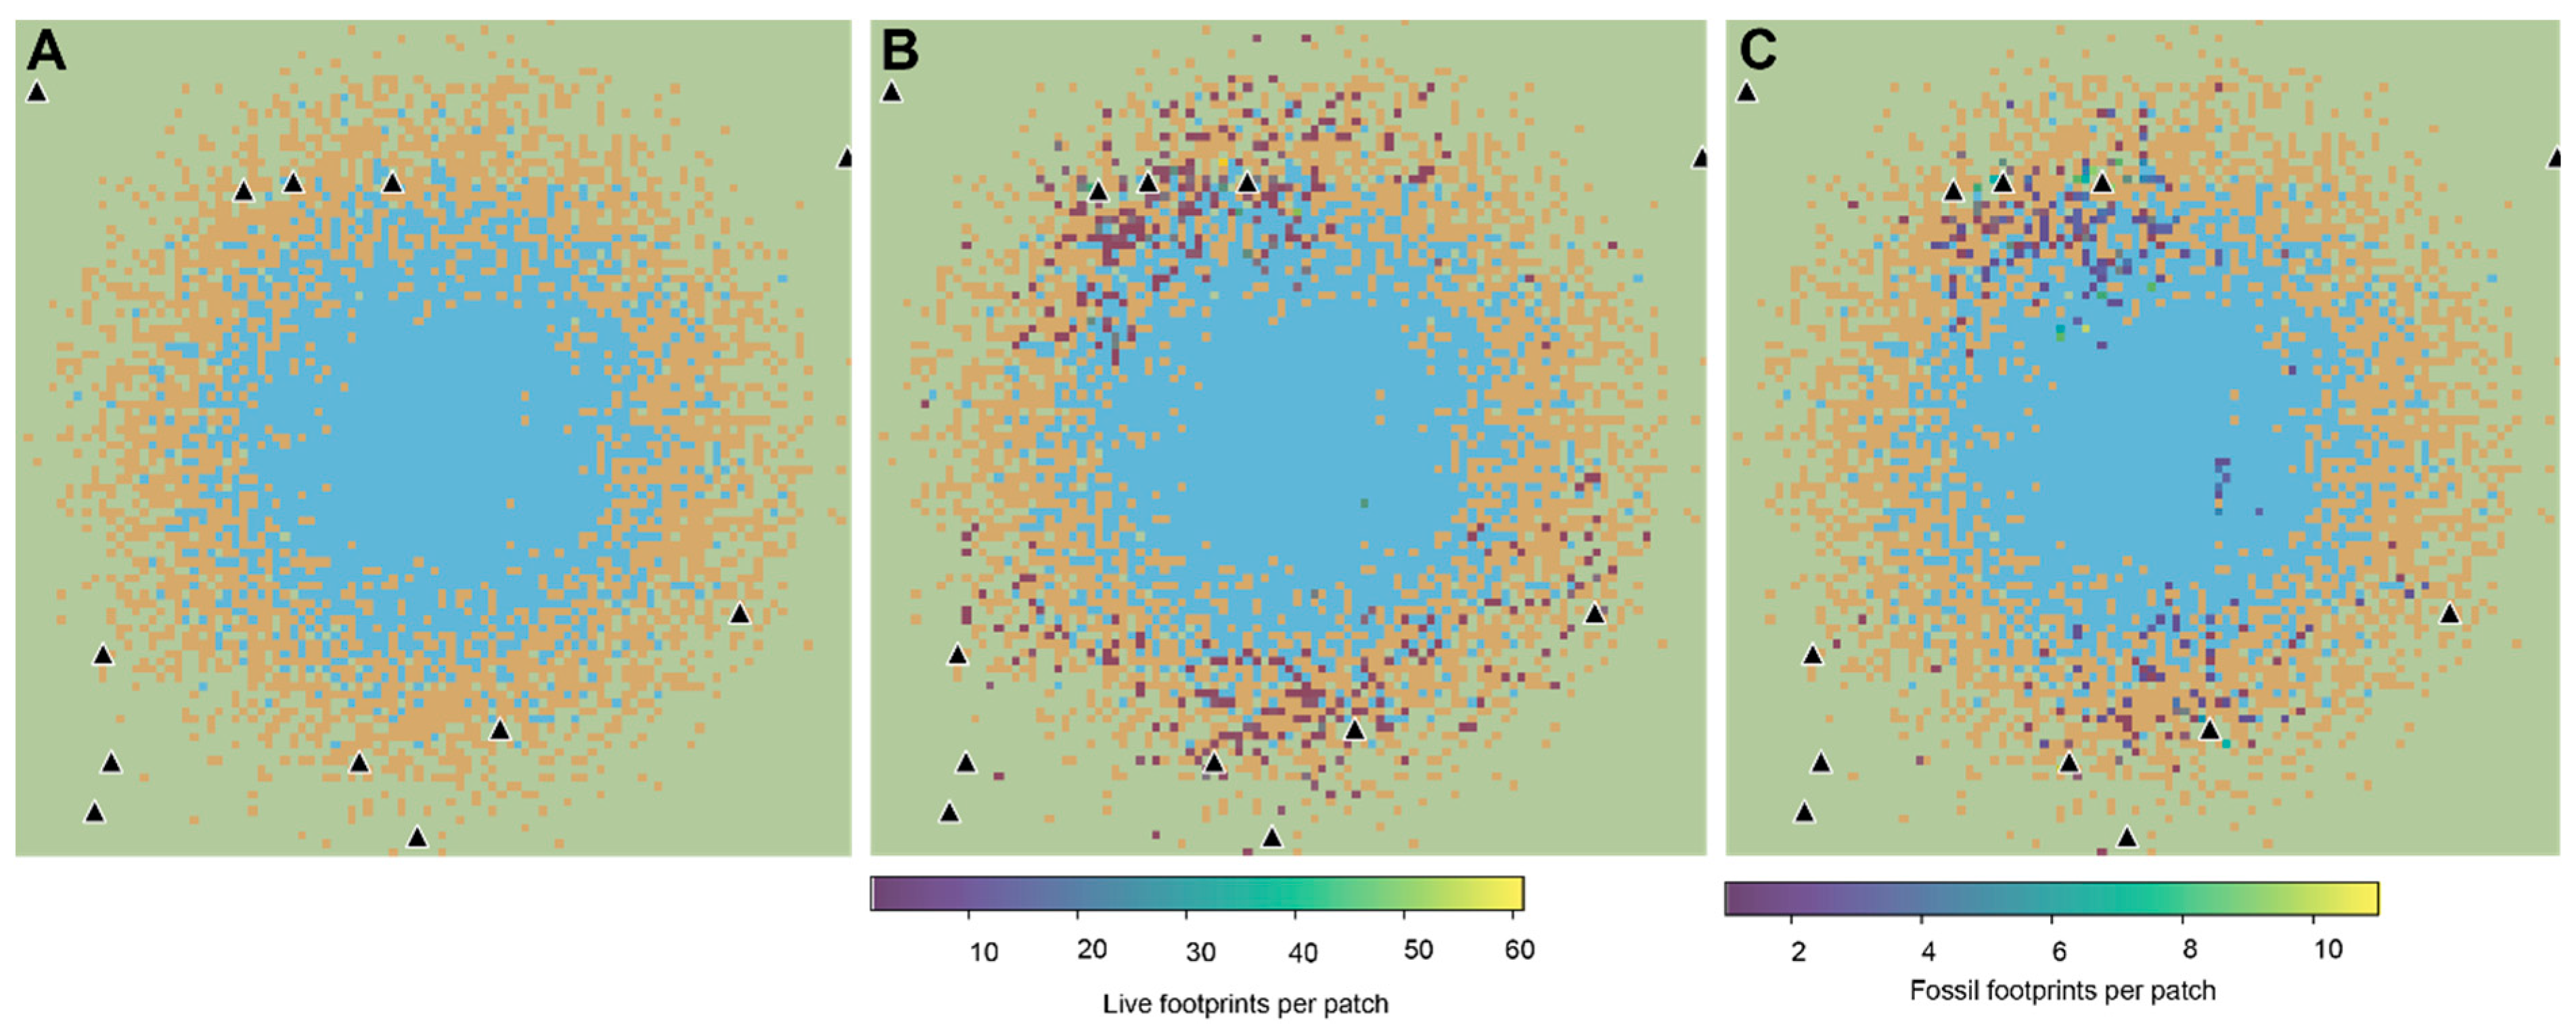
An agent-based model (ABM) was coded in NetLogo (
www.netlogo.org/; version 7.0.4) to simulate the formation, accumulation, and preservation of human footprints on the margins of a shallow lake (
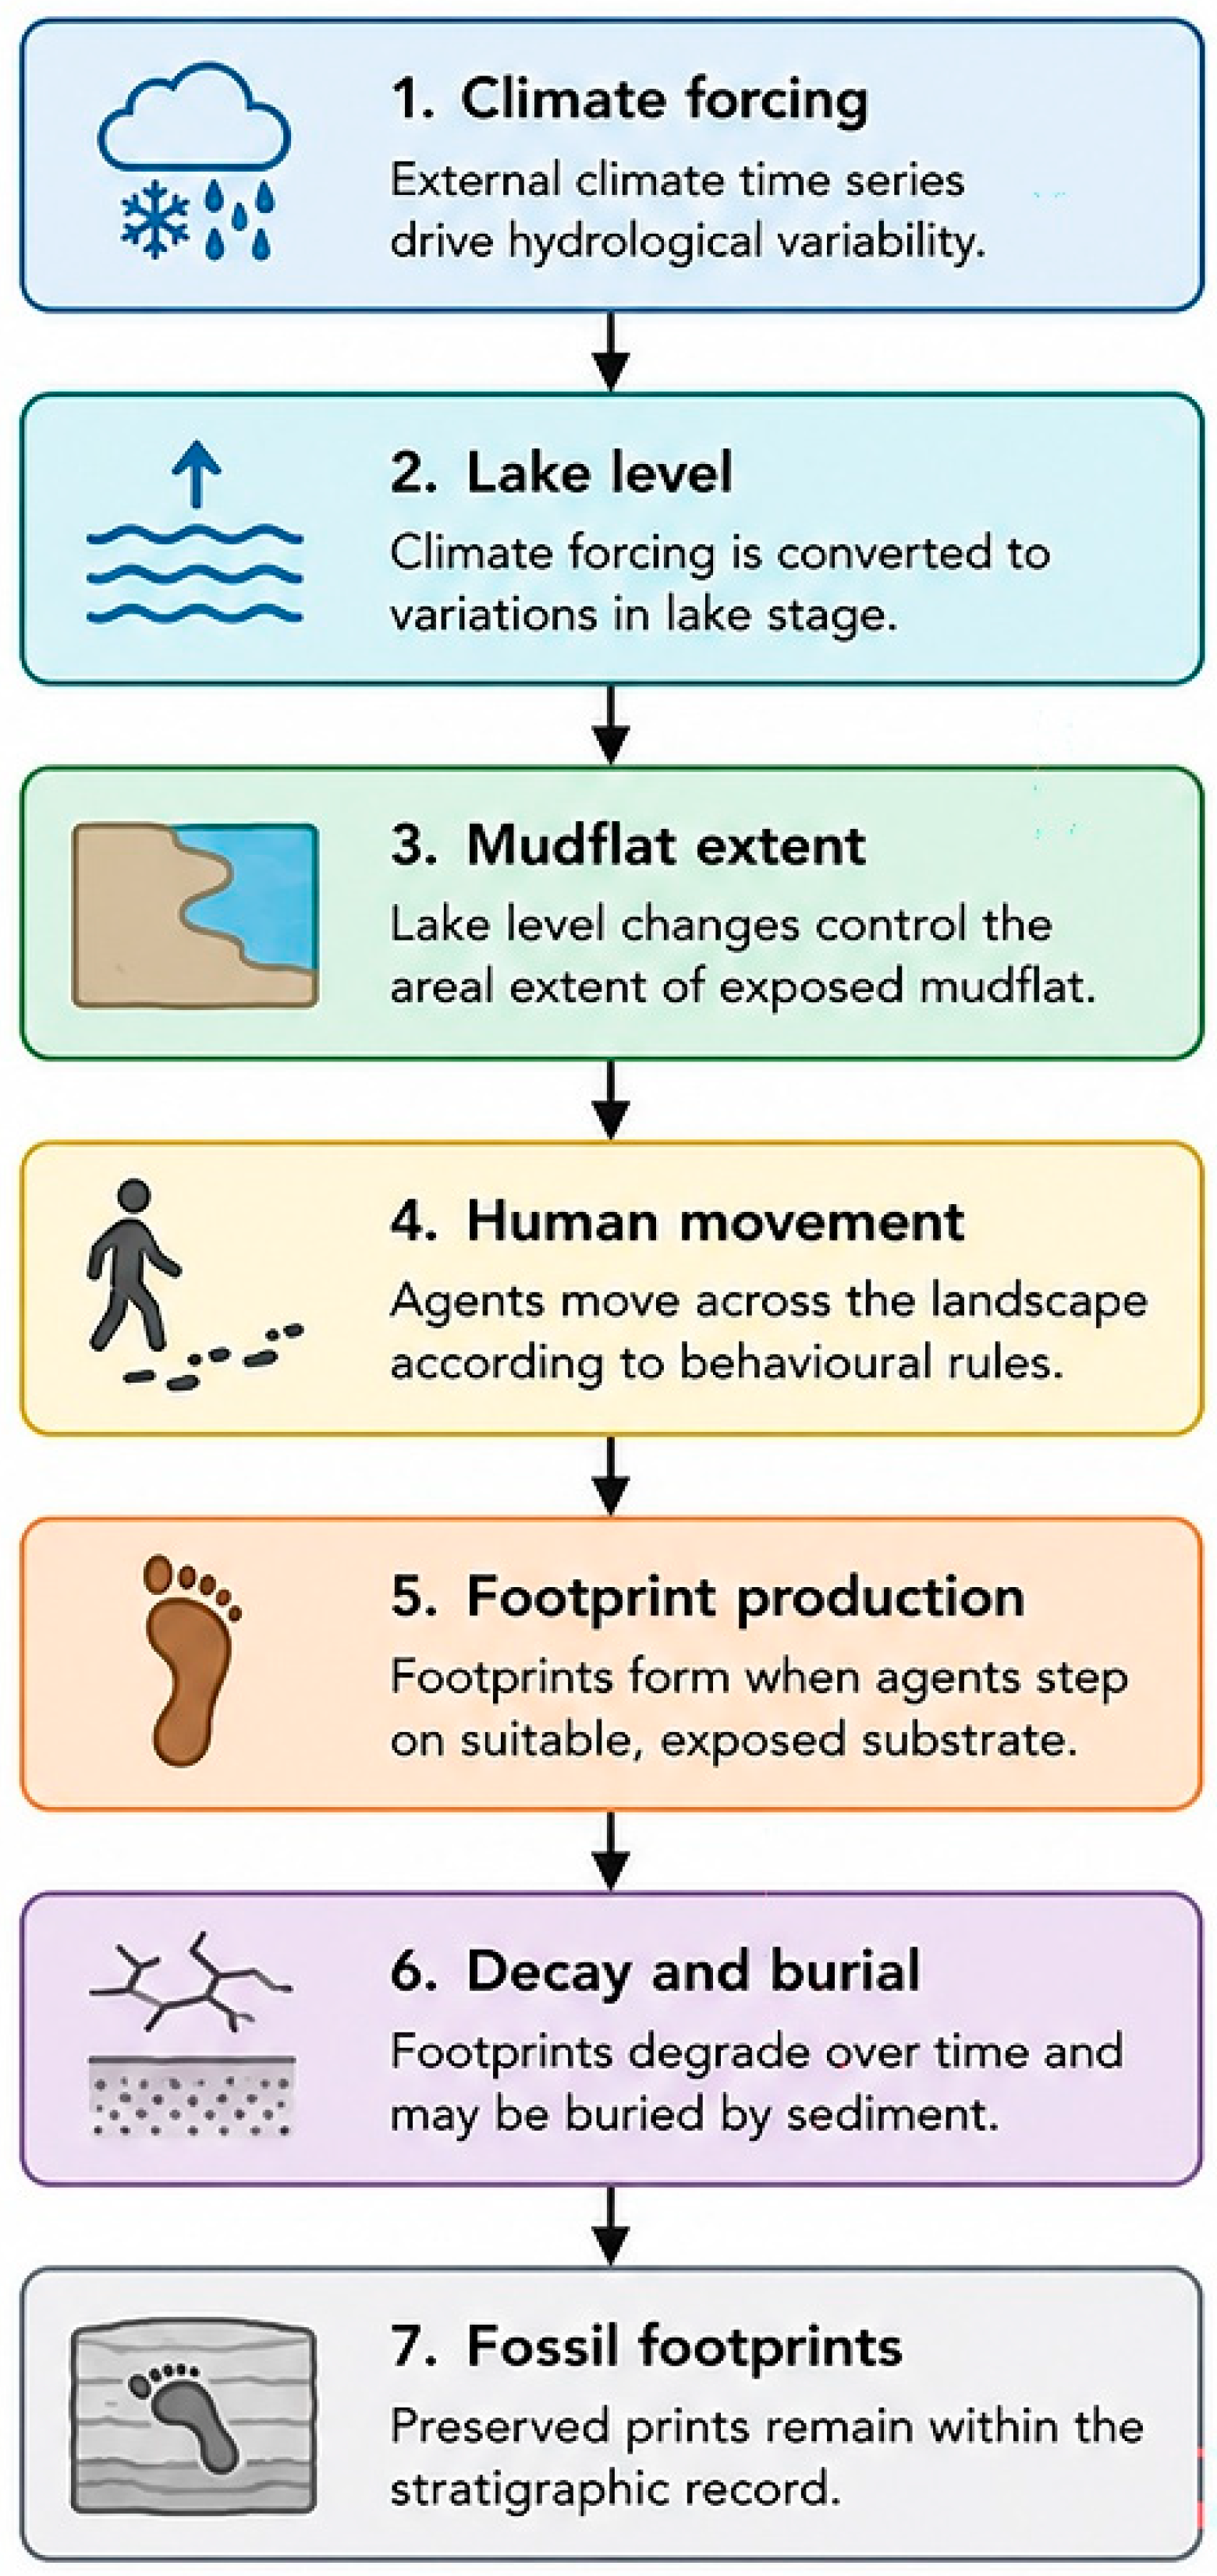
Figure 2). The model represents a simplified landscape in which human agents move across a dynamic substrate that transitions between dry land, mudflat, and water in response to changing hydrological conditions. The primary aim of the model is to explore how environmental forcing and human activity interact to produce footprint-bearing surfaces, how these surfaces repeat through time, and how their temporal structure (diachroneity) varies. The model is intentionally abstract and does not aim to replicate any specific site. The overall logic of the model is illustrated in
Figure 3.
Agent-based models are particularly suited to archaeological and palaeoenvironmental problems because they allow complex system behaviour to emerge from the interaction of relatively simple rules. Rather than attempting to reproduce a specific fossil footprint locality, the present model is intentionally exploratory. Its purpose is to investigate how alternative environmental and behavioural processes combine to generate preservation patterns, and to identify which controls exert the greatest influence on the resulting fossil record. The emphasis is therefore on understanding process and emergent behaviour rather than on producing numerical predictions for any individual site.
2.1. Occupation Regimes
Human presence is implemented using two alternative occupation regimes: continuous and episodic. In the continuous regime, a fixed population is present throughout the simulation, representing sustained occupation of the landscape. Individuals are distributed across randomly placed camps and move continuously, generating footprints whenever environmental conditions permit. This produces a persistent background signal of footprint production.
In contrast, the episodic regime represents intermittent occupation, in which populations enter and leave the landscape in discrete events. At each timestep, when no individuals are present, a new occupation episode may begin with a specified probability. Once initiated, a group of individuals is introduced and remains active for a defined duration, drawn from a mean occupation length with optional stochastic variation, after which all individuals are removed from the system. This produces temporally discrete pulses of human activity separated by periods of absence.
The two regimes therefore differ fundamentally in the temporal structure of footprint production: continuous occupation provides a persistent supply of footprints, whereas episodic occupation restricts footprint formation to short-lived windows.
2.2. Climate Forcing and Hydrological Response
The model employs a hierarchy of climate forcing functions that increase progressively in environmental realism while retaining the same underlying hydrological framework. The objective is not to determine which climate reconstruction is “correct”, but to explore how different temporal structures of environmental variability influence footprint preservation. This approach follows a common strategy in exploratory modelling, whereby simple forcing functions are first used to understand system behaviour before progressively introducing greater environmental complexity.
The simplest forcing is a single sinusoidal oscillation, which provides a highly regular and predictable sequence of wetting and drying events. This serves as a reference model against which more complex forcing regimes can be compared, allowing the effects of periodic environmental change to be isolated from those arising from irregular climatic variability.
A second forcing combines several sinusoidal components operating at different temporal scales. This multiscale forcing introduces nested variability resembling the hierarchical structure observed in many natural climate systems, where long-term trends are superimposed with shorter-period fluctuations. Although synthetic, it generates complex environmental trajectories that allow exploration of emergent preservation dynamics without relying on any particular palaeoclimate record.
The remaining forcing functions are derived from palaeoenvironmental archives. The Greenland ice-core record provides an externally forced climatic signal representing large-scale changes in Northern Hemisphere climate. By contrast, the Estancia Basin Hydrologic Balance Index represents the hydrological response of an individual closed basin to climatic forcing and therefore provides a more direct analogue for the lake-margin environments in which many fossil footprint sites occur. Finally, the Bonneville forcing represents a conceptualised threshold response in which basin hydrology responds to climatic variability in a delayed, damped and non-linear manner. Together these three forcings span a continuum from external climate forcing, through regional hydrological response, to complex basin-scale behaviour. Comparing them allows us to evaluate how different styles of environmental variability influence the structure of the fossil footprint record independently of any single site or climatic reconstruction.
To be clear, a model tick represents an abstract unit of simulation time rather than a fixed chronological interval. External climate series are resampled to this internal timescale using the climate-step parameter.
Hydrological conditions are driven by a time-varying wetness signal, which controls lake level, the expansion and contraction of mudflat area, and footprint preservation. The aim is not to reproduce specific palaeo-climate histories, but to explore how different temporal structures of environmental variability influence preservation dynamics.
Several forcing modes are implemented, including sinusoidal, multiscale, and three externally derived climate series. The multiscale forcing is constructed as a composite signal combining sinusoidal components operating at different temporal scales. A dominant long-period oscillation represents broad climatic trends, while higher-frequency components are superimposed with varying amplitudes and phase offsets to generate nested variability. This composite signal is further modulated by a slowly varying envelope, producing a structured but non-repeating trajectory that captures both periodicity and emergent complexity.
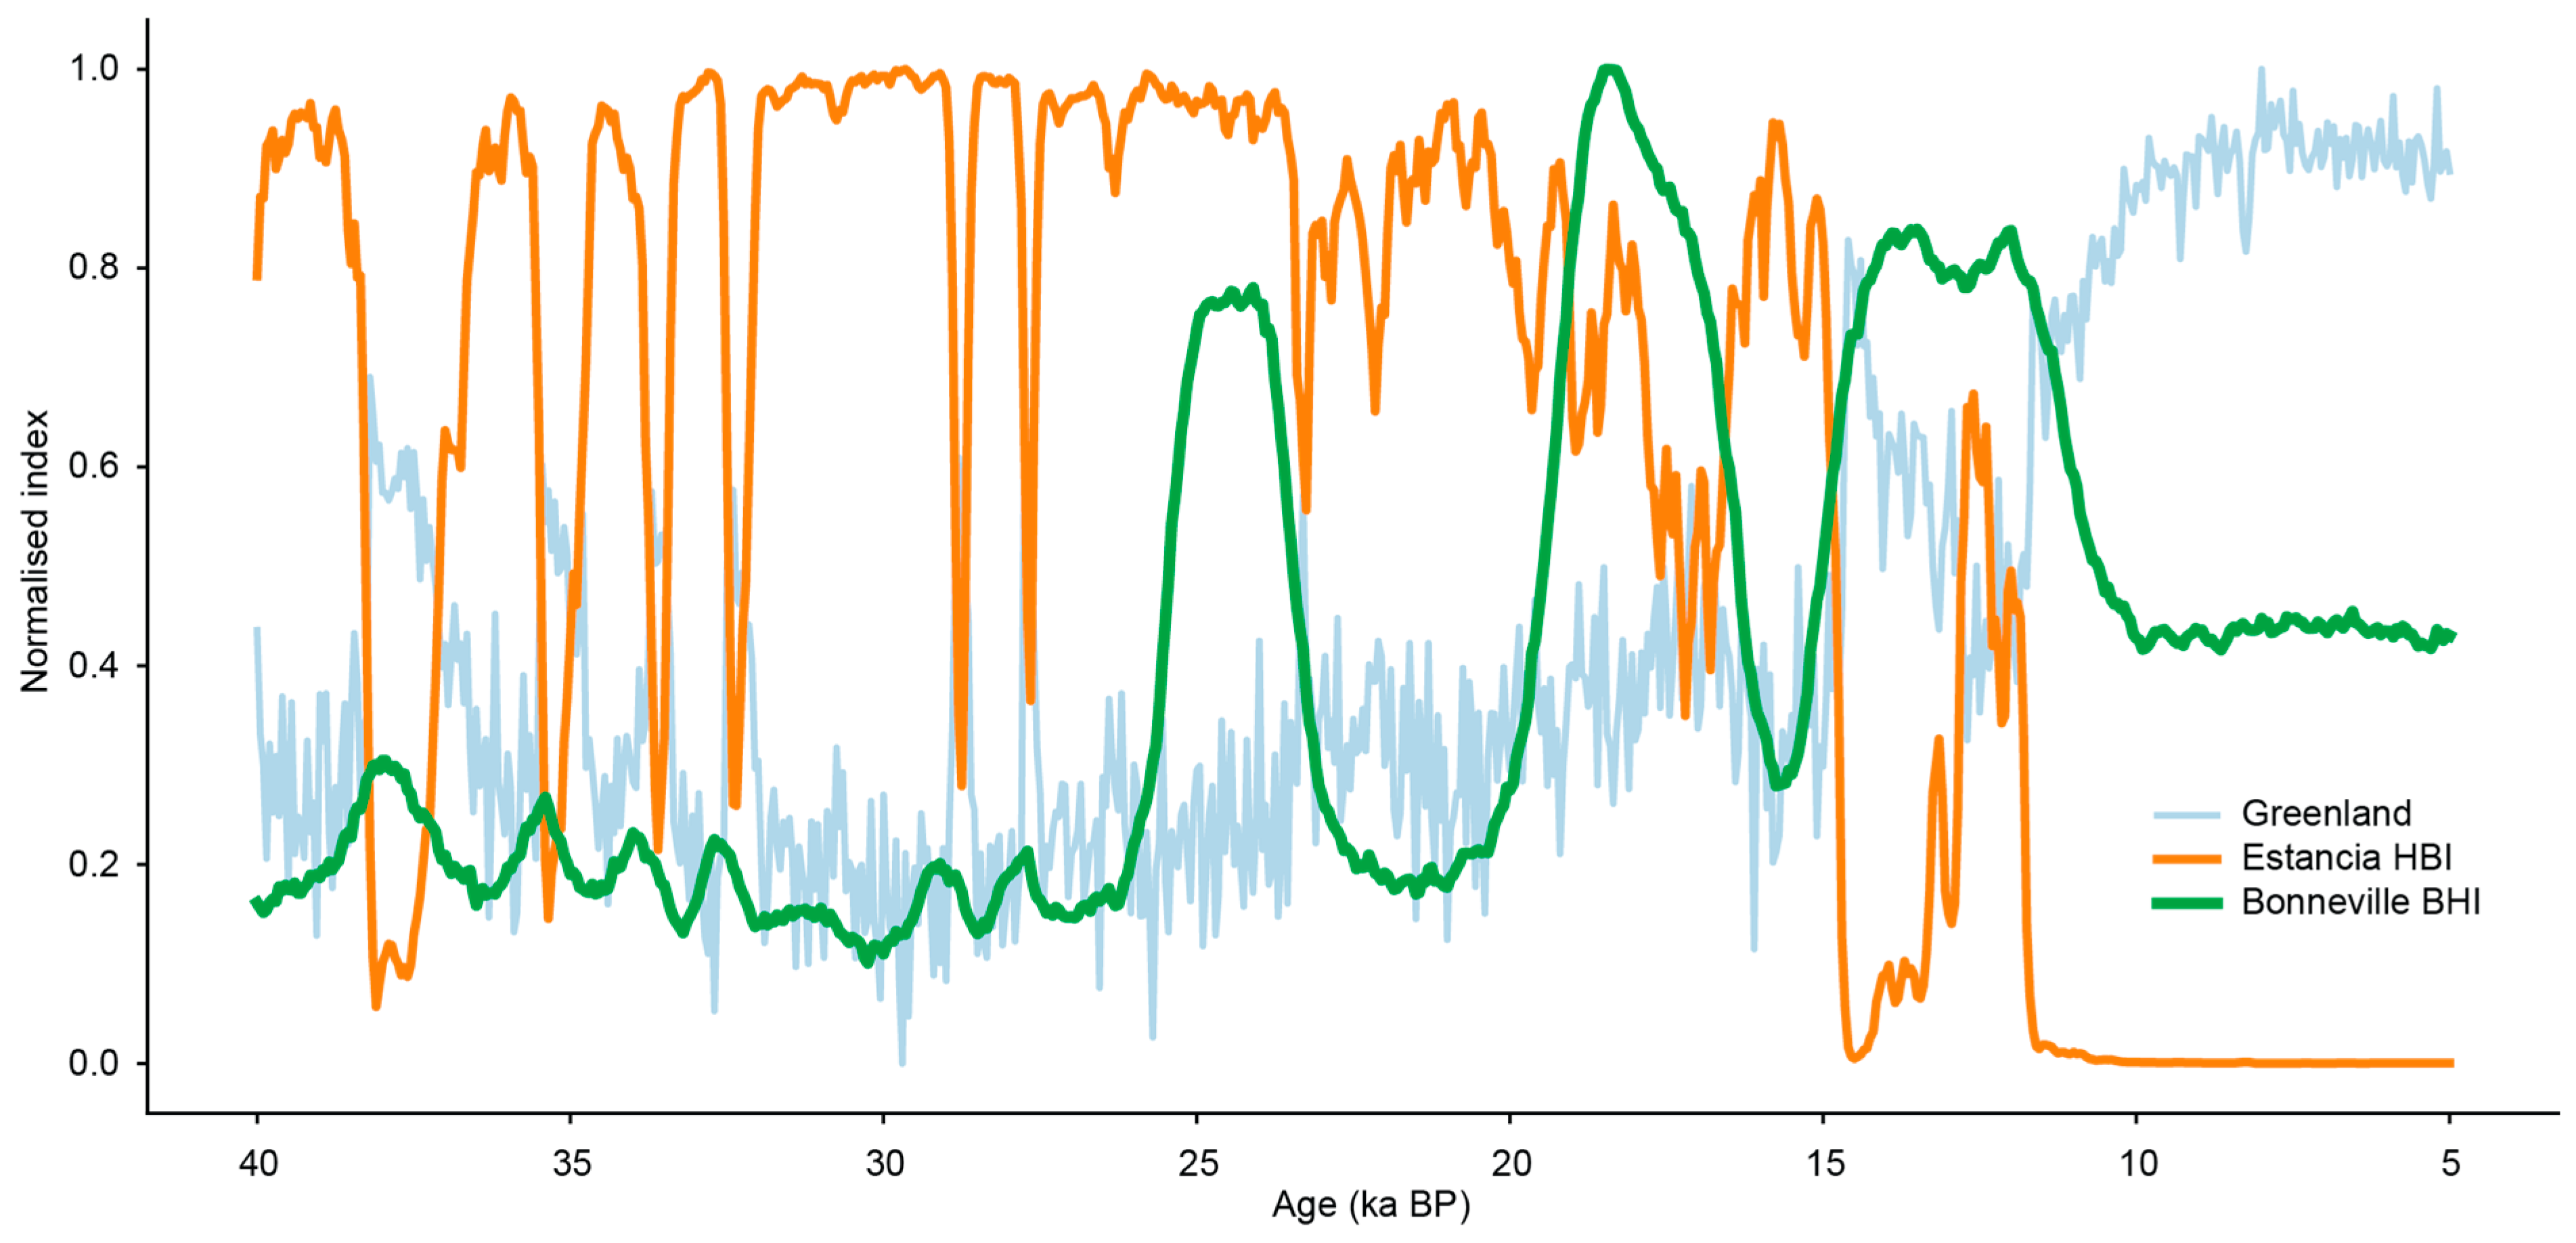
Three externally derived climate forcings are also used to represent different levels of irregularity in the climate system. The first is derived from a section (40 k to 5 k BP) of the Greenland ice-core δ
18O record (GICC05; [
16]). This is transformed via an inverted function to approximate progressive aridification during the terminal Pleistocene and early Holocene in parts of the North American Southwest (e.g., [
17,
18,
19]). The second forcing is based on the Estancia Basin (New Mexico), where a Hydrologic Balance Index (HBI) was reconstructed by Menking et al. [
20] from sedimentological and mineralogical data. This series is normalised to a 0 to 1 wetness scale and smoothed using a centred five-point rolling mean prior to use.
The third forcing represents a conceptualised Bonneville-style hydroclimate response. Rather than using a direct proxy input, this is implemented as a smoothed, lagged, and partially transformed response to the Greenland signal, incorporating damping, phase shifts, and threshold behaviour. This reflects the integrative behaviour of large, closed basins, where hydrological responses are non-linear and may be decoupled from high-frequency climate variability. Sediment core records demonstrate that Bonneville hydrology varies on centennial to millennial timescales and is linked to Dansgaard–Oeschger events and Heinrich event variability, but with a non-linear and sometimes phase-shifted response [
21,
22]. In particular, wet phases occur during some interstadials, while dry intervals are associated with Heinrich events, and the Younger Dryas corresponds to renewed lake expansion [
23]. Major hydrological transitions—including the Stansbury oscillations (~25–24 ka), the Bonneville highstand and spillover (~18.5 ka), and subsequent Provo and Gilbert phases—indicate threshold behaviour within the basin [
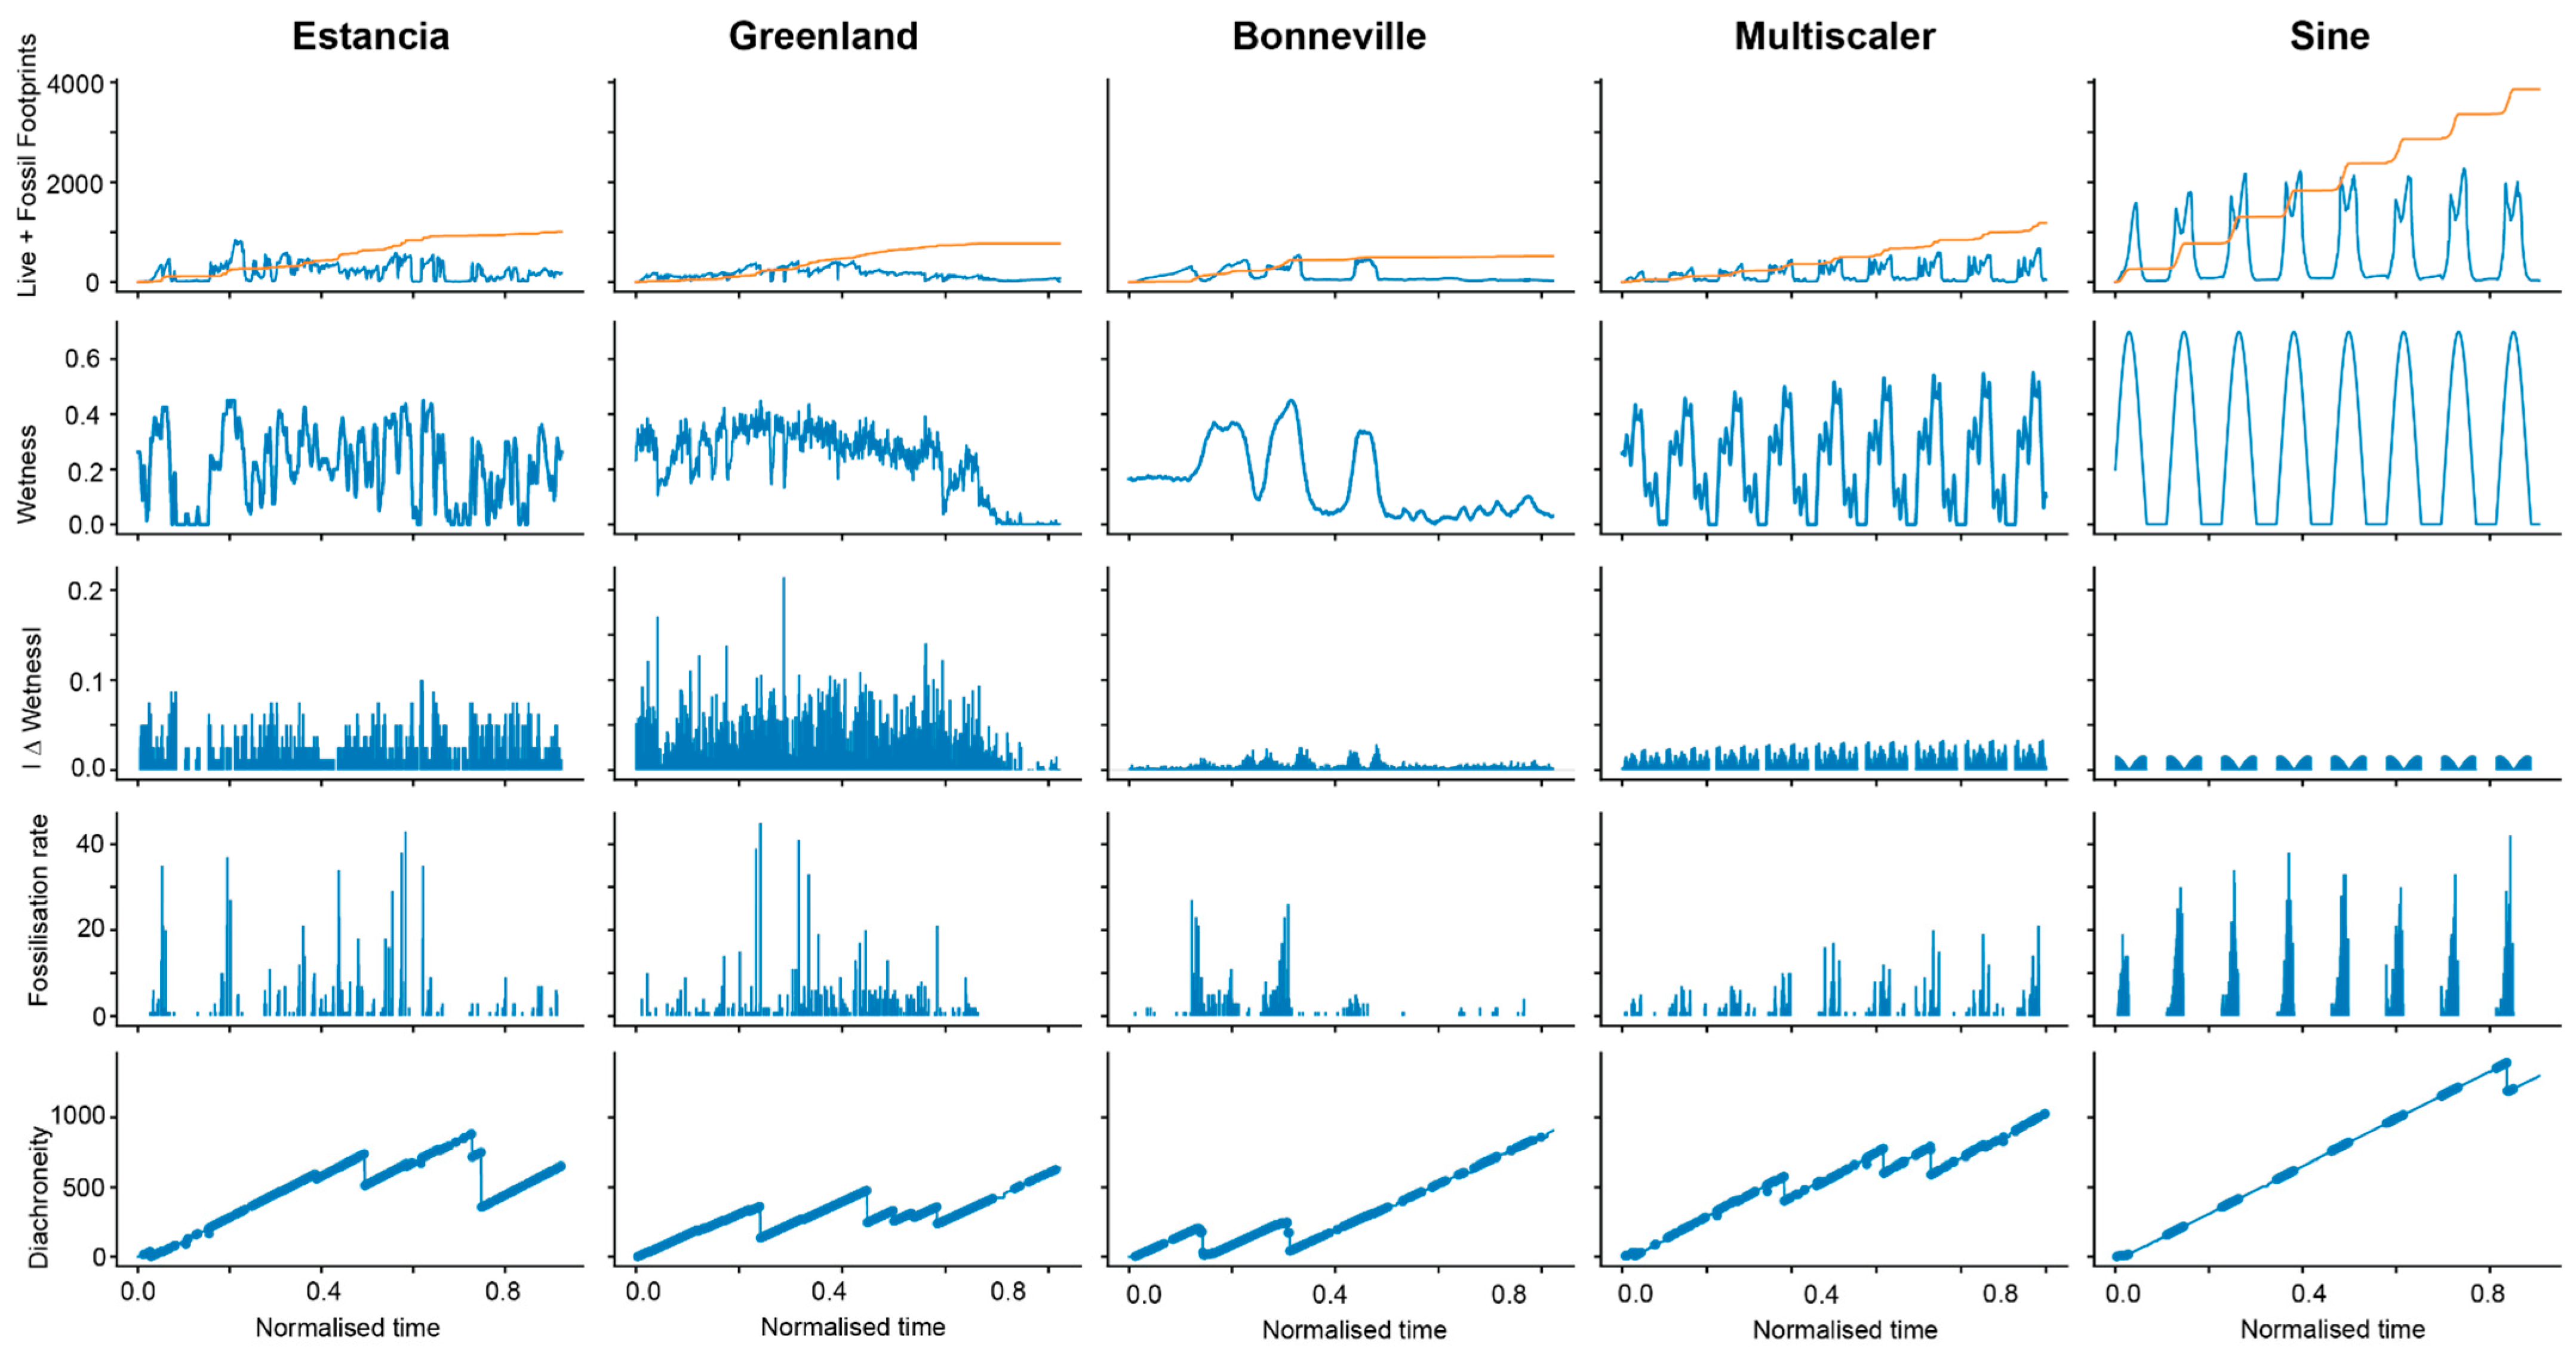
24]. Accordingly, the model represents Bonneville forcing as a smoothed, lagged, and partially inverted transformation of Greenland variability, with additional thresholding and event-scale perturbations to capture observed non-linearity in lake-level dynamics. We do not claim that this accurately represents the hydrological balance of the Bonneville system but it has elements of that system incorporated within it. The three externally derived climate forcings are illustrated in
Figure 4.
All climate series are rescaled within the model using the mean-water-level and climate-amplitude parameters. Changes in wetness produce lake transgression during wetting phases and regression during drying phases. An optional hysteresis term allows asymmetry between wetting and drying responses, typically producing rapid flooding and slower exposure of mudflats.
2.3. Footprint Production, Preservation and Sampling
Footprints are generated when agents traverse patches classified as receptive mudflat. Each footprint is recorded at the patch level with a birth time (tick), and is associated with both an individual ID and a trackway ID. This allows reconstruction of footprint age distributions, trackway counts, and the number of individuals represented on any given surface.
Footprints are subject to degradation through time. On exposed mudflats, footprints may be removed probabilistically, and older surfaces progressively lose earlier prints. This simulates erosion, desiccation, and surface disturbance. Overprinting arises as agents repeatedly traverse the same surfaces, producing palimpsests of overlapping trackways and time-averaged assemblages. Footprint preservation occurs when previously exposed mudflat containing live footprints is inundated by rising water levels (i.e., transition from mudflat to lake). At this point, a proportion of footprints on an inundated patch are converted to fossil footprints, and the live surface is reset (footprints cleared). Each preserved surface therefore represents a discrete sampling event of the active landscape immediately prior to burial. Immediately prior to reset, the model records the state of the surface, including the youngest footprint age, maximum footprint age, mean footprint age, number of trackways, and the number of individuals represented. Surface diachroneity is defined as the temporal range of footprints present on a surface (maximum age–minimum age) and is used as a measure of temporal mixing within footprint assemblages.
2.4. Model Outputs
The model records the system state at each timestep, including the total live footprints, fossilisation rate, mudflat area, and hydrological state. At preservation events, additional variables are recorded, including surface diachroneity, footprint age distribution metrics, and trackway and individual counts. These outputs are exported as time series and analysed externally. A full list of model variables is provided in
Table 1. Output data are extracted from model runs using a series of Python (version 3.11) scripts.
To quantify the conditions under which preservation occurs, an empirical preservation probability surface is derived in state space. For each simulation, the time series is partitioned into bins defined by (i) wetting pulse magnitude (the positive change in surface wetness between successive timesteps), and (ii) footprint availability (the number of visible footprints at each timestep).
Within each bin, preservation probability is calculated as:
where
is the number of timesteps associated with a positive fossilisation increment, and
is the total number of timesteps within that bin.
Bins with low sample counts are excluded to reduce noise, and the resulting probability surface is smoothed using a Gaussian filter. From this surface, summary metrics are derived, including peak preservation probability and surface “sharpness” (defined as the ratio of peak to mean probability), providing a quantitative measure of how strongly preservation is concentrated within particular regions of environmental state space.
Model outputs are analysed in terms of (i) the temporal clustering of preservation events, (ii) surface diachroneity, and (iii) the relationship between footprint availability and preservation probability. These metrics are used to evaluate how different occupation regimes and climate forcings shape the structure, timing, and interpretability of the fossil footprint record.
2.5. Model Abstraction and Parameterisation
The parameter values listed in
Table 1 should not be interpreted as estimates of conditions at any particular palaeolake. Instead, they represent plausible values chosen to explore the behaviour of the coupled behavioural–environmental system over a broad region of parameter space. Baseline values provide a stable reference configuration, while the suggested ranges define the intervals explored during parameter sweeps. The objective is therefore not calibration, but sensitivity analysis: identifying how preservation responds to changes in climate forcing, basin morphology, taphonomic persistence and behavioural organisation. This approach follows common practice in exploratory agent-based modelling, where understanding system behaviour is often more informative than reproducing a single observed dataset.
The present model should therefore be viewed as a conceptual process model rather than a predictive reconstruction of any specific footprint site. Its value lies in identifying emergent relationships and testing hypotheses regarding preservation dynamics rather than reproducing observed stratigraphic sequences.
3. Results
3.1. Climate Drivers
Comparison of the climate forcing regimes demonstrates that preservation dynamics are highly sensitive to the temporal structure of environmental variability (
Figure 5). Stochastic forcing, represented here by the Estancia sequence, produces irregular, high-magnitude preservation pulses that are distributed unevenly through time. In contrast, periodic forcing generates predictable, phase-locked fossilisation events closely tied to the underlying oscillation. Multiscale variability produces a more continuous but still highly structured preservation regime, reflecting the interaction of multiple temporal frequencies operating simultaneously.
The Greenland-derived forcing behaves differently. When mapped inversely to basin wetness, preservation becomes concentrated around hydrological transitions, particularly during shifts towards drier conditions. Preservation therefore emerges not directly from climate state itself, but from the interaction between climate-driven lake-level change, substrate exposure, and the temporal availability of track-bearing surfaces. This demonstrates that externally derived climate records cannot be treated as direct hydrological proxies without considering the local geomorphic translation of climate into preservation opportunity.
Across all forcing regimes, preservation occurs only when wetting pulses coincide with sufficient footprint availability; assemblages therefore emerge through the coincidence of behavioural activity and environmental opportunity. However, the structure of this coincidence varies markedly between forcing systems.
Figure 5 shows that some regimes generate frequent but comparatively modest preservation episodes, whereas others produce fewer but disproportionately important fossilisation events.
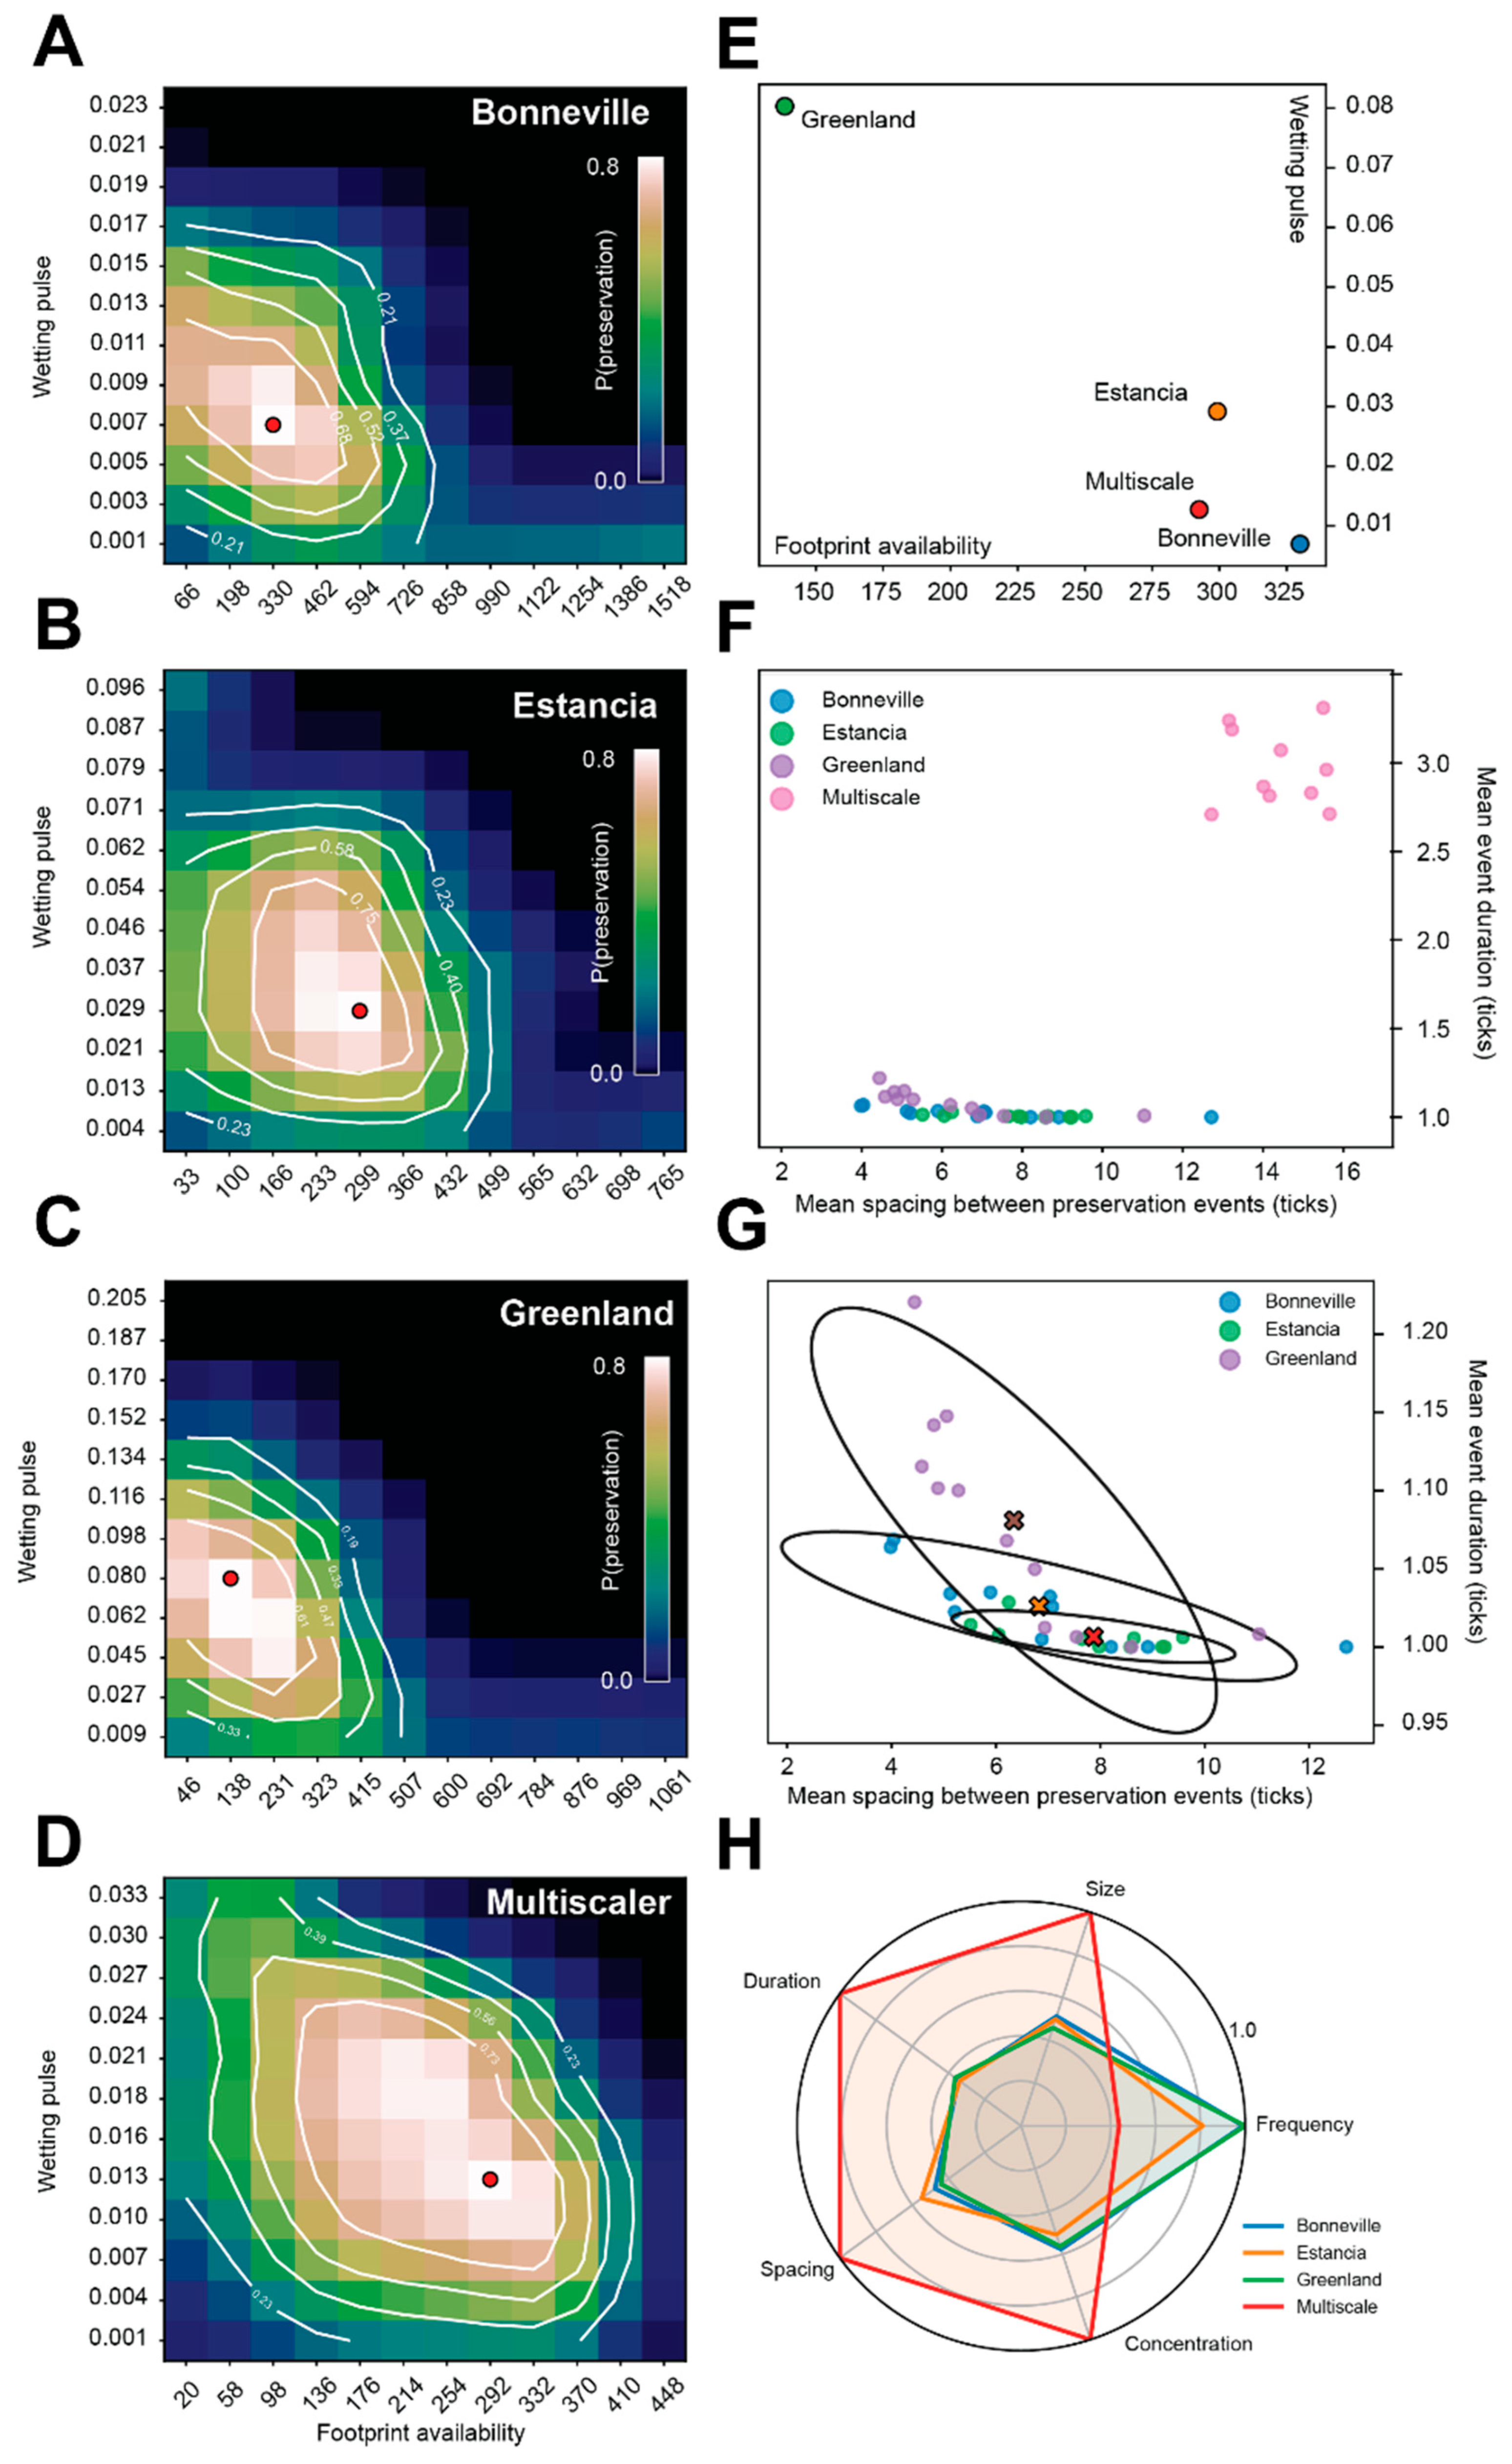
To quantify this relationship, preservation probability was evaluated within environmental–behavioural state space (
Figure 6). Repeated simulations produce distinct probability surfaces for each forcing regime (
Figure 6A–D;
Table 2), demonstrating that different climate structures favour different combinations of wetting intensity and footprint availability. The optimum preservation conditions, indicated by the red maxima, shift systematically between forcing regimes. Greenland forcing achieves maximum preservation during strong wetting transitions combined with relatively low footprint availability, indicating that preservation is concentrated within short-lived hydrological windows. In contrast, the multiscale forcing regime favours preservation under moderate wetting pulses combined with high footprint availability, producing larger and longer-lasting preservation events.
These differences are reflected in the event statistics (
Table 2;
Figure 6H). Multiscale forcing produces substantially fewer preservation events overall (mean = 113), but these events are considerably larger (mean event size = 10.75) and longer in duration (mean duration = 2.97 ticks) than in the externally derived forcing regimes. Preservation is also much more concentrated within a limited number of events under multiscale forcing, as indicated by both the high top-5 contribution (32.0%) and elevated Gini coefficient (0.69). In contrast, Bonneville, Estancia, and Greenland forcing produce more numerous but smaller events, with lower preservation inequality (Gini ≈ 0.53–0.57), indicating a more distributed preservation structure through time.
Event spacing also differs systematically between forcing regimes. Bonneville forcing exhibits the highest coefficient of variation in event spacing (CV = 1.95), indicating highly irregular clustering of preservation episodes. By comparison, Greenland and multiscale forcing produce more temporally organised event spacing (CV ≈ 1.2), suggesting stronger structural control on preservation timing. These differences demonstrate that climate variability controls not simply the quantity of preservation, but the temporal architecture through which fossil assemblages accumulate.
These results show that footprint preservation is not simply a function of wetness, but emerges from the timing, frequency, and organisation of environmental change. Different climatic regimes therefore generate systematically different preservation signatures, even under comparable mean environmental conditions. This has important implications for interpreting fossil footprint assemblages, because assemblage structure may reflect climatic forcing architecture as much as behavioural activity itself.
In all subsequent simulations, the Estancia forcing is used as the primary climate driver, as it most closely approximates the behaviour of the modelled lake–mudflat–hinterland system.
3.2. Landscape-Taphonomy
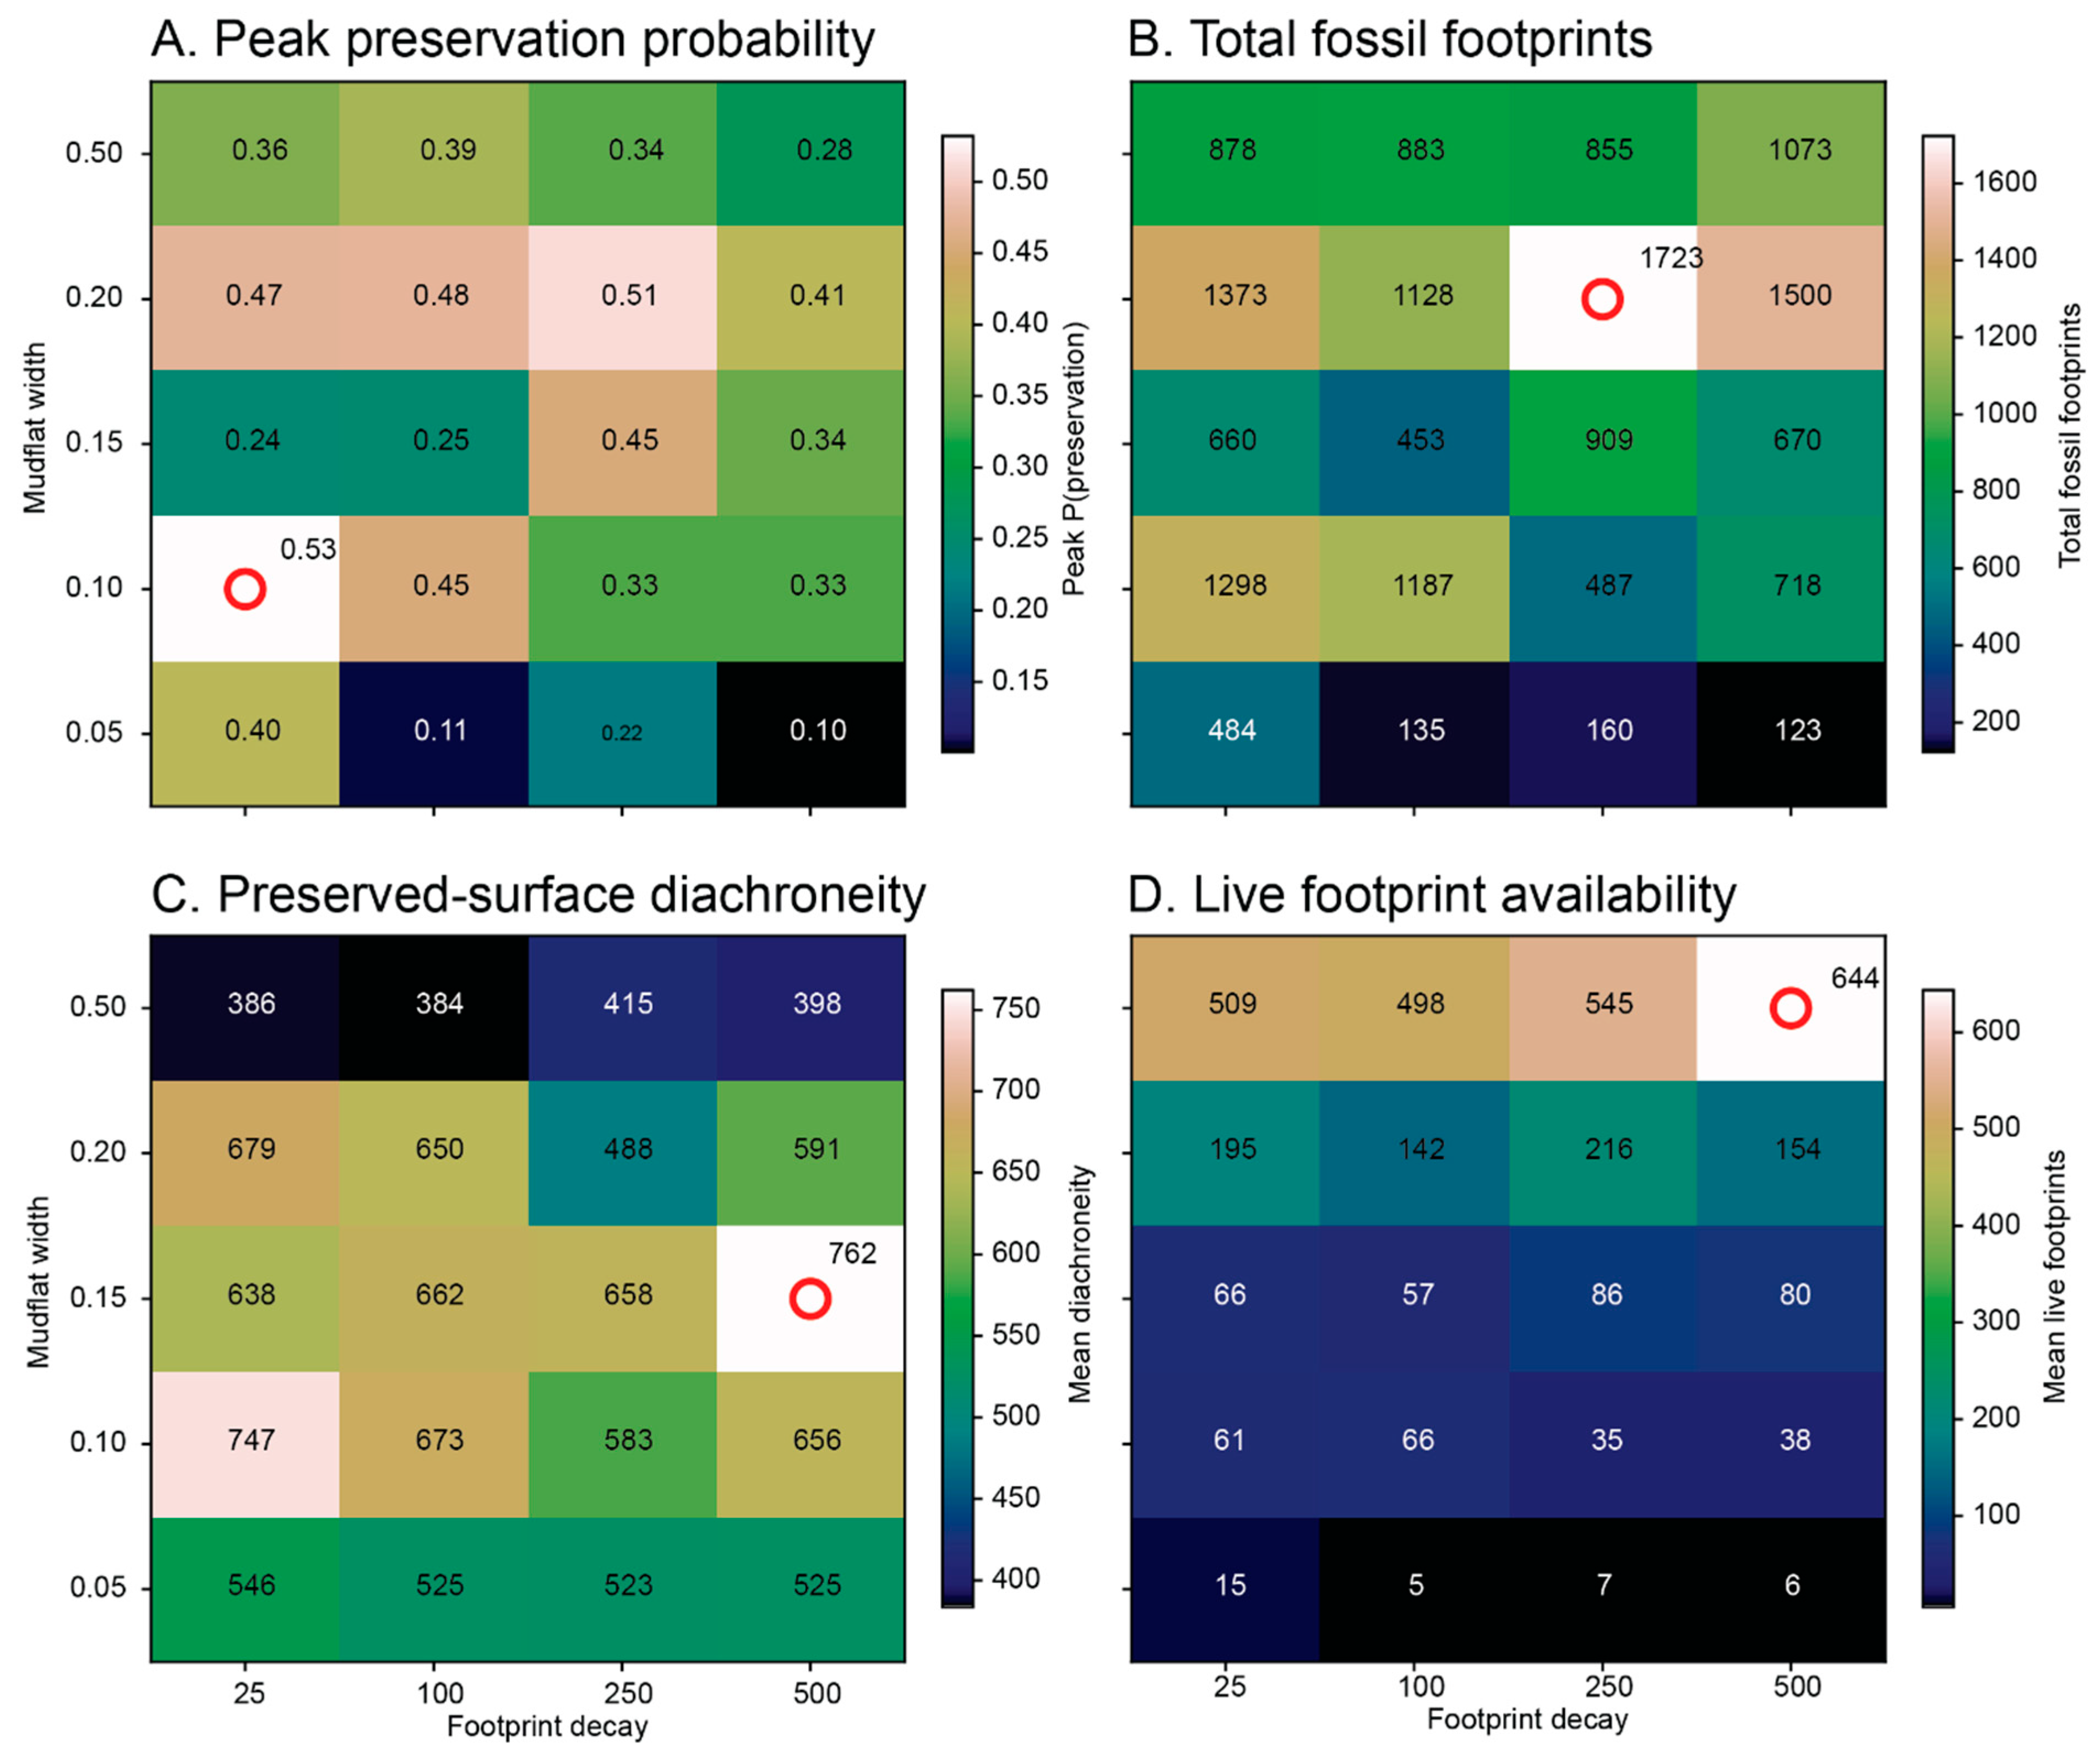
A sweep of model runs was undertaken to explore the influence of landscape geometry and taphonomic persistence on fossil footprint preservation. The results reveal a strongly non-linear relationship between mudflat extent, footprint persistence, and preservation dynamics (
Figure 7). Preservation does not increase monotonically with either substrate area or footprint abundance; instead, distinct preservation regimes emerge across the landscape–taphonomy phase space.
Narrow mudflats (0.05) are strongly supply-limited, generating low live-footprint densities and correspondingly low total fossil yields. Although some runs exhibit locally high preservation probabilities, these arise from sparse and highly concentrated preservation events rather than sustained preservation conditions. In contrast, very wide mudflats (0.50) produce abundant live footprints but comparatively diffuse preservation signals, characterised by reduced peak preservation probability and lower preserved-surface diachroneity. Under these conditions, footprints accumulate continuously across broad exposed surfaces, weakening the temporal distinctness of individual preservation episodes.
The strongest preservation signal occurs at intermediate mudflat widths (0.10–0.20), where footprint availability and hydrological transitions are optimally aligned. These simulations produce the highest combination of preservation probability, fossil yield, and preserved-surface diachroneity (
Figure 7A–C). This defines a clear preservation zone in which behavioural activity and environmental forcing remain sufficiently coupled to generate discrete but information-rich preservation events. Importantly, maximum preservation does not occur where footprint production is greatest, but where exposure, substrate turnover, and footprint availability remain dynamically balanced.
Footprint decay (taphonomic decay) acts as a secondary temporal filter that regulates the persistence and mixing of track-bearing surfaces. Low decay values increase footprint retention and promote long-lived surfaces, but also enhance temporal averaging and reduce the separation between preservation events. Conversely, high decay values rapidly remove footprints from the active system, suppressing preservation opportunity and reducing fossil accumulation. Intermediate decay rates maximise both fossil yield and event structure, producing assemblages with elevated preservation probability while maintaining measurable diachroneity between preserved surfaces.
The interaction between mudflat width and decay therefore controls not only the quantity of preserved footprints, but also the temporal architecture of assemblage formation. Some parameter combinations generate highly episodic preservation dominated by discrete fossilisation pulses, whereas others produce more continuous and temporally diffuse accumulation regimes. These results demonstrate that fossil footprint assemblages are emergent products of coupled geomorphic and taphonomic processes rather than simple proxies for activity intensity alone.
Critically, preservation is maximised not under conditions of highest behavioural activity, but where environmental transitions intersect with sufficient, but not excessive, footprint availability. This reinforces the broader conclusion that footprint assemblages primarily record windows of preservation opportunity rather than continuous occupation intensity. It follows, therefore, that some surfaces may not have tracks, but their absence does not necessarily indicate human absence.
3.3. Behavioural Organisation
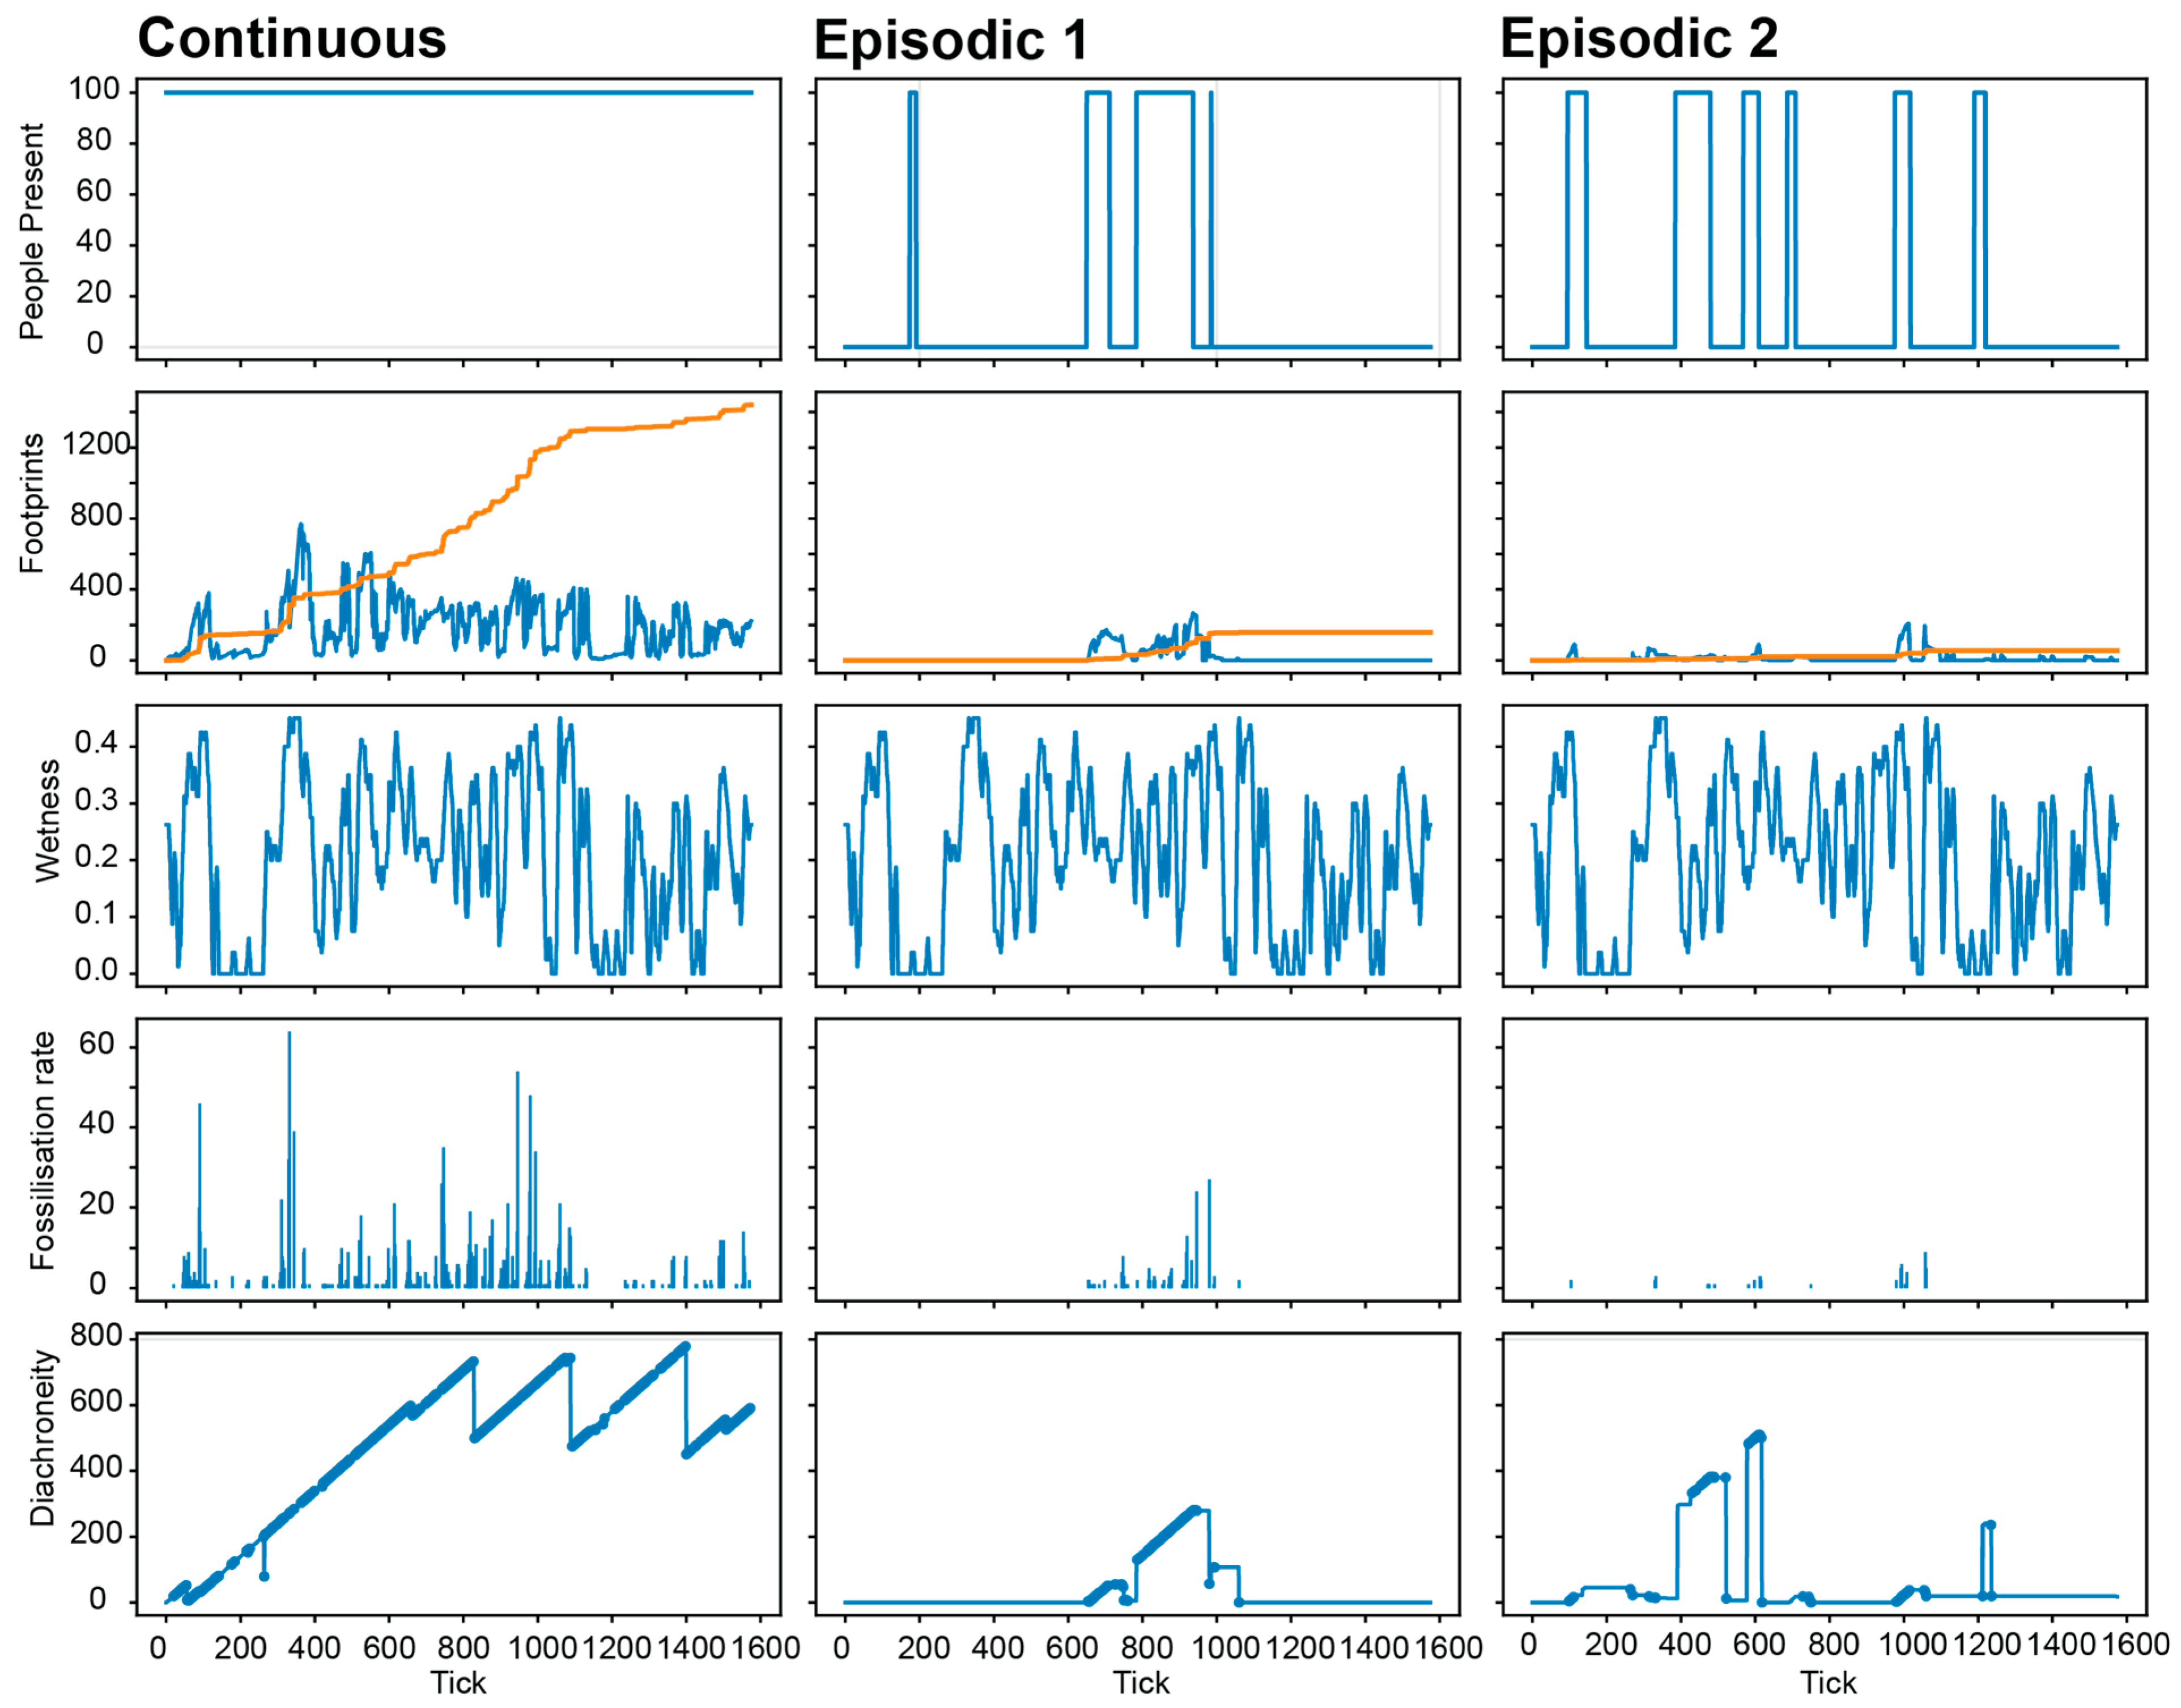
Initial model runs explored the contrast between continuous occupation and episodic visitation (
Figure 8). Continuous occupation provides a persistent background supply of footprints, increasing the likelihood that human activity overlaps with footprint-forming and footprint-preserving environmental conditions. Episodic occupation, by contrast, generates discrete pulses of activity separated by periods of absence, such that preservation depends on the stochastic coincidence between visitation events and suitable hydrological conditions. There is also the possibility—which is not investigated in the model—that human presence is also linked to hydrological variables.
These contrasting occupation structures produce different preservation architectures. Episodic regimes generate temporally isolated preservation events, commonly associated with lower diachroneity and repeated “age-zeroing” of surfaces as new occupation episodes overwrite or replace previous footprint populations. Continuous regimes promote greater temporal mixing, allowing footprints of different ages to accumulate on the same active surface and increasing the likelihood of time-averaged assemblages. However, both regimes can produce superficially similar preserved surfaces, indicating that surface structure alone may not uniquely diagnose occupation mode.
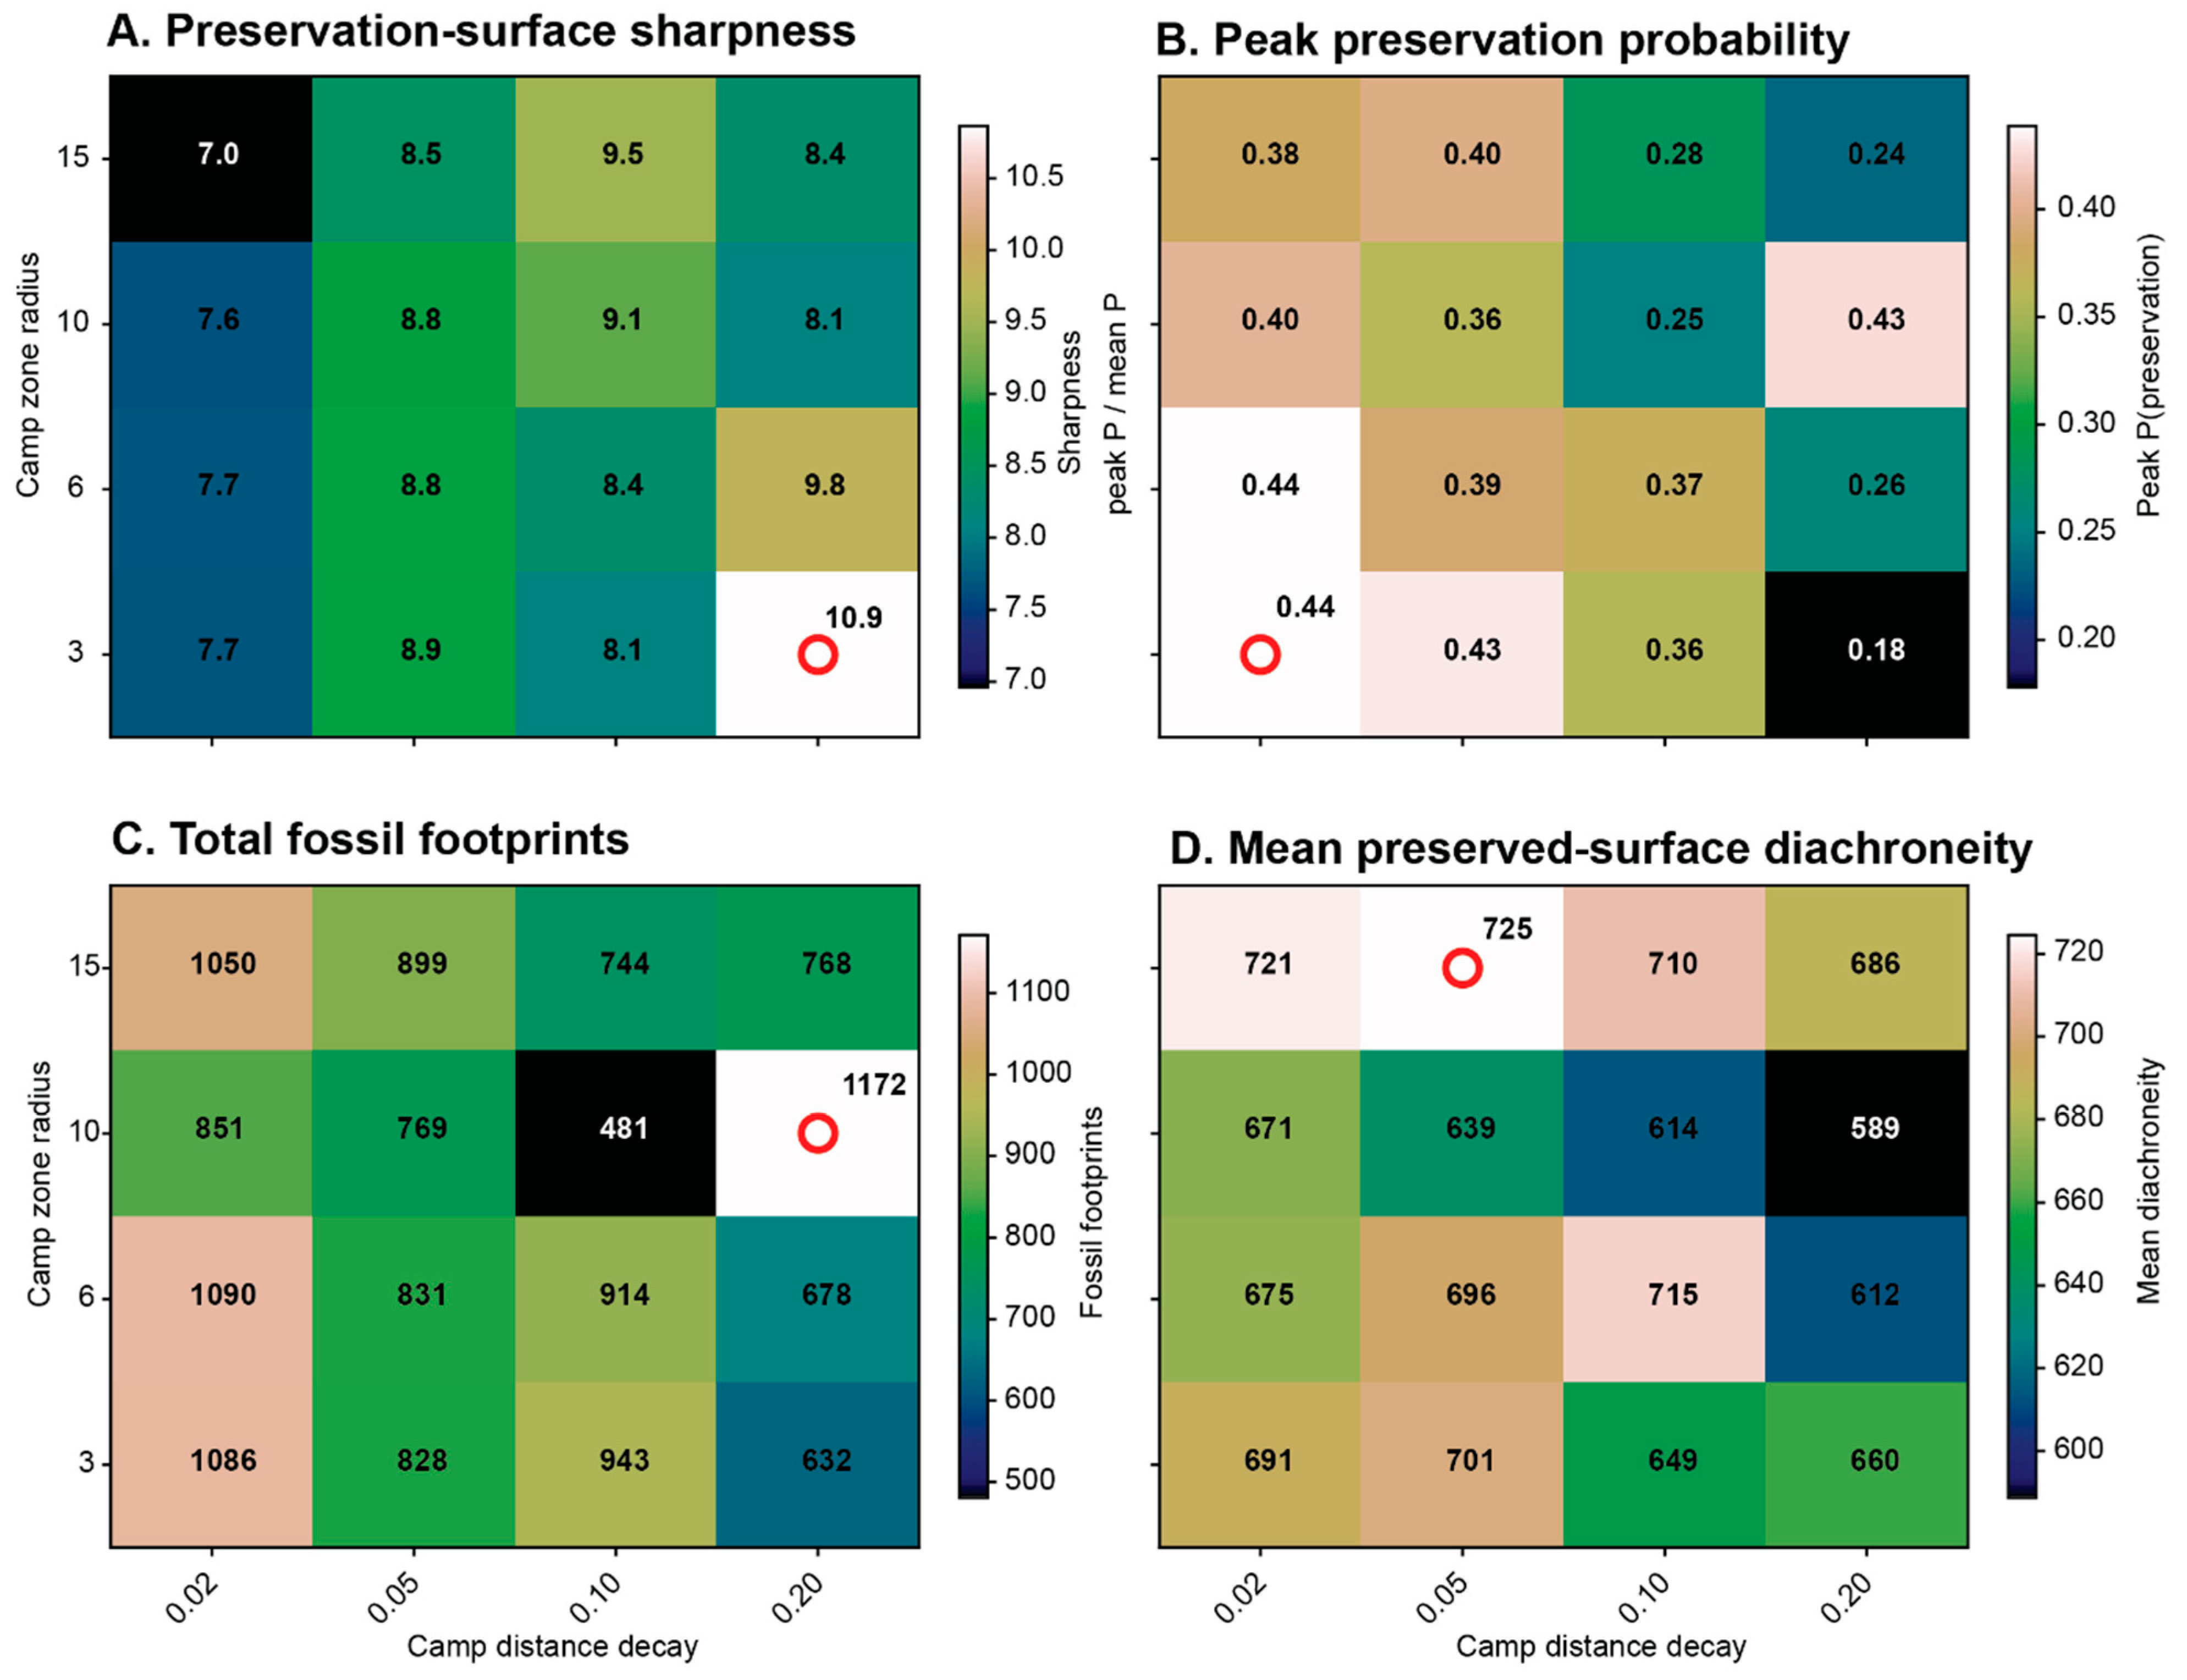
Using the continuous regime as a baseline, the interaction between preservation and behavioural organisation was then explored through a parameter sweep of camp-zone radius and camp-distance decay (
Figure 9). Camp-zone radius defines the spatial extent of activity around the camp, while camp-distance decay controls the degree to which movement is concentrated near the camp centre. Model outputs were summarised as probability matrices averaged across replicate simulations.
The results show that behavioural organisation exerts a primary control on the preservation filter, rather than simply modulating the number of footprints available for fossilisation. Increasing population size alone has limited explanatory value compared with the spatial organisation of movement. Varying camp-zone radius and distance decay systematically reshapes the environmental–behavioural state space in which preservation occurs.
Spatially concentrated activity, generated by smaller camp-zone radii and/or stronger distance decay, produces sharper preservation probability surfaces and higher peak preservation probabilities. These conditions create focused windows in which high footprint density coincides with suitable wetting events. However, this does not necessarily maximise total fossil yield because footprints are concentrated into a smaller spatial domain. More diffuse activity fields distribute footprints more widely across the landscape, increasing the potential area of preservation but reducing the sharpness and predictability of preservation windows.
This trade-off is also expressed in the temporal structure of preserved surfaces. Concentrated activity can generate higher diachroneity where restricted areas are repeatedly used and reworked through time, whereas diffuse activity tends to produce more spatially dispersed and temporally discrete assemblages. The preservation signal therefore reflects not only how many people were present, but how movement was organised across the landscape.
Taken together, these results demonstrate that behaviour controls not only whether preservation occurs, but how it is structured in space, time, and probability. Within the parameter space explored here, fossil footprint assemblages cannot be interpreted as simple proxies for population size or activity intensity alone; they are filtered through the spatial organisation of movement and its coincidence with environmental opportunity.
3.4. Tools Versus Footprints
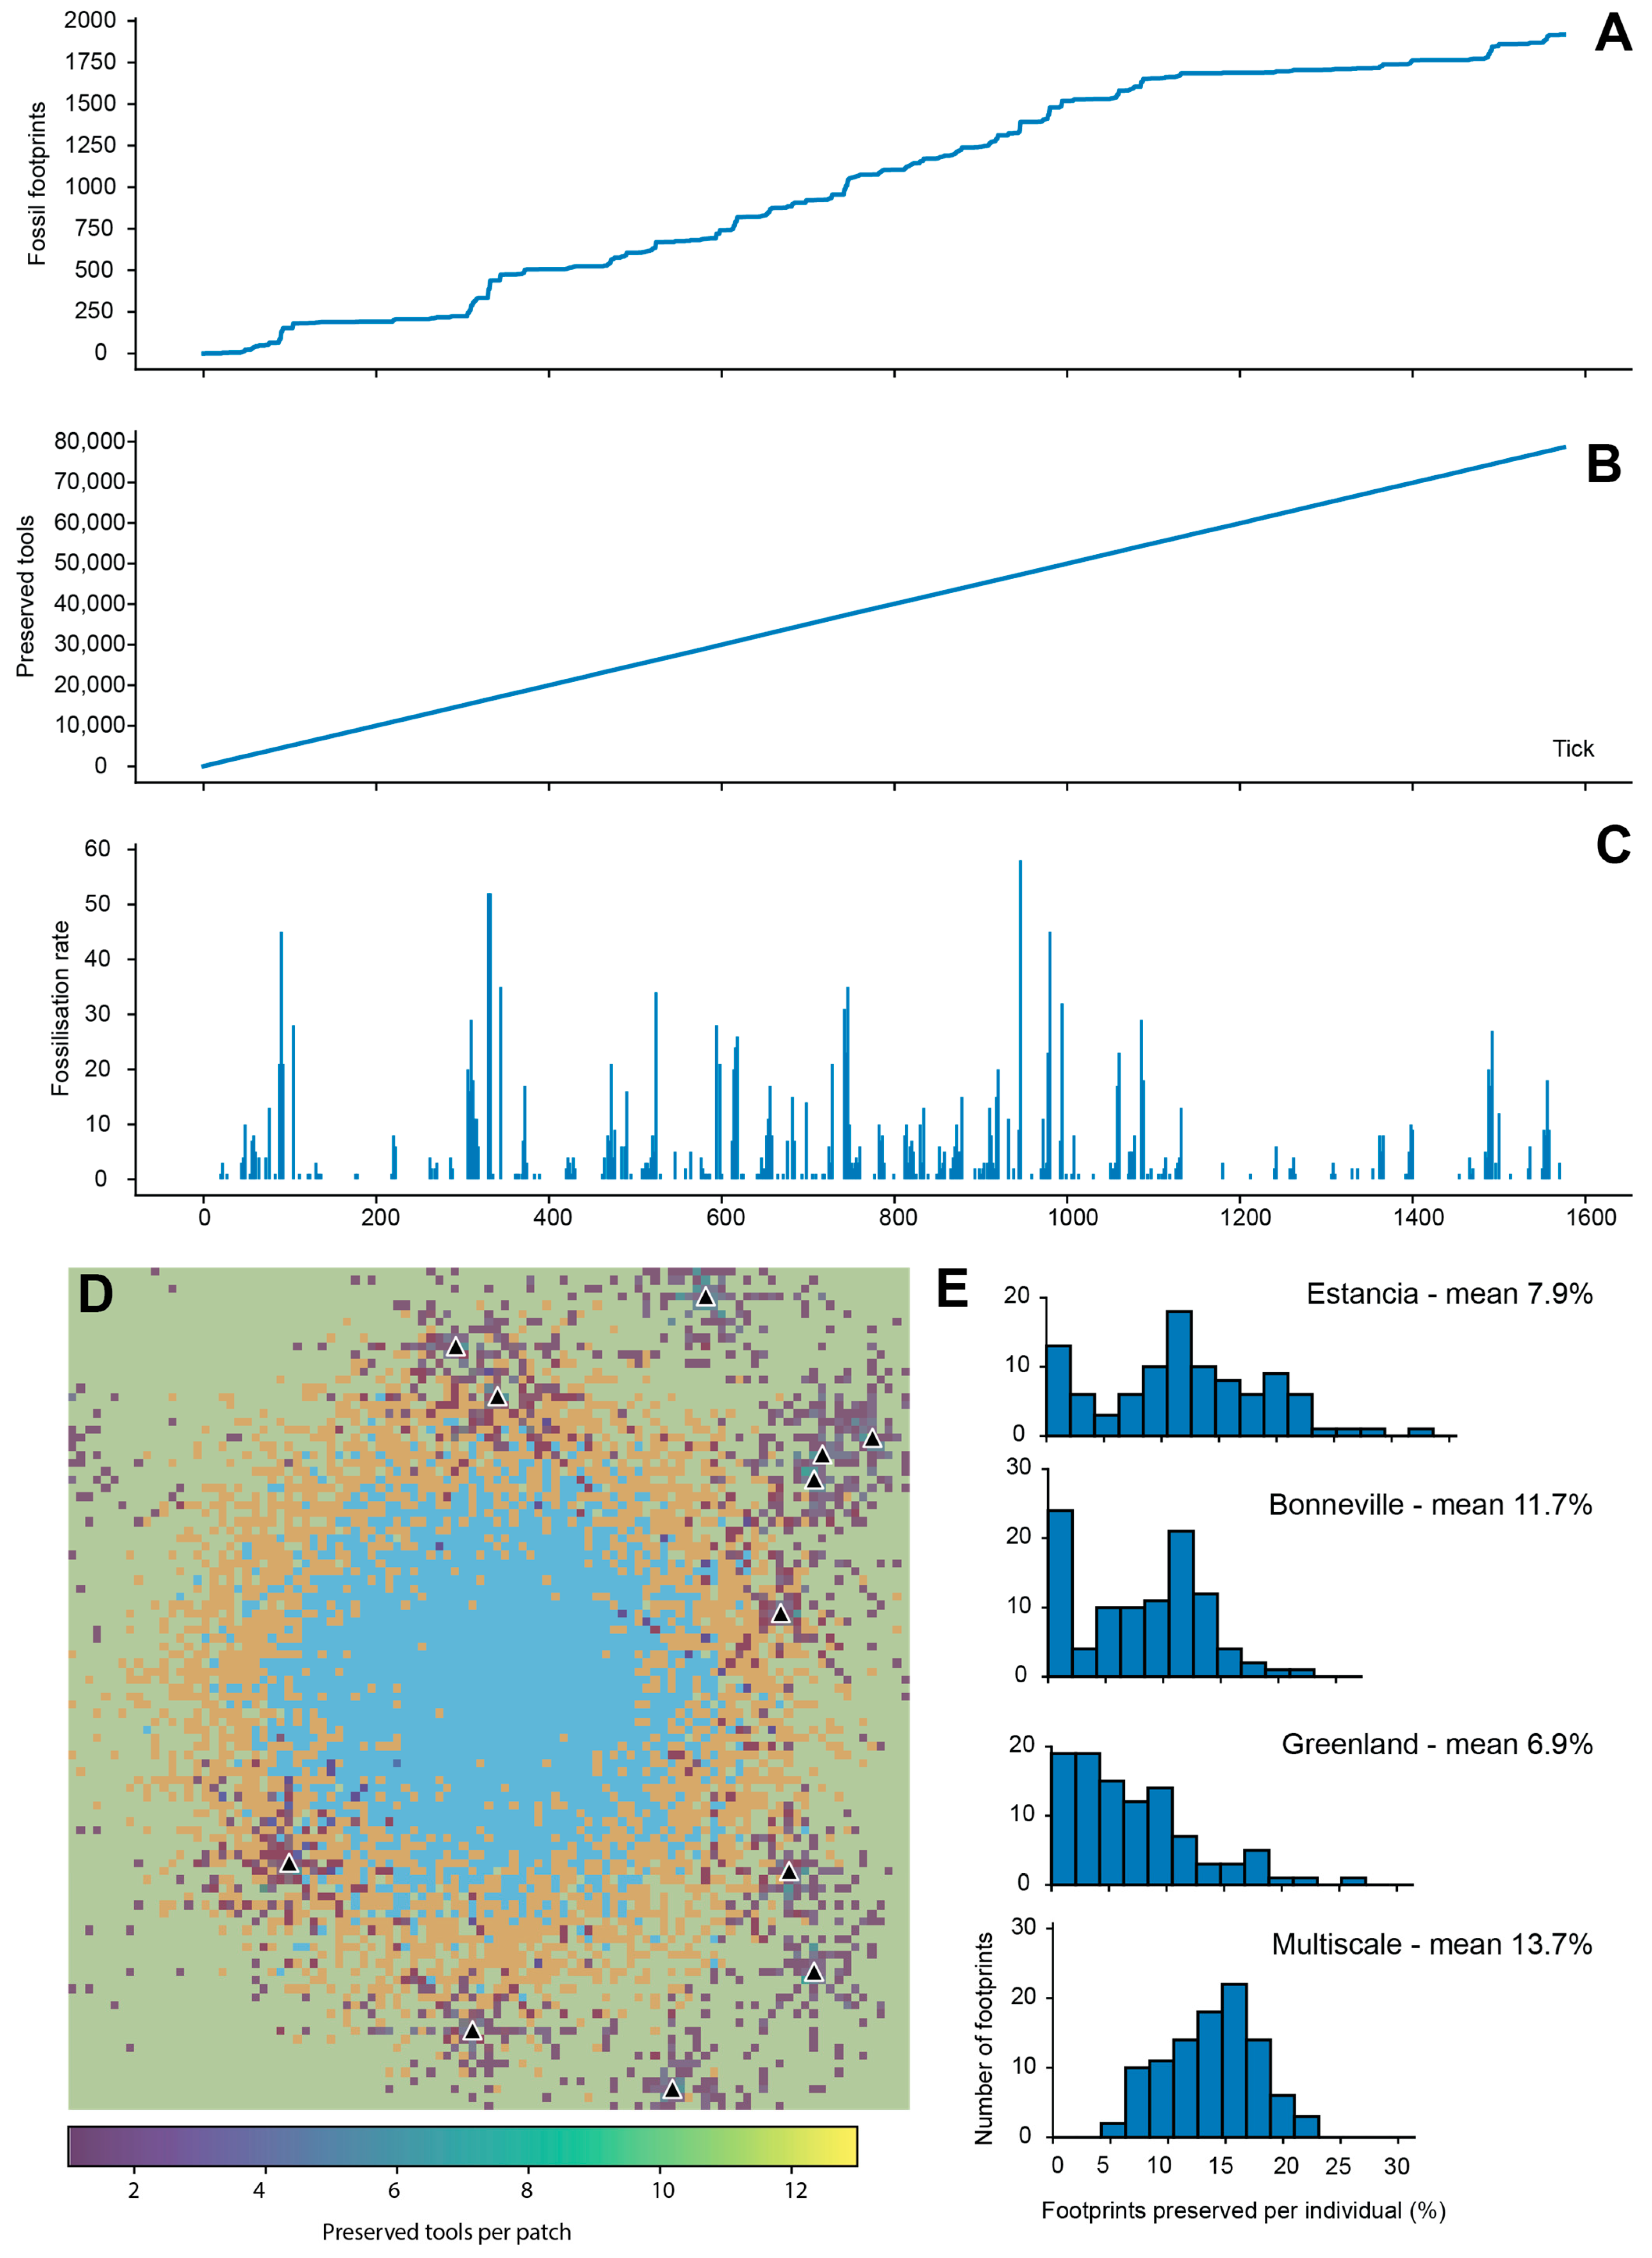
The model includes a simplified representation of artefact loss and preservation. Cultural artifacts, referred to generically here as tools, are discarded probabilistically as individuals move across the landscape and, once deposited, may be preserved on any land surface. Unlike footprints, artefacts are not subject to rapid post-depositional decay, surface reworking, or environmental erasure within the model. Consequently, artefact accumulation is progressive through time and primarily reflects patterns of movement, occupation intensity, and repeated landscape use (
Figure 10).
This behaviour contrasts strongly with that of footprints. Although the total number of footprints generated during a simulation is substantially greater than the number that are ultimately preserved, footprint preservation is highly episodic and dependent on environmental transitions. Most footprints exist only briefly as live surface features before being erased, buried, or overprinted. At any given moment, landscapes contain many more live footprints than preserved footprints, yet only a very small proportion become incorporated into the fossil record.
As a result, footprints and artefacts record fundamentally different temporal dimensions of human activity. Artefact assemblages accumulate cumulatively and therefore integrate behaviour across longer timescales, producing relatively stable spatial signals linked to repeated occupation and movement pathways. Footprint assemblages, by contrast, represent temporally discrete sampling events generated during short-lived windows of preservation opportunity. Their distribution therefore reflects the coincidence between behavioural activity and favourable environmental conditions rather than occupation intensity alone.
These contrasting preservation dynamics generate important differences in the archaeological and ichnological signals produced by the model. Tool distributions tend to form persistent spatial accumulations centred around repeatedly used areas such as camps and movement corridors, whereas footprint preservation occurs as discontinuous pulses tied to wetting events and substrate transitions. Consequently, the spatial and temporal relationship between footprints and artefacts may be weak even when both derive from the same underlying behavioural system. It is also explicit in the model that footprints and tools are deposited in different environments. Tools are lost when left or discarded mainly around camps, and since people tend not to camp in such environments we should not be surprised not to find them in association with footprints.
The results therefore demonstrate that co-occurring archaeological and ichnological records should not be expected to sample human activity in equivalent ways. Artefacts provide a time-integrated record of landscape use, whereas footprints preserve high-resolution behavioural snapshots associated with specific environmental states. Interpreting the relationship between the two records consequently requires explicit consideration of their differing taphonomic pathways and temporal sensitivities.
4. Discussion
The model developed here suggests that footprint-bearing surfaces should not be interpreted as direct proxies for population size or occupation continuity. Instead, they are best understood as discrete sampling events generated through the intersection of human activity and environmental conditions suitable for footprint formation and preservation. The fossil footprint record is therefore inherently structured by the interaction of behavioural, geomorphic, and environmental processes.
One of the clearest outcomes of the model is the importance of the temporal structure of climate variability in shaping preservation dynamics. Different forcing regimes generate markedly different preservation architectures, even where mean environmental conditions are broadly comparable. Periodic forcing produces predictable, phase-locked preservation events, whereas stochastic forcing generates irregular, high-magnitude pulses. Multiscale forcing creates a more continuous but still structured preservation regime, while the Greenland-derived signal concentrates preservation around hydrological transitions.
This variation arises because preservation depends not simply on environmental state, but on transitions within that state—particularly wetting events that inundate and bury footprint-bearing surfaces. Consequently, similar overall levels of aridity or humidity may produce very different preservation records depending on how variability is organised through time. Preservation is therefore fundamentally a process of environmental timing rather than mean climate alone.
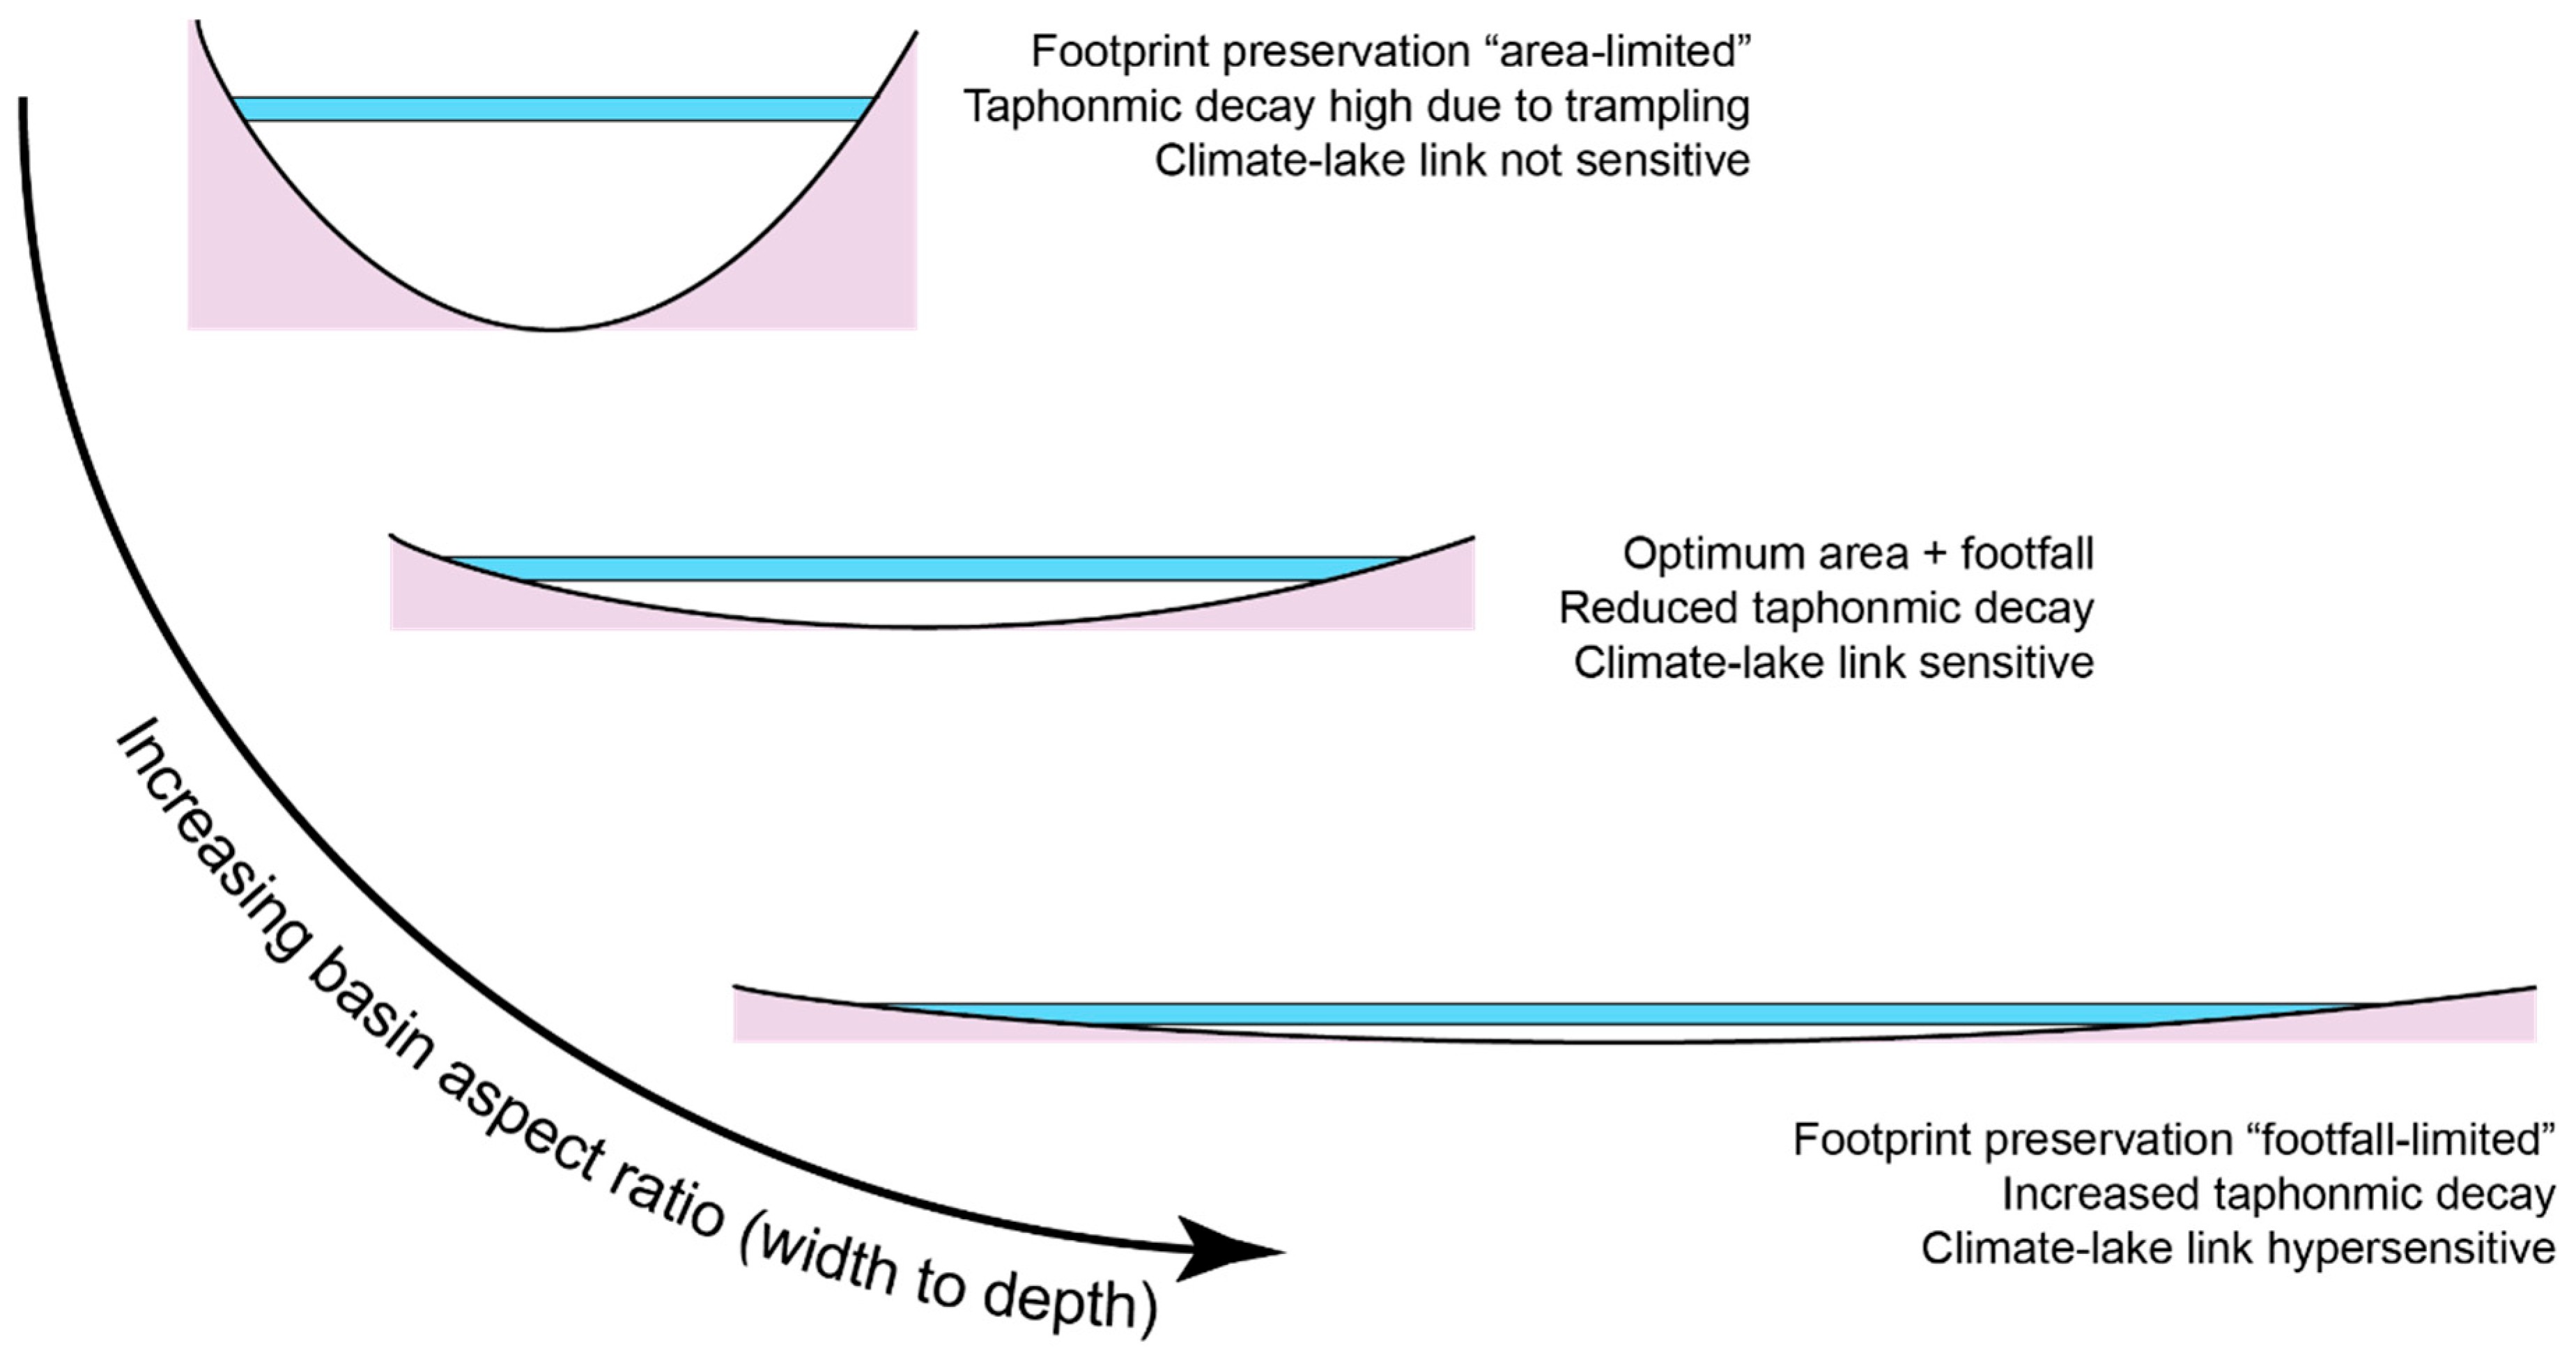
Crucially, this relationship is further mediated by basin geometry, in a manner analogous to the “amplifier lakes” in the East African Rift. The sensitivity of lake systems to climatic forcing varies as a function of basin morphometry. Shallow, laterally extensive basins with low depth-to-area ratios act as hydrological amplifiers, in which relatively small climatic perturbations generate disproportionately large changes in shoreline position [
25,
26]. By contrast, deeper, steeper-sided basins exhibit more buffered responses with reduced lateral shoreline mobility (
Figure 11).
The behaviour observed in the model is consistent with this framework. Intermediate mudflat extents produce the strongest preservation signal, effectively acting as amplification zones in which climatic variability is strongly expressed in the footprint record. Steep-sided basins are likely to preserve relatively limited footprint records because of restricted marginal exposure, whereas extremely low-gradient basins with highly mobile shorelines may disperse footprint formation across broad areas, promoting taphonomic loss and reducing the likelihood of coherent preservation. This suggests the existence of an optimal preservation basin, here termed the “Perfect Basin”, for footprint preservation, in which basin morphology, hydrological variability, substrate dynamics, and shoreline mobility are optimally aligned (
Figure 11). It follows that not all Pleistocene playas or lake basins in regions such as the North American Southwest possess equivalent preservation potential. Footprint preservation is therefore not simply a function of climate or behaviour, but of how both are filtered through basin geomorphology.
At the scale of the exposed landscape, the same principle is expressed through the relationship between mudflat extent, footprint supply, and preservation opportunity. The emergence of an intermediate ideal mudflat width reflects a balance between footprint production and burial potential. Narrow mudflats restrict footprint formation, whereas very wide mudflats disperse activity across space and time, reducing the probability that sufficient footprints accumulate within individual preservation windows. This strongly non-linear response demonstrates that footprint abundance alone is not a reliable predictor of preservation potential. Instead, preservation is maximised when environmental forcing and footprint availability remain synchronised at appropriate spatial and temporal scales.
Footprint decay further modulates this relationship by acting as a temporal filter. Too little decay promotes temporal mixing and time-averaging, whereas excessive decay suppresses the formation of preservable surfaces altogether. Intermediate decay values permit both accumulation and structuring, producing assemblages with measurable diachroneity. Together, these results reinforce the interpretation of footprint assemblages as emergent products of coupled landscape, behavioural, and taphonomic systems. They record not simply where people walked, but where environmental conditions allowed those movements to become preserved.
The model also highlights the importance of behavioural organisation in shaping the structure of the preservation filter. While increasing population size might be expected to increase preservation potential directly, the simulations indicate that this effect is comparatively weak relative to the influence of spatial organisation. Instead, the distribution of activity across the landscape—represented here through camp-zone radius and distance decay—controls how footprints are positioned relative to preservation opportunities.
Spatially concentrated activity produces dense footprint fields that can align strongly with environmental transitions, generating high-probability but spatially restricted preservation events. More diffuse activity spreads footprints more evenly across the landscape, increasing total accumulation but reducing the likelihood of strong alignment with preservation conditions at any one location. Similar numbers of preserved footprints may therefore arise from very different behavioural regimes, while markedly different preservation signals may emerge from similar levels of activity. Behaviour consequently shapes not only the quantity of the footprint record, but also its spatial, temporal, and probabilistic structure.
The comparison between continuous and episodic occupation further reinforces this point. Episodic regimes introduce an additional level of stochasticity because preservation depends on the alignment between discrete occupation events and environmental transitions. Nevertheless, the resulting preserved surfaces may resemble those generated under continuous occupation, highlighting the difficulty of inferring occupation mode directly from footprint assemblages alone.
A further implication concerns the differing archaeological significance of footprints and artefacts. A common response to the White Sands discoveries has been the apparent absence of associated tools. However, the model demonstrates that these records are fundamentally different and should not be expected to covary directly. Artefacts accumulate progressively through time and are comparatively insensitive to short-term environmental fluctuations, thereby integrating behaviour across longer timescales. Footprints, by contrast, are generated continuously but preserved episodically, with each preserved surface representing a short-lived behavioural snapshot immediately prior to burial. The two records therefore encode different temporal dimensions of human activity: one cumulative and integrative, the other selective and event-based.
Taken together, these results suggest that repeated footprint-bearing surfaces within stratigraphic sequences should not automatically be interpreted as evidence for sustained occupation or demographic continuity. Instead, they are more plausibly understood as recurring alignments between human presence and preservation opportunity. Variations between surfaces—in footprint density, diachroneity, or inferred group composition—may therefore reflect shifts in environmental timing, basin dynamics, or behavioural organisation rather than population size alone.
This interpretation also provides an opportunity. By explicitly considering the interaction between behaviour and environment, footprint assemblages can potentially yield information not only about human presence, but also about landscape use, mobility organisation, and the timing of occupation relative to environmental change.
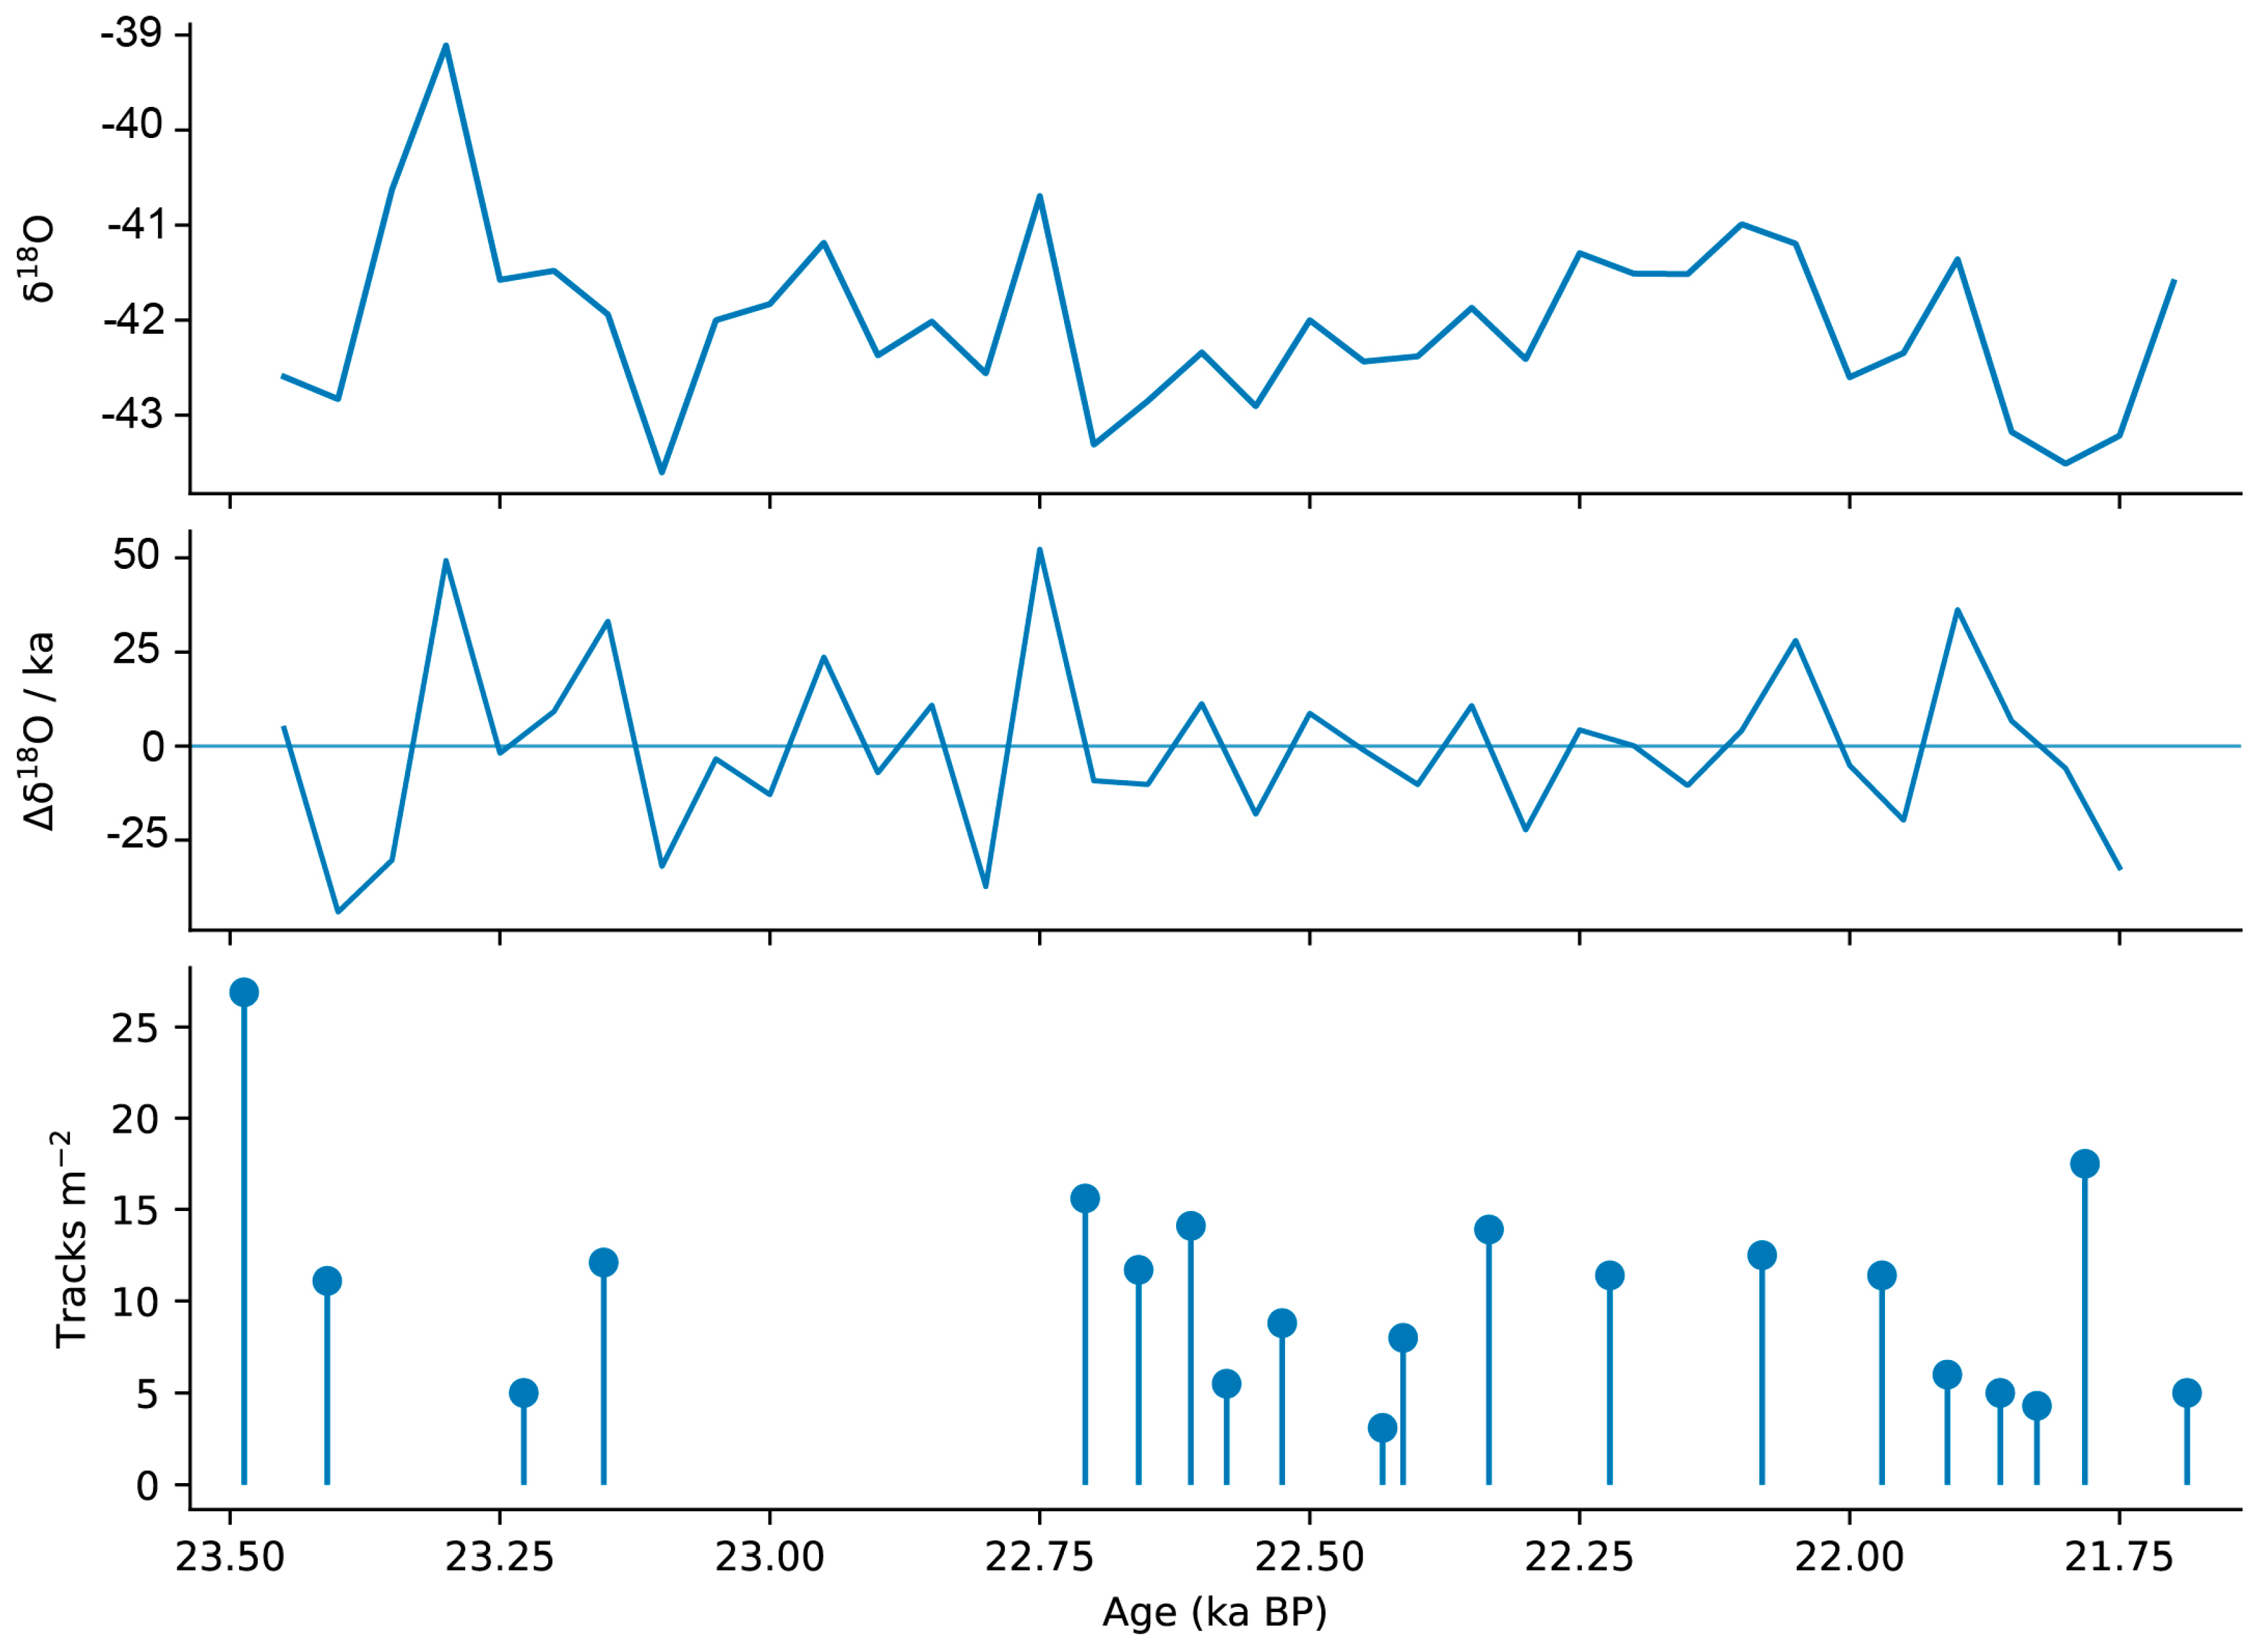
The White Sands footprint sequence provides an opportunity to evaluate this framework empirically [
27]. Comparison with the Greenland ice-core record (
Figure 12) shows that footprint abundance is expressed as a series of irregular pulses rather than as a continuous signal tracking absolute climate state. Instead, peaks in footprint density tend to cluster around periods of climatic transition, consistent with the model prediction that preservation is governed primarily by environmental change—particularly wetting events—rather than mean conditions alone.
The irregular spacing and highly variable magnitude of these peaks further suggest that preservation reflects the stochastic alignment between footprint availability and burial conditions. It is of equal importance that intervals of climatic variability without corresponding footprint peaks demonstrate that environmental forcing alone is insufficient to generate preservation; human presence must also coincide with favourable preservation conditions. The White Sands sequence is therefore consistent with a structured stochastic preservation regime in which footprint-bearing surfaces represent episodic sampling events rather than continuous occupation or simple demographic change.
5. Conclusions
This study provides a conceptual and quantitative framework for understanding how fossil footprint assemblages form. By treating preservation as a probabilistic process operating within environmental–behavioural state space, the model moves beyond descriptive accounts of footprint occurrence towards a process-based understanding of what lacustrine footprint-bearing surfaces actually represent.
The results demonstrate that footprint assemblages are not straightforward records of population size or occupation continuity. Instead, they emerge through the interaction of human activity with dynamic environmental conditions that govern both footprint formation and preservation. Across all experiments, preservation is controlled by the interaction of three linked systems: the temporal organisation of climate variability, the geomorphic structure of the landscape, and the spatial organisation of behaviour.
Different climate forcing regimes generate distinct preservation architectures, even under comparable mean environmental conditions, demonstrating that preservation depends fundamentally on environmental timing rather than climate state alone. Basin geometry and substrate dynamics further regulate preservation potential by controlling shoreline mobility, footprint concentration, and burial opportunity, producing non-linear preservation responses and the emergence of optimal preservation conditions. Behavioural organisation then determines how human activity intersects with these windows of opportunity, exerting a stronger influence on preservation structure than population size alone.
The comparison between footprints and artefacts further emphasises the selective nature of the footprint record. Artefacts accumulate cumulatively and integrate behaviour across longer timescales, whereas footprints are generated continuously but preserved episodically. The two records therefore capture fundamentally different temporal dimensions of human activity and should not be expected to covary directly.
Taken together, these findings suggest that repeated footprint-bearing surfaces within stratigraphic sequences are best interpreted as recurring alignments between human presence and preservation opportunity and may not always provide as direct evidence for sustained occupation or demographic continuity. Variability between surfaces may therefore encode changes in environmental timing, basin dynamics, or behavioural organisation rather than simple population change.
More broadly, this work reframes fossil footprints in lacustrine settings as emergent products of coupled behavioural and environmental systems. Footprint-bearing surfaces are not records of population, but records of opportunity—formed only where human activity intersects with the fleeting conditions required for its preservation.