Review

On the Incompleteness of the Coelacanth Fossil Record

1
State Key Laboratory of Geomicrobiology and Environmental Changes, School of Earth Sciences, China University of Geosciences, Wuhan 430074, China
2
Department of Geology and Palaeontology, Natural History Museum of Geneva, 1208 Geneva, Switzerland
3
Department of Earth Sciences, University of Geneva, 1205 Geneva, Switzerland
*
Authors to whom correspondence should be addressed.
Foss. Stud. 2025, 3(3), 10; https://doi.org/10.3390/fossils3030010
Submission received: 2 February 2025 / Revised: 2 July 2025 / Accepted: 3 July 2025 / Published: 8 July 2025
(This article belongs to the Special Issue Continuities and Discontinuities of the Fossil Record)

Abstract

This study conducted a spatiotemporal review of the coelacanth fossil record and explored its distribution and diversity patterns. Coelacanth research can be divided into two distinct periods: the first period, which is based solely on the fossil record, and the second period following the discovery of extant taxa, significantly stimulating research interest. The distribution and research intensity of coelacanth fossils exhibit marked spatial heterogeneity, with Europe and North America being the most extensively studied regions. In contrast, Asia, South America, and Oceania offer substantial potential for future research. Temporally, the coelacanth fossil record also demonstrates significant variation across geological periods, revealing three diversity peaks in the Middle Devonian, Early Triassic, and Late Jurassic, with the Early Triassic peak exhibiting the highest diversity. With the exception of the Late Devonian, Carboniferous, and Late Cretaceous, most periods remain understudied, particularly the Permian, Early Jurassic, and Middle Jurassic, where the record is notably scarce. Integrating the fossil record with phylogenetic analyses enables more robust estimations of coelacanth diversity patterns through deep time. The diversity peak observed in the Middle Devonian is consistent with early burst models of diversification, whereas the Early and Middle Triassic peaks are considered robust, and the Late Jurassic peak may be influenced by taphonomic biases. The low population abundance and limited diversity of coelacanths reduce the number of specimens available for fossilization. The absence of a Cenozoic coelacanth fossil record may be linked to their moderately deep-sea habitat. Future research should prioritize addressing gaps in the fossil record, particularly in Africa, Asia, and Latin America; employing multiple metrics to mitigate sampling biases; and integrating a broader range of taxa into phylogenetic analyses. In contrast to the widespread distribution of the fossil record, extant coelacanths exhibit a restricted distribution, underscoring the urgent need to increase conservation efforts.

1. Introduction

The incompleteness of the fossil record poses a major challenge in understanding the history of life and evolution, requiring careful attention from researchers. As early as the 19th century, Darwin highlighted the incompleteness of the fossil record in his work On the Origin of Species [1]. These gaps may result from multiple factors, including the preservation potential of organisms, characteristics of the depositional environment, disturbances from tectonic activities, and limitations in human sampling efforts [2,3,4,5,6]. As Smith [7] noted, the fossil record is not randomly incomplete but exhibits systematic biases. The fossil record we observe today represents only a fraction of Earth’s history of life, and paleontologists aim to reconstruct the evolutionary process on the basis of this limited evidence. Compared with most invertebrate fossils, vertebrate fossils are generally fewer in number and less complete in preservation [8,9]. However, as one of the most abundant vertebrate groups in aquatic ecosystems, fish fossils exhibit relatively good preservation potential [10]. Previous studies have conducted detailed investigations of the fossil record of key marine and terrestrial vertebrate groups, such as sharks, ichthyosaurs, sauropodomorphs, tetrapods, and birds [11,12,13,14,15]. Lloyd [16] conducted a comprehensive survey of the Phanerozoic fish fossil record across the United Kingdom. Henderson et al. [17] assessed the incompleteness of the Paleozoic actinopterygian fossil record. Both studies revealed a clear correlation between fish diversity and sampling effort. In contrast, systematic studies on the coelacanth fossil record remain relatively limited.
Coelacanths have a long research history and are regarded as key examples of slow evolutionary lineages [18,19]. Since the genus Coelacanthus was named by Agassiz [20] in England, coelacanth research has spanned almost two centuries. Since the discovery of the first living coelacanth off the coast of South Africa in 1938, coelacanth research has spanned 87 years [21]. In 1941, Schaeffer first proposed a phylogenetic tree of coelacanths, providing a systematic summary of coelacanth research [22]. Through systematic reviews by Forey and Cloutier in the late 20th century, our understanding of coelacanth diversity patterns has significantly advanced [23,24,25]. In recent years, the discovery of new taxa and fossil sites worldwide has sustained a high level of interest in coelacanth research [26,27,28,29,30]. Toriño et al. [31] and Ferrante et al. [32] provided the most recent diversity curve for coelacanths. However, these studies have not adequately addressed sampling biases or systematically reviewed the quality of the coelacanth fossil record. The study by Forey and Cloutier was primarily based on the observed distribution of known taxa and is now over three decades old, highlighting the need for updated data. In contrast, the study by Toriño et al. [31] and Ferrante et al. [32] relied mainly on phylogenetic analysis and did not encompass all known coelacanth taxa. Therefore, this study aims to compile all known coelacanth fossil records as comprehensively as possible and assess their quality across temporal and spatial dimensions. We hope to provide critical insights for understanding coelacanth evolutionary history, evaluating fossil record quality and biases, and guiding future research directions.

2. Materials and Methods

We conducted multifaceted analyses of coelacanth fossil records to quantify research attention, geographic distribution, species’ geological ranges, and diversity estimates based on sampling effort and phylogeny.
Annual Google Scholar search volumes were used as a metric to gauge researcher interest since the first coelacanth fossil record. This approach reflects the overall academic focus on coelacanth fossils. Data on publication counts from Forey and Cloutier [33] were cited as an indicator of taxonomists’ research intensity on coelacanths. Based on the Paleobiology Database (PBDB, http://paleobiodb.org/data1.2/taxa/list.csv?datainfo&rowcount&base_name=Osteichthyes&show=full, accessed on 29 June 2024), supplemented by our own literature review, we compiled all fossil occurrence data confirmed as coelacanths and included all such data in our analysis in order to fully capture the global distribution of this group. For each continent, we counted the number of valid species (based on the literature) reported in that region, as using species-level data allows for a more precise assessment of their research history. Fossil sites from the Paleozoic and Mesozoic, as well as modern coelacanth distributions, were mapped, with latitude and longitude plotted to visualize their spatial patterns. We manually compiled a comprehensive list of all previously reported coelacanth species. Based on subsequent critical reassessments in the literature (either refuting or validating prior taxonomic assignments), this study establishes the current list of valid taxa (Supplementary File S1). The stratigraphic ranges of all valid species (here represented by their geological stage occurrences, which do not reflect their true species lifespans) were compiled and mapped to objectively represent the extant fossil record. Additionally, the two extant species were constrained to 13 million years based on the divergence date based on molecular dating analyses by Kadarusman et al. [34].
Using PAST 4.16c software, we performed rarefaction analysis on the coelacanth fossil record to assess research intensity for each geological periods and compared study efforts among continents using the number of fossil sites per unit area [35]. The number of specimens (taken from the literature) for each valid species was counted to assess potential biodiversity under the current sampling conditions. This study employs three non-parametric methods—Chao1, ACE, and iChao1—to estimate coelacanth species richness and diversity per unit time across geological periods, and these estimates are compared with the observed species count (Taxa_S) to assess sampling sufficiency. It is important to note that the species richness estimates in this study are based solely on those coelacanth lineages that have been preserved in accessible stratigraphic deposits and have actually been discovered and studied. Chao-1 estimates species richness based on the number of rare species (singletons and doubletons); iChao-1 refines this estimate by incorporating species observed up to four times, improving accuracy in small or sparse samples; ACE uses all species observed ≤10 times, providing stable estimates for larger datasets.
Based on the second phylogenetic analysis by Manuelli et al. [28] (excluding only Diplurus to include more genera), we constructed a time-calibrated phylogenetic tree via our compiled geological range data (Supplementary Material S5). The analysis was performed using the paleotree [36] and strap [37] packages in R software (version 4.0.2) [38]. By using this phylogenetic tree, we estimated phylogenetic diversity and compared it with the fossil record to explore the relationship between species diversity and phylogenetic diversity throughout coelacanth evolutionary history. Since not all genera are included in the phylogenetic tree, directly comparing the full fossil record with phylogenetic diversity would be misleading. To ensure consistency, we limited our analysis to the genera present in the tree and compared their fossil diversity with phylogenetically inferred diversity. This provides a more accurate assessment of their congruence.
In this study, “phylogenetic diversity” refers to the number of observed and inferred lineages (including ghost lineages) present at each time interval, rather than to the sum of branch lengths. All our phylogenetic analyses were carried out at the genus level, in accordance with previous studies on coelacanth phylogeny. Therefore, both the observed fossil diversity and the inferred phylogenetic diversity discussed here refer to genera, not species. Apart from the phylogenetic analysis section, we have used data at the species level. Additionally, in the part on geographical distribution, we have included all fossils that can be identified as coelacanth.
The images were created using Origin 2024, CorelDRAW 2019, and QGIS 3.36.3 software. Specifically, Origin 2024 was used for data visualization and statistical analysis, generating the relevant charts and curves; CorelDRAW 2019 was employed for graphic layout and design; and QGIS 3.36.3 was used to create the distribution map of coelacanth localities.
Abbreviations used in the text: D1, Early Devonian; D2, Middle Devonian; D3, Late Devonian; C1, Mississippian; C2, Pennsylvanian; P1, Early Permian; P2, Middle Permian; P3, Late Permian; T1, Early Triassic; T2, Middle Triassic; T3, Late Triassic; J1, Early Jurassic; J2, Middle Jurassic; J3, Late Jurassic; K1, Early Cretaceous; K2, Late Cretaceous; ERSD, earliest research start date; Num_Gen, number of genera reported; Num_Sp, number of species reported; Num_Spe/Mkm2, number of species per million km2; Paleo_Dist, distribution in Paleozoic Era; Meso_Dist, Distribution in Mesozoic Era; Con, concentrated; Scat, scattered; Mod, moderately; Num_Gen_RT, genus count (raw total); Num_Sp, species count; Chao1_Div, Chao1 diversity; iChao1_Div, iChao1 diversity; ACE_Div, ACE diversity; Samp_Size, sample size; Rare_Curve, rarefaction curve; PD_Inc_Gen, phylogenetic diversity of included (genus); PD_Gen, phylogenetic diversity (genus); PD_Inc_Gen/Ma, phylogenetic diversity of included (genus) per million years; PD_Gen/Ma, phylogenetic diversity (genus) per million years; RS, rapidly rising; AP, approaching plateau; PL, plateaued; PD_Gen/Ma_Diff, PD (genus)/Ma/PD (included genus)/Ma; PD_Gen_Diff, PD (genus)/PD (included genus).

3. Result

3.1. Stages of Coelacanth Research History

On the basis of the discovery of living coelacanths, we divided coelacanth research history into two phases.
Phase 1 (1839–1938): The Fossil Record Era. For nearly a century, human knowledge of coelacanths was limited to fossils, with the widespread belief that this group had gone extinct at the end of the Late Cretaceous. During this period, academic interest in coelacanths was relatively low, with only a few studies mentioning coelacanths each year. Key contributions came from Agassiz, Woodward, Stensiö, and Moy-Thomas [15,21,22,23].
Phase 2 (1939–Present): The Post-Discovery Boom. In 1938, the discovery of a living coelacanth off the coast of South Africa sparked a surge in research interest. As illustrated in Figure 1A, the search index for coelacanth fossils rapidly increased after 1938, reached a maximum in the 2010s, and subsequently plateaued. A minor research peak occurred in the early 1990s, likely driven by advances in gene sequencing technologies (e.g., PCR, Polymerase Chain Reaction), which accelerated studies on the genetic composition of living coelacanths. This discovery significantly increased non-taxonomists’ attention to this group. As shown in Figure 1B, the number of dedicated taxonomic studies (as indicated by the curve following Forey and Cloutier, 1991 [33]) on coelacanths increased only slightly from 1839 to 1991, with the number of annual publications never surpassing 10. However, the total number of articles on coelacanth fossils in Google Scholar rose significantly, particularly after 1950, reflecting a marked increase in attention from various scientific fields. This confirmed that the discovery of living coelacanths sparked widespread interest in this group.

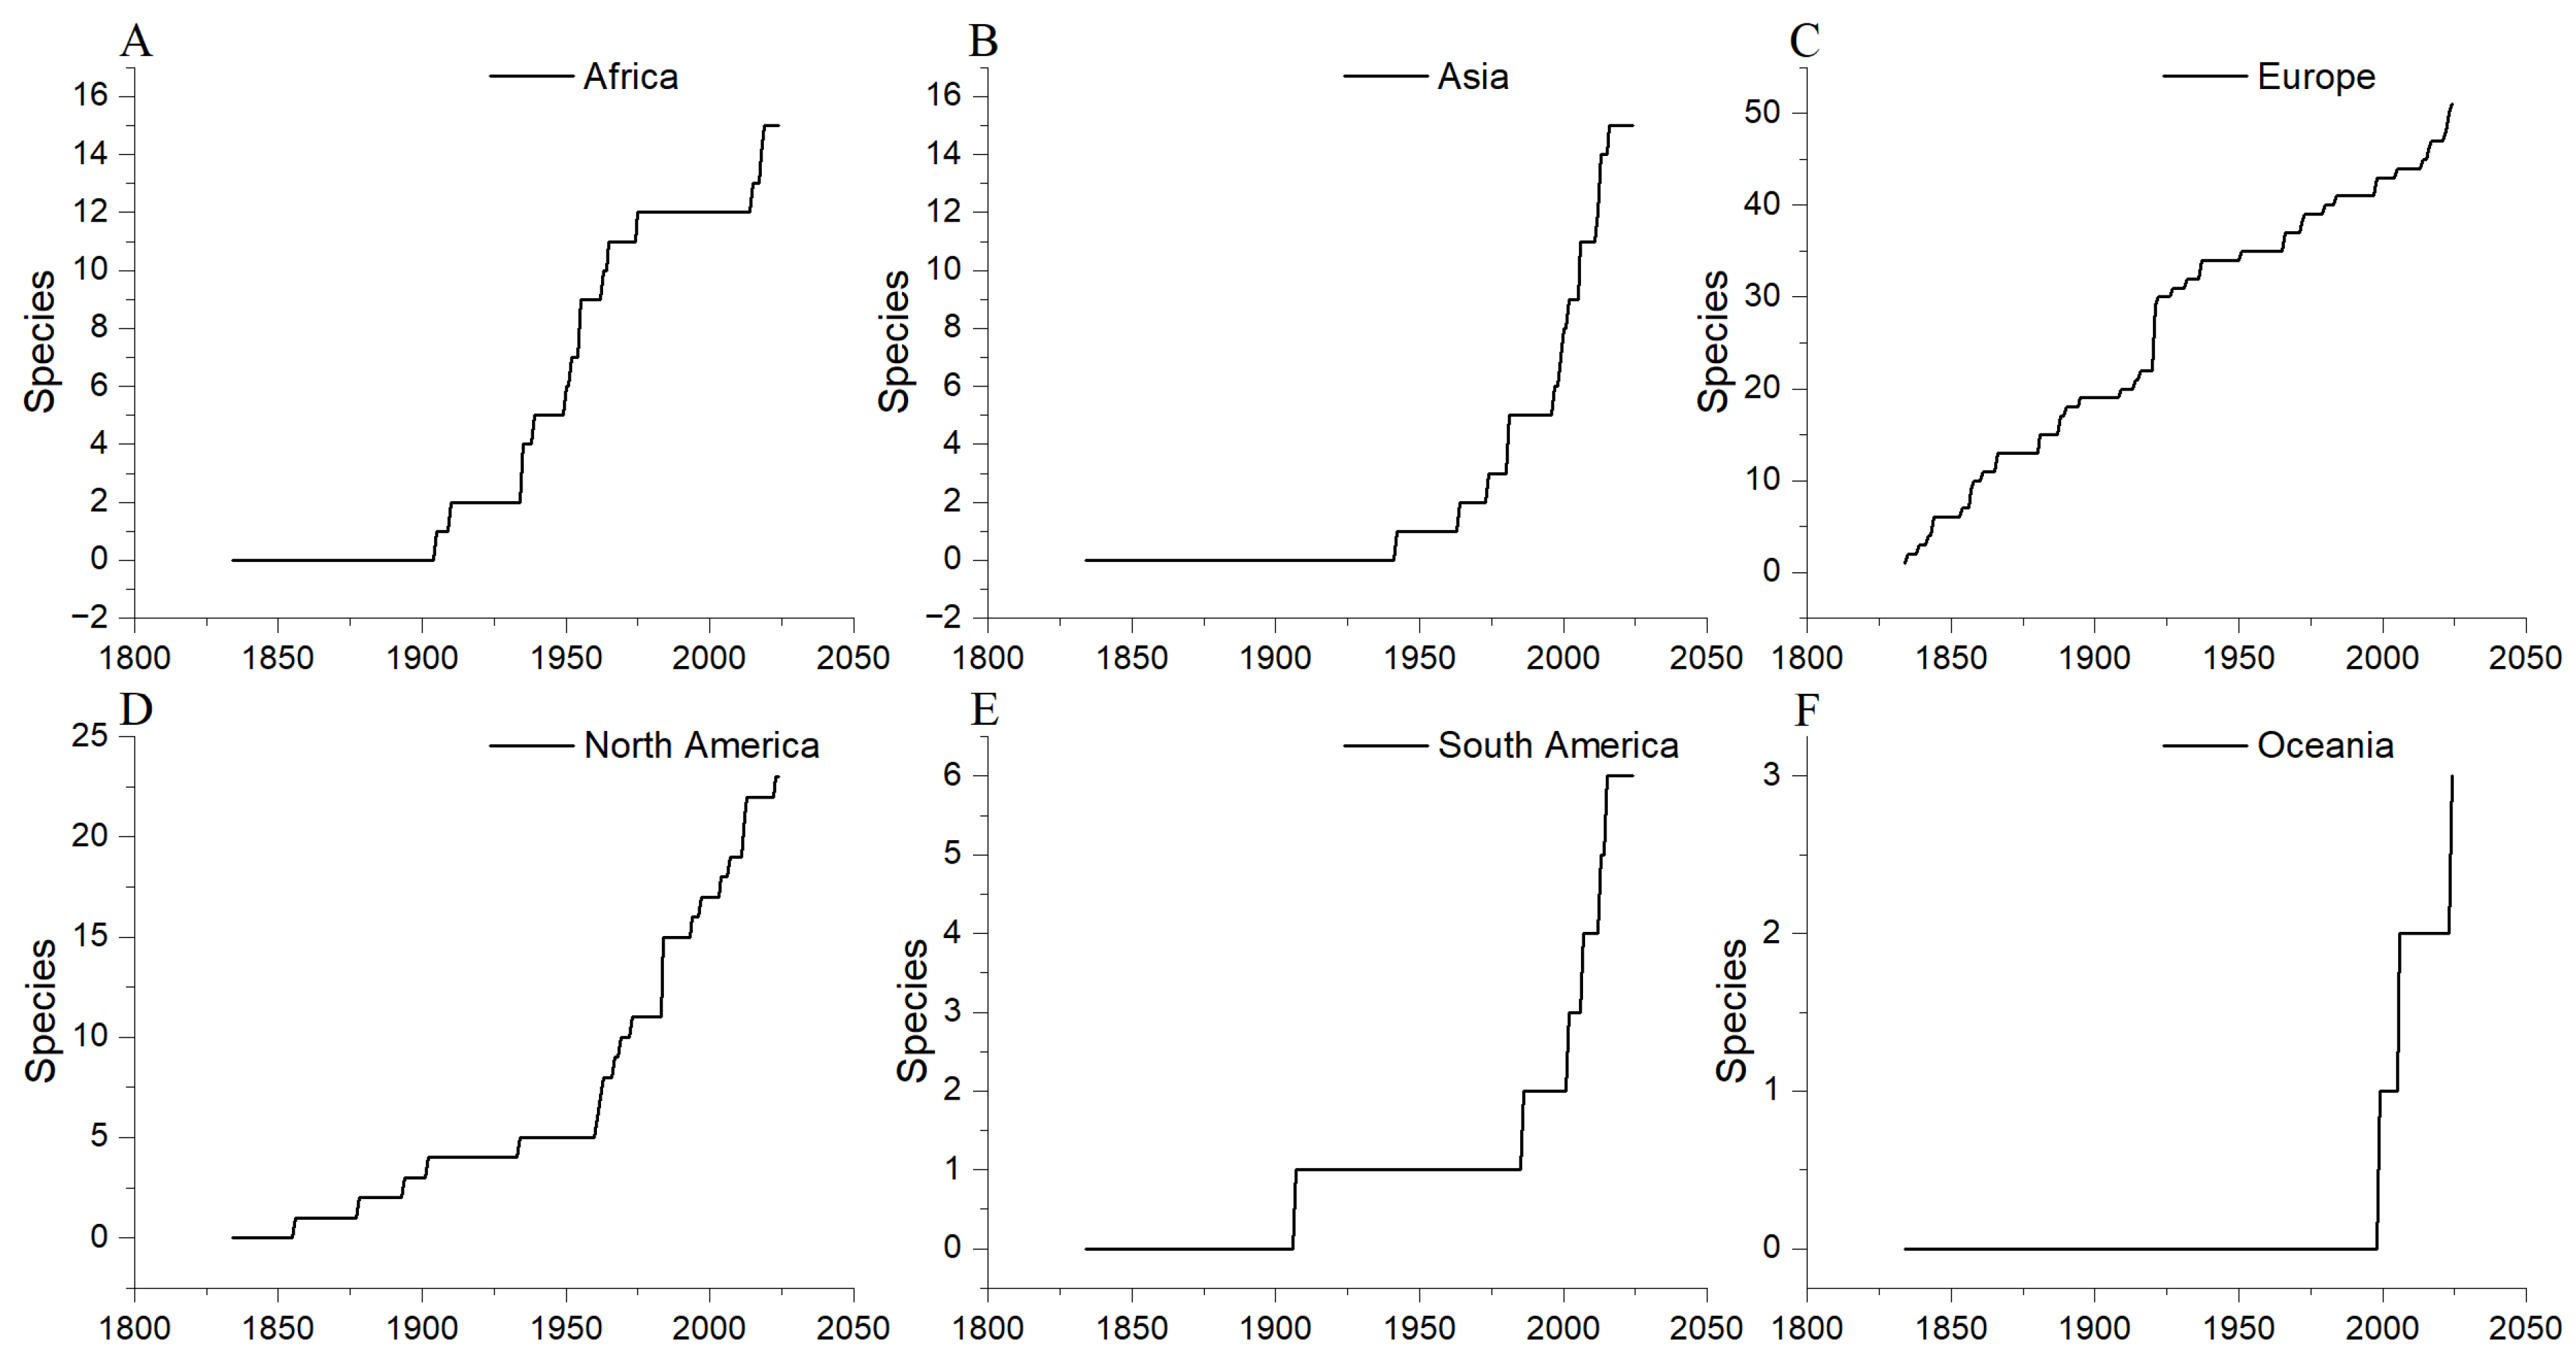
3.2. Spatial Heterogeneity in Coelacanth Fossil Record

Coelacanth fossils have been recorded on all continents except Antarctica (Figure 2). Globally, Europe and North America have long been the primary contributors to the paleobiodiversity record, whereas Africa, Asia, South America, and Oceania have contributed less but have shown a notable increase in recent years, indicating a trend toward more balanced global research (Figure 3). For coelacanths, this regional disparity is particularly pronounced. The number of recorded coelacanth species by region is as follows: Europe (51), North America (23), Africa (15), Asia (15), South America (6), and Oceania (3) (Figure 2).
In this review, research history and current status are organized by the continents where coelacanth fossils have been discovered. As a pioneer in coelacanth research, Europe boasts the longest history and the most extensive fossil record (Figure 2). The earliest descriptions date back to Agassiz [39]. Stensiö [22] conducted a systematic study of coelacanths from Spitsbergen and described five new species, marking a significant milestone in early research. Coelacanth fossils in Europe are primarily found in Germany and the United Kingdom [20,40]. Additional occurrences have been documented in France, Switzerland, Italy, and Norway [28,32,41,42]. North America also has a long research history, with the earliest record being Newberry’s (1856) description of coelacanths from the United States [43]. Stensiö reported the fossil of the coelacanth Laugia from Greenland, which represents the highest latitude record in the Northern Hemisphere [44]. Lund et al. [45] identified four new species from the Carboniferous, significantly contributing to the progress of coelacanth research in North America. Despite a later start compared to Europe, North America experienced rapid advancement in the post-mid-20th century, now approaching Europe in terms of richness of discoveries.
Africa boasts coelacanth fossils, with the earliest record being Broom’s description of Whiteia africanus from South Africa [46]. Madagascar is the main source of African coelacanths, with four Early Triassic species reported there [47,48,49]. South America has relatively few coelacanth fossil records, with the earliest being Mawson and Woodward’s description of Mawsonia from Brazil [50]. Brazil is the main source of coelacanth fossils in South America, with minor occurrences also reported in Chile [51,52,53]. Research in South America began to increase only after the 1980s. Asia has a relatively rich coelacanth fossil record, with the earliest being Woodward’s study on Lebanese coelacanths [50]. Since the 1960s, research in Asia has increased significantly, driven by in-depth studies on Triassic coelacanths in China [54,55,56]. Oceania has the sparsest coelacanth fossil record, with the earliest known specimen described in Long’s systematic study of Gavinia syntrips from the Middle Devonian in Australia [57]. Another coelacanth record from Oceania is Eoactinistia, discovered in the Lower Devonian strata in Australia [58]. Although poorly preserved, this genus has been identified as one of the most basal actinistians, holding significant importance in phylogenetic studies.
Based on cumulative curves of valid coelacanth species by continent, Europe and North America show plateauing trends, indicating that the currently accessible fossil record in these regions has likely been extensively sampled. However, as deep-sea and other inaccessible environments are underrepresented in the fossil record, it is possible that additional taxonomic diversity remains undiscovered. Africa, with a long research history, ranks next and has experienced steady growth; Asia and South America display rapid upward trends, reflecting ongoing research expansion; and Oceania has the fewest records and the shortest research history (Figure 3). Importantly, these records reflect only described species and may not fully represent actual diversity.

3.3. Geographic Distribution of Coelacanths: From the Paleozoic to the Present

The fossil record of coelacanths exhibits a cosmopolitan distribution, whereas extant coelacanths demonstrate a markedly restricted biogeographic range. Fossil records show notable regional concentrations (Supplementary Material S3, Figure 4): 1. Europe has the densest fossil record, particularly in Western and Central Europe (e.g., Germany and the UK), with the most extensive research. 2. Americas: fossils are concentrated in the United States, with minor occurrences in Brazil, Mexico, Chile, Canada, and Uruguay. 3. Africa: the fossil record is scattered but found at both the northern and southern ends of the continent. 4. Asia: fossils are located primarily in East Asia and Southeast Asia, with China having the highest number of sites. 5. Oceania: this group is mainly from Australia, particularly in Victoria and the Canning Basin of Western Australia.
Paleozoic coelacanth fossils are relatively broadly distributed and are found in both the western and eastern hemispheres (Figure 5A). They are concentrated in Europe and North America, with scattered occurrences in Asia, Africa, South America, and Oceania. In addition to Europe and North America, the major known Paleozoic fossil sites include Morocco and South Africa in Africa, China and Iran in Asia, Australia in Oceania, and Brazil in South America (for a more exhaustive overview of their distribution, see Figure 4), indicating a potentially wider distribution than currently documented. Latitudinal analysis reveals that fossils are primarily concentrated in mid-latitude regions between 30° N–60° N and 20° S–40° S. Although this distribution partly reflects the higher proportion of land masses in the Northern Hemisphere relative to the Southern Hemisphere, approximately two-thirds and one-third, respectively, the research effort in the Northern Hemisphere, far exceeding that in the Southern Hemisphere, also biases our understanding of the true distribution.
Mesozoic coelacanth fossils have been recorded globally but exhibit significant regional clustering rather than a uniform distribution (Figure 5B). Compared with Paleozoic fossil sites, Mesozoic fossil sites are more widespread, extending even to high-latitude regions in the Northern Hemisphere, such as Greenland and Spitzbergen. Mesozoic fossils are primarily concentrated between 60° N and 40° S, with significantly more sites than those in the Paleozoic, suggesting either a wider distribution of coelacanths, higher taxonomic diversity of coelacanths during the Mesozoic, a better preservation rate due to heterogeneity of fossiliferous outcrops, or a higher discovery rate. Notably, fossil sites are clustered at approximately 40° N and 10° S, with research and discoveries in the Northern Hemisphere far exceeding those in the Southern Hemisphere.
Modern coelacanths are strictly confined to the Southern Hemisphere and exhibit a distinct disjunct distribution (Figure 5C). Latitudinally, they are primarily found between 0° S and 40° S, peaking at approximately 10° S near the equator. Longitudinally, two prominent clusters are observed near 40° E (western Indian Ocean, Mozambique Channel) and 120° E–140° E (western Pacific, near Indonesia), corresponding to the habitats of the two extant species and reflecting geographic isolation as a mechanism of speciation [34,59].

3.4. Evaluating Coelacanth Research Efforts by Continent Using Fossil Site Density

Assessing coelacanth research intensity by continent requires not only the total number of fossil sites but also their density per unit area, which better reflects research depth. This study uses the number of fossil sites per million square kilometers as the metric. The results reveal a significant nonlinear relationship between fossil site counts and continental areas (Table 1). Simply comparing total sites does not accurately reflect research intensity (Figure 6). Europe has the highest research intensity, with a fossil site density of 9.14 per million km2, significantly surpassing other continents because it has over 90 sites within a relatively small area. North America has high research intensity, with a site density of 2.71 per million km2, ranking second but remaining notably behind Europe. Africa and South America show moderate research intensity, with site densities of approximately 0.9 per million km2, indicating comparable yet intermediate levels of research activity. In contrast, Asia and Oceania display lower research intensities, with site densities of 0.38 and 0.35 per million km2, respectively, underscoring considerable potential for future investigations. It should be noted that this proxy could reflects, in addition to research efforts, the quantity of fossiliferous sediments for each era outcropping on each continent, a parameter not considered in our study.

3.5. Temporal Heterogeneity in Coelacanth Fossil Record

Geological ranges of coelacanth fossil species: Since Agassiz [20] described and named the first coelacanth fossil specimen, Coelacanthus granulatus, approximately 159 coelacanth species have been reported, although some have been invalidated or reclassified. A systematic review revealed that 111 species are currently confirmed as valid, with 8 species requiring further verification, while 40 coelacanth species were deemed invalid in previous studies (Supplementary Material S1) [23,60]. The 111 valid species comprise 32 Paleozoic, 77 Mesozoic, and 2 extant taxa. The coelacanth fossil record dates back to the earliest Devonian (~410 million years ago) and extends to the end of the Cretaceous (~66 million years ago) [61,62], spanning approximately 344 million years (Supplementary Material S2, Figure 7). Despite the absence of Cenozoic fossil record, the evolutionary history of living coelacanth species has extended to approximately 410 million years. Assuming no taxonomic inaccuracies, Mawsonia gigas demonstrates the longest geological range, spanning at least 41.6 Myr (excluding the earliest and latest occurrence stages, Figure 7) [63,64].
The fossil record reveals several geological stages with no reported coelacanth identified at the species level, including the Emsian and Eifelian stages of the Early and Middle Devonian, the Tournaisian stage of the Early Carboniferous, the Middle Permian, the Callovian stage of the Middle Jurassic, and the whole Cenozoic (Figure 7). The Paleozoic fossil record of coelacanths remains relatively sparse, which may reflect either taphonomic biases (preservational constraints), sampling limitations in current research efforts, or a genuinely lower diversity of coelacanths during the Paleozoic compared to their Mesozoic radiation. The Early and Middle Triassic represent peak diversity for coelacanths, with 21 and 13 species reported, accounting for 18.9% and 11.7% of all species, respectively. In contrast, the Early Devonian, Early Permian, and Late Permian have the fewest reported species, with three, one, and four species, respectively. Potential explanations include insufficient research, inherently low diversity, or outcrop availability constraints.
Coelacanths experienced four of the five Phanerozoic mass extinctions: the Late Devonian (F-F), Permian–Triassic (P-T), Triassic–Jurassic (T-J), and Cretaceous–Paleogene (K-Pg) (Figure 7). Following the F-F mass extinctions, coelacanth fossil record shows a decline in species numbers, indicating negative impacts on their diversity. Notably, after the P-T mass extinction, the largest Phanerozoic extinction, coelacanth diversity surged, likely reflecting their adaptability to new environments. After the K-Pg mass extinction, coelacanth fossils were absent, possibly because of their migration to deeper environments, where fossilization is less likely.

3.6. Sampling Curves Across Different Time Intervals

This study employs rarefaction curves to assess the sampling sufficiency of coelacanth fossil records across various periods. Importantly, these curves reflect only the research intensity of known fossil sites. Furthermore, the sample size used in this analysis corresponds to the number of specimens mentioned in publications (usually those used in the descriptions) but not to the actual number of specimens present in the collections. We consider this proxy as a first attempt to compare sampling effort between time intervals.
The sample sizes (the number of coelacanth specimens reported in publications) for the Early Devonian and Middle Devonian are significantly lower than those for the Late Devonian (Supplementary Material S4, Figure 8A). Despite this, both the Early Devonian and Middle Devonian curves clearly show an upward trend, indicating substantial sampling gaps and the potential for new species discoveries. The Late Devonian curve rises across the entire sample range but does not fully plateau, suggesting that while sampling is relatively thorough, new species discoveries remain possible.
The Mississippian (C1) sample has a slightly larger sample size than the Pennsylvanian (C2) sample (Figure 8B). However, the Mississippian curve exhibits a pronounced upward trend across the entire sample range, indicating insufficient sampling and potential for new species. The Pennsylvanian curve quickly levels off at a small sample size, suggesting that sampling may be near saturation. The Early Permian could not be analyzed because only one species was recorded. The Middle Permian lacks a fossil record and cannot be assessed. The Late Permian curve, despite its small sample size, shows a notable upward trend, indicating insufficient research and the need for further fossil discoveries and studies (Figure 8C).
The Early Triassic has the largest sample size but remains insufficient, with the highest potential species richness (Figure 8D). The Middle Triassic has a moderate sample size, which still offers potential for new species discoveries. The Late Triassic has the smallest sample size and is relatively close to saturation, although new species discoveries cannot be ruled out. At equal sampling efforts, the Early Triassic exhibited the highest species diversity. Among all Jurassic Epochs, the Late Jurassic has the largest sample size, with a clear upward trend, indicating the highest potential species richness (Figure 8E). The Early Jurassic has a moderate sample size, retaining the potential for new species discoveries. The Middle Jurassic has an extremely limited sample size, reflecting a severe lack of research. With equal sampling efforts, the Late Jurassic has the highest species diversity. The Early Cretaceous and Late Cretaceous have relatively sufficient sample sizes, with nearly overlapping curves (Figure 8F). The Late Cretaceous curve has plateaued, whereas the Early Cretaceous rarefaction curve shows a distinct upward trend, suggesting further potential for improved sampling in the Early Cretaceous. At equal sample sizes, the Early Cretaceous samples present higher species diversity.
From the Devonian to the Cretaceous, the sampling sufficiency of coelacanth fossil records varied significantly across periods. Only a few intervals (e.g., the Late Devonian, Early Carboniferous, Late Carboniferous, Early Triassic, and Late Cretaceous) show rarefaction curves approaching a plateau, suggesting that sampling may be nearing saturation, although new species discoveries cannot be ruled out. Most periods exhibit rarefaction curves with a clear upward trend, indicating substantial room for improved sampling. Additionally, some intervals (Early Devonian, Middle Devonian, Late Permian, and Middle Jurassic) have extremely small sample sizes, reducing the reliability of rarefaction curve analysis and highlighting severe research deficiencies. Owing to data limitations, only the Late Permian was preliminarily analyzed, underscoring the inadequacy of research in this period.

3.7. Assessing Coelacanth Species Counts at Documented Sites via Fossil Richness

The three methods (Chao-1, iChao-1, and ACE) yield broadly consistent results, aligning closely with trends in the actual record (Table 2, Figure 9). Overall, the iChao1 estimates are higher than the ACE estimates, and the ACE estimates exceed those of Chao1, which is consistent with the inherent characteristics of these methods. All three methods predict three periods of relatively high species diversity, although these do not fully coincide with the peaks in the actual record. The trends in estimated species diversity and diversity per unit time were largely consistent, with three diversity peaks. In absolute terms, the Late Jurassic exhibited the highest species diversity (Figure 9A); however, after time correction, the highest diversity occurred in the Early Triassic, significantly surpassing the Middle Devonian and Late Jurassic (Figure 9B).
In terms of absolute species richness, the predicted diversity for the Late Jurassic far exceeded the observed values, suggesting that it may have been a significant period for coelacanth diversity, although it could also be influenced by exceptional preservation (Figure 9A). The Middle Devonian estimates are also notably greater than the actual record, indicating potentially high species diversity during this time. All three metrics suggest greater potential diversity in the Early Cretaceous, implying insufficient research on fossil sites from this period. Additionally, the Middle and Late Triassic predictions exceed the actual fossil record, suggesting the possibility of discovering new species. In terms of species richness per unit time, most periods are well studied, but the Late Jurassic and Middle Devonian remain under-researched (Figure 9B). Some periods, such as the Early Devonian, Late Devonian, Carboniferous, Early Permian, Middle Jurassic, and Late Cretaceous, show close alignment between predicted and observed values in both absolute and per unit time species richness, indicating thorough research on fossil sites. Notably, the exceptionally low diversity in the Middle Permian and Middle Jurassic is likely due to the limited number of research sites and insufficient sampling efforts.

3.8. Assessing Coelacanth Fossil Record Based on Phylogenetic Diversity

This study analyzes genus-level diversity in the coelacanth fossil record and compares it with phylogenetic diversity derived from the time-calibrated phylogenetic tree of Manuelli et al. [28] to explore the evolutionary patterns of coelacanth diversity across geological periods. Currently, 69 coelacanth genera are known, of which 46 (approximately 66.7%) are included in the phylogenetic analysis. By comparing the proportion of genera included in the analysis to all known genera (inclusion ratio), we observed significant variations across different geological periods.
The following intervals have high inclusion ratios (≥0.8), indicating that nearly all or most genera discovered in these periods are included in the phylogenetic tree: Middle Devonian, Early Carboniferous, Early Permian, Middle Permian, Early Jurassic, Middle Jurassic, Late Jurassic, and Early Cretaceous (Figure 10C,D). Conversely, the following periods have relatively low inclusion ratios (<0.667, mean value): Early Devonian, Late Devonian, Late Carboniferous, Late Permian, Early Triassic, Middle Triassic, and Late Triassic. Notably, except for the Late Jurassic, periods with higher genus diversity tend to have lower inclusion ratios in phylogenetic analyses. These findings suggest that future phylogenetic studies should incorporate more genera from these periods to better reflect coelacanth evolutionary history. In contrast, periods with lower genus diversity show higher inclusion ratios, indicating that their fossil record is well utilized in phylogenetic analyses.
To investigate the relationship between phylogenetic diversity and fossil record diversity, we compared phylogenetic diversity with the number of genera included in the phylogenetic analysis across geological periods. The results indicate that for most of the time, the fossil record species diversity is qualitatively lower than the phylogenetic diversity (Figure 10A, Table 2). Compared with phylogenetic diversity, the fossil diversity is particularly underestimated in the Early Jurassic and Middle Jurassic, followed by the Late Triassic and Early Devonian. In contrast, phylogenetic diversity closely matches fossil record diversity in the Permian and Cretaceous, suggesting that fossil records from these periods are relatively comprehensive and accurately reflect actual diversity.
To mitigate the impact of geological period duration on diversity estimates, we compared phylogenetic diversity normalized per million years (Ma) with the number of genera included in the phylogenetic analysis for each geological period, with a total of 46 genera included. The results indicate close alignment in most periods (Figure 10B). However, phylogenetic diversity notably surpasses fossil record diversity in the Early Triassic, Middle Jurassic, Middle Triassic, Middle Devonian, Early Jurassic, and Late Permian. The most significant underestimations occurred in the Early Triassic and Middle Jurassic, with fossil records lagging behind phylogenetic diversity by 1.06/Ma and 0.68/Ma, respectively. The underlying causes for the anomalously low fossil diversity observed in the Early Triassic and Middle Jurassic appear to differ. In the Middle Jurassic, accumulation curves (Figure 8E) indicate significant sampling insufficiency, suggesting the low diversity is likely due to poor fossil recovery. In contrast, sampling in the Early Triassic is relatively sufficient, implying that the apparent discrepancy likely reflects genuinely higher diversity and highlighting gaps in our current understanding of this interval. The fossil record is most consistent with phylogenetic diversity in the Early Cretaceous and Late Cretaceous.

4. Discussion

4.1. Spatial and Temporal Assessment of Coelacanth Fossil Record

Research on coelacanth fossils varies significantly across regions and is broadly categorized into three tiers. 1. High-intensity research regions: Europe and North America outperform other regions across all the metrics, indicating the highest research intensity. The key features include the earliest research start date (ERSD), the highest number of reported genera and species, and the highest site density per unit area. 2. Moderate-intensity research regions: Africa, Asia, and South America show varying levels of research. Africa leads this tier with higher fossil site counts and site density per unit area than Asia and South America. Asia has a greater number of reported species than South America, suggesting greater coelacanth fossil diversity. South America has an earlier research history but fewer species than Africa and Asia. 3: Low-intensity research regions: Oceania ranks lowest in all metrics, reflecting the weak research focus on coelacanth fossils and significant untapped potential. Limited fossil discoveries and research investment likely result in a severe underestimation of coelacanth fossil diversity in this region.
Estimates based on sample size, phylogenetic diversity, and rarefaction curves collectively indicate that the fossil record of the Middle Devonian, Early Permian, Middle Permian, Middle Triassic, Late Triassic, Early Jurassic, and Late Jurassic are the most incomplete. All three methods suggest significant research gaps in these periods. Early Permian and Middle Permian rocks are particularly unique, as the limited fossil data prevent accurate predictions, although phylogenetic analysis confirmed low diversity during these intervals. The Early Devonian, Late Permian, Early Triassic, Middle Jurassic, and Early Cretaceous show relatively better research coverage. Except for the Early Cretaceous, existing sites in these periods are well studied, but phylogenetic analysis indicates the potential for undiscovered species, highlighting further research potential, likely requiring new site discoveries. The Late Devonian, Early Carboniferous, Late Carboniferous, and Late Cretaceous have the most complete fossil record, with all three metrics indicating thorough research in these periods.

4.2. Validity of Diversity Peaks

We identify several key periods of diversity fluctuations in coelacanth evolutionary history and explore potential causes, including genuine diversity changes and sampling biases.
The Devonian diversity peak is a signal of early radiation. Phylogenetic diversity analysis revealed a significant coelacanth diversity peak in the Middle Devonian, which is consistent with models of early evolutionary radiation [19,65]. Coelacanths from this period exhibit morphological diversity, differing from traditional forms, such as the heterocercal-tailed Gavinia and Miguashaia and Holopterygius with anguilliform profile and strongly asymmetrical caudal lobes [57,66,67,68].
The Early and Middle Triassic are true peaks of species diversity. Both sample-based diversity recovery and phylogenetically estimated genus-level diversity revealed that the Early Triassic had the highest species and genus counts per unit time, followed by the Middle Triassic. This strongly supports the assertion that the Early and Middle Triassic were true diversity peaks for coelacanths. Further evidence includes the emergence of innovative morphologies during this period, such as Rebellatrix from the Early Triassic of Canada, the only known coelacanth with a forked tail [69]. Foreyia and Rieppelia, discovered in the Middle Triassic of Switzerland, exhibit highly specialized morphological features, further supporting the diversity of coelacanth forms during this period [29,70]. The Early Triassic Guiyang Biota from South China has yielded diverse coelacanth groups. These fossils, originating from paleo-equatorial regions, indicate that coelacanths rapidly recovered and dispersed after mass extinction [71]. They likely rapidly occupied ecological niches vacated by the extinction event, driving a swift increase in species diversity and forming a significant peak in coelacanth evolutionary history. As ambush predators with low energy requirements, coelacanths likely had a competitive advantage under the extreme warmth and widespread anoxia of the Early Triassic, contributing to their elevated diversity during this interval.
The Late Jurassic is a false diversity peak—influenced by taphonomic bias. The apparent ‘peak’ in the Late Jurassic is likely influenced by exceptional preservation. Half of the eight species from this period originate from exceptional fossil deposits in southern Germany and southern France [40,72,73,74]. These unique taphonomic environments can even preserve articulated cartilaginous fish [75]. This exceptional preservation bias led to a relatively abundant fossil record in the Late Jurassic. Additionally, while sample-based estimates suggest the highest species count in the Late Jurassic (Figure 9), phylogenetic analysis indicates that this peak may be a sampling bias artifact (Figure 10). Phylogenetic analysis reveals that genus-level diversity peaked in the Middle Jurassic, possibly reflecting the true diversity of coelacanths during this period. However, owing to limited research on the Middle Jurassic, only two species are currently recorded, necessitating further in-depth studies [76,77].

4.3. Factors Contributing to Incomplete Coelacanth Fossil Record

The coelacanth fossil record is imperfect and is marked by gaps and biases. The key factors contributing to this phenomenon are described below.
Insufficient sampling effort by humans: Human factors, particularly inadequate sampling, such as limited geographic coverage and the preferential collection of well-preserved specimens, are a major cause of incomplete fossil record. Sampling efforts can significantly alter observed macroevolutionary patterns [5,78]. In the field of paleontological research, North America and Europe have the highest sampling rates, with other regions accounting for approximately 45% of sampling [79]. This is similar to the pattern observed in our coelacanth fossil record.
The incompleteness of the rock record: The incompleteness of the rock record is characterized by significant temporal variability in both the quantity and quality of sedimentary deposits [80,81]. Not all geological periods are equally well preserved, and their exposure at the surface for sampling varies significantly [2]. Previous studies have indicated that rock exposure areas vary across Phanerozoic periods, with the Cenozoic accounting for a significant portion [81]. In Western Europe, a hotspot for coelacanth research, there are significantly fewer Permian fossil sites than in other periods, with a minimal proportion of marine areas, which likely reduces the probability of discovering Permian coelacanths [4].
Limited Coelacanth population sizes. Extant coelacanth populations are relatively small. During most geological periods, coelacanth population sizes appear to have been smaller than those of actinopterygian fishes. This relative scarcity inherently reduces their probability of fossilization. Within fish assemblages, coelacanth specimens are typically rare, as exemplified by the Solnhofen of Germany [40,60]. According to Toriño et al. [30], coelacanths are considerably rarer than actinopterygians in the Late Jurassic Kimmeridge Clay Formation (England). An exception is observed in the Early Cretaceous with Mawsoniidae, which are abundant in localities such as the Sanfranciscana Basin (Brazil). This pattern may reflect a period of regional proliferation for Mawsoniidae in continental settings, though it could also be influenced by a decline in other contemporaneous families, particularly marine coelacanths [82]. Notably, the family’s predominantly presumed freshwater distribution suggests a higher abundance of coelacanths in freshwater environments, with marine records likely remaining scarce.
Preservation probability across different environments: The Cenozoic (66 million years ago to present) coelacanth fossil record is absent, with both extant species inhabiting deep-sea environments [21,59]. Fossil records of vertebrates in deep-sea environments are exceptionally rare, primarily due to the unique conditions of these habitats. First, preservation is unlikely in moderately deep-sea settings with low sedimentation rates [83]. Second, in food-scarce deep-sea environments, macrofauna are more thoroughly utilized by other organisms, such as “whale falls” [84]. Additionally, deep-sea sediments from geological history are often subducted and lost during tectonic movements [85]. Finally, obtaining deep-sea sediments from modern oceans is highly challenging and requires ongoing efforts such as ocean drilling programs. Nevertheless, shark teeth are occasionally retrieved, primarily because of their rapid growth and short replacement cycles, which increase their fossilization potential [86]. In addition, shark teeth are composed of very hard, highly mineralized enamel, making them more resistant to chemical and biological degradation. Their low nutritional value also means they are less likely to be consumed or destroyed by scavengers, which further increases the likelihood that they will persist and eventually fossilize. Future researchers may uncover Cenozoic record from coelacanth teeth.
The impact of exceptional preservation: Konservat Lagerstätten refer to fossil assemblages with extraordinary preservation, offering valuable insights into soft tissues and other delicate features [87]. Some Konservat Lagerstätten, such as the Late Jurassic Solnhofen Limestone, preserve numerous coelacanth fossils, creating a peak in taxonomic diversity, likely due to unique burial conditions known as the “Lagerstätten effect” [40,74,88]. However, during certain periods, such as the Early and Middle Triassic, the observed diversity peaks may not have resulted solely from preservation bias, as phylogenetic diversity is also high, likely reflecting genuine coelacanth flourishing [23,31,32]. We must carefully distinguish between these scenarios to avoid misinterpretations of fossil record diversity.

5. Conclusions

This study comprehensively evaluates the spatiotemporal distribution of the coelacanth fossil record. By integrating multiple analytical methods, it systematically assesses the completeness of fossil record across geological periods and identifies significant gaps in regional research intensity and fossil data.
The results highlight the spatiotemporal heterogeneity of coelacanth fossil record. Spatially, Europe and North America are the most extensively studied, with high fossil site density and a long research history, whereas Oceania has insufficient fossil discoveries and research efforts. This disparity may lead to an underestimation of coelacanth diversity in understudied regions such as Oceania. Temporally, only the Late Devonian and Late Cretaceous records are relatively complete, with most periods being inadequately documented. Particularly in the Middle Devonian, Early–Middle Permian, and Middle Jurassic, fossil data are extremely scarce and urgently require new discoveries.
Although previous studies have already examined coelacanth diversity [23,31,60], our updated dataset and three non-parametric methods (Chao1, ACE, and iChao1 estimators) provide more precise information on sampling biases and evolutionary patterns. The Devonian peak likely stems from early radiation, whereas the Early and Middle Triassic peaks may represent genuine diversity highs, which is supported by morphological innovations. The Late Jurassic peak, however, may reflect preservation bias (e.g., exceptional preservation) rather than true diversity.
We analyzed the reasons for the incompleteness of the coelacanth fossil record, including (1) insufficient sampling, especially outside North America and Europe; (2) incomplete rock records, such as the scarcity of Permian marine strata; (3) habitat factors, such as the fact that extant coelacanths inhabit moderately deep-sea environments, where low sedimentation rates and sampling challenges limit fossil preservation; and (4) the influence of exceptional preservation, such as Lagerstätten, which may introduce bias in diversity assessments.
On the basis of these findings, future research should focus on the following areas. (1) Filling fossil record gaps: prioritize periods with sparse records (e.g., Devonian, Permian, and Jurassic) and enhancing fossil excavation and research in Asia, South America, and Oceania to supplement existing data. (2) Correcting for sampling bias: address sampling biases across geological periods and regions to assess coelacanth diversity changes more objectively. (3) Expanding phylogenetic analysis: include more genera in phylogenetic studies and integrate geological range data to better understand coelacanth evolutionary history. (4) Integrating multidisciplinary approaches: combine paleoecology, biogeography, and other disciplines for a comprehensive understanding of their evolution.

Supplementary Materials

The following supporting information can be downloaded at: https://www.mdpi.com/article/10.3390/fossils3030010/s1, S1: List of named and valid coelacanth species; S2: Time range of genus and species; S3: Localities of extinct and living coelacanths; S4: Number of specimens of coelcanthus; S5: Manuelli et al. (2024) [28] Phylogenetic tree with geoscale; S6: Comprehensive list of reported species with taxonomic authorities and localities.

Author Contributions

Conceptualization, L.C. and Z.Y.; methodology, Z.Y.; software, Z.Y.; validation, Z.Y.; formal analysis, Z.Y.; investigation, Z.Y.; resources, Z.Y.; data curation, Z.Y.; visualization, Z.Y.; supervision, L.C. and H.S.; project administration, L.C. and H.S.; funding acquisition, L.C. and H.S.; writing—original draft preparation, L.C., Z.Y. and H.S.; writing—review and editing, L.C., Z.Y. and H.S. All authors have read and agreed to the published version of the manuscript.

Funding

This study was supported by the National Natural Science Foundation of China (42325202), Natural Science Foundation of Hubei (2023AFA006), and by the project ‘Burst and Stasis in morphological evolution of Mesozoic coelacanths’ funded by the Swiss National Science Foundation (200021_207903).

Acknowledgments

We would like to thank reviewers for their constructive comments, editor Michel Laurin for their editorial work on this article, as well as Elias Samankassou for welcoming Z.Y. at the Department of Earth Sciences of the University of Geneva.

Conflicts of Interest

The authors declare no conflict of interest.

References

  1. Darwin, C. On the Origin of the Species by Means of Natural Selection, or the Preservation of Favoured Races in the Struggle for Life; John Murray: London, UK, 1859. [Google Scholar]
  2. Behrensmeyer, A.K.; Kidwell, S.M. Taphonomy’s Contributions to Paleobiology. Paleobiology 1985, 11, 105–119. [Google Scholar]
  3. Allison, P.A.; Bottjer, D.J. Taphonomy: Bias and Process Through Time. In Taphonomy; Allison, P.A., Bottjer, D.J., Eds.; Topics in Geobiology; Springer: Dordrecht, The Netherlands, 2010; Volume 32, pp. 1–17. [Google Scholar] [CrossRef]
  4. Smith, A.B.; McGowan, A.J. The Shape of the Phanerozoic Marine Palaeodiversity Curve: How Much Can Be Predicted from the Sedimentary Rock Record of Western Europe? Palaeontology 2007, 50, 765–774. [Google Scholar] [CrossRef]
  5. Raup, D.M. Taxonomic Diversity during the Phanerozoic: The Increase in the Number of Marine Species since the Paleozoic May Be More Apparent than Real. Science 1972, 177, 1065–1071. [Google Scholar] [CrossRef] [PubMed]
  6. Kidwell, S.M.; Holland, S.M. The Quality of the Fossil Record: Implications for Evolutionary Analyses. Annu. Rev. Ecol. Syst. 2002, 33, 561–588. [Google Scholar] [CrossRef]
  7. Smith, A. Large-Scale Heterogeneity of the Fossil Record: Implications for Phanerozoic Biodiversity Studies. Philos. Trans. R. Soc. B Biol. Sci. 2001, 356, 351–367. [Google Scholar] [CrossRef]
  8. Benton, M.J. Diversification and Extinction in the History of Life. Science 1995, 268, 52–58. [Google Scholar] [CrossRef]
  9. Kidwell, S.M.; Flessa, K.W. The Quality of the Fossil Record: Populations, Species, and Communities. Annu. Rev. Ecol. Syst. 1995, 26, 269–299. [Google Scholar] [CrossRef]
  10. Friedman, M.; Sallan, L.C. Five Hundred Million Years of Extinction and Recovery: A Phanerozoic Survey of Large-Scale Diversity Patterns in Fishes. Palaeontology 2012, 55, 707–742. [Google Scholar] [CrossRef]
  11. Guinot, G.; Adnet, S.; Cappetta, H. An Analytical Approach for Estimating Fossil Record and Diversification Events in Sharks, Skates, and Rays. PLoS ONE 2012, 7, e44632. [Google Scholar] [CrossRef]
  12. Cleary, T.J.; Moon, B.C.; Dunhill, A.M.; Benton, M.J. The Fossil Record of Ichthyosaurs, Completeness Metrics and Sampling Biases. Palaeontology 2015, 58, 521–536. [Google Scholar] [CrossRef]
  13. Mannion, P.D.; Upchurch, P. Completeness Metrics and the Quality of the Sauropodomorph Fossil Record through Geological and Historical Time. Paleobiology 2010, 36, 283–302. [Google Scholar] [CrossRef]
  14. Benton, M.J.; Ruta, M.; Dunhill, A.M.; Sakamoto, M. The First Half of Tetrapod Evolution, Sampling Proxies, and Fossil Record Quality. Palaeogeogr. Palaeoclimatol. Palaeoecol. 2013, 372, 18–41. [Google Scholar] [CrossRef]
  15. Brocklehurst, N.; Upchurch, P.; Mannion, P.D.; O’Connor, J. The Completeness of the Fossil Record of Mesozoic Birds: Implications for Early Avian Evolution. PLoS ONE 2012, 7, e39056. [Google Scholar] [CrossRef] [PubMed]
  16. Lloyd, G.T.; Friedman, M. A Survey of Palaeontological Sampling Biases in Fishes Based on the Phanerozoic Record of Great Britain. Palaeogeogr. Palaeoclimatol. Palaeoecol. 2013, 372, 5–17. [Google Scholar] [CrossRef]
  17. Henderson, S.; Dunne, E.M.; Fasey, S.A.; Giles, S. The Early Diversification of Ray-finned Fishes (Actinopterygii): Hypotheses, Challenges, and Future Prospects. Biol. Rev. Camb. Philos. Soc. 2023, 98, 284–315. [Google Scholar] [CrossRef]
  18. Huxley, T.H. Illustrations of the Structure of the Crossopterygian Ganoids; Longmans, Green, Reader, & Dyer: London, UK, 1866. [Google Scholar]
  19. Simpson, G.G. Tempo and Mode in Evolution; Columbia University Press: New York, NY, USA, 1944. [Google Scholar] [CrossRef]
  20. Agassiz, L. Recherches sur les Poissons Fossiles; Petitpierre et Prince: Neuchâtel, Switzerland, 1839; Volume 2. [Google Scholar]
  21. Smith, J.L. A Living Fish of Mesozoic Type. Nature 1939, 143, 455–456. [Google Scholar] [CrossRef]
  22. Schaeffer, B. A Revision of Coelacanthus Newarki and Notes on the Evolution of the Girdles and Basal Plates of the Median Fins in the Coelacanthini; The American Museum of Natural History: New York, NY, USA, 1941; No. 1110. [Google Scholar]
  23. Cloutier, R. Patterns, Trends, and Rates of Evolution within the Actinistia. In The Biology of Latimeria chalumnae and Evolution of Coelacanths; Springer: Berlin/Heidelberg, Germany, 1991; pp. 23–58. [Google Scholar]
  24. Forey, P. The Coelacanth as a Living Fossil. In Living Fossils; Springer: Berlin/Heidelberg, Germany, 1984; pp. 166–169. [Google Scholar]
  25. Forey, P. Golden Jubilee for the Coelacanth Latimeria chalumnae. Nature 1988, 336, 727–732. [Google Scholar] [CrossRef]
  26. Clement, A.M.; Cloutier, R.; Lee, M.S.Y.; King, B.; Vanhaesebroucke, O.; Bradshaw, C.J.A.; Dutel, H.; Trinajstic, K.; Long, J.A. A Late Devonian Coelacanth Reconfigures Actinistian Phylogeny, Disparity, and Evolutionary Dynamics. Nat. Commun. 2024, 15, 7529. [Google Scholar] [CrossRef]
  27. Cavin, L.; Tong, H.; Buffetaut, E.; Wongko, K.; Suteethorn, V.; Deesri, U. The First Fossil Coelacanth from Thailand. Diversity 2023, 15, 286. [Google Scholar] [CrossRef]
  28. Manuelli, L.; Mondéjar Fernández, J.; Dollman, K.; Jakata, K.; Cavin, L. The Most Detailed Anatomical Reconstruction of a Mesozoic Coelacanth. PLoS ONE 2024, 19, e0312026. [Google Scholar] [CrossRef]
  29. Ferrante, C.; Cavin, L. Early Mesozoic Burst of Morphological Disparity in the Slow-Evolving Coelacanth Fish Lineage. Sci. Rep. 2023, 13, 11356. [Google Scholar] [CrossRef] [PubMed]
  30. Toriño, P.; Gausden, S.F.; Etches, S.; Rankin, K.; Marshall, J.E.; Gostling, N.J. An Enigmatic Large Mawsoniid Coelacanth (Sarcopterygii, Actinistia) from the Upper Jurassic Kimmeridge Clay Formation of England. J. Vertebr. Paleontol. 2022, 42, e2125813. [Google Scholar] [CrossRef]
  31. Toriño, P.; Soto, M.; Perea, D. A Comprehensive Phylogenetic Analysis of Coelacanth Fishes (Sarcopterygii, Actinistia) with Comments on the Composition of the Mawsoniidae and Latimeriidae: Evaluating Old and New Methodological Challenges and Constraints. Hist. Biol. 2021, 33, 3423–3443. [Google Scholar] [CrossRef]
  32. Ferrante, C.; Menkveld-Gfeller, U.; Cavin, L. The First Jurassic Coelacanth from Switzerland. Swiss J. Palaeontol. 2022, 141, 15. [Google Scholar] [CrossRef]
  33. Forey, P.L.; Cloutier, R. Literature Relating to Fossil Coelacanths. In The Biology of Latimeria chalumnae and Evolution of Coelacanths; Springer: Berlin/Heidelberg, Germany, 1991; pp. 391–402. [Google Scholar]
  34. Kadarusman; Sugeha, H.Y.; Pouyaud, L.; Hocdé, R.; Hismayasari, I.B.; Gunaisah, E.; Paradis, E. A Thirteen-Million-Year Divergence Between Two Lineages of Indonesian Coelacanths. Sci. Rep. 2020, 10, 192. [Google Scholar] [CrossRef]
  35. Hammer, Ø.; Harper, D.A. Past: Paleontological Statistics Software Package for Education and Data Analysis. Palaeontol. Electron. 2001, 4, 4. [Google Scholar]
  36. Bapst, D.W. paleotree: An R Package for Paleontological and Phylogenetic Analyses of Evolution. Methods Ecol. Evol. 2012, 3, 803–807. [Google Scholar] [CrossRef]
  37. Bell, M.A.; Lloyd, G.T. strap: An R Package for Plotting Phylogenies Against Stratigraphy and Assessing Their Stratigraphic Congruence. Palaeontology 2014, 58, 379–389. [Google Scholar] [CrossRef]
  38. R Core Team. R: A Language and Environment for Statistical Computing; R Foundation for Statistical Computing: Vienna, Austria, 2020; Available online: https://www.R-project.org/ (accessed on 15 June 2024).
  39. Agassiz, L. Abgerissene Bemerkungen Über Fossile Fische. Neues Jahrb. Mineral. Geogn. Geol. Petrefaktenkunde 1834, 1834, 379–390. [Google Scholar]
  40. Reis, O.M. Die Coelacanthinen mit besonderer Berücksichtigung der im Weißen Jura Bayerns vorkommenden Gattungen. Palaeontographica 1888, 35, 1–96. [Google Scholar]
  41. Stensiö, E.A. Triassic Fishes from Spitzbergen; A. Holzhausen: Vienna, Austria, 1921. [Google Scholar] [CrossRef]
  42. Renesto, S.; Kustatscher, E. A Coelacanth Fish from the Anisian (Middle Triassic) of the Dolomites. Riv. Ital. Paleontol. Stratigr. 2019, 125. [Google Scholar] [CrossRef]
  43. Newberry, J.S. Description of Several New Genera and Species of Fossil Fishes from the Carboniferous Strata of Ohio. Proc. Acad. Nat. Sci. USA 1856, 8, 96–100. [Google Scholar]
  44. Stensiö, E.A. Triassic Fishes from East Greenland. Meddelelser Grønland Cph. 1932, 83, 1–305. [Google Scholar]
  45. Lund, R.; Lund, W. New Genera and Species of Coelacanths from the Bear Gulch Limestone (Lower Carboniferous) of Montana (USA). Geobios 1984, 17, 237–244. [Google Scholar] [CrossRef]
  46. Broom, R. On a Species of Coelacanthus from the Upper Beaufort Beds of Aliwal North. Rec. Albany Mus. Grahamst. 1905, 1, 338–339. [Google Scholar]
  47. Moy-Thomas, J.A. The Coelacanth Fishes from Madagascar. Geol. Mag. 1935, 72, 213–227. [Google Scholar] [CrossRef]
  48. Clément, G. The Actinistian (Sarcopterygii) Piveteauia madagascariensis Lehman from the Lower Triassic of Northwestern Madagascar: A Redescription on the Basis of New Material. J. Vertebr. Paleontol. 1999, 19, 234–242. [Google Scholar] [CrossRef]
  49. Yabumoto, Y.; Brito, P.M.; Iwata, M.; Abe, Y. A New Triassic Coelacanth, Whiteia uyenoteruyai (Sarcopterygii, Actinistia) from Madagascar and Paleobiogeography of the Family Whiteiidae. Bull. Kitakyushu Mus. Nat. Hist. Hum. Hist. Ser. A (Nat. Hist.) 2019, 17, 15–27. [Google Scholar]
  50. Woodward, A.S. Some New and Little-Known Upper Cretaceous Fishes from Mount Lebanon. Ann. Mag. Nat. Hist. 1942, 9, 537–568. [Google Scholar] [CrossRef]
  51. Yabumoto, Y. A New Coelacanth from the Early Cretaceous of Brazil (Sarcopterygii, Actinistia). Paleontol. Res. 2002, 6, 343–350. [Google Scholar] [CrossRef]
  52. Maisey, J.G. Coelacanths from the Lower Cretaceous of Brazil; American Museum of Natural History: New York, NY, USA, 1986; p. 32. [Google Scholar]
  53. Arratia, G.; Schultze, H.P. A New Fossil Actinistian from the Early Jurassic of Chile and Its Bearing on the Phylogeny of Actinistia. J. Vertebr. Paleontol. 2015, 35, e983524. [Google Scholar] [CrossRef]
  54. Liu, H.T. A New Coelacanth from the Marine Lower Triassic of NW Kwangsi, China. Vertebr. Palasiat. 1964, 8, 211–214. (In Chinese) [Google Scholar]
  55. Wang, N.; Liu, H.T. Coelacanth Fishes from the Marine Permian of Zhejiang, South China. Vertebr. Palasiat. 1981, 19, 305. [Google Scholar]
  56. Wen, W.; Zhang, Q.-Y.; Hu, S.-X.; Benton, M.J.; Zhou, C.-Y.; Tao, X.; Huang, J.-Y.; Chen, Z.-Q. Coelacanths from the Middle Triassic Luoping Biota, Yunnan, South China, with the Earliest Evidence of Ovoviviparity. Acta Palaeontol. Pol. 2013, 58, 175–193. [Google Scholar] [CrossRef]
  57. Long, J.A. A New Genus of Fossil Coelacanth (Osteichthyes: Coelacanthiformes) from the Middle Devonian of Southeastern Australia. Rec. West. Aust. Mus. Suppl. 1999, 57, 37–53. [Google Scholar]
  58. Johanson, Z.; Long, J.A.; Talent, J.A.; Janvier, P.; Warren, J.W. Oldest coelacanth, from the Early Devonian of Australia. Biol. Lett. 2006, 2, 443–446. [Google Scholar] [CrossRef]
  59. Pouyaud, L.; Wirjoatmodjo, S.; Rachmatika, I.; Tjakrawidjaja, A.; Hadiaty, R.; Hadie, W. A New Species of Coelacanth. C. R. L’acad. Sci.—Ser. III—Sci. Vie 1999, 322, 261–267. [Google Scholar] [CrossRef]
  60. Forey, P. History of the Coelacanth Fishes; Springer Science & Business Media: Berlin/Heidelberg, Germany, 1998. [Google Scholar]
  61. Zhu, M.; Yu, X.B. A Primitive Fish Close to the Common Ancestor of Tetrapods and Lungfish. Nature 2002, 418, 767–770. [Google Scholar] [CrossRef]
  62. Cavin, L.; Valentin, X.; Garcia, G. A New Mawsoniid Coelacanth (Actinistia) from the Upper Cretaceous of Southern France. Cretac. Res. 2016, 62, 65–73. [Google Scholar] [CrossRef]
  63. Mawson, J.; Woodward, A.S. On the Cretaceous Formation of Bahia (Brazil), and on Vertebrate Fossils Collected Therein. Q. J. Geol. Soc. 1907, 63, 128. [Google Scholar] [CrossRef]
  64. Aureliano, T.; Ghilardi, A.M.; Duque, R.R.C.; Barreto, A.M.F. On the Occurrence of Pterosauria in Exu, Pernambuco (Lower Cretaceous Romualdo Formation, Araripe Basin), Northeastern Brazil. Estud. Geológicos 2014, 24, 15. [Google Scholar] [CrossRef]
  65. Schluter, D. The Ecology of Adaptive Radiation; Oxford University Press: Oxford, UK, 2000. [Google Scholar]
  66. Schultze, H.-P. Crossopterygier mit Heterozerker Schwanzflosse aus dem Oberdevon Kanadas, Nebst einer Beschreibung von Onychodontida-Resten aus Dem Mitteldevon Spaniens und aus dem Karbon der USA. Palaeontogr. Abt. A 1973, 188, 188–208. [Google Scholar]
  67. Forey, P.L.; Ahlberg, P.E.; Lukševičs, E.; Zupinš, I. A New Coelacanth from the Middle Devonian of Latvia. J. Vertebr. Paleontol. 2000, 20, 243–252. [Google Scholar] [CrossRef]
  68. Friedman, M.; Coates, M. A Newly Recognized Fossil Coelacanth Highlights the Early Morphological Diversification of the Clade. Proc. R. Soc. B Biol. Sci. 2006, 273, 245–250. [Google Scholar] [CrossRef]
  69. Wendruff, A.J.; Wilson, M.V. A Fork-Tailed Coelacanth, Rebellatrix divaricerca, gen. et sp. nov. (Actinistia, Rebellatricidae, fam. nov.), from the Lower Triassic of Western Canada. J. Vertebr. Paleontol. 2012, 32, 499–511. [Google Scholar] [CrossRef]
  70. Cavin, L.; Mennecart, B.; Obrist, C.; Costeur, L.; Furrer, H. Heterochronic Evolution explains novel body shape in a Triassic Coelacanth from Switzerland. Sci. Rep. 2017, 7, 13695. [Google Scholar] [CrossRef]
  71. Dai, X.; Davies, J.H.F.L.; Yuan, Z.; Brayard, A.; Ovtcharova, M.; Xu, G.; Liu, X.; Smith, C.P.A.; Schweitzer, C.E.; Li, M.; et al. A Mesozoic Fossil Lagerstätte from 250.8 Million Years Ago Shows a Modern-Type Marine Ecosystem. Science 2023, 379, 567–572. [Google Scholar] [CrossRef]
  72. Clément, G. A New Coelacanth (Actinistia, Sarcopterygii) from the Jurassic of France, and the Question of the Closest Relative Fossil to Latimeria. J. Vertebr. Paleontol. 2005, 25, 481–491. [Google Scholar] [CrossRef]
  73. Eastman, C.R. Catalogue of the Fossil Fishes in the Carnegie Museum. Part III. Catalogue of the Fossil Fishes from the Lithographic Stone of Cerin, France. Mem. Carnegie Mus. 1914, 6, 349–388. [Google Scholar]
  74. Lambers, P. On the Ichthyofauna of the Solnhofen Lithographic Limestone (Upper Jurassic, Germany); Rijksuniversiteit: Groningen, The Netherlands, 1992. [Google Scholar]
  75. Villalobos-Segura, E.; Stumpf, S.; Türtscher, J.; Jambura, P.L.; Begat, A.; López-Romero, F.A.; Fischer, J.; Kriwet, J. A Synoptic Review of the Cartilaginous Fishes (Chondrichthyes: Holocephali, Elasmobranchii) from the Upper Jurassic Konservat-Lagerstätten of Southern Germany: Taxonomy, Diversity, and Faunal Relationships. Diversity 2023, 15, 386. [Google Scholar] [CrossRef]
  76. Jain, S.L. Indocoelacanthus robustus n. gen., n. sp. (Coelacanthidae, Lower Jurassic), the First Fossil Coelacanth from India. J. Paleontol. 1974, 48, 49–62. [Google Scholar]
  77. Woodward, A.S. Catalogue of the Fossil Fishes in the British Museum (Natural History); Trustees of the British Museum: London, UK, 1895. [Google Scholar]
  78. Benton, M.J.; Emerson, B.C. How Did Life Become So Diverse? The Dynamics of Diversification According to the Fossil Record and Molecular Phylogenetics. Palaeontology 2007, 50, 23–40. [Google Scholar] [CrossRef]
  79. Ye, S.; Peters, S.E. Bedrock Geological Map Predictions for Phanerozoic Fossil Occurrences. Paleobiology 2023, 49, 394–413. [Google Scholar] [CrossRef]
  80. Meyers, S.R.; Peters, S.E. A 56 Million Year Rhythm in North American Sedimentation during the Phanerozoic. Earth Planet. Sci. Lett. 2011, 303, 174–180. [Google Scholar] [CrossRef]
  81. Peters, S.E.; Husson, J.M. Sediment Cycling on Continental and Oceanic Crust. Geology 2017, 45, 323–326. [Google Scholar] [CrossRef]
  82. Brito, P.M. Description of Aspidorhynchus arawaki from the Late Jurassic of Cuba (Actinopterygii: Halecostomi). Mesoz. Fishes 1999, 2, 239–248. [Google Scholar]
  83. Holland, S.M. The Non-Uniformity of Fossil Preservation. Philos. Trans. R. Soc. B Biol. Sci. 2016, 371, 20150130. [Google Scholar] [CrossRef]
  84. Li, Q.; Liu, Y.; Li, G.; Wang, Z.; Zheng, Z.; Sun, Y.; Lei, N.; Li, Q.; Zhang, W. Review of the Impact of Whale Fall on Biodiversity in Deep-Sea Ecosystems. Front. Ecol. Evol. 2022, 10, 885572. [Google Scholar] [CrossRef]
  85. Curray, J.R.; Moore, D.G. Sedimentary and Tectonic Processes in the Bengal Deep-Sea Fan and Geosyncline. In The Geology of Continental Margins; Burk, C.A., Drake, C.L., Eds.; Springer: Berlin/Heidelberg, Germany, 1974; pp. 617–627. [Google Scholar] [CrossRef]
  86. Sibert, E.C.; Norris, R.D. New Age of Fishes Initiated by the Cretaceous-Paleogene Mass Extinction. Proc. Natl. Acad. Sci. USA 2015, 112, 8537–8542. [Google Scholar] [CrossRef]
  87. Allison, P.A.; Briggs, D.E.G. Exceptional Fossil Record: Distribution of Soft-Tissue Preservation through the Phanerozoic. Geology 1993, 21, 527–530. [Google Scholar] [CrossRef]
  88. Münster, G. von Beitrag Zur Kenntniss Einiger Neuen Seltenen Versteinerungen Aus Den Lithographischen Schiefern in Baiern. Neues Jahrb. Mineral. Geogn. Geol. Petrefakten-Kunde 1842, 1842, 35–46. [Google Scholar]
Figure 1. Temporal trends in publications on extant and extinct coelacanth fossils. (A) displays the annual count of publications related to fossil coelacanths from 1839 to 2024, as identified via Google Scholar (brown bars), reflecting the overall research interest over time. (B) focuses on the period from 1839 to 1991, comparing two datasets: the number of publications retrieved through Google Scholar (orange curve) and the number of taxonomic studies compiled by Forey and Cloutier (1991) [33] (blue curve). This comparison highlights potential underrepresentation of early literature in digital databases and contrasts general research attention with specialized taxonomic investigations. (C): specimen of Libys sp., from Ferrante et al. (2022) [32]. (D): Latimeria chalumnae, specimen, Natural History Museum of Nantes. Wikimedia Commons. Available at https://commons.wikimedia.org/wiki/File:Latimeria_Paris.jpg, accessed on 7 May 2025.
Fossstud 03 00010 g001
Figure 2. Continental distribution of cumulative coelacanth species discoveries. (A) Africa; (B) Asia; (C) Europe; (D) North America; (E) South America; (F) Oceania. X-axis: year; Y-axis: species count.
Fossstud 03 00010 g002
Figure 3. Cumulative record of coelacanth species discoveries across continents.
Fossstud 03 00010 g003
Figure 4. Global distribution of fossil coelacanths and extant coelacanth localities. Dots represent fossil finds: green, Paleozoic; blue, Mesozoic; orange, recent.
Fossstud 03 00010 g004
Figure 5. Global distribution of coelacanth fossil localities by geological era and distribution of the extant genus. Each dot represents a coelacanth fossil find or an extant coelacanth capture or sighting. (A) Paleozoic (green dots); (B) Mesozoic (blue dots); (C) recent (orange dots). Marginal histograms show latitude and longitude frequency distributions.
Fossstud 03 00010 g005
Figure 6. Number, area, and density of coelacanth fossil localities by continent. X-axis: continent (EU—Europe; NA—North America; AF—Africa; AS—Asia; SA—South America; OC—Oceania); left Y-axis: number of localities; right Y-axis: Locality density. Blue bars: number of localities; orange bars: “Area” (used for density calculation); black line: locality density (number of localities/”Area”).
Fossstud 03 00010 g006
Figure 7. Coelacanth fossil record and major extinction events. Y-axis: geological period; X-axis: fossil record. Gray bars: coelacanth fossil record (stratigraphic ranges of species); red dashed lines: extinction events (F-F: Frasnian–Famennian, P-T: Permian–Triassic, T-J: Triassic–Jurassic, K-Pg: Cretaceous–Paleogene). The shown durations reflect fossil-recorded stratigraphic ranges, not actual species longevity. Note: the records of Rhabdoderma elegans, Garnbergia ommata, Lualabaea henryi, and Rhipis moorseli are partially based on isolated scale specimens.
Fossstud 03 00010 g007
Figure 8. Relationship between coelacanth species number and sample size available in the literature across geological periods (rarefaction curves). X-axis: sample size; Y-axis: number of species. (A): Devonian (D1, D2, D3); (B): Carboniferous (C1, C2); (C): Permian (P3); (D): Triassic (T1, T2, T3); (E): Jurassic (J1, J2, J3); (F): Cretaceous (K1, K2).
Fossstud 03 00010 g008
Figure 9. Coelacanth species diversity estimation across geological time based on sample size. Y-axis: number of species. Black line: Taxa_S (observed); red line: Chao-1; light blue line: iChao-1; blue line: ACE. X-axis: time. Chao-1 estimates species richness based on the number of rare species (singletons and doubletons); iChao-1 refines this estimate by incorporating species observed up to four times, improving accuracy in small or sparse samples; ACE uses all species observed ≤10 times, providing stable estimates for larger datasets. (A) Raw species counts. (B) Time-corrected species counts.
Fossstud 03 00010 g009
Figure 10. Comparison of coelacanth phylogenetic and fossil diversity across geological periods. X-axis: time/geological period (D: Devonian, C: Carboniferous, P: Permian, T: Triassic, J: Jurassic, K: Cretaceous). (A) Blue line: number of genera included in the phylogenetic tree; orange line: phylogenetic diversity based on Manuelli et al. [28]. (B) Blue line: number of genera per million years included in the phylogenetic tree; orange line: phylogenetic diversity per million years based on Manuelli et al. [28]. (C) Blue bars: proportion of genera in the phylogenetic tree relative to all genera. (D) Blue line: records of genera included in the phylogenetic tree; green line: records of all genera.
Fossstud 03 00010 g010
Table 1. Summary of biodiversity metrics across continents. EU: Europe, NA: North America, AF: Africa, AS: Asia, SA: South America, OC: Oceania; ERSD (earliest research start date), Num_Gen (number of genera reported), Num_Sp (number of species reported), Num_Spe/Mkm2 (number of species per million km2).
EUNAAFASSAOC
ERSD183418561905194219071999
Num_Gen5123151563
Num_Sp93673017153
Num_Spe/Mkm29.142.710.980.380.840.35
Paleo_DistConcConcScatScatScatScat
Meso_DistConcConcModModModScat
Table 2. Comparison of coelacanth diversity metrics across geological periods. D: Devonian; C: Carboniferous; P: Permian; T: Triassic; J: Jurassic; K: Cretaceous. Num_Gen_RT: genus count (raw total); Num_Sp: species count; Chao1_Div: Chao1 diversity; iChao1_Div: iChao1 diversity; ACE_Div: ACE diversity; Samp_Size: sample size; Rare_Curve: rarefaction curve; PD_Inc_Gen: phylogenetic diversity of included (genus); PD_Gen: phylogenetic diversity (genus); PD_Inc_Gen/Ma: phylogenetic diversity of included (genus) per million years; PD_Gen/Ma: phylogenetic diversity (genus) per million years; RS: rapidly rising; AP: approaching plateau; PL: plateaued; PD_Gen/Ma_Diff: PD (genus)/Ma/PD (included genus)/Ma; PD_Gen_Diff: PD (genus)/PD (included genus).
D1D2D3C1C2P1P2P3T1T2T3J1J2J3K1K2
Num_Gen_RT357722141413773944
Num_Sp35784104211387217108
Chao1_Div3.56.47.28.54.01.00.04.922.515.59.58.42.026.216.08.0
iChao1_Div3.59.37.38.54.01.00.05.523.817.613.011.32.132.816.08.0
ACE_Div4.211.07.88.74.01.00.05.722.716.911.410.13.127.915.88.0
PD_Inc_Gen1447121298463843
PD_Gen79710443414131115121264
PD_Gen_Diff6533322255799421
PD_Inc_Gen/Ma0.040.380.170.200.040.080.070.261.910.780.110.220.230.480.090.09
PD_Gen/Ma0.270.850.290.280.160.150.220.532.981.270.310.560.910.730.130.12
PD_Gen/Ma_Diff0.230.470.130.080.120.080.150.261.060.490.200.340.680.240.040.03
Samp_Size1219482211972108118784423467127112
Rare_CurveRSRSAPAPPL//RSAPAPAPRSRSRSRSPL
Disclaimer/Publisher’s Note: The statements, opinions and data contained in all publications are solely those of the individual author(s) and contributor(s) and not of MDPI and/or the editor(s). MDPI and/or the editor(s) disclaim responsibility for any injury to people or property resulting from any ideas, methods, instructions or products referred to in the content.

