1. Introduction
Digital food environments increasingly shape how consumers encounter food before eating. Online menus, food delivery platforms, restaurant websites, and social media displays often rely heavily on visual information, although consumers may also use text descriptions, prices, user ratings, ingredient information, dietary labels, videos, and other contextual cues when evaluating food [
1]. Aroma remains one of the least transferable sensory dimensions in digital environments because static images cannot deliver real odours [
2]. This creates an important challenge for digital gastronomy and sensory communication: visual food imagery can suggest freshness, warmth, and eating appeal, but the visual conventions used to communicate aroma require systematic empirical testing [
3].
Research in digital gastronomy and sensory science has examined how visual signals may suggest olfactory experiences when actual smell is absent. Crossmodal-correspondence research shows that people associate visual attributes such as colour, shape, and curvature with taste and smell qualities [
4]. Visual cues may also prompt olfactory imagery and shape expectations about food [
5]. In advertising and packaging, steam lines, wavy marks, and stylised scent puffs are used to suggest freshness, warmth, and flavour intensity [
6]. However, controlled comparisons of multiple visual aroma-symbol designs remain limited, particularly for suitability, perceived smell strength, perceived smell pleasantness, and appetite-related ratings [
7].
This study compared 14 visual aroma-symbol designs applied to a single pasta bolognese image. It asked which complete designs were rated as most suitable, strongest, and most pleasant; which were associated with greater stated willingness to eat and image-evoked hunger; and which perceived smell meanings and emotional responses participants associated with each design. We expected the rating profiles to differ across designs. Because the symbols varied in several visual features at once, the study evaluates complete designs rather than isolating the causal effect of any individual feature.
In this study, visual aroma symbol refers to a graphic sign placed above a food image to suggest expected aroma, steam, or smell-related meaning. Aroma is used for the expected food-related smell communicated by the visual cue. Odour is used only when discussing the absence of a real odour or actual odour perception. Because no real odour was presented, the symbols were visual cues rather than olfactory stimuli.
Digital food communication increasingly depends on images, yet aroma remains one of the least transferable sensory dimensions in digital environments. While food images can suggest freshness, warmth, and eating appeal, the visual conventions used to communicate aroma have rarely been tested systematically [
8]. This creates a practical and theoretical gap: designers frequently use steam-like or scent-like graphics, but limited evidence shows which visual aroma-symbol designs are actually perceived as suitable, strong, pleasant, or appetite-supporting in a controlled food-image context [
9].
The literature review is selective rather than systematic and is used to frame the behavioural and perceptual problem of visual aroma communication in digital food-image contexts. The available literature does not yet provide sufficient evidence across cultures, cuisines, food categories, colour designs, or animated aroma symbols.
2. Literature Review
Digital environments increasingly shape how consumers encounter food through delivery platforms, menus, restaurant websites, and social media [
10]. These settings are strongly visual but not exclusively so: consumers may also consider descriptions, prices, ratings, ingredients, dietary labels, videos, and other contextual information. The absence of real odour in many digital settings has prompted interest in how visual information may suggest aroma-related expectations [
11,
12]. This work forms part of a broader literature on visual–olfactory and other crossmodal correspondences [
13].
Visual food imagery can contribute to expectations of quality, taste, and flavour through colour, shape, and presentation [
14]. Research in online food contexts also suggests that visual design elements can alter perceived freshness, temperature, and nutritional value [
15]. Steam lines and wavy scent marks may communicate warmth or novelty and can affect the attractiveness of depicted foods [
6]. Most studies, however, have examined one symbol category or a small set of cues, leaving broader comparisons of complete visual aroma-symbol designs underexplored.
Visual aroma symbols may be interpreted through crossmodal correspondences or systematic associations between attributes in different sensory modalities [
16]. People associate visual features such as shape, curvature, colour, and brightness with taste and smell qualities [
17]. Evidence for visual–odour correspondences is less extensive than for visual–taste correspondences, but rounded forms have been linked with softer or sweeter odours and angular forms with sharper or more pungent odours [
18]. Wavy lines, steam marks, and upward curves may also suggest rising steam or diffusing aroma and thereby support expectations of warmth, freshness, or flavour intensity [
5].
A related study concerns visually induced olfactory imagery, in which visual stimuli prompt mental representations of smell. Such imagery may be more likely when the visual cue is familiar from real-world events [
7]. For example, steam rising from a hot dish can suggest warmth and aroma even when no actual odour is present [
5]. The present study did not measure neural activity or real odour perception; it tested self-reported responses to visual designs.
Although olfactory imagery research may discuss mental simulation and neural mechanisms, the present study was behavioural and survey-based. It did not measure neural activation, olfactory-cortex response, physiological response, or real odour perception.
Visual food cues can shape appetite-related responses. Food images may prompt physiological and psychological reactions associated with hunger or desire to eat even when real food is absent [
19], and these responses may vary with image resolution, colour saturation, composition, and realism [
20]. The specific contribution of visual aroma symbols remains less well established. Comparing multiple designs under the same food-image conditions can therefore clarify whether their rating profiles differ.
Digital menus provide one practical setting in which visual symbolism can be used [
21]. Eye-tracking research shows that images, icons, and symbols can affect how attention is allocated during menu viewing [
22]. Biometric methods such as heart-rate variability, skin conductance, and facial electromyography have also been used to examine emotional engagement with food presentations [
23]. These methods could extend future visual aroma-symbol research, but the present study concerns self-reported visual perception rather than actual choice or physiological response.
The present study addresses this gap by comparing 14 visual aroma-symbol designs applied to the same pasta bolognese image [
6]. It examines perceived suitability, smell strength, smell pleasantness, willingness to eat, image-evoked hunger, image-evoked fullness, and categorical associations. The study was exploratory: it compared complete symbol designs and did not isolate the causal effect of direction, curvature, stroke number, or any other individual visual feature.
3. Materials and Methods
3.1. Study Design
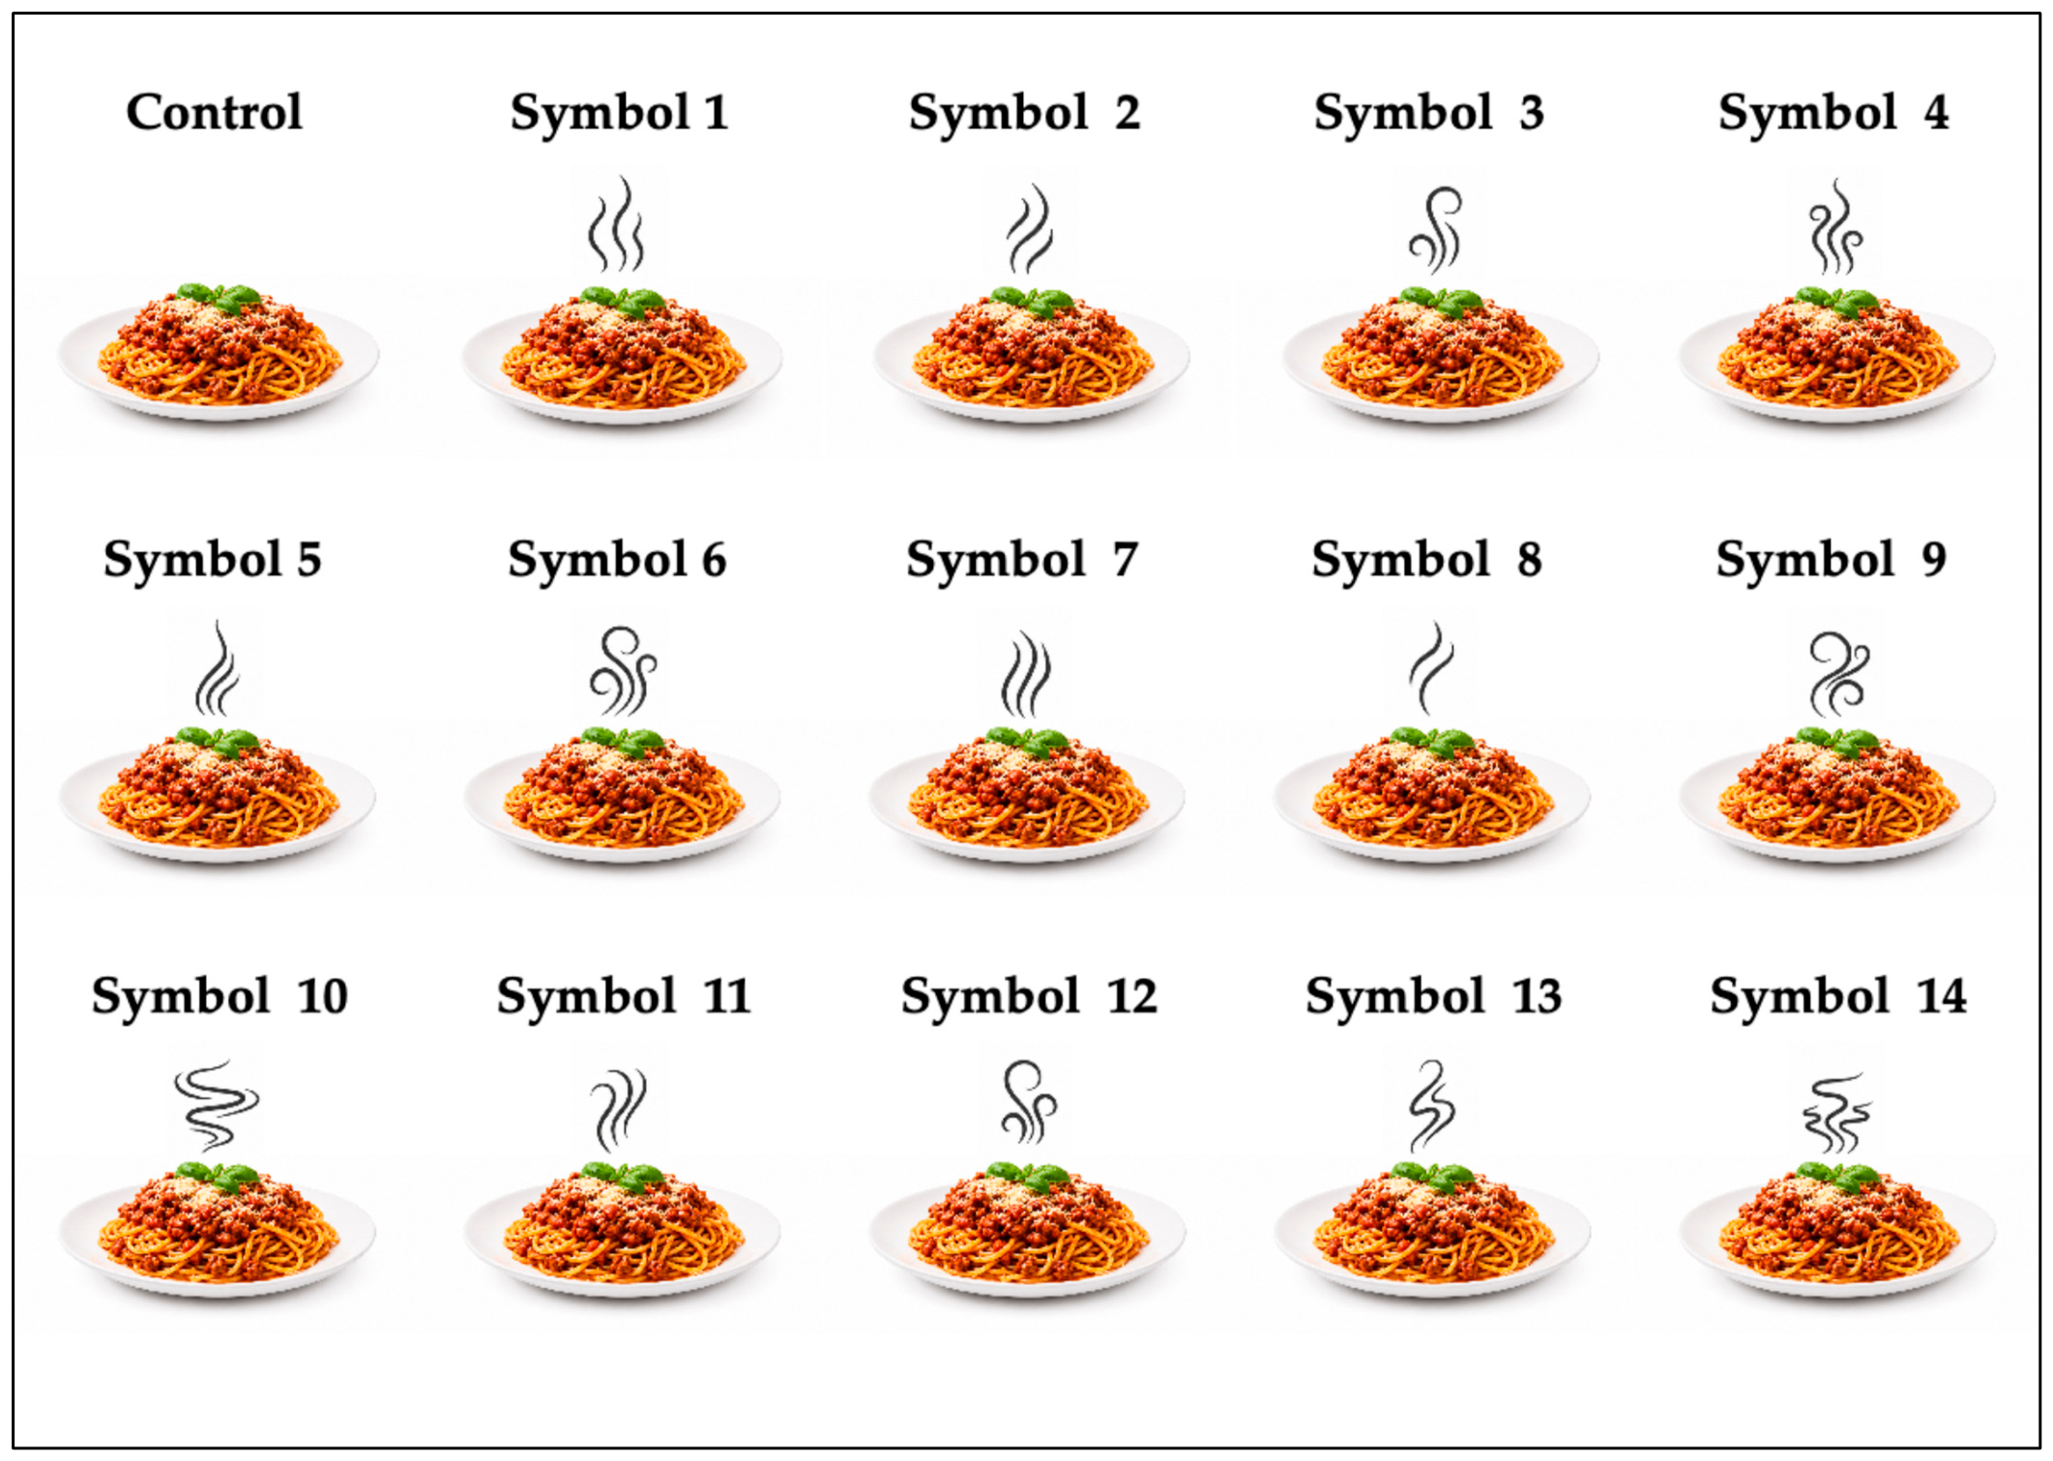
The study used a repeated-measures visual perception design. Each participant evaluated one no-symbol control image and all 14 visual aroma-symbol conditions based on the same pasta bolognese image. The original internal labels were Odour 1 to Odour 14, but the manuscript reports them as Symbol 1 to Symbol 14 because no real odour was presented (
Figure 1).
A single pasta bolognese image was used to keep the food type, plate, background, portion appearance, and image composition constant while the visual aroma symbol changed. The primary repeated-measures analyses included only the 14 visual aroma-symbol conditions. The no-symbol image was retained as a descriptive baseline because symbol-specific measures such as suitability had no meaningful control equivalent. The symbols differed simultaneously in stroke number, orientation, curvature, complexity, symmetry, relative size, and apparent motion. The study therefore compares complete visual aroma-symbol designs and does not isolate the causal effect of any single visual feature.
The base pasta bolognese image and visual aroma-symbol stimuli were prepared for the present study. No real odour was delivered or manipulated. The exported study materials did not document participant-specific randomisation or counterbalancing, device type, screen calibration, exposure time, or whether respondents could return to earlier images. Because participants evaluated many similar images, fatigue, learning, order effects, or automatic responding may have influenced the ratings. These procedural factors are considered when interpreting the magnitude of the observed differences.
3.2. Participants
After exclusion of one pilot/test response, the final analysed sample included 366 valid participants. The sample had a mean age of 27.92 years (SD = 8.37, range 19–55). Participant characteristics, including gender, age, nationality, baseline hunger, expected hunger, and pasta-consumption frequency, are summarised in
Table 1.
The study was administered online using Google Forms under the title ‘Which Smell Looks Strongest? A Food Image Perception Study’ (
Supplementary Material). The instructions indicated a completion time of approximately 25–30 min and stated that the survey was suitable for people who consume beef or meat-based dishes because the images showed pasta with meat sauce. Participation was voluntary and anonymous, and no personally identifiable information was collected. Participants provided consent by selecting ‘I agree to participate in this study’ before continuing.
3.3. Questionnaire Structure
The questionnaire had three sequential parts: baseline hunger and meal timing, a no-symbol control image, and a visual aroma-symbol component repeated for all 14 symbol conditions. Participants viewed many similar pasta images and rated what each symbol represented, how appetising the food looked, how strong and pleasant the implied smell appeared, and how the image affected hunger, fullness, and stated willingness to eat. The exported materials did not establish whether image order was randomised or counterbalanced, or document exposure time, device and screen conditions, or backward navigation. Possible fatigue, learning, order effects, and automatic responding are therefore treated as limitations.
Baseline hunger and expected hunger three hours later were measured using a 0–10 Hunger-Satiety Scale, where lower values indicated greater hunger and higher values indicated greater fullness. Time since last meal was collected using four categories: less than 1 h ago, 1 to 2 h ago, 2 to 4 h ago, and more than 4 h ago.
For the no-symbol control image, participants rated appetising appearance, expected odour intensity, willingness to eat, image-evoked hunger, and image-evoked fullness.
For the visual aroma-symbol conditions, participants evaluated symbol meaning, perceived smell pleasantness, perceived smell strength, whether the symbol made the pasta look more appetising, appetite-increase intensity where applicable, reasons for no appetite increase, emotional association, willingness to eat, image-evoked hunger, image-evoked fullness, and overall suitability for representing food aroma.
The questionnaire was developed for the present visual perception study and implemented through Google Forms. The full item wording and response formats are provided in the
Supplementary Materials. Formal psychometric validation of the complete questionnaire was not documented in the available study materials; therefore, the questionnaire should be interpreted as a study-specific instrument rather than as a validated psychometric scale.
3.4. Main Quantitative Variables
The principal dependent variables were suitability, perceived smell strength, perceived smell pleasantness, willingness to eat, image-evoked hunger, and image-evoked fullness. Suitability assessed how appropriate each symbol appeared for representing food aroma. Perceived smell strength and pleasantness concerned the expected qualities suggested by the visual cue. Willingness to eat was a stated intention, not observed behaviour. Image-evoked hunger and fullness captured self-reported appetite-related responses to the image.
A secondary descriptive variable, increased appetite, followed a conditional structure. Participants first answered whether the visual aroma symbol made the pasta look more appetising. The follow-up intensity rating applied only to participants who answered yes and was therefore kept separate from the six main continuous outcomes.
3.5. Categorical Measures
Categorical questions captured three aspects of symbol interpretation. Participants selected one smell-meaning response and one emotional-response category for each symbol. If a symbol did not increase appetite, the follow-up question allowed one or more reasons to be selected. Responses were coded as present or absent by participant and symbol for frequency summaries, Cochran’s Q tests, and correspondence analysis. These items describe perceived semantic and emotional associations with the visual cue and do not indicate real odour perception. Exact wording and response formats are provided in
Supplementary Table S1.
3.6. Statistical Analysis
The study followed a repeated-measures design because each participant evaluated all 14 visual aroma-symbol conditions. Separate one-factor repeated-measures analyses of variance were conducted for suitability, perceived smell strength, perceived smell pleasantness, willingness to eat, image-evoked hunger, and image-evoked fullness. Visual aroma-symbol condition was the 14-level within-subject factor, and participant was the repeated subject. Thus, the unit of inference was the repeated rating nested within participant rather than 5124 independent observations. Type III sums of squares were used. Sphericity was assessed using Mauchly’s test; Greenhouse–Geisser-corrected degrees of freedom and p values were used when the assumption was violated. Estimated marginal means and model-based standard errors were calculated for each condition. Tukey HSD-adjusted post hoc comparisons and compact letter groupings were based on the repeated-measures error term, with the highest mean group labelled ‘a’. Partial eta squared (ηp2) was reported as the omnibus effect size. The total number of symbol-level ratings is reported descriptively, but statistical inference accounts for the repeated evaluations from each participant.
The primary repeated-measures analyses included only the 14 visual aroma-symbol conditions. The no-symbol control image was retained as a descriptive baseline for outcomes with comparable wording, but it was not included in the 14-level symbol analyses. Symbol-specific measures, including suitability, had no meaningful no-symbol equivalent.
The conditional appetite item was summarised separately. The initial yes/no response and the follow-up intensity rating were not combined with the six main outcomes because intensity was recorded only when a participant reported an appetite increase.
Principal component analysis (PCA) was retained as an exploratory multivariate summary of the visual aroma-symbol response profiles. PCA was applied to the six main quantitative variables to examine the underlying dimensional structure of the response space. The analysis was correlation-based, and variables were standardised before extraction to ensure equal weighting. The Kaiser–Meyer–Olkin measure of sampling adequacy and Bartlett’s test of sphericity were computed to evaluate the suitability of the data for multivariate analysis. Because the PCA summarised symbol-level response profiles, it was interpreted as a descriptive profile map of the complete visual aroma-symbol designs rather than as inferential evidence for the causal effect of any single visual feature.
For the categorical association data, each selected response was coded as present or absent for each participant and symbol condition. Smell meanings, emotional responses, and no-appetite reasons remained identifiable as separate question blocks. Cochran’s Q tests with Holm correction assessed within-participant differences across symbols for each term. Correspondence analysis was applied to the combined symbol-by-term frequency table using chi-square distance. These analyses describe semantic and emotional associations with the visual cue, not real odour perception.
All statistical analyses were carried out using XLSTAT version 27.0 (Lumivero, Denver, CO, USA, 2026). Statistical significance was evaluated at α = 0.05.
4. Results
4.1. Descriptive Statistics and Repeated-Measures Analysis of Variance (ANOVA) Results
Across 366 participants, each analysis included 5124 complete symbol-level ratings from 14 visual aroma-symbol conditions. The overall mean (SD) was 6.413 (1.721) for suitability, 6.120 (1.378) for perceived smell strength, 6.322 (1.681) for perceived smell pleasantness, 6.753 (1.763) for willingness to eat, 6.619 (2.192) for image-evoked hunger, and 4.943 (2.145) for image-evoked fullness. Mauchly’s test did not indicate a sphericity violation for suitability, perceived smell strength, perceived smell pleasantness, image-evoked hunger, or image-evoked fullness (all p ≥ 0.130). Sphericity was violated for willingness to eat, W = 0.713, χ2(90) = 121.702, p = 0.015; therefore, its Greenhouse–Geisser-corrected result is reported (ε = 0.949).
Repeated-measures ANOVA showed a significant effect of visual aroma-symbol condition on suitability, F(13, 4745) = 513.037,
p < 0.001, ηp
2 = 0.584. Perceived smell pleasantness also differed across conditions, F(13, 4745) = 403.281,
p < 0.001, ηp
2 = 0.525. These results indicate that ratings of suitability and expected pleasantness varied across the complete symbol designs; both partial-eta-squared values were large according to conventional benchmarks [
24].
Visual aroma-symbol condition was also significant for perceived smell strength, F(13, 4745) = 256.934, p < 0.001, ηp2 = 0.413; willingness to eat, F(12.341, 4504.590) = 313.581, p < 0.001, ηp2 = 0.462, using the Greenhouse–Geisser correction; and image-evoked hunger, F(13, 4745) = 59.943, p < 0.001, ηp2 = 0.141. Image-evoked fullness was not significantly affected, F(13, 4745) = 0.606, p = 0.851, ηp2 = 0.002.
Tukey HSD-adjusted comparisons of estimated marginal means identified Symbol 1 as the highest-rated condition for suitability (8.656 ± 0.059), perceived smell strength (7.574 ± 0.056), perceived smell pleasantness (8.358 ± 0.062), willingness to eat (8.590 ± 0.063), and image-evoked hunger (7.153 ± 0.045). Symbol 7 and Symbol 11 also had consistently high profiles. The lowest means were observed for Symbol 10 in suitability (4.732 ± 0.059), Symbol 8 in perceived smell strength (4.167 ± 0.056), Symbol 13 in perceived smell pleasantness (4.497 ± 0.062) and willingness to eat (5.295 ± 0.063), and Symbol 13 in image-evoked hunger (6.085 ± 0.045).
The repeated-measures results therefore support differences among complete visual aroma-symbol designs for five of the six outcomes. They do not show that any one visual feature caused the differences. Image-evoked fullness did not differ significantly across symbols.
4.2. Estimated Marginal Means and Symbol Ranking
Visual aroma-symbol condition was significant for suitability, perceived smell strength, perceived smell pleasantness, willingness to eat, and image-evoked hunger (all
p < 0.001), but not for image-evoked fullness (
p = 0.851).
Table 2 reports estimated marginal means, model-based standard errors, and compact letter groupings from the repeated-measures analyses. Complete Tukey HSD-adjusted pairwise comparisons are provided in
Supplementary Table S3.
The estimated marginal means show that Symbol 1 had the strongest overall profile, followed by Symbol 7 and Symbol 11. Symbol 8, Symbol 9, Symbol 10, and Symbol 13 had weaker profiles for several outcomes. These rankings describe the complete designs and should not be interpreted as evidence that direction, curvature, stroke number, or any other single feature caused the observed differences.
Symbol 1 had the highest estimated marginal mean on the five outcomes that differed significantly across conditions. Symbol 7 and Symbol 11 also received high ratings, although Tukey groupings show that the precise degree of separation varied by outcome.
Symbol 8, Symbol 10, and Symbol 13 had weaker profiles on several outcomes. A design could appear relatively strong while still receiving lower suitability or pleasantness ratings. Image-evoked fullness showed little variation and all conditions shared the same compact-letter group.
4.3. Principal Component Analysis of Visual Aroma-Symbol Conditions
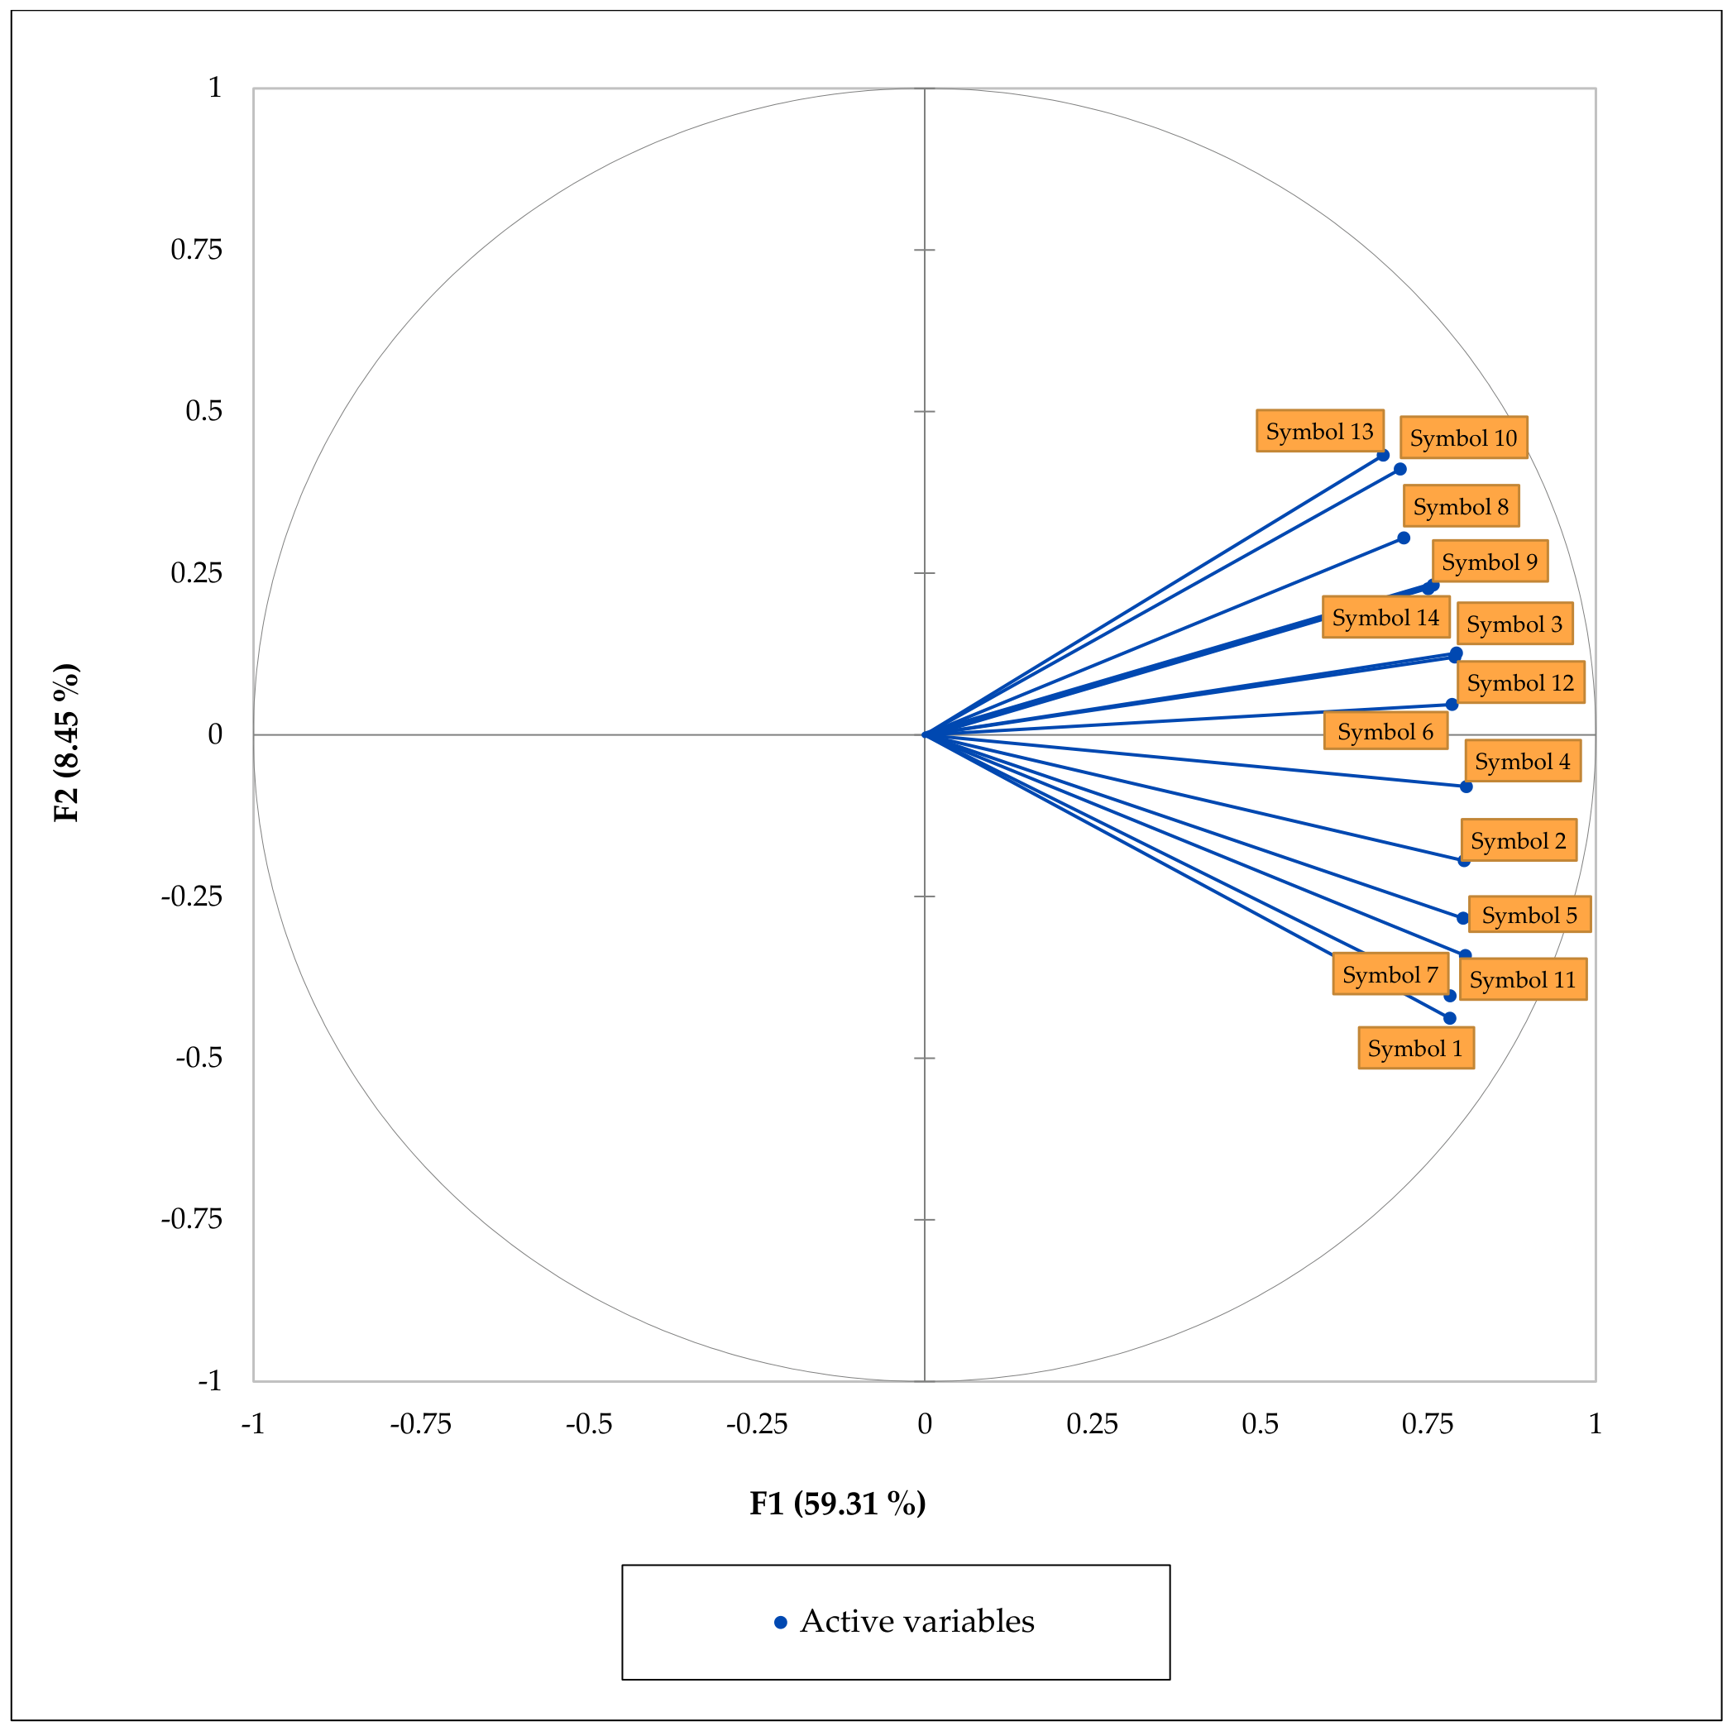
Principal component analysis was used to summarise the main response pattern across the visual aroma-symbol conditions. The analysis was performed on the correlation matrix of the six main quantitative variables: suitability, perceived smell strength, perceived smell pleasantness, willingness to eat, image-evoked hunger, and image-evoked fullness.
The data were suitable for PCA. The Kaiser–Meyer–Olkin measure of sampling adequacy was 0.969, which indicates very good shared variance among the variables. Bartlett’s test of sphericity was significant, χ2(15) = 21356.704, p < 0.0001, showing that the variables were sufficiently correlated for PCA.
The first two principal components explained 67.757% of the total variance. PC1 explained 59.307% of the variance, while PC2 explained 8.450%. PC1 mainly represented a general positive aroma-evaluation dimension. Suitability, perceived smell pleasantness, willingness to eat, image-evoked hunger, and perceived smell strength loaded positively on this component. This means that symbols with high PC1 scores were generally rated as more suitable, more pleasant, stronger, and more appetite-supporting.
The PCA map supported the ANOVA and estimated marginal mean results. Symbol 1, Symbol 7, and Symbol 11 were positioned closer to the positive evaluation variables, which is consistent with their higher ratings. Symbol 8, Symbol 9, Symbol 10, and Symbol 13 were positioned further from these positive evaluation variables, which is consistent with their weaker profiles. PC2 provided a smaller separation among the symbols. It mainly reflected differences between perceived smell strength and image-evoked fullness. However, because PC2 explained much less variance than PC1, it should be interpreted with caution.
Overall, the PCA shows that the visual aroma-symbol conditions were mainly separated by a general positive evaluation dimension. The PCA should be interpreted as an exploratory profile map of complete symbol designs. It should not be interpreted as evidence that one isolated feature, such as direction, curvature, or number of lines, caused the observed differences.
4.4. Check-All-That-Apply and Correspondence Analysis Results
CATA-style responses were treated as categorical association data. Each selected term was coded as present or absent for each participant and symbol condition. Smell-meaning terms, emotional-response terms, and no-appetite reason terms were collected as separate question blocks because they represent different aspects of symbol interpretation. Smell-meaning terms describe what the visual aroma symbol appeared to represent, emotional-response terms describe the feeling or reaction linked with the symbol, and no-appetite reason terms describe why a symbol did not increase appetite.
The overall association between visual aroma-symbol condition and categorical response terms was significant, χ2(286) = 5709.147, p < 0.0001. This shows that participants did not select the same terms for all symbols. Different symbols were linked with different perceived meanings and emotional responses. Cochran’s Q tests were used to examine within-subject differences across symbols, with Holm correction applied across terms.
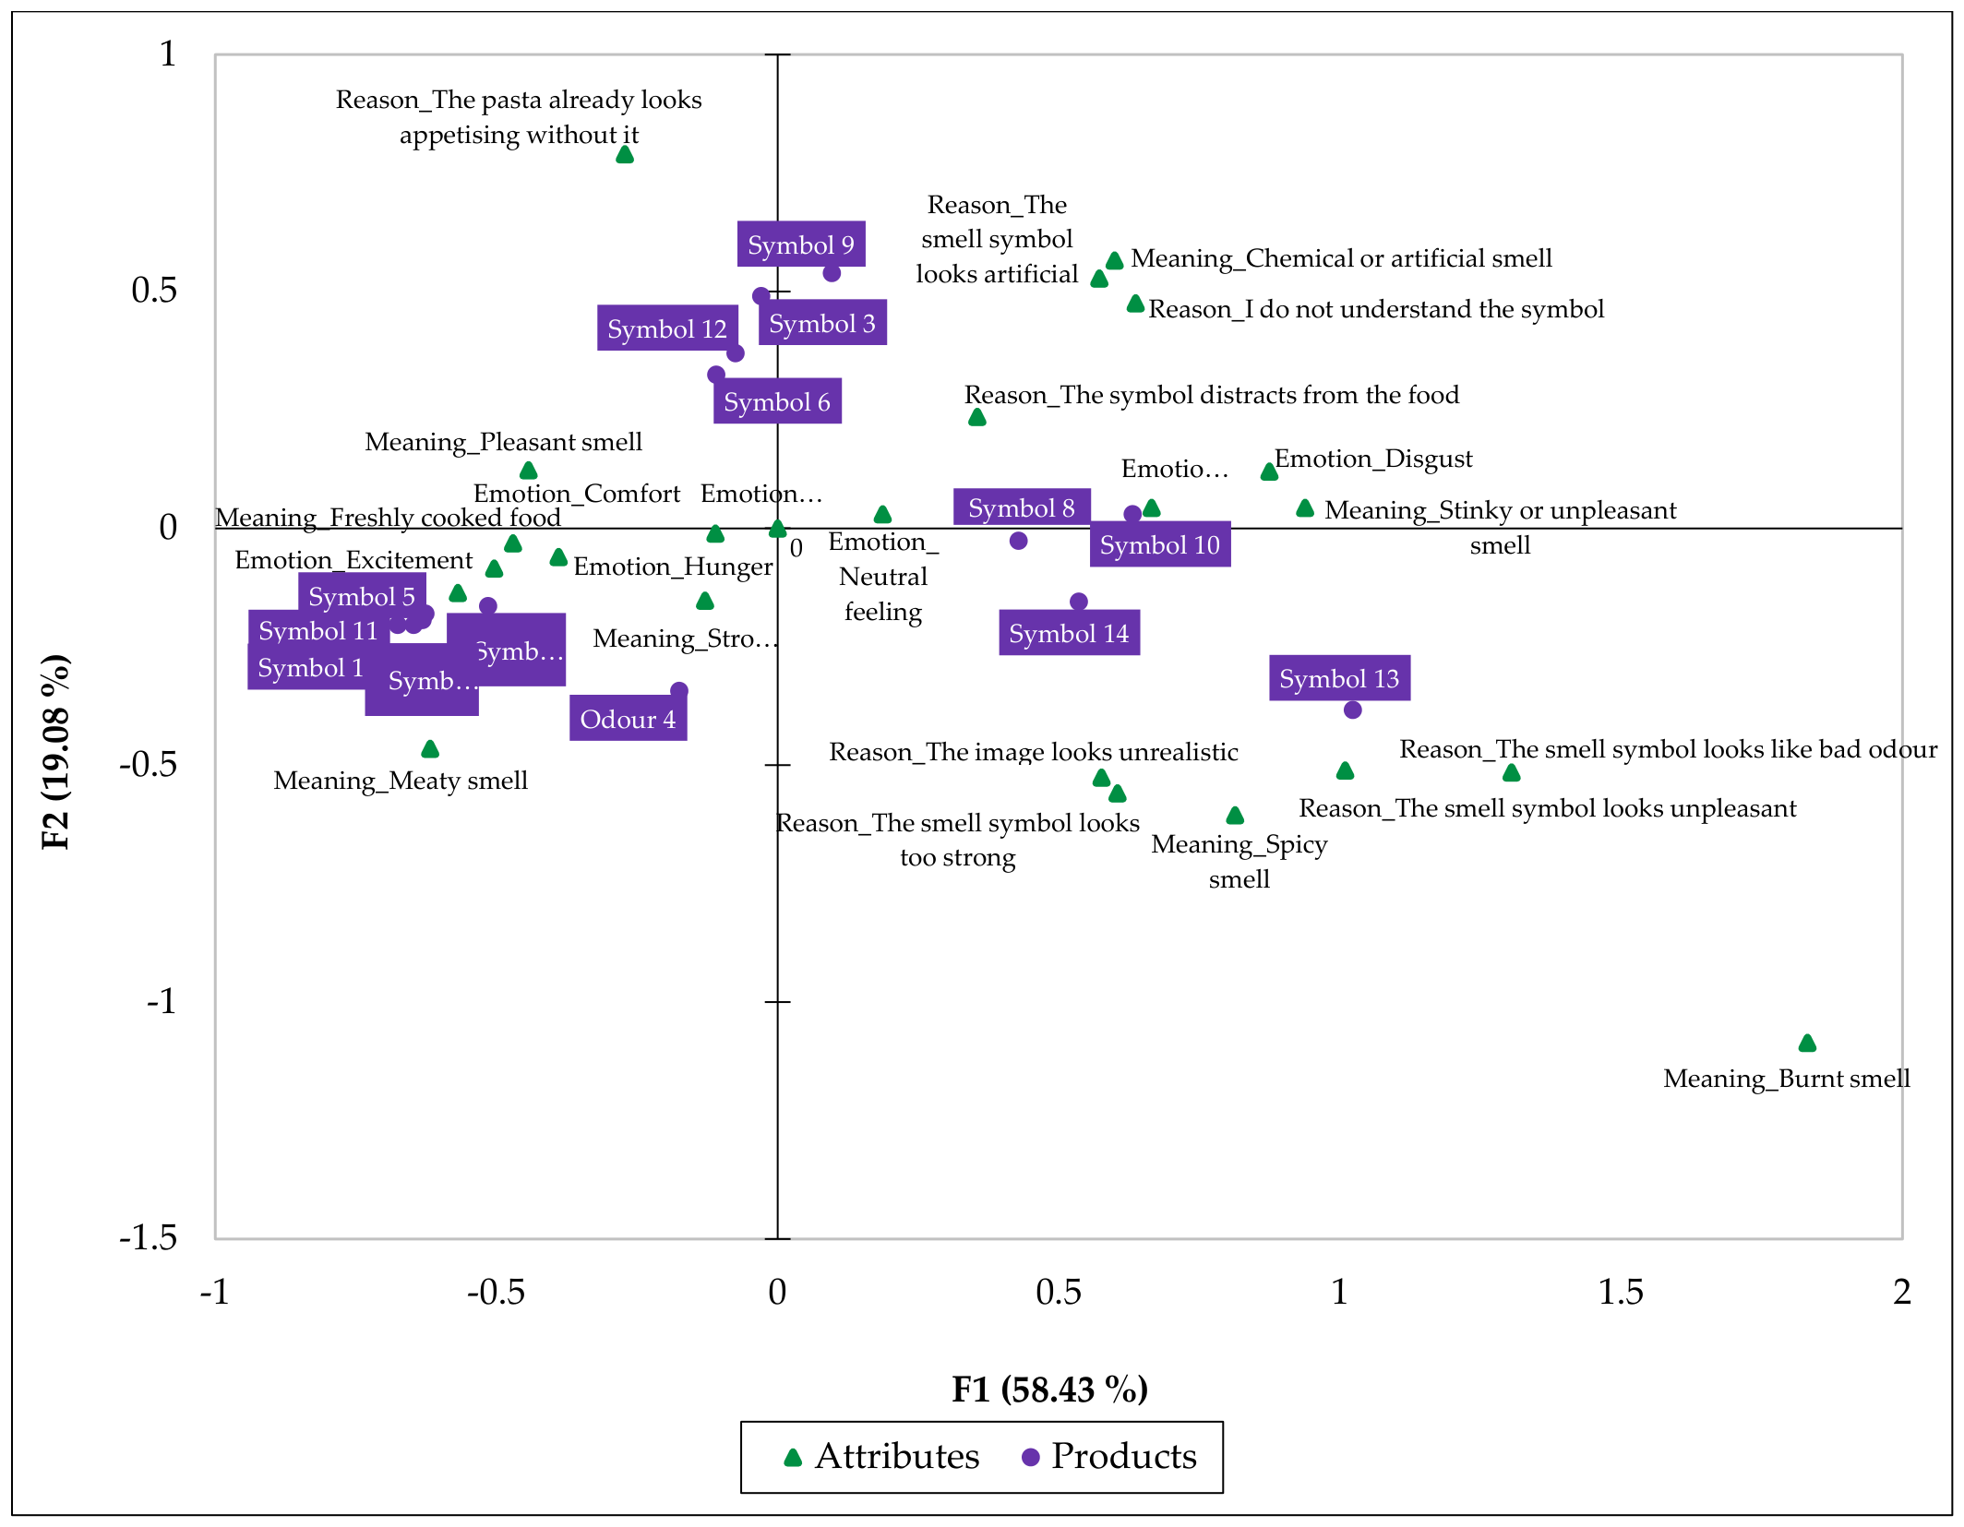
Correspondence analysis was applied to the symbol-by-term frequency table (
Figure 2). Dimension 1 explained 58.3% of inertia, and Dimension 2 explained 19.2%. Together, the first two dimensions explained 77.5% of the association pattern. In this study, olfactory clues refer to visual aroma-symbol associations with perceived meanings such as freshly cooked food, pleasant smell, strong food aroma, burnt smell, chemical or artificial smell, or unpleasant smell. Emotional responses refer to feelings or reactions such as hunger, comfort, curiosity, confusion, neutral feeling, or disgust. These associations describe perceived meanings and emotional responses linked with the visual aroma symbols. They should not be interpreted as evidence of real odour perception.
Table 3 summarises the three most frequently selected categorical association terms for each visual aroma-symbol condition. Full CATA frequencies by question type and Cochran’s Q tests are provided in the
Supplementary Materials.
The CATA summaries support the rating results. The stronger steam-like symbols were more often linked with positive food-related terms, especially freshly cooked food, hunger, and pleasant smell. Symbol 1, Symbol 5, Symbol 7, and Symbol 11 showed the clearest positive association patterns. In contrast, several weaker or more irregular symbols were more often linked with confusion, neutral feeling, chemical or artificial smell, or less clear food-related meanings.
These categorical associations are descriptive. They show how participants interpreted the visual aroma symbols, but they do not show that participants perceived a real odour.
Figure 3 provides an exploratory visual summary of the correspondence analysis. Symbol positions and term positions show perceived semantic and emotional association patterns, not causal effects and not real odour perception.
As shown in
Figure 3, the correspondence analysis map supports the pattern observed in the rating results. Symbol 1, Symbol 7, and Symbol 11 were positioned near more positive food-related meanings and emotional responses, such as freshly cooked food, pleasant smell, strong food aroma, hunger, comfort, and curiosity. This pattern is consistent with their higher suitability, perceived smell pleasantness, willingness to eat, and image-evoked hunger ratings. In contrast, Symbol 8 and Symbol 9 were positioned closer to more neutral or mixed responses, suggesting weaker and less clear qualitative profiles. Symbol 10 was positioned near confusion and artificial or unclear smell-related meanings, while Symbol 13 was positioned closer to less favourable associations, such as confusion, spicy smell, neutral feeling, or unpleasant smell-related interpretations.
The correspondence analysis therefore provides additional descriptive evidence [
25], that the visual aroma symbols differed not only in their rating scores, but also in the meanings and reactions participants attached to them. This distinction is important because a symbol may look strong but still be interpreted as unsuitable, confusing, or unpleasant. In contrast, symbols that were interpreted as freshly cooked, pleasant, or hunger-related were more likely to receive higher positive ratings.
These findings suggest that visual aroma-symbol design should be evaluated beyond simple perceived intensity. For digital food images, a symbol that suggests freshly cooked food, pleasant smell, or strong food aroma may support positive food perception, while symbols that suggest confusion, artificial smell, or unpleasant smell may reduce clarity and appeal. However, these results are based on self-reported visual associations and should not be interpreted as evidence of real odour perception or actual food-choice behaviour.
5. Discussion
The results show that complete visual aroma-symbol designs were associated with different self-reported rating profiles. Symbol 1, Symbol 7, and Symbol 11 received comparatively high ratings, and their familiar steam-like appearance may have supported interpretation as food aroma. This interpretation is consistent with crossmodal research linking rising forms with steam, diffusion, warmth, and food aroma [
26]. However, the study did not manipulate directionality, curvature, or complexity independently. These features should therefore be treated as possible explanations for future testing, not as confirmed causal mechanisms.
The higher ratings for Symbol 1, Symbol 7, and Symbol 11 are also consistent with the possibility that familiar visual cues prompt expected aroma-related imagery when no real odour is present [
27]. The study does not show that participants actually perceived odour. Conversely, the weaker profiles of Symbol 8, Symbol 9, Symbol 10, and Symbol 13 suggest that some complete designs communicated less favourable or less clear meanings in this context. A symbol could look strong yet still be rated as unsuitable, unpleasant, or confusing, indicating that expected smell quality and apparent intensity need not align [
14].
Visual aroma conventions may be learned through repeated exposure to steam lines and scent marks in advertising, cartoons, packaging, menus, restaurant displays, and delivery platforms. This familiar visual vocabulary could help explain why simple steam-like designs received strong profiles, whereas less familiar designs were interpreted less consistently. This explanation remains tentative but accords with work on visual food cues, crossmodal correspondences, and olfactory imagery [
5,
13,
15,
26].
The findings may inform the design of digital menus and food imagery, but the practical interpretation is limited to perceived aroma communication and stated willingness to eat. The study did not measure actual ordering behaviour, sales conversion, food choice, consumption, or real odour perception. The categorical results likewise show which meanings and emotions participants associated with the designs, not whether the designs changed actual food behaviour. This bounded interpretation extends earlier work on visual design cues in food packaging [
6].
Several limitations restrict generalisation. The study used one pasta bolognese image and one product category, and no real odour was presented. Device type, screen calibration, exposure time, image-order randomisation, counterbalancing, and backward navigation were not documented in the exported materials. Because participants evaluated many similar images, fatigue, learning, order effects, or automatic responding may have influenced the ratings. These factors should be considered when interpreting the magnitude of the observed symbol differences. Cultural background, food familiarity, design experience, and individual response patterns also require further study [
28].
Future research should test different foods and systematically manipulate one design feature at a time. Eye tracking could examine whether symbol designs attract earlier fixation, longer dwell time, or different scan paths, and whether attention relates to perceived smell strength, pleasantness, hunger, or stated willingness to eat [
29,
30]. Directionality could be varied while holding stroke number, thickness, colour, and complexity constant.
Biometric measures may provide complementary evidence about emotional arousal and engagement [
31,
32]. Virtual and augmented reality could support more naturalistic tests of visual aroma symbols [
33,
34]. Studies that combine visual cues with real odour, sound, motion, or haptic feedback could examine multisensory responses [
35]. Behavioural studies are also needed before drawing conclusions about food choice, ordering, or consumption.
6. Conclusions
This study compared 14 visual aroma-symbol designs applied to a controlled pasta bolognese image. Repeated-measures ANOVA accounting for participant-level dependence showed that visual aroma-symbol condition was associated with suitability, perceived smell strength, perceived smell pleasantness, willingness to eat, and image-evoked hunger, but not image-evoked fullness.
Symbol 1 had the strongest overall profile, followed by Symbol 7 and Symbol 11. These designs were also often associated with freshly cooked food, hunger, and pleasant smell. Several irregular or ambiguous designs had weaker quantitative profiles and were more often linked with confusion, neutral feeling, or artificial and less favourable smell meanings.
The results suggest that familiar steam-like symbols may support expected aroma communication in digital food imagery. They do not demonstrate real odour perception, actual ordering behaviour, food choice, consumption, or sales outcomes. The findings apply to self-reported responses to complete symbol designs in this study context.
Future work should test other foods, cuisines, cultures, colours, animation styles, and movement directions. Designs that isolate individual visual features, document image order and device conditions, and include eye tracking, biometric measures, real odour delivery, or behavioural outcomes would strengthen the evidence.