Article

Olives in Culinary Practice: A Nutritional Profile of Selected Recipes

School of Health Science and Education, Department of Nutrition and Dietetics, Harokopio University, El. Venizelou 70, Kallithea, 176 76 Athens, Greece
*
Author to whom correspondence should be addressed.
Gastronomy 2026, 4(1), 7; https://doi.org/10.3390/gastronomy4010007
Submission received: 4 January 2026 / Revised: 17 February 2026 / Accepted: 17 March 2026 / Published: 23 March 2026

Abstract

Background: Table olives are key elements of Mediterranean cuisine, yet their contribution within traditional Greek culinary preparations remains underexplored. Aim: This study evaluated the nutritional composition of 70 Greek recipes (appetizers, salads, and main courses) incorporating table olives. Methods: We conducted nutritional analysis based on a previous study, integrating the USDA food composition database and the official Greek food composition tables, yield and retention factors, and standardized portion measures. Energy content was assessed against cut-off points for nutritionally balanced meals. Principal component analysis (PCA) and ternary plots were applied to examine the relationship between macronutrients, energy, and fatty acid profiles. Results: Mean energy density was 154.5 kcal/100 g, with fat as the dominant macronutrient (11.0 g/100 g), primarily monounsaturated. Proteins, carbohydrates, sugars, and dietary fiber contributed less to total energy, and fiber levels were moderate (1.24 g/100 g). Conclusions: These findings highlight that traditional olive-based recipes deliver energy predominantly through fat-rich ingredients, mainly monounsaturated fatty acids. The study underscores the need for portion awareness and potential recipe adjustments to enhance nutritional balance and offers a framework for assessing the dietary value of Mediterranean culinary traditions.

1. Introduction

The nutritional profile of Greek table olive varieties exhibits pronounced heterogeneity, reflecting cultivar-specific characteristics and traditional processing practices. Total fat content varies markedly among table olive varieties, with Greek olives typically containing approximately 20% fat by fresh weight, although higher values have been reported for specific cultivars and processing types [1]. Across all reported varieties, oleic acid consistently represents the predominant fatty acid—typically accounting for 70% to 80% of the total fatty acid content depending on the cultivar and ripening stage [2]. This positions table olives as a primary dietary source of monounsaturated fatty acids (MUFA) within Mediterranean food systems [1]. Among Greek cultivars, Kalamata olives display particularly high oleic acid content, comparable to naturally debittered Turkish varieties, while Chalkidiki olives also feature robust MUFA profiles. Conversely, Conservolea olives are characterized by substantially higher linoleic acid levels, highlighting significant inter-cultivar variation in polyunsaturated fatty acid (PUFA) composition [1,2].
In these varieties, the lipid fraction is complemented by lower levels of saturated fatty acids (SFA), such as palmitic acid. When consumed as part of the whole fruit, these fatty acids work synergistically with the olive’s fiber and antioxidant compounds to support cardiovascular health and regulate lipid metabolism [3]. Beyond their fatty acid composition, Greek table olives contain a significant sterolic fraction that serves as a “chemical fingerprint” for varietal identification and purity. The dominant phytosterol is β-sitosterol, which often represents more than 90% of the total sterol content, followed by Δ-5-avenasterol, campesterol, and stigmasterol [1].
These plant sterols are recognized for their ability to compete with cholesterol absorption in the human digestive system, thereby contributing to the reduction in serum LDL-cholesterol levels. Research conducted on Greek cultivars emphasizes that traditional natural fermentation processes effectively preserve these bioactive lipids, ensuring that the table olive remains a functional food with a validated nutritional impact [2].
Phenolic compounds constitute one of the most extensively studied micronutrient classes in table olives and play a critical role in both nutritional value and sensory properties. Hydroxytyrosol and oleuropein dominate the phenolic profile, with concentrations strongly affected by cultivar, maturation stage, and processing method. Processing generally enhances hydroxytyrosol content relative to fresh olives due to hydrolysis of oleuropein during fermentation and curing [4,5,6]. Dry salt-cured olives, such as Throuba Thassos, retain exceptionally high oleuropein concentrations compared to brine- or lye-treated products [7]. Total phenolic content is further influenced by ripening stage, highlighting the importance of harvest timing [8].
The tocopherol profile of Greek table olives is overwhelmingly dominated by α-tocopherol, which constitutes the primary source of Vitamin E activity in the fruit. The research indicates that while total tocopherol content varies significantly among samples, α-tocopherol consistently accounts for the vast majority of the profile, with γ-tocopherol appearing in much smaller quantities and δ-tocopherol being detected in only trace amounts or absent entirely. The concentration of these antioxidants is inversely related to the ripening process; consequently, green table olives retain significantly higher levels of α-tocopherol compared to naturally black or dark-colored olives, as the antioxidant content tends to deplete as the fruit matures and loses chlorophyll. Regarding specific varietal differences, the study examined four major Greek cultivars: Halkidiki (Green), Conservolea (processed as both Green and Black), Kalamata (Black), and Throumba (naturally wrinkled on the tree). The Halkidiki variety exhibited the highest concentration of α-tocopherol (ranging from approximately 3.8 to 7.2 mg/100 g of edible portion), reflecting its harvest at the green stage. In contrast, the black varieties, specifically Kalamata and fully ripe Conservolea, showed lower tocopherol values (approximately 1.8 to 4.3 mg/100 g). The Throumba variety presented a unique profile; while naturally ripened, its dehydration on the tree results in a concentration of nutrients, though oxidative exposure can affect final tocopherol retention. Ultimately, the study concludes that variety and the associated stage of maturity are the definitive factors regulating the Vitamin E profile in table olives [9]. This varietal influence is intrinsically linked to the fruit’s secondary metabolism, as the genetic makeup of each cultivar regulates the enzymatic pathways responsible for tocopherol synthesis during the green and turning stages of ripening. Furthermore, the traditional Greek-style natural fermentation preserves these lipophilic antioxidants more effectively than chemical debittering methods, allowing the specific varietal “fingerprint” of Greek olives to be retained, thus providing a superior nutritional profile compared to lye-treated table olives [10].
Overall, the observed diversity in the nutritional composition of Greek table olives reflects complex interactions between cultivar, geographic origin, maturation stage, and traditional processing. This variability reinforces their role as a nutritionally and sensorially rich ingredient shaped by terroir and culinary practice.
The health benefits attributed to table olives span multiple physiological systems, though the evidence base varies considerably in quality and specificity. The primary health conditions studied include cardiovascular disease, diabetes, cancer, bone health, and inflammation. Monounsaturated fatty acids contribute to cardiovascular health by improving fat profiles and reducing cardiovascular risk factors. Tocopherols function as antioxidants by scavenging peroxyl radicals and stabilizing cell membranes. Hydroxytyrosol exerts both antioxidant and anti-inflammatory effects by scavenging free radicals, inhibiting pro-inflammatory cytokines, and modulating cellular pathways, including Nrf2 activation. Additionally, HT demonstrates antithrombotic effects by reducing platelet aggregation and eicosanoid synthesis, potentially preventing atherosclerotic lesion development [1].
For bone health specifically, olive polyphenols reduce oxidative stress and inflammation, enhance proliferation of pre-osteoblasts, promote differentiation of osteoblasts, and decrease the formation of osteoclast-like cells. Animal studies showed that supplementation improved skeletal health assessed via bone mineral density, biomechanical strength, and turnover markers in ovariectomized rats, particularly those with inflammation. Human studies revealed that daily olive oil consumption could prevent a decline in bone mineral density and improve bone turnover markers [11].
Despite their benefits, table olives present risks primarily due to high sodium and processing byproducts. Most commercial Greek olives are preserved in brine, with salt levels up to 6%, contributing significantly to daily sodium intake—a major risk factor for hypertension [12]. In terms of chemical safety, “California-style” black oxidized olives have been shown to contain acrylamide, a process contaminant. Research indicates that the heat treatment during sterilization, combined with the oxidation process, promotes its formation [13]. Furthermore, the fermentation process can lead to the accumulation of biogenic amines (like histamine), which may cause adverse reactions in sensitive individuals. Studies on Mediterranean cultivars confirm that while levels are generally safe, poor hygiene during fermentation can increase these risks [14,15].
The nutritional value of table olives has been extensively studied. Nevertheless, no specific recommendations exist regarding their recommended daily intake, nor is there sufficient scientific evidence to support their inclusion within culinary practices. Current consumption guidance is largely limited to their role as a meal accompaniment, for example, with legumes during periods of Christian fasting, when olive oil may also be excluded [16].
Limited data exist on actual table olive consumption patterns, representing a significant gap for evidence-based policy development. Guidelines recommend moderate consumption of 1–2 portions (the exact amount of lives is not specified) per day as part of the Mediterranean dietary pattern. Consumption should occur as whole table olives rather than extracts or supplements, integrated with other Mediterranean diet components [17]. Another study suggests the consumption of 5–10 olives per day as part of a meal to achieve phenolic compound intakes comparable to those reported in Northern European populations; however, no established recommended daily intake for phenolic compounds currently exists [6]. No dose–response relationships have been identified, and compliance rates or adherence measures were not reported. This lack of quantitative guidance highlights a gap in current dietary recommendations and underscores the need for further research to inform evidence-based public health nutrition policies regarding the integration of table olives into dietary guidelines.

Purpose

The evidence base for olive-based recipes distinct from olive oil applications remains sparse. While table olives are recognized as nutritionally significant in Mediterranean diets across Spain, Egypt, Turkey, Greece, and Algeria, research on specific culinary preparations emphasizing whole olives rather than olive oil is limited. Given that a segment of the consumer population exhibits a low preference for the direct consumption of table olives, their integration into processed food matrices represents a strategic approach to increasing overall dietary intake [18]. So the purpose of the present study is to evaluate the nutritional value of Greek cooking recipes that include table olives as one of their ingredients.

2. Materials and Methods

2.1. Data Collection

Seventy-two recipes (25 appetizers and salads, and 47 main courses) were collected from well-known cookbooks authored by distinguished Greek chefs [19,20,21]. There are several traditional recipes that include table olives, mostly unpitted, as a basic ingredient. The recipes were required to contain at least five table olives per recommended serving [5] in order to qualify as olive-based dishes.

2.2. Nutritional Analysis

The nutritional evaluation of the selected recipes was conducted using a protocol adapted from the methodology proposed by Giazitzi & Boskou [22]. All calculations for macro- and micronutrient content were carried out using a customized Excel worksheet specifically designed for this purpose. Recipes were categorized into two main groups: salads/appetizers and main dishes. Each recipe was analyzed individually based on its constituent ingredients, with calculations performed on separate worksheets.
Nutritional composition data for each food item were obtained from multiple sources, including the United States Department of Agriculture Research Service food database [23], the official Greek food composition tables [24], as well as nutrition labels of commercially available packaged products in the Greek market.
Yield and nutrient retention factors [25], along with estimated serving sizes, were incorporated into the calculations. In cases where a recipe specified a range of servings, the minimum number of portions was used [26]. Ingredients listed as optional were excluded from the analysis. No adjustments were made to standardize portion weights; instead, the ingredient quantities as reported in each recipe were applied directly [27]. Nutritional outcomes were expressed on a 100 g basis.
For recipes in which cooking fats, salt, or spices were quantified using household measures, standard conversions were applied to ensure uniformity: one tablespoon was assumed to correspond to 15 g and one teaspoon to 5 g. When the amount of salt or spices was indicated qualitatively (e.g., “to taste” or “a pinch”), a standardized value of 1 g per recipe was included in the analysis.

2.3. Nutritional Benchmarking Based on Specific Criteria

The energy content of the selected recipes was assessed against the cut-off points for Nutritionally Balanced (NB) Meals as defined by Giazitzi and Boskou [22]. These standards are based on public health guidelines from the UK [28], the nutritional requirements of the “Heart-Check Recipe Certification Program” [29], and World Health Organization recommendations [30], specifically regarding main courses and salads. In this study, the nutritional benchmarks established for salads were applied to both salads and appetizers. Table 1 summarizes the nutritional criteria proposed by Giazitzi and Boskou [22]. For the purposes of this study, only the energy cut-off point was considered. Nutritional outcomes were expressed per serving.

2.4. Statistical Analysis

Data analysis was performed with STATISTICA 8.0 and MS Excel. Data normality was assessed using the Shapiro–Wilk test, while the majority of the nutritional variables exhibited a non-normal distribution (p-value < 0.05), the energy content of main courses was found to follow a normal distribution (p-value > 0.05). To explore the relationships between nutritional parameters (fats, energy, salt, carbohydrates, proteins, etc.), Principal Component Analysis (PCA) was applied as a multivariate reduction technique. The resulting loading plots were used to identify correlations between nutrients and their contribution to the total variance. Additionally, a ternary plot was generated to visualize the multi-dimensional relationship between fat subtypes (3D space) and total fat content (color-coded 4th dimension). For univariate comparisons against established nutritional cut-off points, two different approaches were used based on the normality of the data. For non-normally distributed variables, the Wilcoxon signed-rank test was employed. For the energy content of main courses (normally distributed), a one-sample t-test was performed. The level of statistical significance was set at p-value < 0.05. Radar charts were employed to visualize the caloric content of each recipe. The recipes were subsequently classified into two distinct categories: main courses and salads/appetizers.

3. Results

3.1. Descriptive Statistics

The mean energy content per 100 g across all recipes was 155.97 kcal, the mean protein content was 6.57 g (0.59–20.33 g), fat content 11 g (0.77–45.78 g), carbohydrate content 7.74 g (0.79–52.76 g), fibers 1.24 g (0.16–6.35 g), sugars 1.26 g (0.06–3.07 g), saturated fatty acids 2.42 g (0.12–10.94 g), monounsaturated fatty acids 6.7 g (0.34–33.34 g) and polyunsaturated fatty acids 1.24 g (0.17–6.42 g).
Table 2 summarizes the descriptive statistics for the continuous variables (macronutrients) of the two categories of recipes (main courses and salads/appetizers). The 45 out of 70 recipes are main courses, and 25 out of 70 are salads and appetizers. The mean energy content of the main courses is 730.75 kcal, and the mean energy content of the salad/appetizers is 386.42 kcal.

3.2. Nutritional Profile of the Recipes

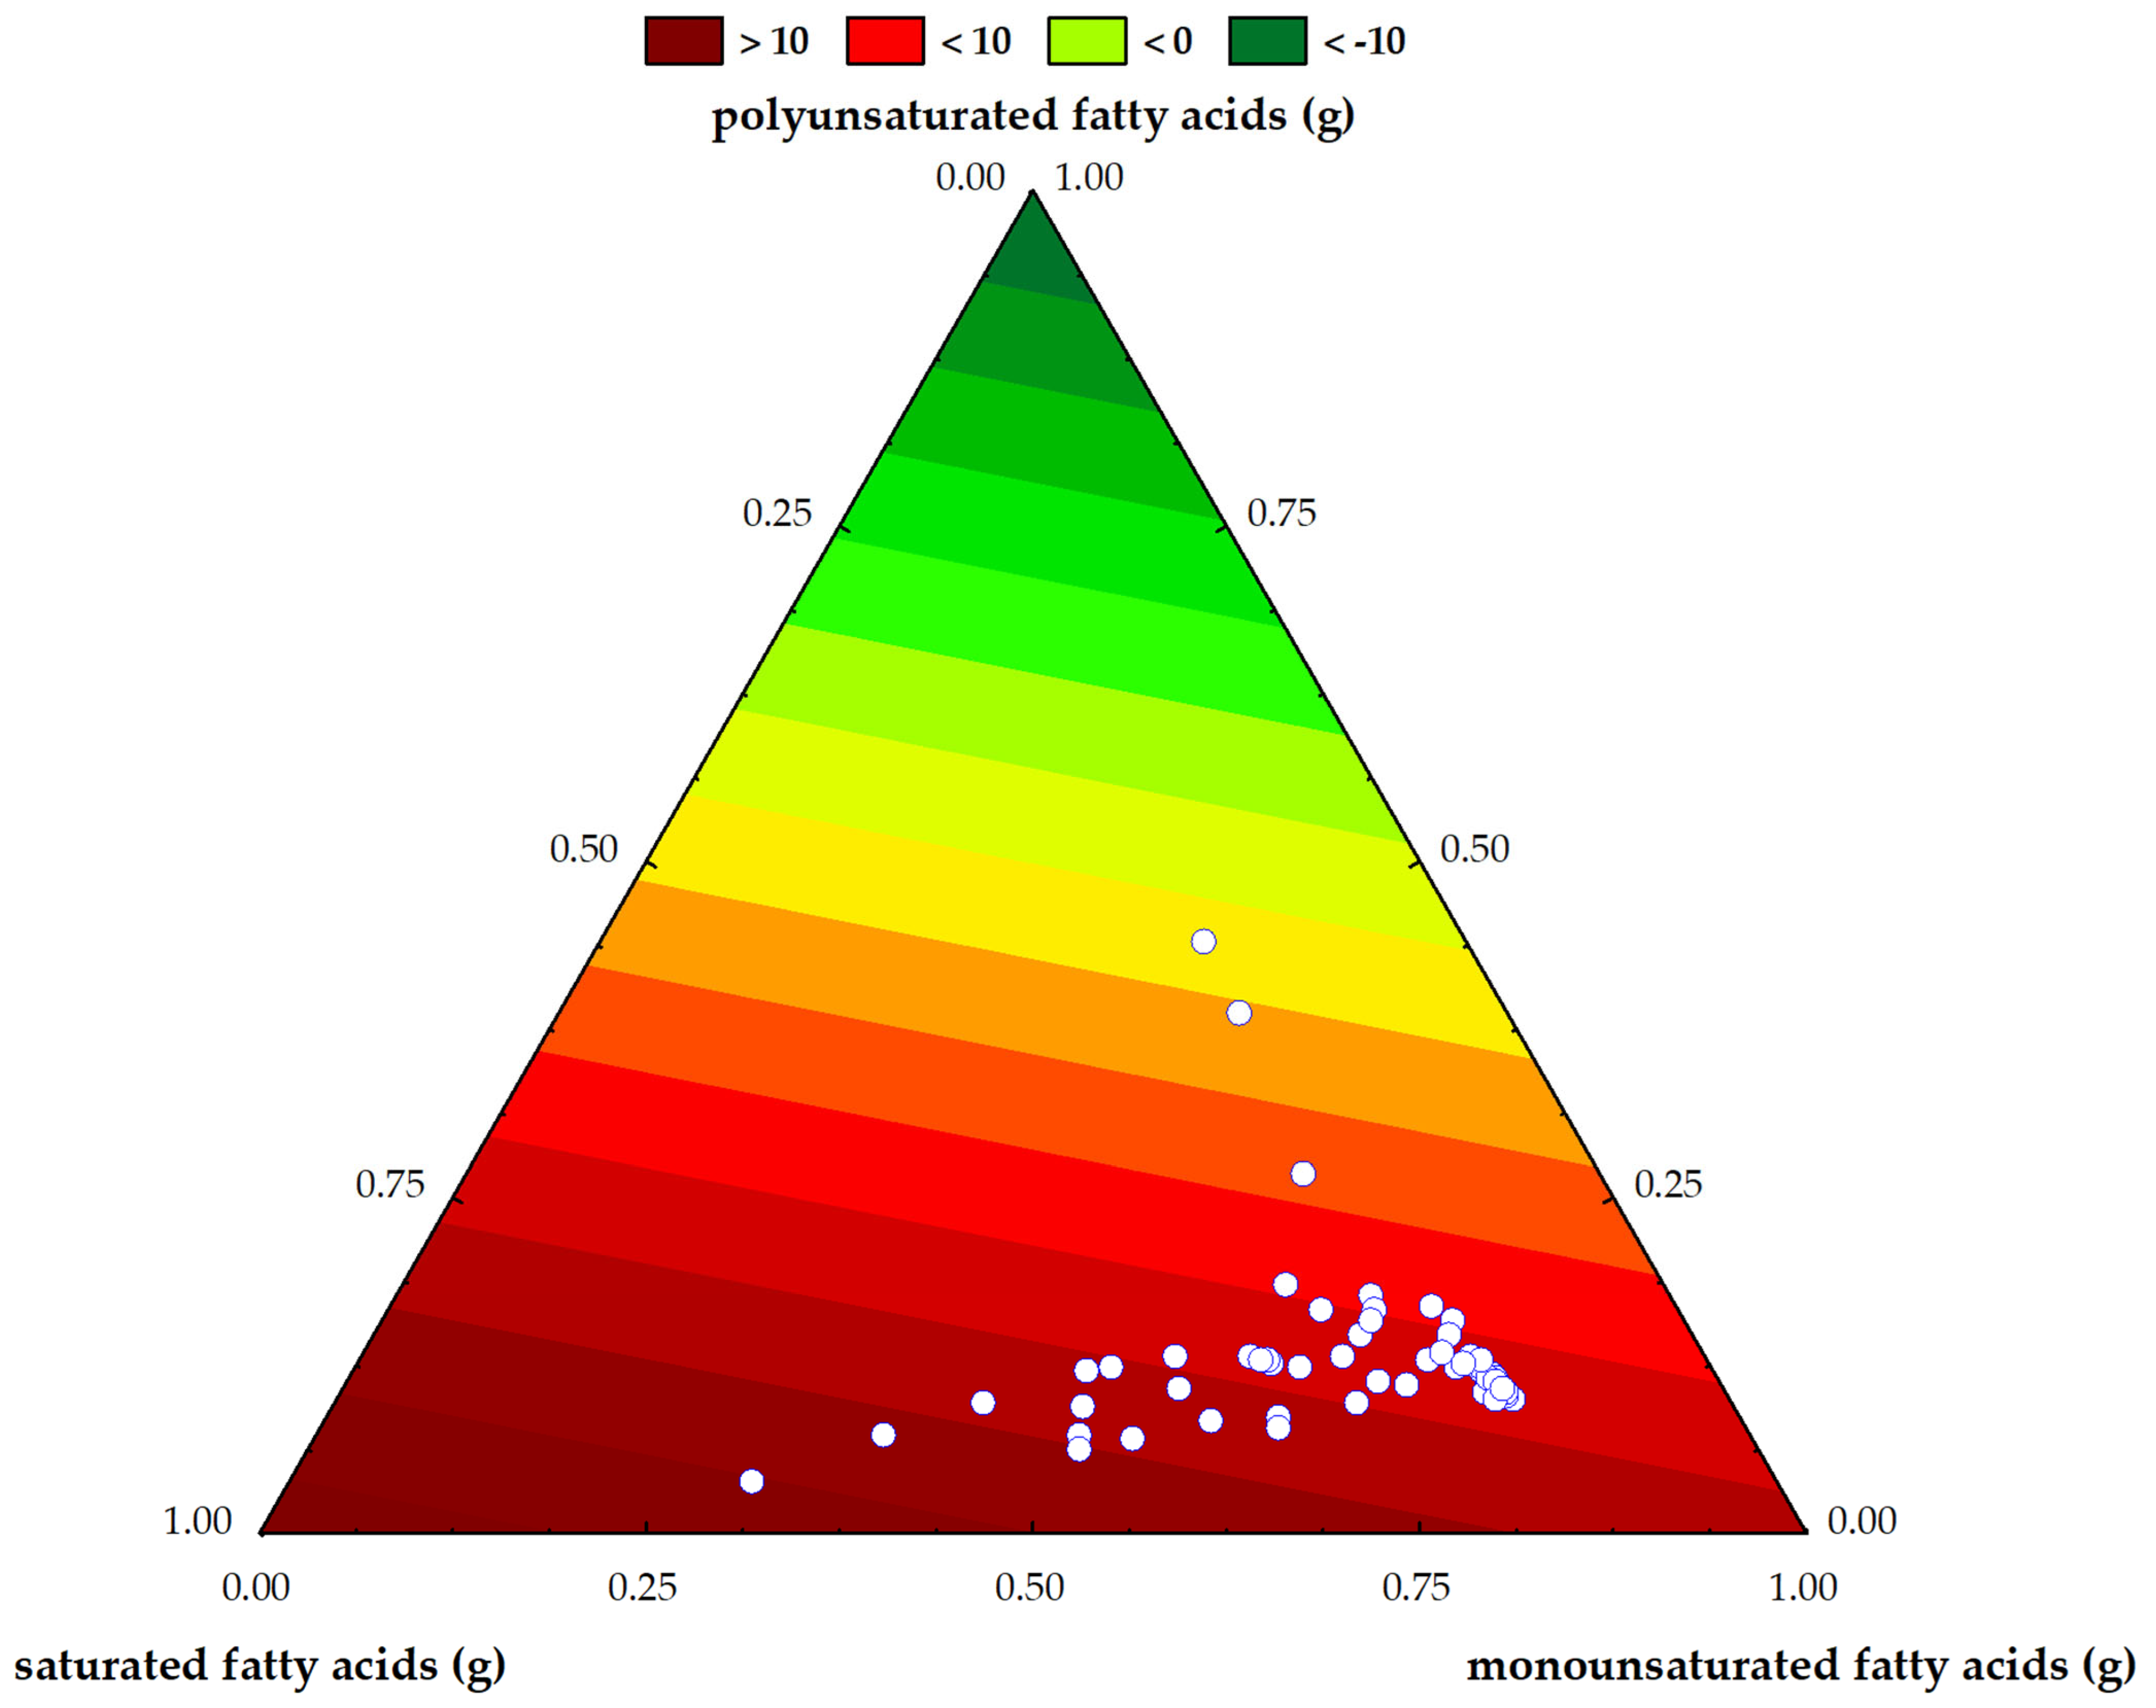
Figure 1 illustrates the distribution of fat types across various recipes, per 100 g of each recipe. The color scale denotes the total fat content (in grams), while each white dot represents an individual recipe. The spatial coordinates of each point indicate the relative proportion of each fat subtype within the recipe’s total fat profile. The majority of the data points (recipes) are clustered towards the monounsaturated fat vertex. These points fall primarily within the red and burgundy color zones, indicating a total fat content of at least 10 g per 100 g of the recipe.
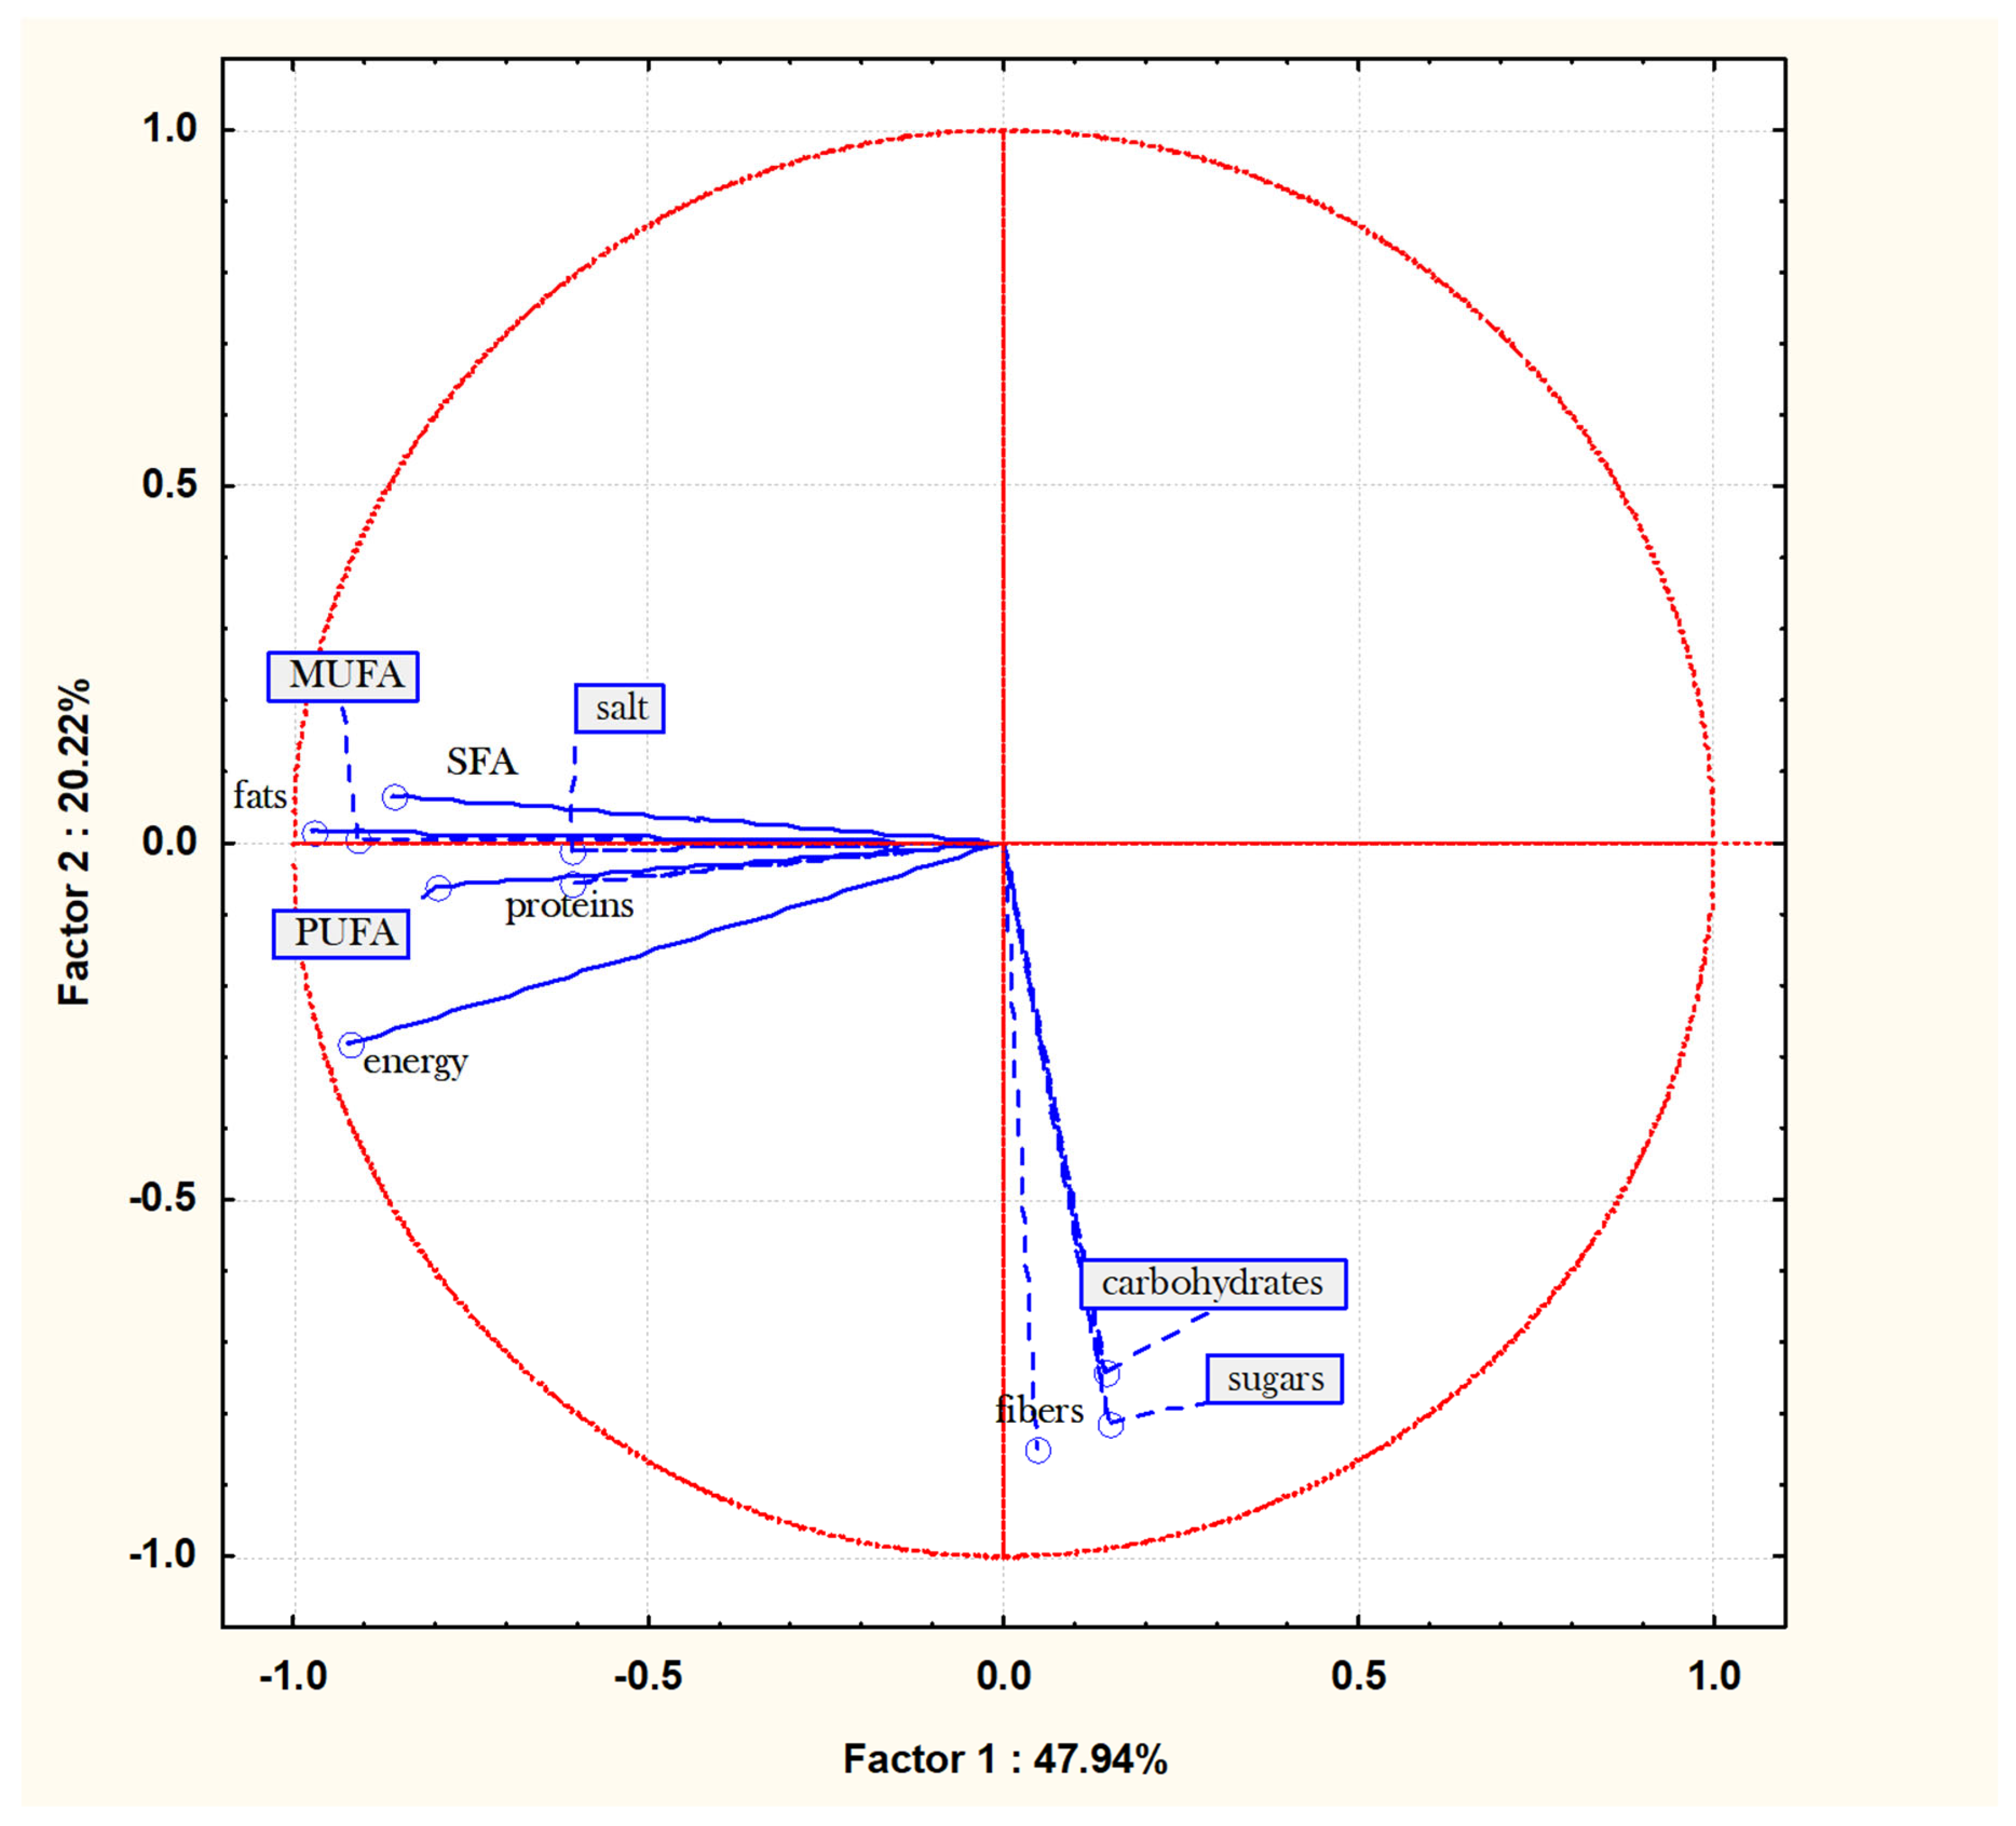
The PCA loading plot (Figure 2) illustrates the grouping of nutritional variables. Factor 1 (47.94%) is primarily defined by the fat content (SFA, MUFA, PUFA) and energy levels, which show a strong positive correlation with each other. Factor 2 (20.22%) is characterized by the carbohydrate, sugar, and fiber content. This analysis confirms that the caloric density of the samples is mainly driven by their fat profile. The wide angle between fats and carbohydrates indicates that the fat profile and carbohydrate content represent two distinct and independent dimensions of the recipes’ nutritional composition.

3.3. Benchmarking Recipes Against Specific Nutritional Criteria

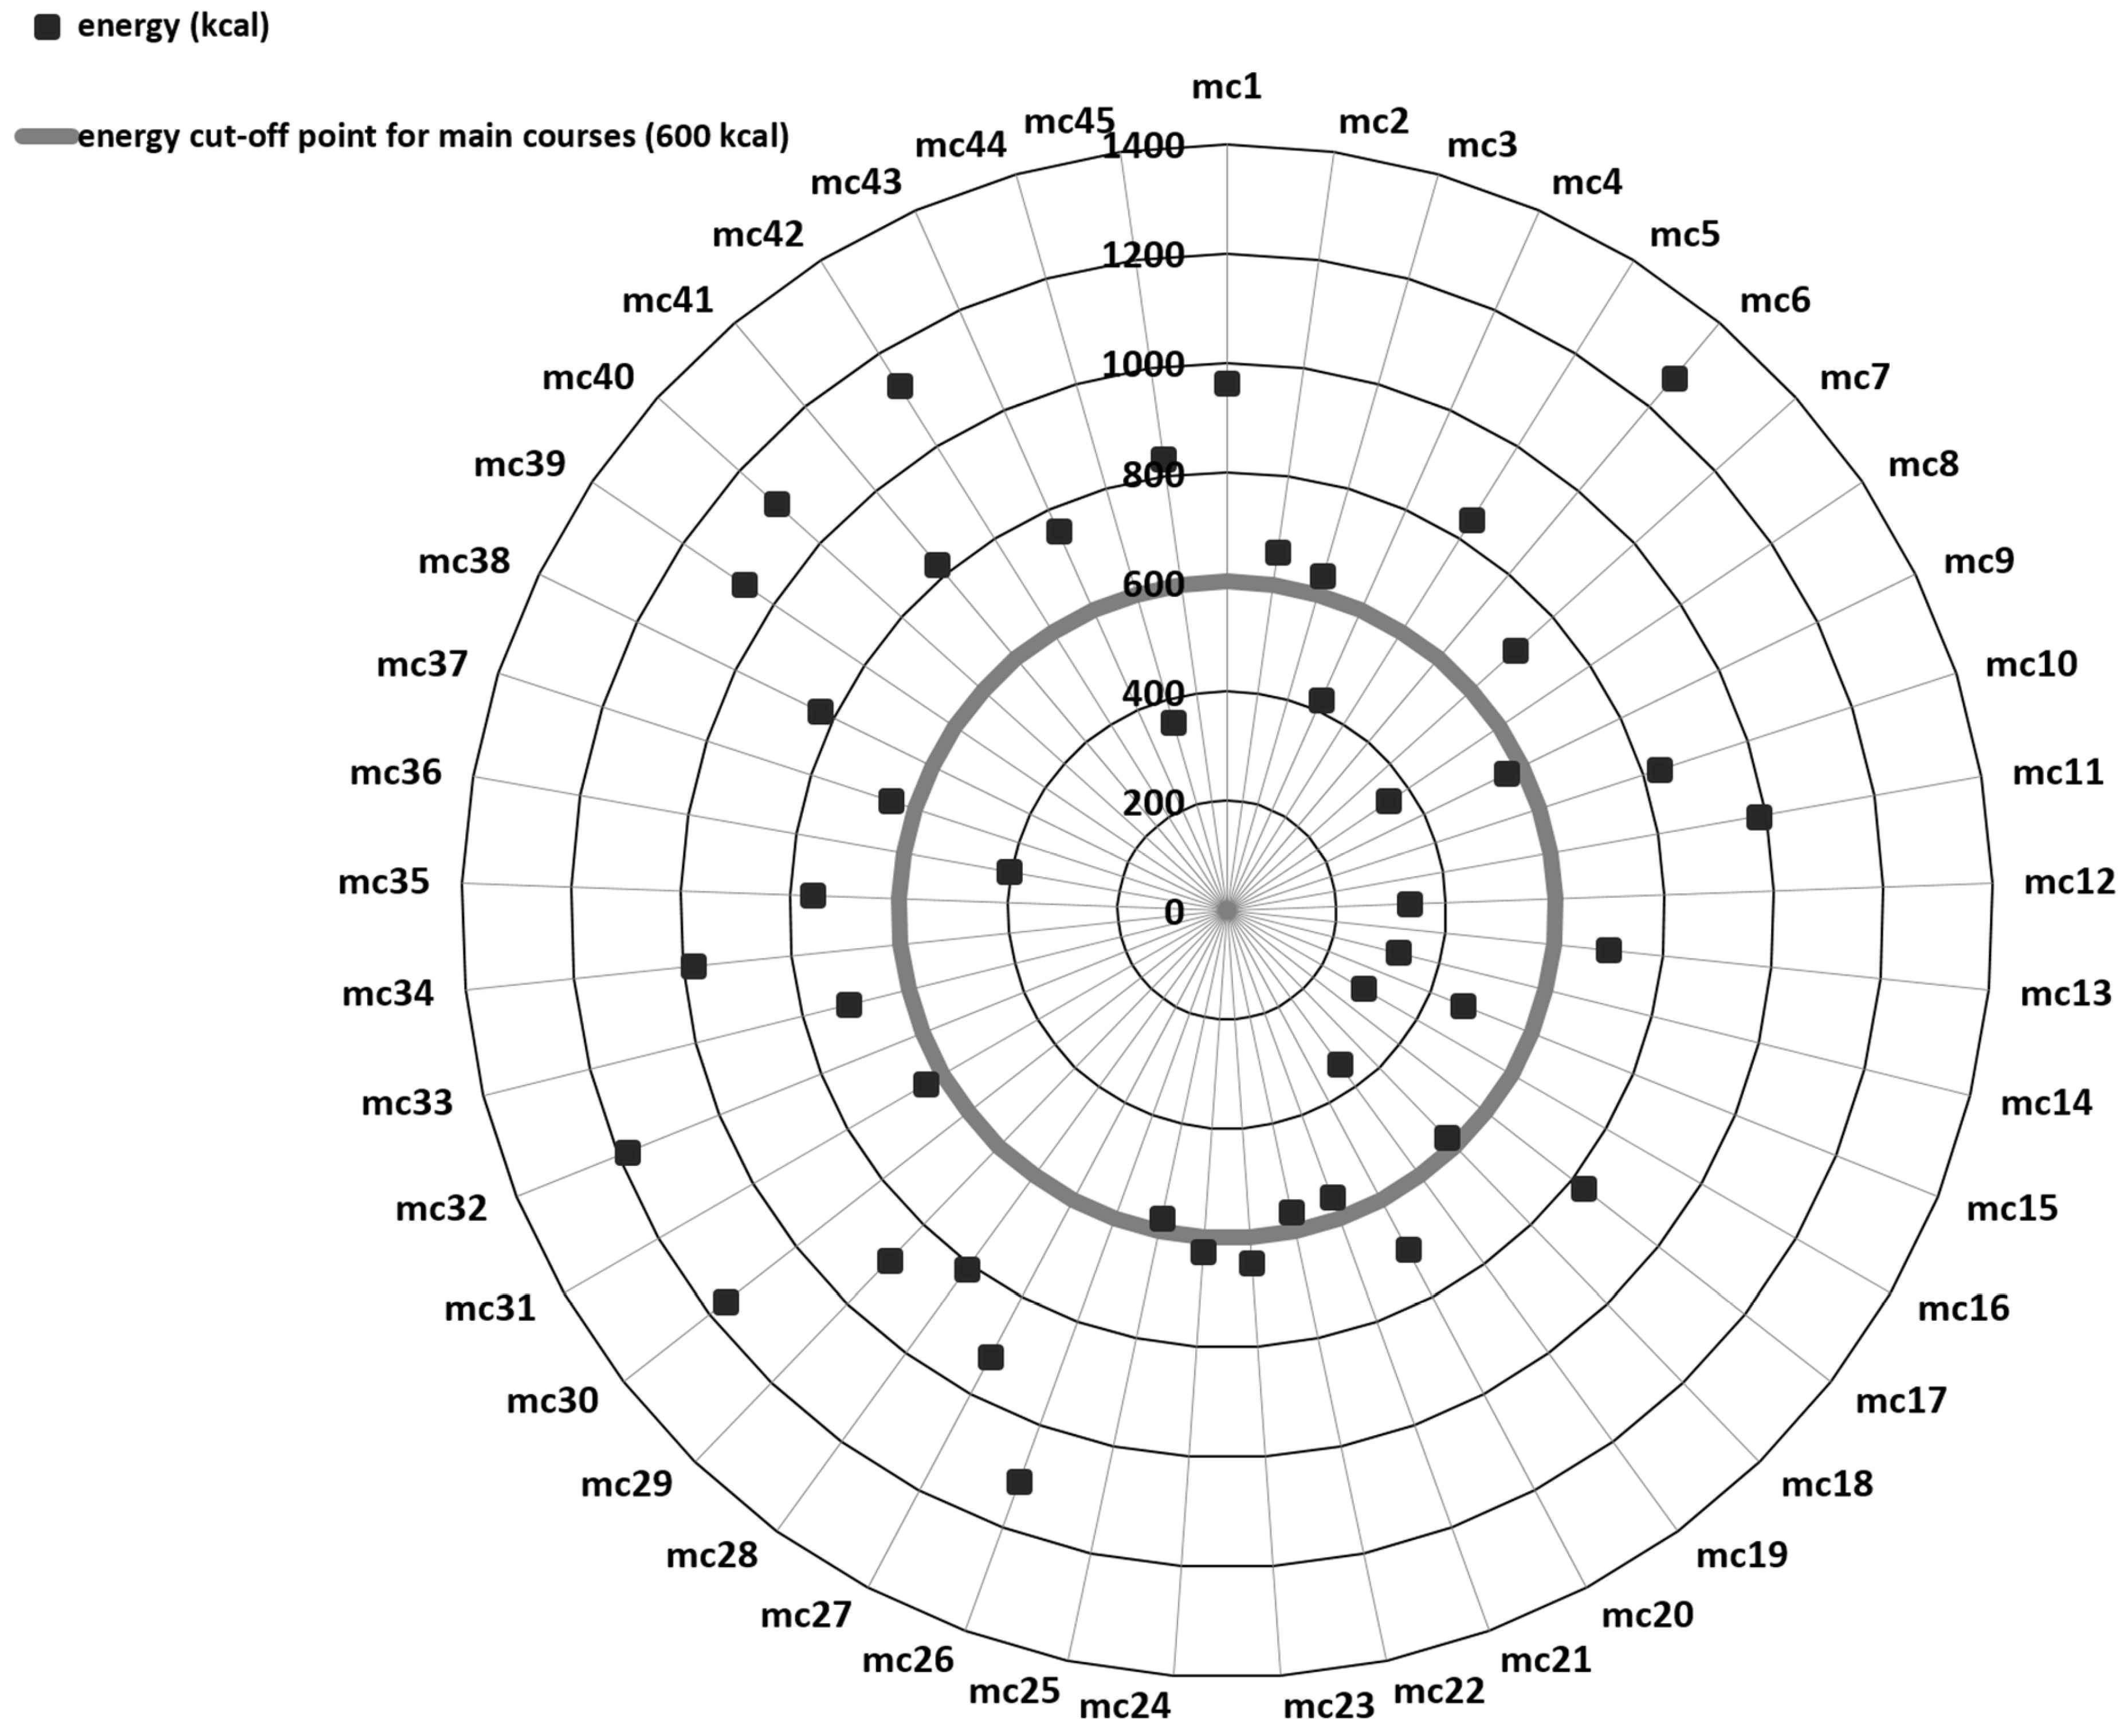
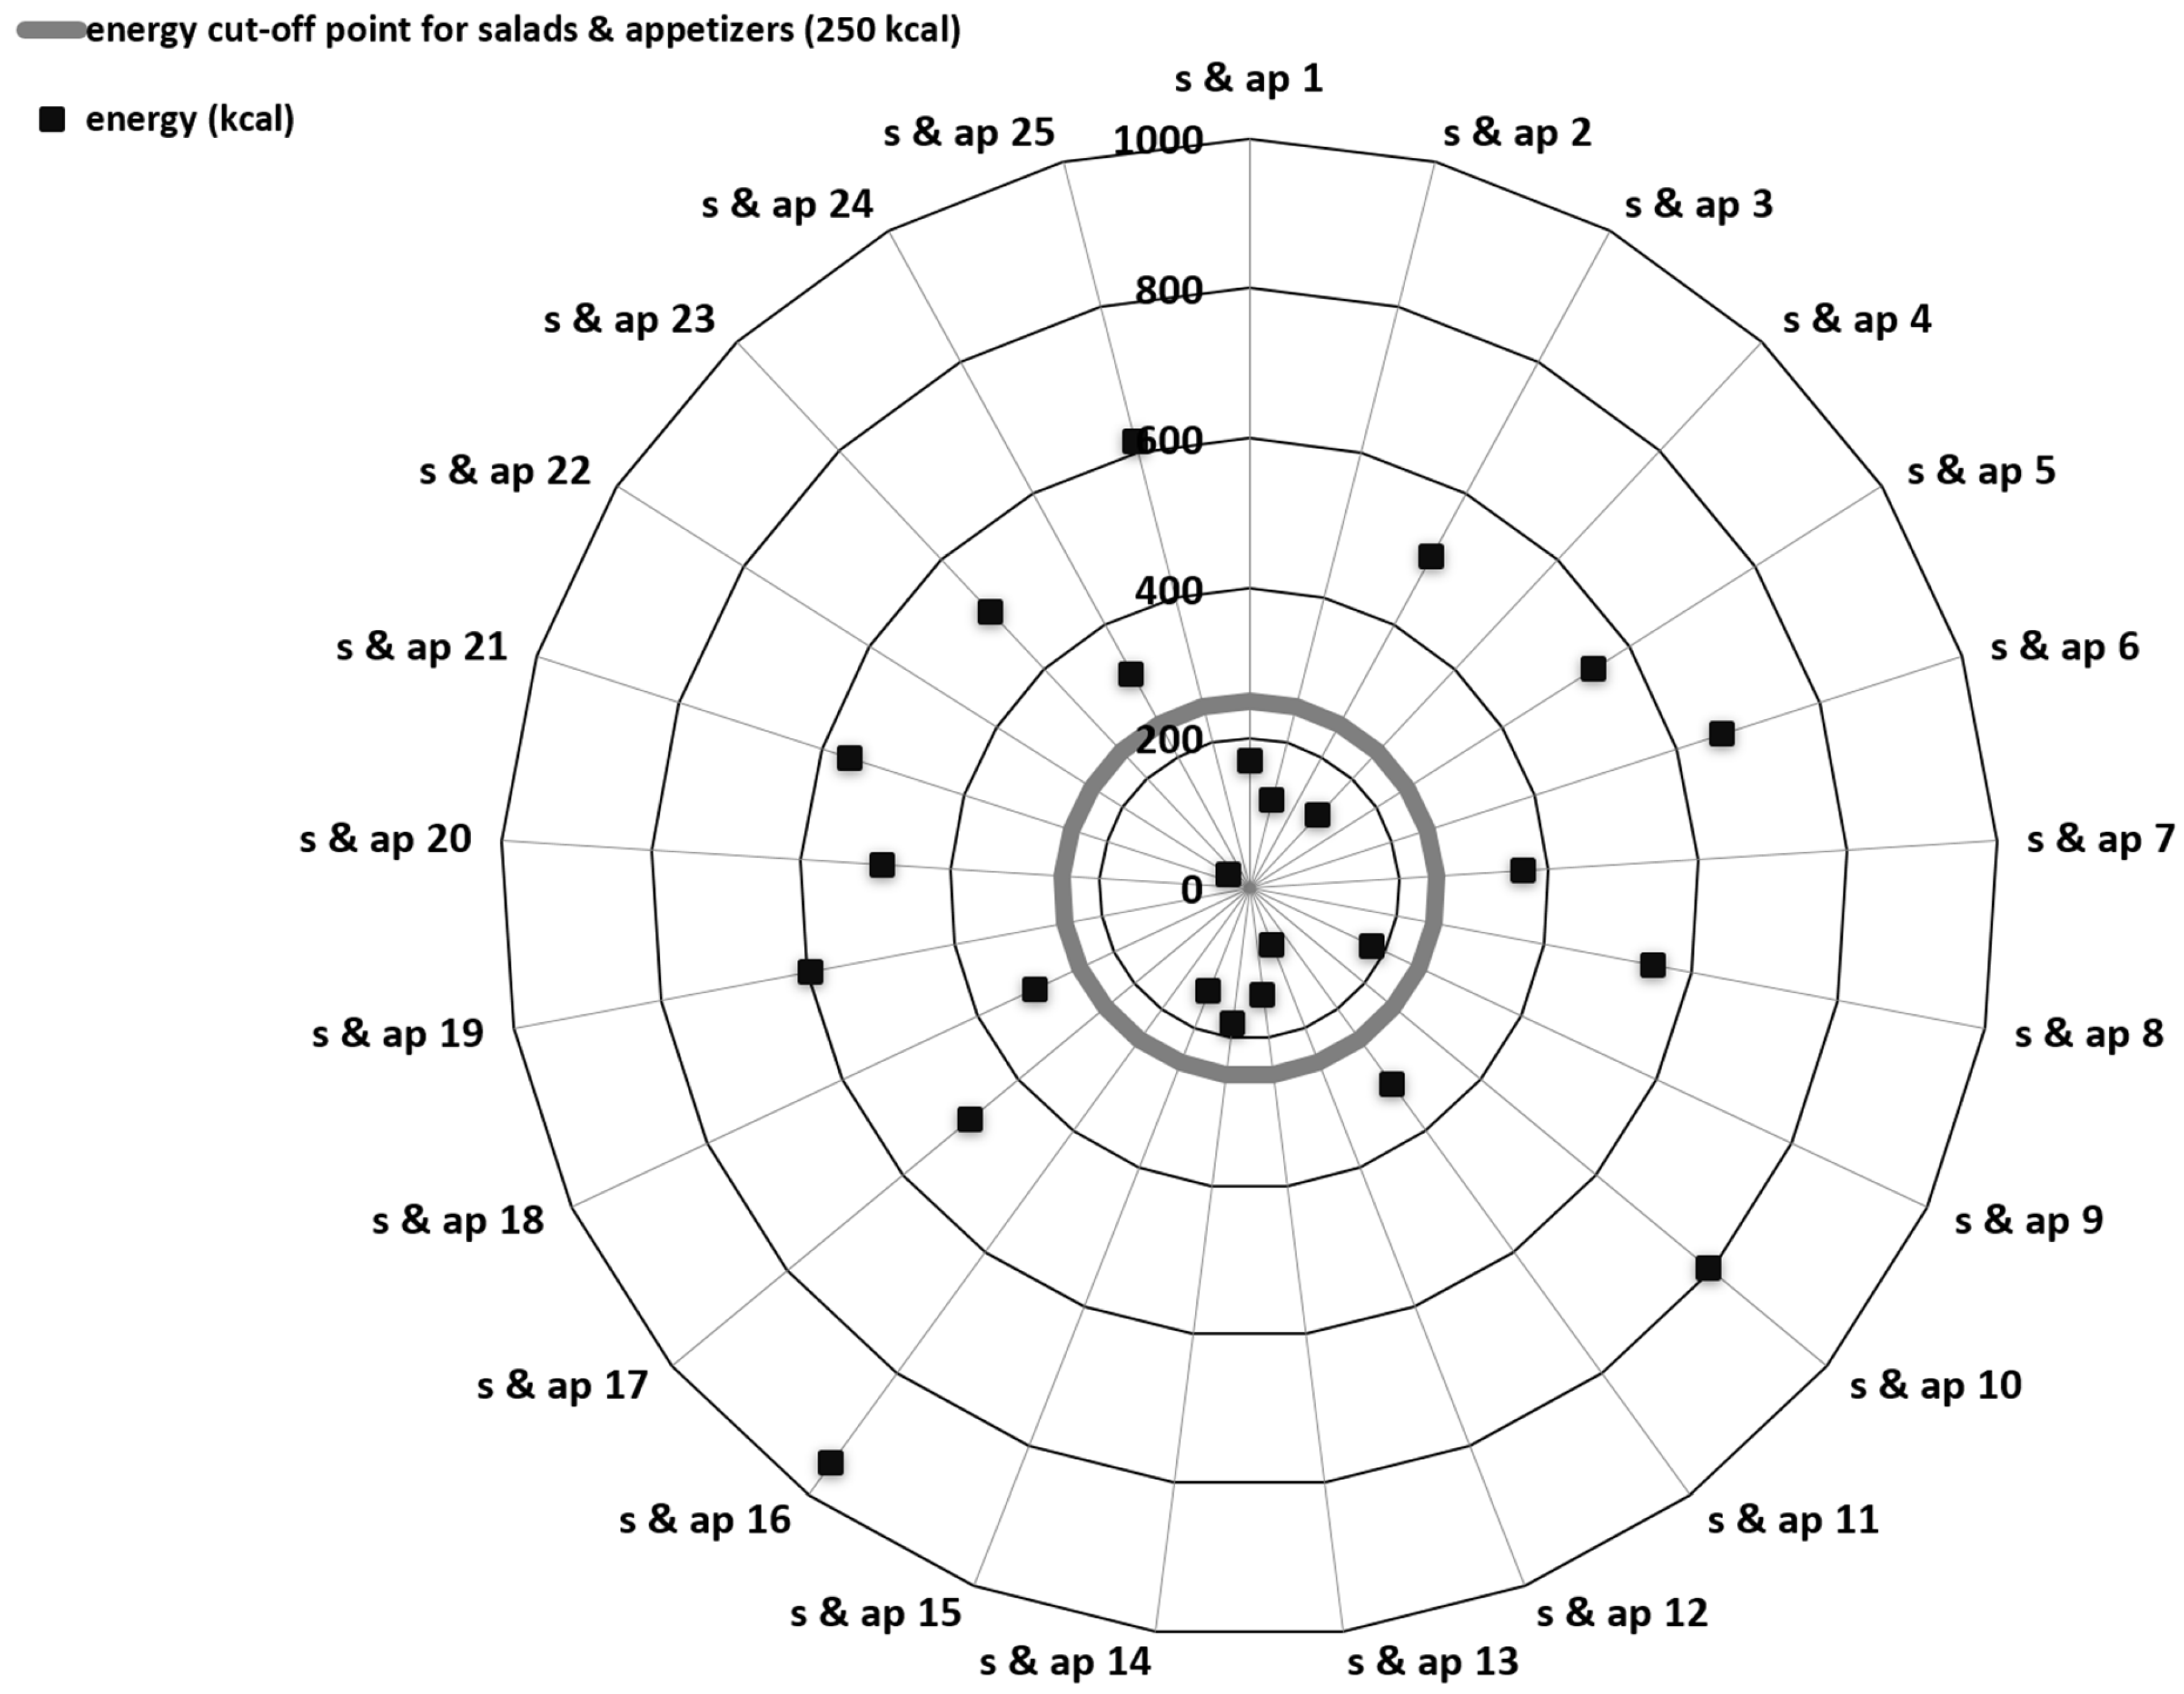
Figure 3 and Figure 4 present the caloric content per serving of individual main courses (mc) and salads/appetizers (s & ap), alongside the specific caloric cut-off point for these meal categories, as indicated by the concentric circle within the radar charts. While some recipes in both groups comply with the respective caloric thresholds, the majority appear to exceed these limits.
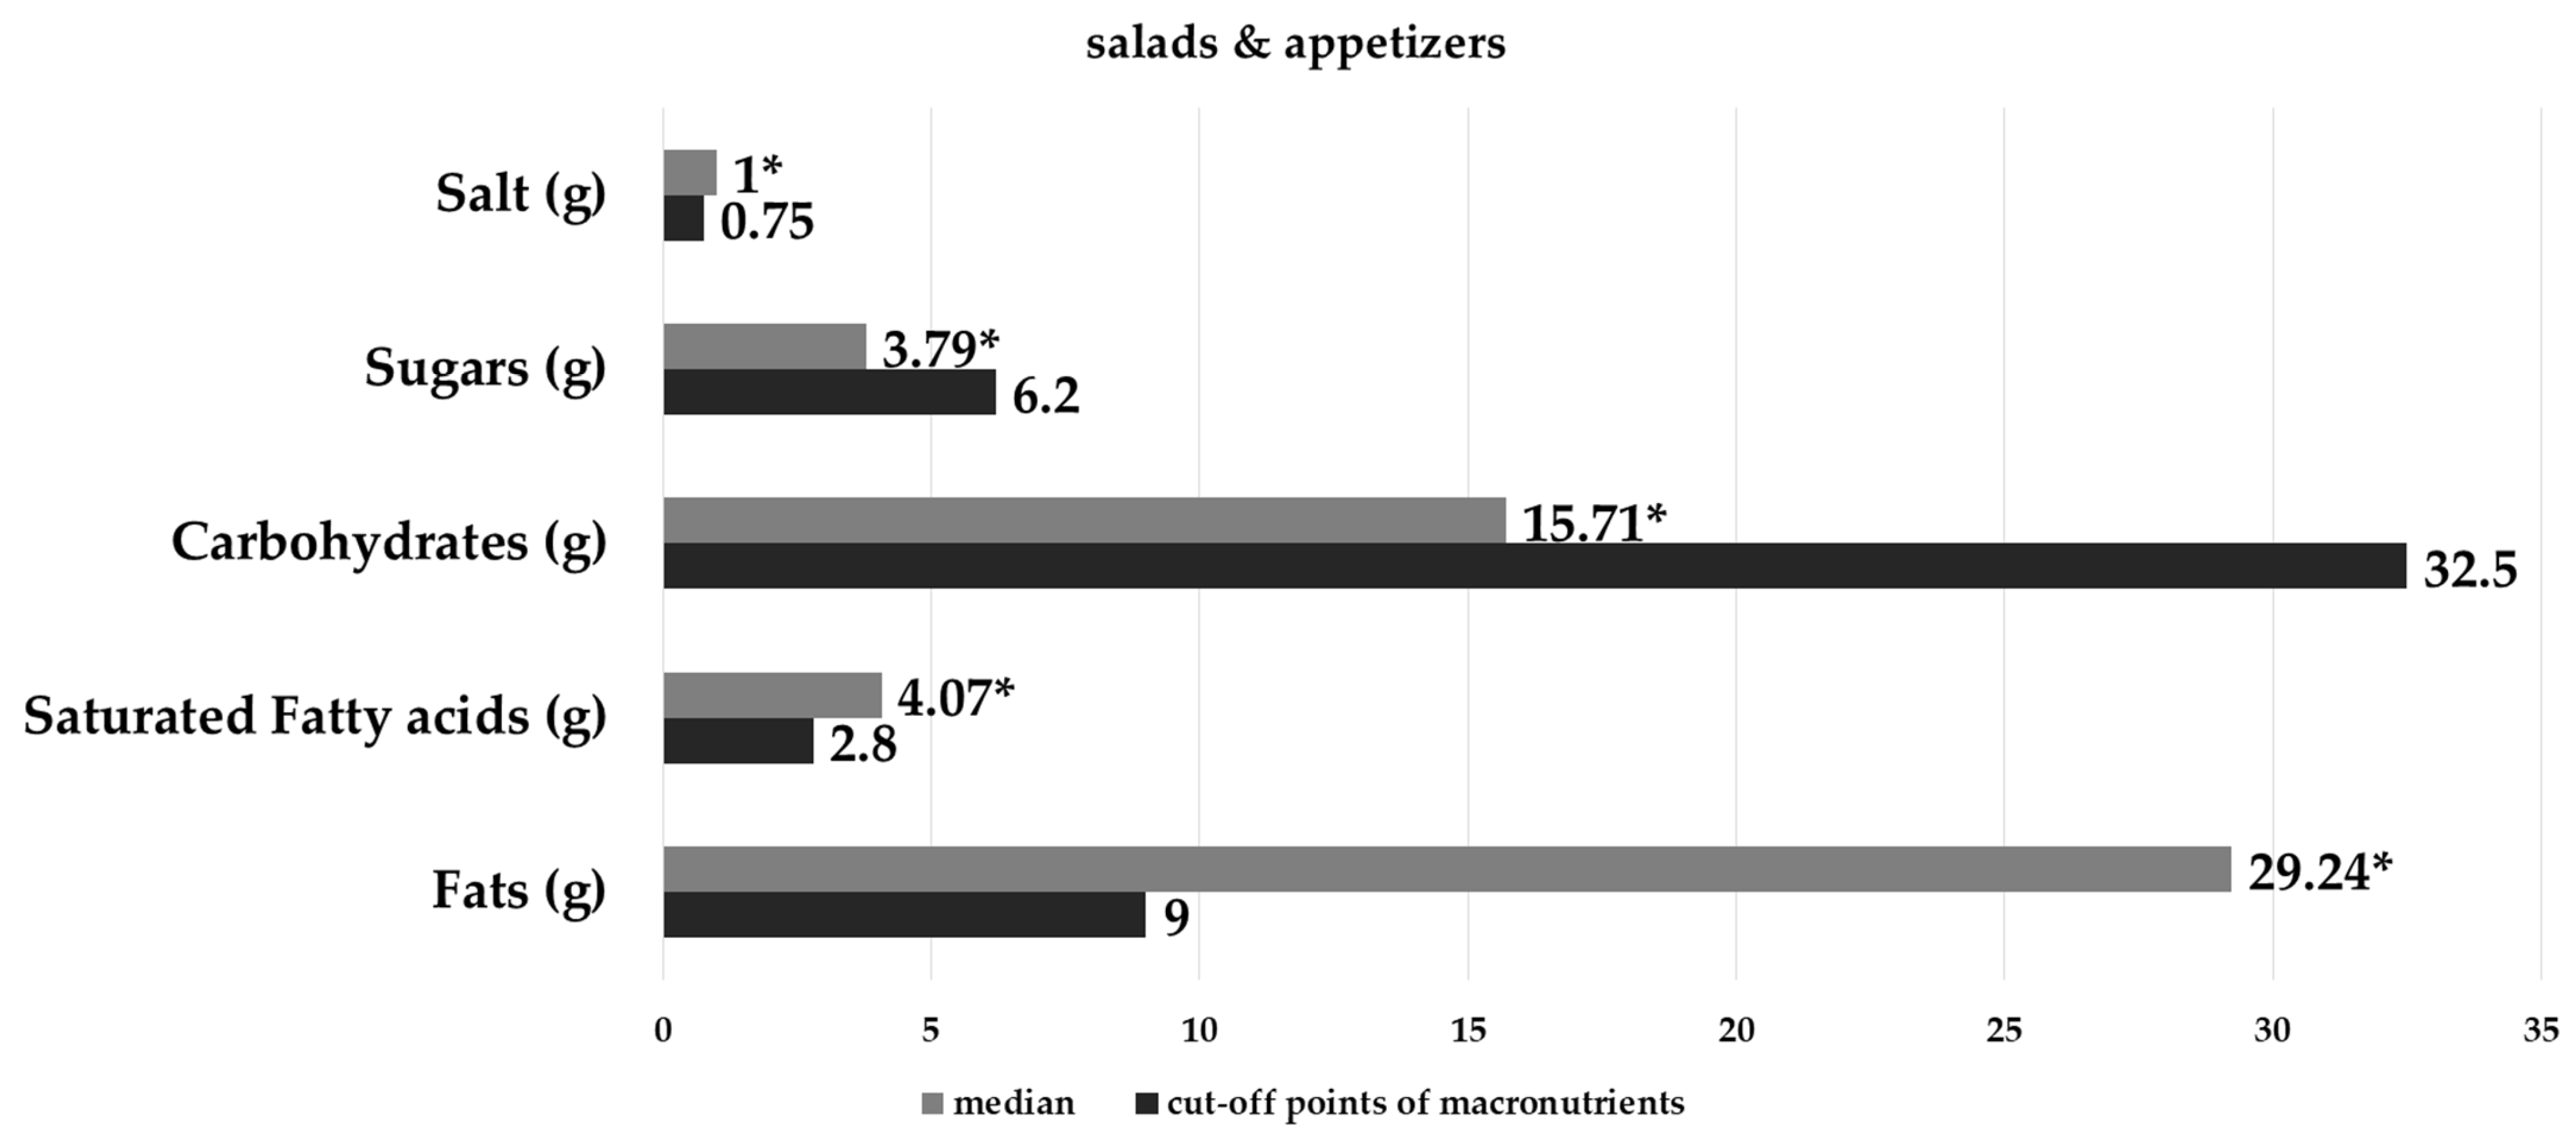
Due to the non-normal distribution of the data, a Wilcoxon signed-rank test was conducted to compare the median values of nutrients in salads and appetizers against established cut-off points. The analysis revealed that all nutritional parameters differed significantly from the reference values (p-value < 0.05). Specifically, the median energy value (365.46 kcal) was significantly higher than the established cut-off point of 250 kcal (p-value < 0.05). Moreover, the median content of total fats (29.24 g), saturated fatty acids (4.07 g), and salt (1 g) significantly exceeded the cut-off thresholds. Conversely, the levels of carbohydrates (15.71 g) and sugars (3.79 g) were found to be significantly lower than the recommended cut-off points (Figure 5).
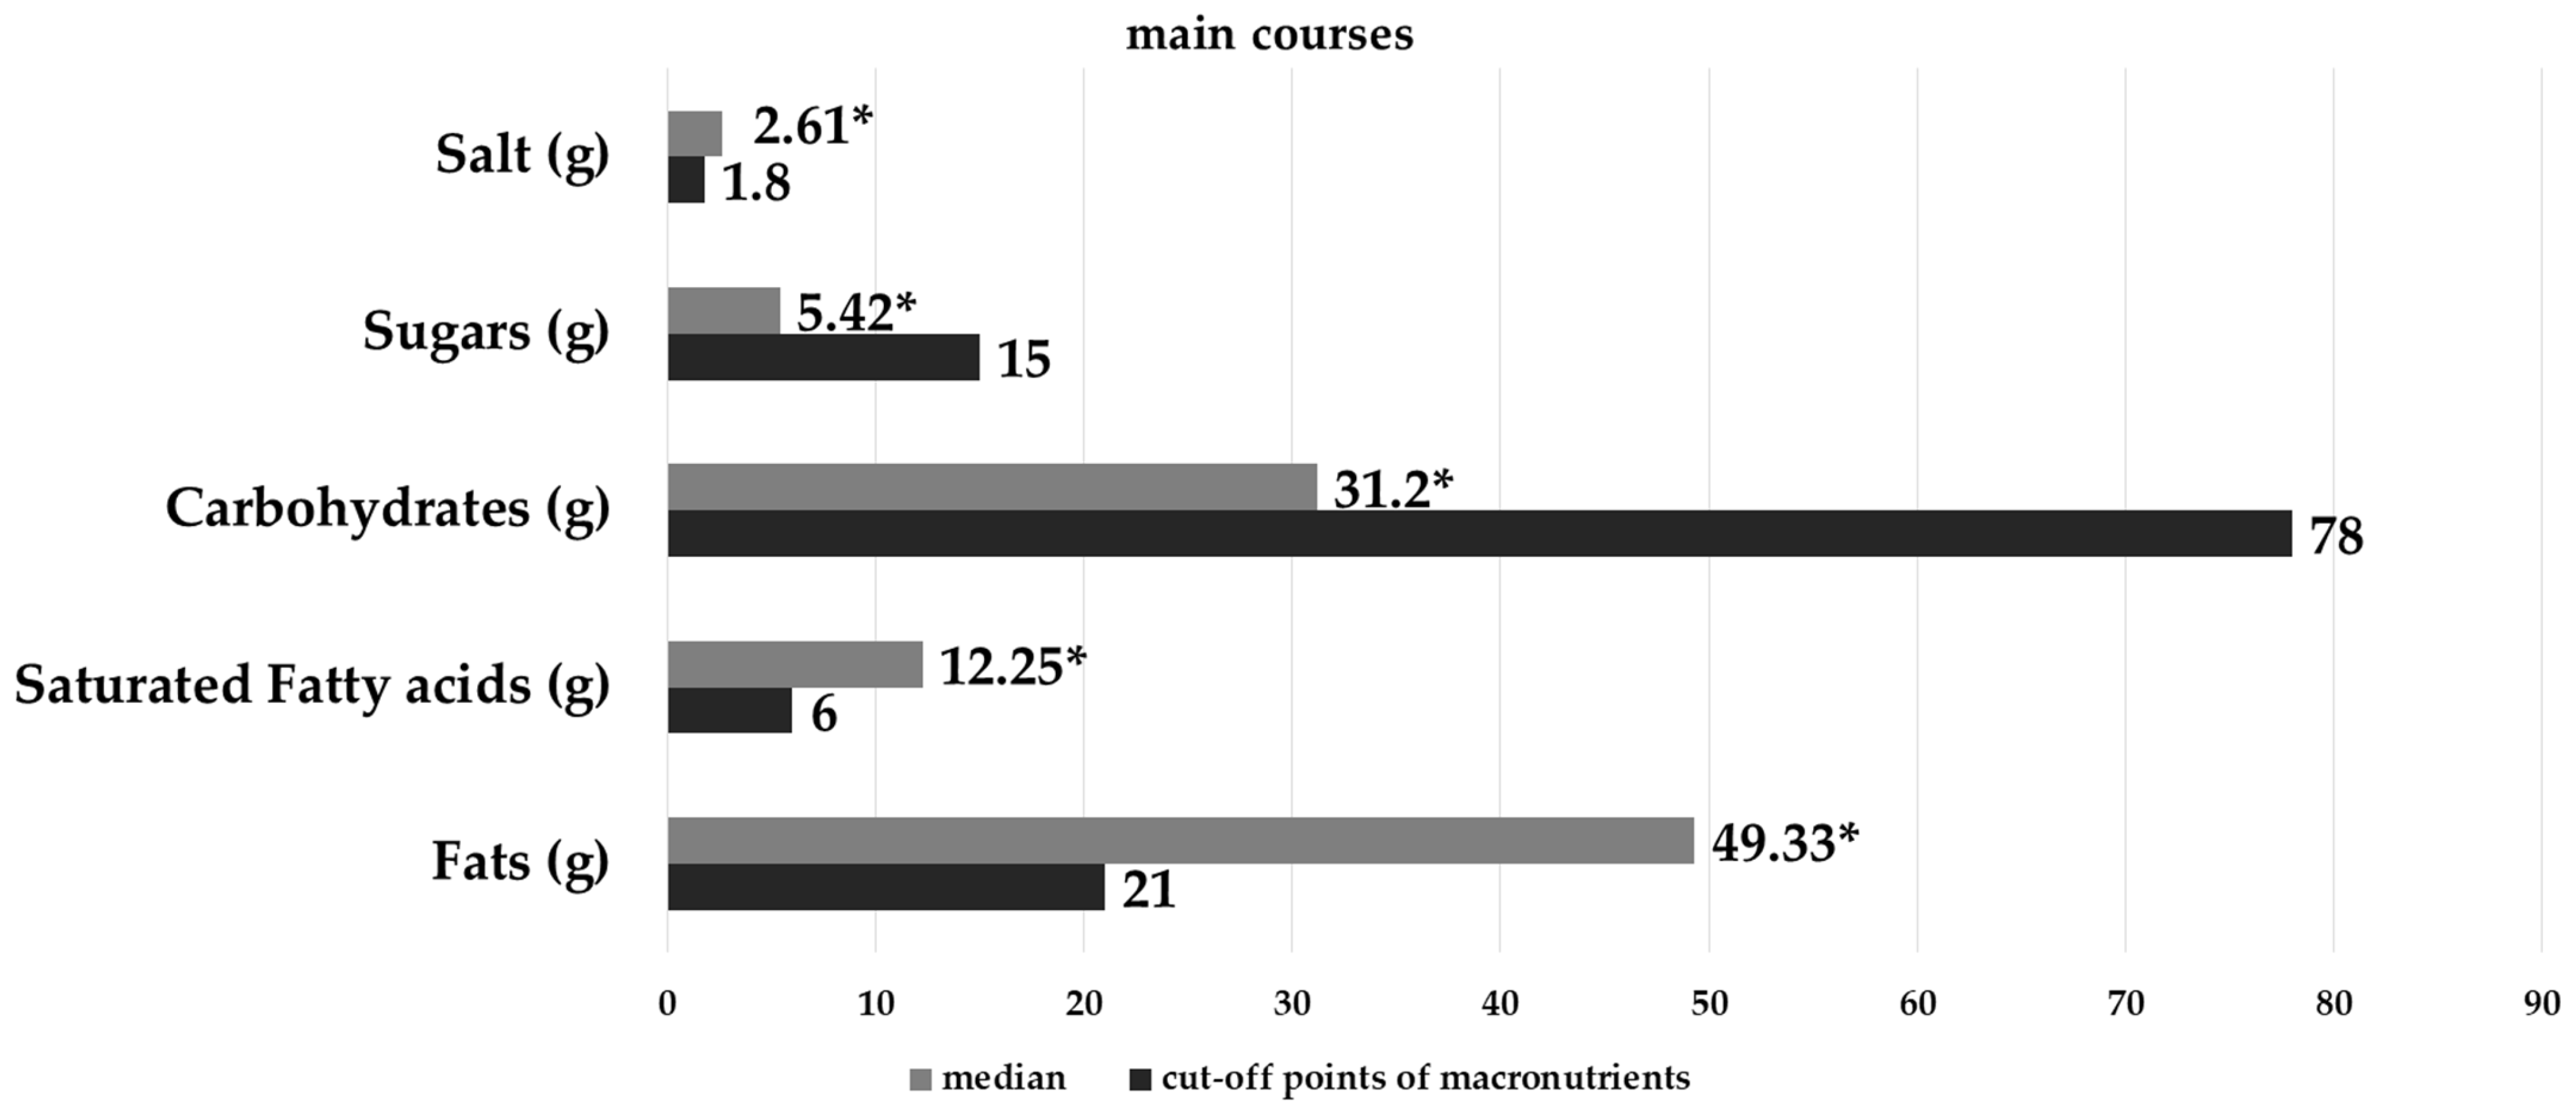
Regarding the main courses category, the Wilcoxon signed-rank test indicated significant deviations from the reference nutritional cut-off points for all examined parameters (p-value < 0.05). The most prominent finding is the extreme excess in total fat content, with a median value of 49.33 g—more than double the 21 g cut-off point. Similarly, saturated fatty acids (12.25 g) and salt (2.61 g) significantly exceeded their respective thresholds. On the other hand, the content of carbohydrates (31.2 g) and sugars (5.42 g) remained significantly lower than the recommended cut-off values, following the same trend observed in the appetizers but with higher absolute values (Figure 6).
In contrast to the other nutritional parameters, the energy content of main courses followed a normal distribution, as confirmed by the Kolmogorov–Smirnov test (p-value > 0.05). Consequently, a one-sample t-test was employed to compare the mean energy value against the 600 kcal cut-off point. The analysis revealed that the mean energy content (730.74 kcal ± [259.1 kcal]) was significantly higher than the established threshold (p-value < 0.05).

4. Discussion

The present study is the first one to provide a comprehensive evaluation of the nutritional characteristics of traditional Greek recipes incorporating table olives. Many recipes were found to share a similar nutritional profile, with energy predominantly derived from fats, particularly monounsaturated fatty acids, reflecting the central role of table olives in these dishes. Carbohydrates and proteins contributed to a lesser extent, with average carbohydrate content exceeding that of proteins.
The nutritional evaluation reveals a consistent, fat-driven axis across all recipe categories, where caloric density is primarily derived from fats rather than carbohydrates or sugars. These multivariate patterns from the PCA loading plot—where Factor 1 (47.94% of total variance) is defined by a strong correlation between total fats, salt, and energy—are fully aligned with the results of the Wilcoxon and one-sample t-tests (p < 0.05). This statistical synergy confirms that even the ‘salads and appetizers’ category, often perceived as a lighter option, significantly deviates from public health guidelines. Specifically, the median energy value for appetizers (365.46 kcal) exceeds the 250 kcal threshold by approximately 46%, while the median fat content (29.24 g) is more than triple the reference value (9 g), highlighting a pervasive trend of high caloric load driven by the recipes’ fat profile. While both categories exhibit high-fat and high-sodium profiles, ‘main courses’ serve as the primary driver of this nutritional imbalance, featuring nearly double the median fat content (49.33 g) and significantly higher salt levels (2.61 g) compared to appetizers.
These findings underscore a ‘nutritional paradox’: the extensive use of high-quality Mediterranean ingredients, such as table olives and olive oil (reflected in the clustering toward the monounsaturated fat vertex), results in recipes that exceed established energy and sodium thresholds. Given that carbohydrate and sugar levels remain significantly lower than recommended limits, the caloric surplus is almost exclusively fat-based. Consequently, strategic recipe reformulation is essential, focusing on the reduction of added fats and salt—likely stemming from olive processing—and the implementation of portion control to align traditional olive-based dishes with modern dietary standards.

4.1. Interpretation of Findings and Comparison with Previous Studies

The results of the present study are consistent with existing literature on the fat-rich composition of table olives [1,2] and extend this knowledge by examining their contribution within complete culinary preparations. Principal component analysis demonstrated that recipe energy content is primarily associated with fats—particularly monounsaturated fatty acids—alongside sodium and ash, reflecting the dominant role of table olives and related ingredients [1,2].
The principal component analysis further demonstrated that proteins, carbohydrates, sugars, and dietary fiber exhibited orthogonal or opposing vector orientations relative to total energy, indicating a limited contribution to caloric variability across recipes. This finding supports the notion that, in traditional olive-based recipes, energy content is driven predominantly by fat-rich ingredients rather than carbohydrate- or protein-based components, a characteristic feature of Mediterranean dietary patterns [1].
Although the mean energy density of the olive-based recipes examined in this study (155.97 kcal/100 g) falls within ranges previously reported for composite meals and culinary recipes, this finding should be interpreted with caution. While such values may appear compatible with nutritionally balanced meal frameworks when expressed per 100 g [22], several studies have demonstrated that recipe-based assessments frequently underestimate actual energy content due to large or poorly defined portion sizes [31,32]. Consequently, energy density alone may provide an incomplete picture of the true nutritional impact of these dishes.
The macronutrient distribution observed in the present study is characterized by a clear predominance of fat, with a mean fat content of 11 g/100 g, exceeding protein and carbohydrate contributions. This pattern mirrors findings from analyses of media-promoted and supermarket recipes [32,33], suggesting that high-fat profiles are a recurring feature of widely disseminated culinary preparations. However, unlike many ready-to-eat meals sold in retail settings—often rich in saturated fats and refined carbohydrates [34]—the elevated fat content in the present recipes appears to be largely attributable to table olives and associated ingredients typical of Mediterranean cuisine.
From a qualitative standpoint, the relatively moderate levels of saturated fats (mean: 2.42 g/100 g) indicate a fat profile dominated by unsaturated fatty acids, a feature generally regarded as nutritionally advantageous. Nevertheless, the high variability observed in fat content across recipes (0.77–45.78 g/100 g) highlights substantial heterogeneity in formulation and suggests that certain preparations may exceed recommended fat intakes, particularly when consumed in realistic portion sizes. This variability was further supported by the multivariate analyses, where the PCA plot revealed strong associations between energy and fat-related variables, reinforcing the central role of fats in determining overall energy content.
In contrast, proteins, carbohydrates, sugars, and dietary fiber contributed less consistently to total energy and showed weak associations with energy-related components in the PCA. While low sugar content may be viewed positively, the generally modest fiber levels (mean: 1.24 g/100 g) raise concerns regarding the overall nutritional balance of these dishes, particularly in light of dietary guidelines that emphasize fiber-rich meal patterns. Similar limitations have been reported in previous evaluations of internet-based and media-derived recipes [31,33], suggesting a broader structural issue in recipe composition rather than an isolated characteristic of olive-based dishes.
Overall, while the olive-based recipes analyzed in this study reflect key attributes of Mediterranean culinary traditions—particularly the predominance of unsaturated fats—the findings also reveal important nutritional imbalances related to fat density, fiber content, and portion size. These results underscore the need for critical evaluation and targeted recipe reformulation to ensure that traditional dishes align more closely with contemporary nutritional recommendations, rather than assuming inherent healthfulness based solely on their Mediterranean origin.

4.2. Strengths and Weaknesses

During the conduct of the above study, several challenges were encountered. Initially, some recipes were incomplete regarding the precise quantities of certain ingredients. For example, many recipes included oil, vinegar, salt, and other ingredients without specifying the amounts, necessitating approximate estimations. A similar difficulty arose from vague instructions regarding ingredient quantities, such as “add flour as needed,” which may have introduced some variability. Many ingredients were recorded using household measures, such as cups, teaspoons, or tablespoons. Consequently, these had to be converted to grams, a process prone to errors due to variations between utensils. Additionally, the number of servings for many recipes was often not specified, requiring assumptions that could have led to inaccuracies. Some recipes also included terms from various local dialects, complicating both the identification of ingredients and the nutritional analysis. Finally, for many ingredients, the exact type was not provided—for instance, the specific type of cheese or oil—necessitating assumptions regarding their precise nature.

4.3. Implications for Further Research and Practice

The evidence base for table olive contributions to public health policy faces substantial challenges. Moderate consumption of 1–2 portions daily (5–10 table olives) as part of a healthy dietary pattern aligns with Mediterranean Diet guidelines. The general population, particularly those at risk for cardiovascular disease, represents the primary target for potential recommendations. Additionally, elderly populations would benefit most regarding bone health outcomes, and those at risk of chronic diseases, including atherosclerosis, neurological disorders, and some cancers, may benefit from the antioxidant and anti-inflammatory properties.
The variability observed in energy density and macronutrient composition among olive-based recipes highlights the need for further research using larger samples and more standardized recipes. Future studies should incorporate clearly defined portion sizes and expand nutritional assessments to include sodium and micronutrient content, which are particularly relevant for olive-based and brined foods. Additionally, exploring the effects of alternative culinary techniques and ingredient modifications may help identify strategies to enhance nutritional balance while preserving the traditional character of olive-based dishes. Multivariate analytical approaches, such as principal component analysis and multidimensional visualization tools, may further support the identification of nutritionally favorable recipe patterns.
Research indicates that a significant portion of consumers, including up to 60% of children in certain studies, do not consume olives in their traditional form (e.g., as a breakfast item), often due to their high salt and acidity levels. Utilizing table olives as ingredients in processed foods can help overcome these sensory barriers and encourage higher intake [18].
Furthermore, the diversification of table olive products—including their use as “value-added” ingredients in functional foods—is recognized by researchers as a necessary step for the industry to meet modern consumer demands [35]. While table olives have a unique nutritional profile, their role is often limited to a “decoration” or an appetizer. Scientific consensus suggests that integrating them into staple foods like bread or dairy formulations not only boosts their consumption but also allows them to serve as carriers for beneficial nutrients and probiotics [1,14].
From a practical perspective, these findings suggest that traditional or Mediterranean-inspired recipes, while nutritionally rich, may require adaptation to suit modern lifestyle requirements. It should be noted that many of these recipes were originally developed to support energy-intensive lifestyles and demanding manual labor, where high caloric density was a necessity. However, for the contemporary sedentary population, the frequent exceedance of caloric thresholds underscores the importance of portion control and informed recipe formulation. These insights may support healthcare professionals, chefs, and recipe developers in re-contextualizing traditional olive-based dishes to align with contemporary nutritional guidelines, while enabling relevant authorities to promote culinary practices that integrate nutritional evidence with gastronomic heritage.

5. Conclusions

This study constitutes the first systematic investigation of the nutritional profile of recipes incorporating table olives. Although it provides preliminary insights, further validation, expanded research, and the inclusion of additional recipes are warranted. The results may offer valuable information for healthcare professionals, including dietitians and nutritionists, regarding the nutritional composition of traditional dishes. It may also inform the relevant authorities in supporting initiatives for the development of table olive-based recipes in Mediterranean countries. Developing nutritionally balanced, olive-based recipes could foster adherence to the Mediterranean diet, preserve traditional gastronomy, and support the local agricultural economy.

Author Contributions

Conceptualization, K.G. and G.B.; methodology, K.G. and G.B.; formal analysis, G.B.; investigation, K.G.; resources, K.G.; data curation, K.G.; writing—original draft preparation, K.G.; writing—review and editing, G.B.; visualization, K.G.; supervision, G.B.; project administration, G.B. All authors have read and agreed to the published version of the manuscript.

Funding

This research received no external funding.

Institutional Review Board Statement

Not applicable.

Informed Consent Statement

Not applicable.

Data Availability Statement

Data is unavailable due to privacy.

Conflicts of Interest

The authors declare no conflicts of interest.

Abbreviations

The following abbreviations are used in this manuscript:
NBNutritionally Balanced
SFAsSaturated Fatty Acids
MUFAsMonounsaturated Fatty Acids
PUFAsPolyunsaturated Fatty Acids

References

  1. Boskou, D. Olive fruit, table olives, and olive oil bioactive constituents. In Olive and Olive Oil Bioactive Constituents; Boskou, D., Ed.; AOCS Press: Urbana, IL, USA, 2015; pp. 1–30. [Google Scholar]
  2. Rocha, J.; Borges, N.; Pinho, O. Table olives and health: A review. J. Nutr. Sci. 2020, 9, e57. [Google Scholar] [CrossRef] [Scilit]
  3. Lanza, B. Nutritional and sensory quality of table olives. In Olive Germplasm—The Olive Cultivation, Table Olive and Olive Oil Industry in Italy; Muzzalupo, I., Ed.; Intech: Rijeka, Croatia, 2012; pp. 343–372. [Google Scholar]
  4. Zoidou, E.; Melliou, E.; Gikas, E.; Tsarbopoulos, A.; Magiatis, P.; Skaltsounis, A.L. Identification of Throuba Thassos, a traditional Greek table olive variety, as a nutritional rich source of oleuropein. J. Agric. Food Chem. 2010, 58, 46–50. [Google Scholar] [CrossRef] [Scilit] [PubMed]
  5. Durante, M.; Tufariello, M.; Tommasi, L.; Lenucci, M.S.; Bleve, G.; Mita, G. Evaluation of Bioactive Compounds in Black Table Olives Fermented with Selected Microbial Starters. J. Sci. Food Agric. 2018, 98, 96–103. [Google Scholar] [CrossRef] [Scilit] [PubMed]
  6. Boskou, G. Antioxidant capacity and phenolic profile of table olives from the Greek market. In Olives and Olive Oil in Health and Disease Prevention; Preedy, V.R., Watson, R.R., Eds.; Academic Press: Cambridge, MA, USA, 2010; pp. 925–934. [Google Scholar]
  7. Melliou, E.; Zweigenbaum, J.A.; Mitchell, A.E. Ultrahigh-pressure liquid chromatography triple-quadrupole tandem mass spectrometry quantitation of polyphenols and secoiridoids in California-style black ripe olives and dry salt-cured olives. J. Agric. Food Chem. 2015, 63, 2400–2405. [Google Scholar] [CrossRef] [Scilit] [PubMed]
  8. Gougoulias, N.; Giurgiulescu, L.; Vagelas, I.; Wogiatzi, E.; Ntalla, M.N. Changes in total phenol content and antioxidant activity of Greek table olive cultivar amfissis during maturation. Stud. Univ. Babes Bolyai Ser. Chem. 2017, 62, 387–396. [Google Scholar] [CrossRef] [Scilit]
  9. Hassapidou, M.N.; Balatsouras, G.D.; Manoukas, A.G. Effect of processing upon the tocopherol and tocotrienol composition of table olives. Food Chem. 1994, 50, 111–114. [Google Scholar] [CrossRef] [Scilit]
  10. Kazou, M.; Nikolopoulou, E.; Panagou, E.Z. Greek table olives: An overview on the impact of processing elaborations on the content of biophenols and related nutritional implications. Eur. Food Res. Technol. 2003, 249, 3151–3164. [Google Scholar]
  11. Chin, K.Y.; Ima-Nirwana, S. Olives and bone: A green osteoporosis prevention option. Int. J. Environ. Res. Public Health 2016, 13, 755. [Google Scholar] [CrossRef] [Scilit]
  12. Fernández, A.G.; Adams, M.R.; Fernandez-Diez, M.J. Naturally black olives in brine. In Table Olives: Production and Processing; Chapman & Hall: London, UK, 1997; p. 299. [Google Scholar]
  13. Charoenprasert, S.; Mitchell, A. Influence of California-style black ripe olive processing on the formation of acrylamide. J. Agric. Food Chem. 2014, 62, 8716–8721. [Google Scholar] [CrossRef] [Scilit]
  14. Perpetuini, G.; Prete, R.; Garcia-Gonzalez, N.; Khairul Alam, M.; Corsetti, A. Table olives more than a fermented food. Foods 2020, 9, 178. [Google Scholar] [CrossRef] [Scilit]
  15. García, P.G.; Barranco, C.R.; Quintana, M.D.; Fernández, A.G. Biogenic amine formation and “zapatera” spoilage of fermented green olives: Effect of storage temperature and debittering process. J. Food Prot. 2004, 67, 117–123. [Google Scholar] [CrossRef] [Scilit]
  16. Papadaki, A.; Valsta, L.M.; Lampi, A.M.; Peñalvo, J.; Adlercreutz, H.; Vardavas, C.; Kafatos, A. Differences in nutrient intake during a Greek Orthodox Christian fasting and non-fasting week, as assessed by a food composition database and chemical analyses of 7-day weighed food samples. J. Food Compos. Anal. 2011, 24, 22–28. [Google Scholar] [CrossRef] [Scilit]
  17. Bach-Faig, A.; Berry, E.M.; Lairon, D.; Reguant, J.; Trichopoulou, A.; Dernini, S.; Medina, F.X.; Battino, M.; Belahsen, R.; Miranda, G.; et al. Mediterranean diet pyramid today. Science and cultural updates. Public Health Nutr. 2011, 14, 2274–2284. [Google Scholar] [CrossRef] [Scilit] [PubMed]
  18. Ozdemır, Y.; Ozturk, A.; Kayahan, S.; Keskınel, O. Determination of Table Olive and Olive Oil Consumption and Preference of Children from Yalova/Turkey. Eurasian J. Food Sci. Technol. 2017, 1, 9–15. [Google Scholar]
  19. Collective Work. Patroparadotes Ellinikes Syntages [Traditional Greek Recipes]; Fytrakis Publications: Athens, Greece, 1980. [Google Scholar]
  20. Tselementes, N. O Authentikos Tselementes tou Nikou Tselemente [The Authentic Tselementes by Nikos Tselementes]; Maniatea Publications: Athens, Greece, 1995; pp. 1–2. [Google Scholar]
  21. Kochilas, D. I Gefsi apo to Alpha eos to Omega [The Taste from A to Z]; Ta Nea Publications: Athens, Greece, 2008. [Google Scholar]
  22. Giazitzi, K.; Boskou, G. Developing a methodology to create nutritionally balanced meals. Br. Food J. 2021, 123, 2170–2182. [Google Scholar] [CrossRef] [Scilit]
  23. U.S. Department of Agriculture, Agricultural Research Service, Beltsville Human Nutrition Research Center. FoodData Central. Available online: https://fdc.nal.usda.gov/ (accessed on 10 September 2025).
  24. EuroFIR FoodExplorer. Available online: https://www.eurofir.org/foodexplorer/login2.php (accessed on 10 September 2025).
  25. U.S. Department of Agriculture. What Is My Plate? Available online: https://www.choosemyplate.gov/eathealthy/WhatIsMyPlate (accessed on 10 September 2025).
  26. Howard, S.; Adams, J.; White, M. Nutritional content of supermarket ready meals and recipes by television chefs in the United Kingdom: Cross sectional study. BMJ 2012, 345, e7607. [Google Scholar] [CrossRef] [Scilit]
  27. Benelam, B.; Stanner, S. Development of a methodology to assess the nutrient profile of popular UK meals. Nutr. Bull. 2015, 40, 315–325. [Google Scholar] [CrossRef] [Scilit]
  28. Public Health England. Plans to Cut Excess Calorie Consumption Unveiled. Available online: https://www.gov.uk/government/news/plans-to-cut-excess-calorie-consumption-unveiled (accessed on 10 September 2025).
  29. American Heart Association. Heart-Check Recipe Certification Program Nutrition Requirements. Available online: https://www.heart.org/en/healthy-living/company-collaboration/heart-check-certification/heart-check-certified-recipes/heart-check-recipecertification-program-nutrition-requirements (accessed on 10 September 2025).
  30. Who, J.; Consultation, F.E. Diet, Nutrition and the Prevention of Chronic Diseases; World Health Organization Technical Report Series; WHO: Geneva, Switzerland, 2003; Volume 916, pp. 1–149. [Google Scholar]
  31. Trattner, C.; Elsweiler, D.; Howard, S. Estimating the healthiness of internet recipes: A cross-sectional study. Front. Public Health 2017, 5, 16. [Google Scholar] [CrossRef] [Scilit]
  32. Wademan, J.; Myers, G.; Finch, A.; Dhaliwal, S.S.; Scott, J.; Begley, A. A recipe for success? A nutrient analysis of recipes promoted by supermarkets. Int. J. Environ. Res. Public Health 2020, 17, 4084. [Google Scholar] [CrossRef] [Scilit]
  33. Gaba, A.; Bennett, R.; Florez, K.; Soliman, G. Pandemic Recipes—Nutritional Values of Recipes in Legacy Media. Nutrients 2025, 17, 1830. [Google Scholar] [CrossRef] [Scilit]
  34. AlOudat, M.; Magyar, N.; Simon-Sarkadi, L.; Lugasi, A. Nutritional content of ready-to-eat meals sold in groceries in Hungary. Int. J. Gastron. Food Sci. 2021, 24, 100318. [Google Scholar] [CrossRef] [Scilit]
  35. López-López, A.; Moreno-Baquero, J.M.; Rodríguez-Gómez, F.; García-García, P.; Garrido-Fernández, A. Sensory assessment by consumers of traditional and potentially probiotic green Spanish-style table olives. Front. Nutr. 2018, 5, 53. [Google Scholar] [CrossRef] [Scilit]
Figure 1. Ternary Plot. Distribution of recipes based on their fat profiles. The position of each point indicates the relative proportion of fat subtypes, and the color gradient represents the total fat concentration (g) per 100 g of each recipe.
Gastronomy 04 00007 g001
Figure 2. Principal Component Analysis loading plot illustrating the relationships between fat types (SFAs, MUFAs, PUFAs), energy, proteins, and carbohydrate content in the analyzed recipes, per 100 g.
Gastronomy 04 00007 g002
Figure 3. Energy content of each main course (black dots) per serving. The grey circle displays the cut-off point (600 kcal) for the NB main courses.
Gastronomy 04 00007 g003
Figure 4. Energy content of each salad and appetizer (black dots) per serving. The grey circle displays the cut-off point (250 kcal) for the NB salads and appetizers.
Gastronomy 04 00007 g004
Figure 5. Comparison of median nutritional values in salads and appetizers (per portion) against established cut-off points. Light grey bars represent the sample median, while black bars denote the reference cut-off values. Asterisks (*) indicate statistically significant differences (p-value < 0.05) as determined by the Wilcoxon signed-rank test.
Gastronomy 04 00007 g005
Figure 6. Comparison of median nutritional values in main courses against established cut-off points. Light grey bars represent the sample median, while black bars denote the reference values. Statistical significance (p-value < 0.05) is indicated by an asterisk (*), based on the Wilcoxon signed-rank test.
Gastronomy 04 00007 g006
Table 1. Cut-off points for the nutritionally balanced meals [22].
Cut-Off Points for Nutritionally Balanced Meals
Main CoursesSalads/Appetizers
Energy (kcal)600<30% of RI (2000 kcal)250<12.5% of RI (2000 kcal)
Fats (g)21<30% of RI (70 g)9<12.5% of RI (70 g)
Saturated fats (g)6<10% of proposed energy cut-off point (600 kcal)2.8<10% of proposed energy cut-off point (250 kcal)
Carbohydrates (g)78<30% of RI (260 g)32.5<12.5% of RI (260 g)
Sugars (g)15<10% of proposed energy cut-off point (600 kcal)6.2<10% of proposed energy cut-off point (250 kcal)
Salt (g)1.8<30% of RI (6 g)0.75<12.5% of RI (6 g)
Table 2. Mean, median, variance, standard deviation, standard error, maximum, and minimum of macronutrients per portion.
Main Courses (N = 45)
MeanMedianMinimumMaximumVarianceStandard DeviationStandard Error
Energy (kcal)730.75708.12287.571269.6267,135.2259.138.63
Proteins (g)39.4138.759.20102.21296.617.222.57
Fats (g)49.3347.824.39107.19864.129.404.38
Carbohydrates (g)31.2021.003.06105.4177927.914.16
Fibers (g)4.964.180.5923.8620.94.580.68
Sugars (g)5.425.070.418.5213.93.730.56
Salt (g)2.612.240.66.792.81.680.25
Saturated Fatty acids (g)12.2510.110.732.6676.78.761.31
Monounsaturated fatty acids (g)28.2423.211.9667.4133818.392.74
Polyunsaturated fatty acids (g)5.324.310.9311.5510.53.240.48
Salads & Appetizers (N = 25)
MeanMedianMinimumMaximumVarianceStandard DeviationStandard Error
Energy (kcal)386.42365.4632.44948.8657,703.40240.2248.04
Proteins (g)7.854.640.2439.2787.29.341.87
Fats (g)29.0929.242.8563.75307.417.533.51
Carbohydrates (g)25.7415.711.7159.33100531.76.34
Fibers (g)4.854.230.6615.13123.470.69
Sugars (g)4.473.790.2919.1216.44.050.81
Salt (g)1.4510.338.882.91.70.34
Saturated Fatty acids (g)4.454.070.49.998.42.90.58
Monounsaturated fatty acids (g)19.6120.682.0145.26136.111.672.33
Polyunsaturated fatty acids (g)3.903.180.2822.1817.94.230.85
Disclaimer/Publisher’s Note: The statements, opinions and data contained in all publications are solely those of the individual author(s) and contributor(s) and not of MDPI and/or the editor(s). MDPI and/or the editor(s) disclaim responsibility for any injury to people or property resulting from any ideas, methods, instructions or products referred to in the content.