Article

Description and Classification of Tempering Materials Present in Pottery Using Digital X-Radiography

by
Alan Nagaya
1,
Oscar G. de Lucio
1,*,
Soledad Ortiz Ruiz
2,
Eunice Uc González
3,
Carlos Peraza Lope
3 and
Wilberth Cruz Alvarado
3
1
Laboratorio Nacional de Ciencias Para la Investigación y la Conservación del Patrimonio Cultural, Instituto de Física, Universidad Nacional Autónoma de Mexico, Apartado Postal 20-364, Ciudad de México 01000, Mexico
2
Instituto de Investigaciones Antropológicas, Universidad Nacional Autónoma de México, Circuito Exterior, Ciudad Universitaria, Ciudad de México 04510, Mexico
3
Centro INAH Yucatán, Km. 65 Carretera Progreso, Mérida 97000, Mexico
*
Author to whom correspondence should be addressed.
NDT 2024, 2(4), 456-473; https://doi.org/10.3390/ndt2040028
Submission received: 20 May 2024 / Revised: 18 July 2024 / Accepted: 12 October 2024 / Published: 16 October 2024

Abstract

:
Archaeological pottery X-radiography is mainly used for two applications: fabric characterization and identification of forming techniques. Both applications require imaging of tempering materials and other additives. With digital X-radiography, it is easy to enhance the image to compute and characterize these materials. In this study, a combination of ImageJ plug-ins such as “threshold”, “analyze particles”, and “fit polynomial” were used to describe tempering materials of a set composed of archaeological pottery sherds. It was found that two different types of tempering materials were used. The first type was characterized by a grain size of less than 0.5 mm and no well-formed particles. In contrast, the second group had a grain size larger than 0.5 mm and well-formed particles.

1. Introduction

The properties of pottery can be classified based on their function, firing process, and composition. These properties are determined by examining factors such as the clay matrix, voids, and tempering materials. Various techniques are typically used to analyze these properties, including mineralogical analyses, chemical analyses, and structural characterization. Depending on the characteristic being studied, different methods are used, such as petrography, X-ray diffraction (XRD), X-ray fluorescence (XRF), X-ray photoelectron spectroscopy (XPS), transmission and scanning electron microscopes (TEM and SEM) [1,2].
Some of these techniques are invasive and destructive. However, Heritage Sciences studies require more suitable techniques to provide analysis with non-destructive and non-invasive methods for the study of archaeological pottery; X-radiography is one of the most commonly used procedures. The earliest work using xeroradiography [3] focused on studying several ceramic materials to describe their internal structure and identify tempering materials.
The two main applications of archaeological pottery X-radiography are fabric characterization and identification of forming techniques [4,5,6,7,8]. Both require the imaging of tempering materials and other additives because the material provides insights into mechanical behaviors such as fracture strength and fracture energy, and therefore it could determine its use [9,10]. Describing the size, proportion, type, and general mineralogy of these materials are the main goals for X-radiography; for that reason, the introduction of digital radiography provides new and valuable information owing to digital image processing (DIP) [11].
The use of DIP has spread across different fields in science, aiming to highlight useful information contained in X-rays, considering a digital X-radiography as an  n × m  matrix. Different software can be used to manipulate and analyze digital X-radiographies, like Adobe Photoshop v26.0 with diverse filters in its libraries, such as find edges, adjust levels, smart sharpen, and unsharp-mask [5,12]; Image Pro [13]; Carestream INDUSTREX Digital Viewing Software [14]; and different algorithms; for example, fast bilateral filter (FBF) [15]; methods based on CNNs [16]; and software routines like ShIVA [17].
The software used in this study is ImageJ 1.54f [18]. It is a free-use software based on Java that provides a large number of pre-installed plugins for a large variety of measurements, with the possibility of creating your own algorithms. ImageJ has proven to be helpful in X-radiography analysis for evaluation of bone density [19] and the detection of bucco-palatal/lingual dilacerations [20]; in archaeology, a common application is the DStretch algorithm in rock art enhancement [21], and a review of imaging methodologies using ImageJ can be found in [22]. In this work, we used its tools to analyze and classify different archaeological pottery.
A first approach was made in [23], in which we classified the sherd based on the distribution of its histogram. Now, we improve the methodology based on count particles, a helpful tool used in petrography [2,24], to associate the tempering materials with the different clay classifications. For that, we resume the thresholding method described by [23] to use ImageJ’s plug-in analyze particles [25] and improve with shape correction using the plug-in fit polynomial [26].

2. Materials and Methods

2.1. Materials

The same set was analyzed in [23]. There are 201 archaeological pottery sherds from the Mayapán area, 39 from the “Salvamento Arqueológico Carretera Federal Mérida-Campeche” (near the Oxkintok archeological site), and 35 experimental mock-ups; Figure 1 shows some of these objects.
Archaeological pottery sherds from the Mayapán region range from the Middle Preclassic to Postclassic periods (700 BC–1500 CE). The pottery was analyzed using the variety type method, as outlined by Smith [27], with additional insights from Peraza et al. [28] and Cruz [29]. Analyzed pottery sherds exhibit slipped surfaces with various decorations such as incisions, spots, bichromy, polychromy, and streaks. Slip quality is dissimilar, presenting flake shedding in some cases. In the case of the Classic period, some of the pieces were unslipped with pastillages, presenting coarse and fine pastes.
During the analysis, characteristic groups from various periods were examined. These included the Postclassic period Tecoh group; the Late Classic period Chum, Chuburna, Muna Slate, Kinich groups; the Early Classic period Hunapchen and Ticumuy groups; the Late Preclassic period Saban and Sierra groups; and the Middle Preclassic period Chunhinta, Loche, and Ek Maben groups, and Juventud, which extends to the Early Classic in use.
Archaeological sherds from the “Salvamento Arqueológico Carretera Federal Mérida-Campeche” were found in various domestic contexts and span from the Middle Preclassic to the Terminal Classic periods, including the representative groups Juvetud, Dzudzuquil, Chunhinta Piral, Maxcanu, Sierra, Saban, Águila, Timucuy, Kochol, and Ticul.
The purpose of using mock-ups manufactured by the potters was to provide us with easy-to-analyze objects. They were flat, with standard dimensions, and made following traditional recipes. These mock-ups were also measured with different spectroscopy techniques and other image techniques.
The sherds were classified into six different types of clay through the histogram analysis [23], in which we adjusted a Lorentzian function and classified respect to parameters  ω  and  x c , the first one related to homogeneity and the second one related to material characteristics. The resulting data are presented in Table A1.
Paste 1 and Paste 4 are the groups with the largest number of objects. They are characterized by having an intermediate ω value, meaning they have intermediate material homogeneity. The histograms of objects from Paste 1 tend to shift towards the white and have a nonsymmetric distribution, with the appearance of shoulders on the right. On the other hand, the objects from Paste 4 tend to shift towards black and have a nonsymmetric distribution, with the appearance of shoulders on the right.
For Paste 2, Paste 3, and Paste 6, small ω values indicate high material homogeneity and symmetrical distributions. The primary distinction among these groups lies in the location of the maximum gray level. Paste 3 has the lowest radiological density, while Paste 6 has the highest. Paste 5 exhibits the lowest homogeneity, with a nonsymmetrical distribution and shoulders on both sides.

2.2. Methodology

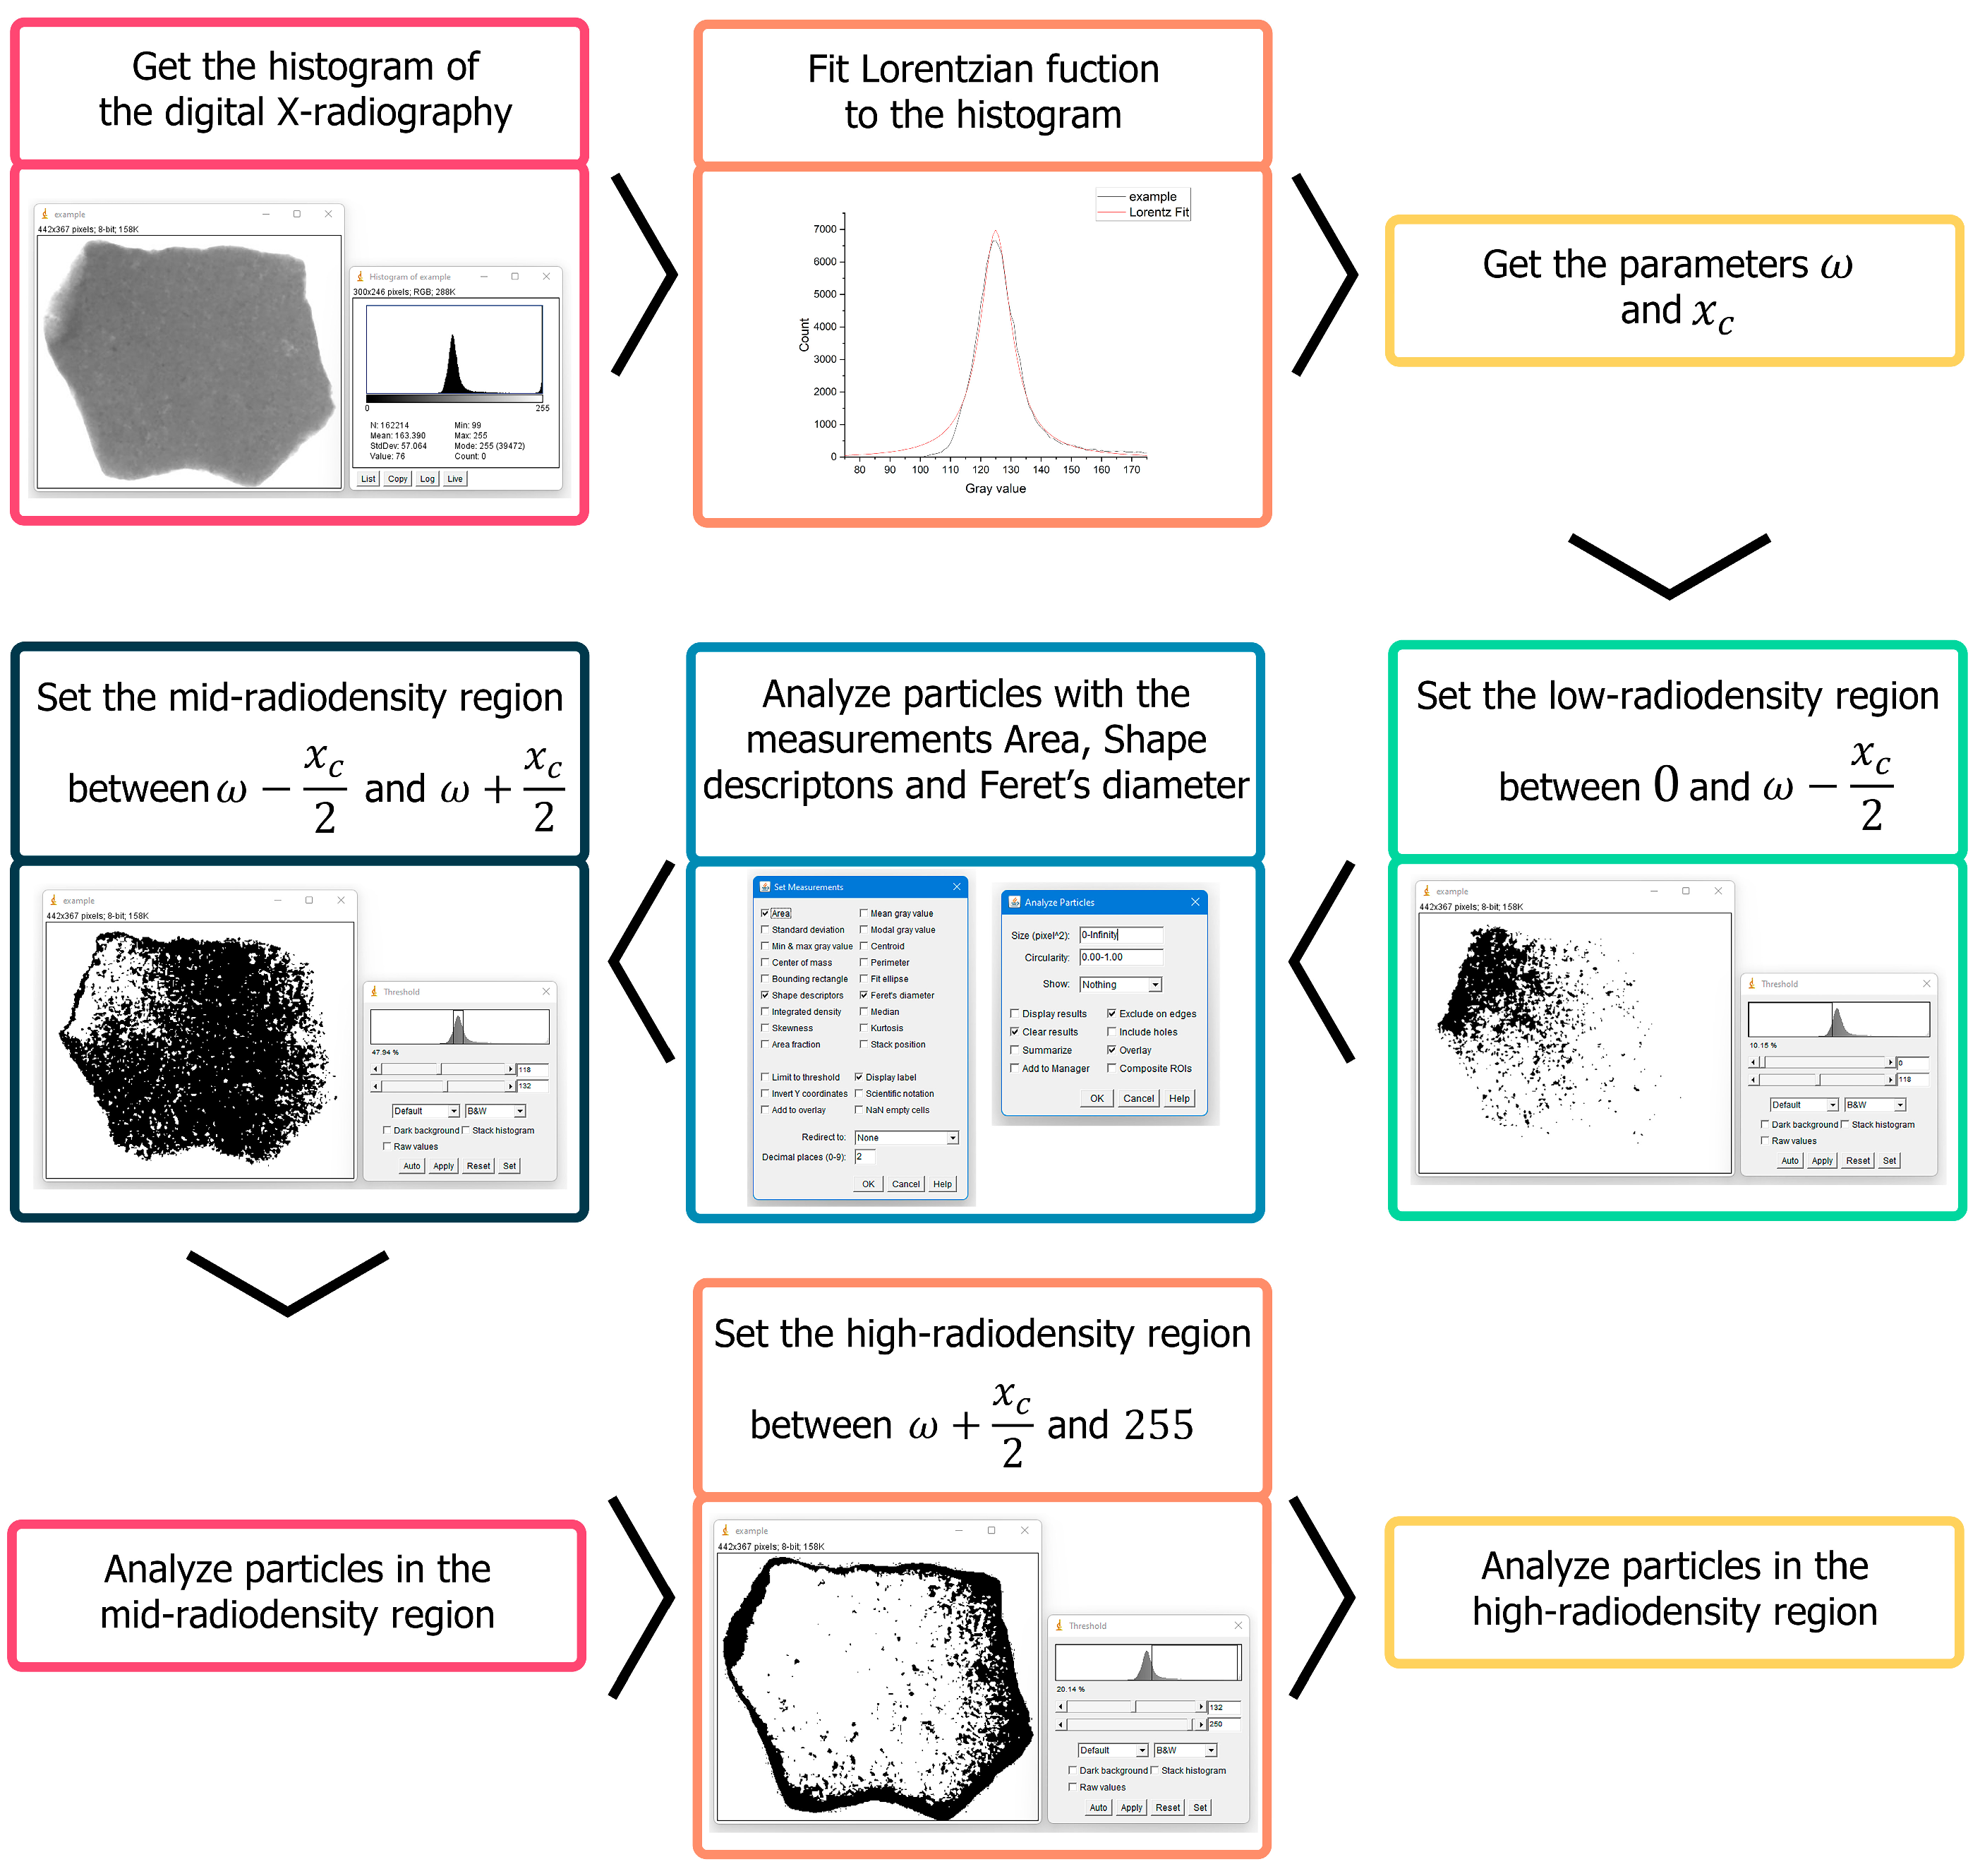
The overall procedure (see Figure 2) for determining the tempering materials present in the pottery pastes was as follows:
Radiographic images were acquired by using a digital radiography system, where the distance to the object and detector was fixed, and parameters such as voltage and filament current were adjusted to improve contrast; to optimize acquisition times, different pottery sherds were included in the same image, keeping a record of their position. An aluminum stair with known dimensions, which had previously been characterized, was employed to provide a normalization between images with different acquisition conditions.
The resulting images were then transformed to positive, where white and black correspond to 255 and 0, respectively, and analyzed by describing their histogram. Depending on the information present in the histogram, the analysis could be straightforward (for flat and homogeneous sherds) or require an additional step of image improvement, where effects due to volumetric distortions of the studied object were removed. As a result, a Lorentzian distribution is fitted to the corresponding pixel distribution shown in the histogram.
Employing the parameters resulting from the Lorentzian fit, a threshold can be defined, and segments corresponding with different radio opacities can be described in the radiographic image. Thus, the actual region where the particles present in the pottery paste, corresponding with tempering material, can be defined and analyzed.
Further details on the different methodology steps are described in the following sub-sections.

2.2.1. X-Radiography Acquisition

The X-radiographs were taken with the digital radiography equipment previously characterized in [23]. The system is based on an X-ray source POSKOM XM-40BT that produces X-rays in a voltage range between 40 and 100 kV and a current range between 0.4 and 100 mA·s, in addition to a flat panel detector Vidisco Imager FlashX Pro that has an effective area of analysis of 43.2 × 34.2 cm. Radiographies were recorded under the following experimental conditions: voltage was set at  50   k V  and filament current at  40   m A · s ; the distance from the X-ray source to the detector (DRD) was set at  1.00 ± 0.05   m . The flat panel detector provides a  144   μ m / p x  measured resolution and produces  11 b i t  negative images. After the acquisition, all resulting images were processed to convert the grayscale to positive.

2.2.2. ImageJ Application

ImageJ 1.54d was used. Figure 2 presents the flowchart describing the methodology for analyzing tempering materials. The first step is obtaining the histogram and describing its behavior. The material behavior is described with the different distributions of the histogram; each maximum in the histogram distribution is related to a ceramic paste [23].
If it only shows one maximum, the Lorentz fit is applied directly (Figure 3a); in this case, the object is flat, and the radiography behavior is homogeneous. Nevertheless, due to object shape or sgraffito, the histogram of X-radiography presents two (or more) local maximums. When the second maximum is generated by sgraffito or pottery decoration, it is not possible to enhance using the fit polynomial plug-in (Figure 3b); nevertheless, the second maximum is caused by pottery shape, such as thickening or thinning, and it is possible to enhance the digital image with the fit polynomial plug-in (Figure 3c).
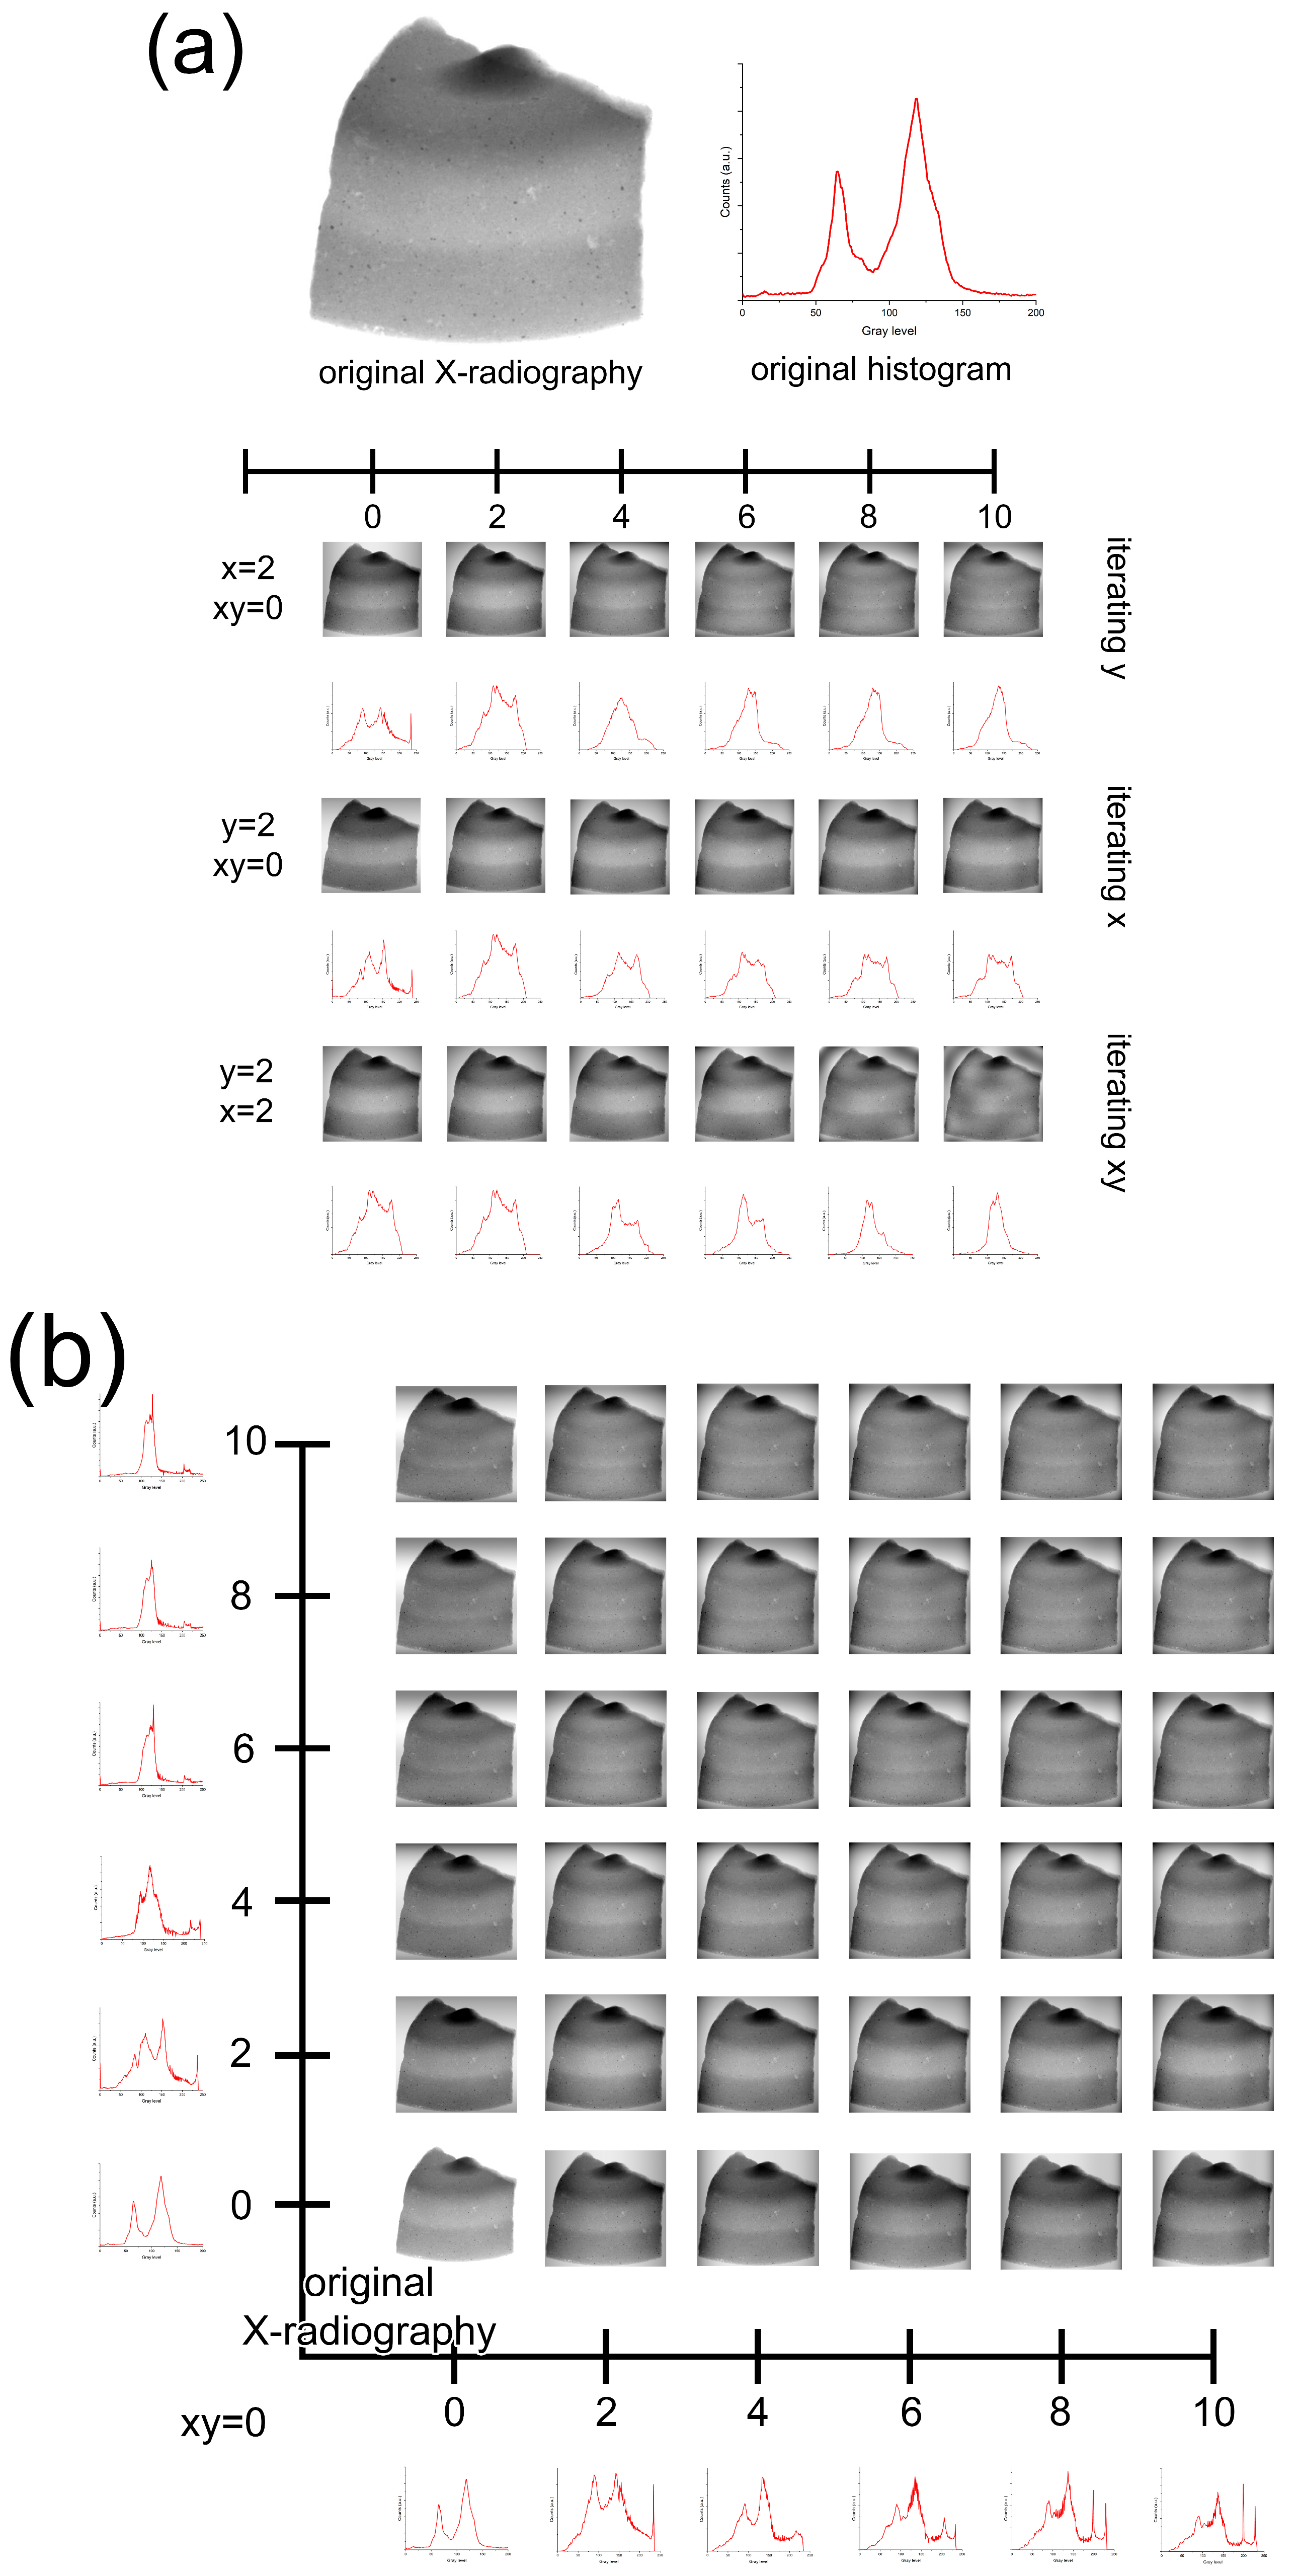
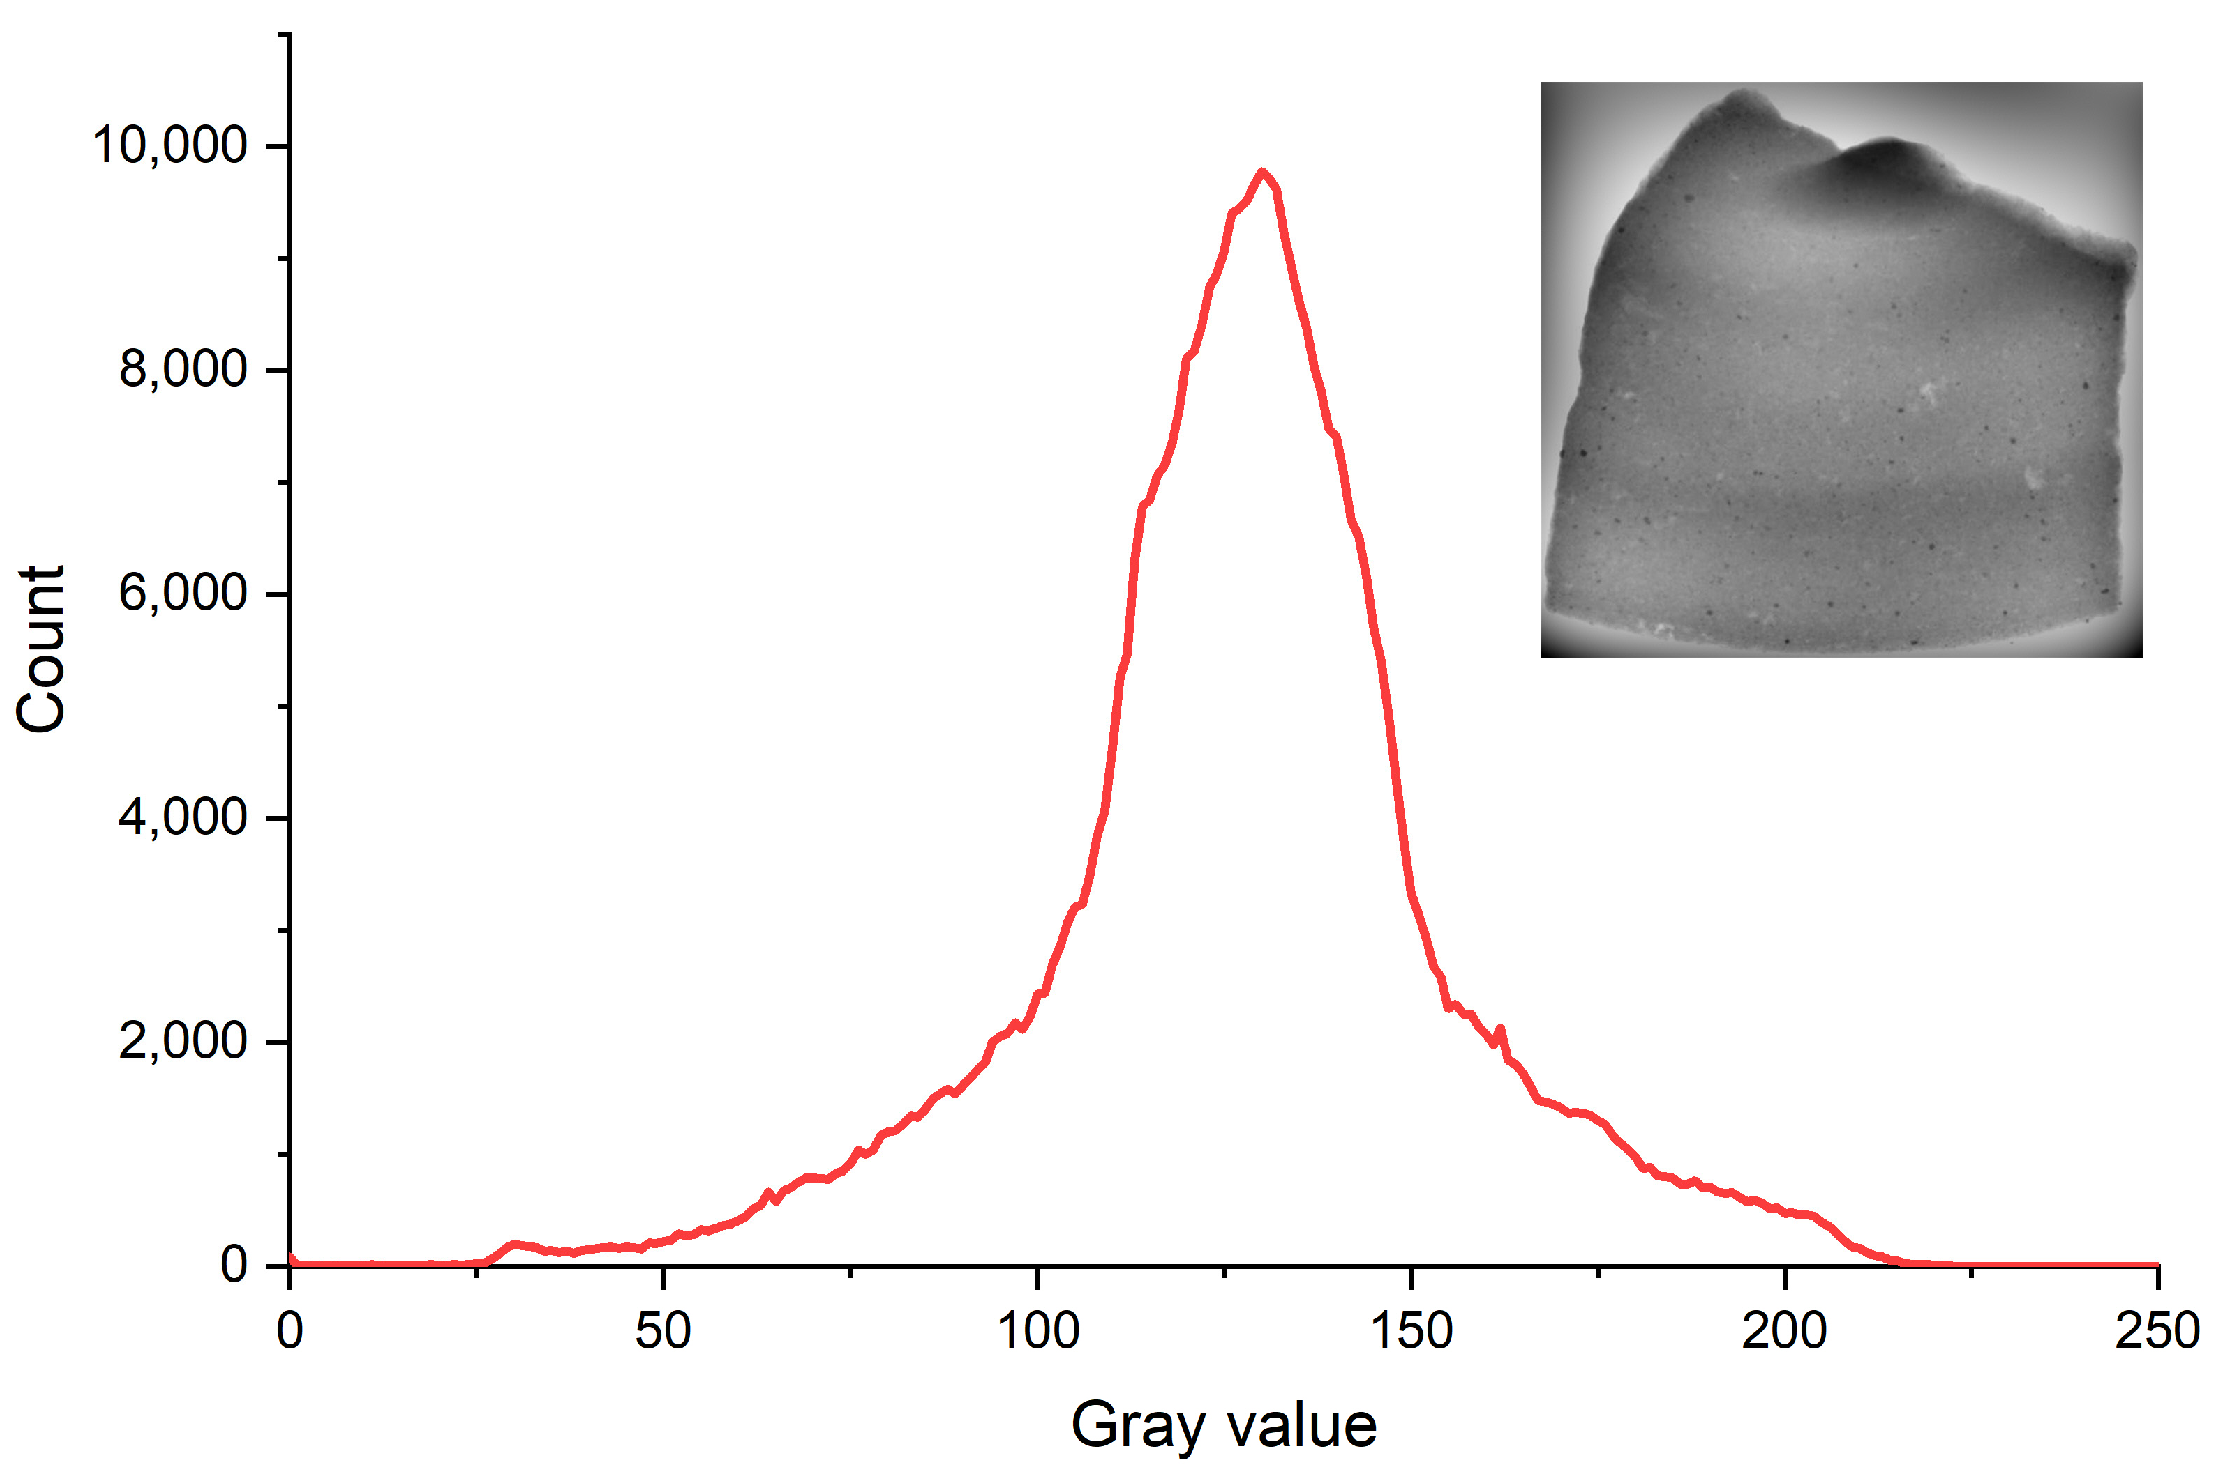
The fit polynomial plug-in was originally developed to correct the illumination of microscopy images [26]. We can apply the plug-in because, in understanding X-radiography, for the positive, the thickening is presented by the decrease of gray values, and the thinning is presented by the growth of gray values; in other words, the thickening in a digital image can be understood as shadows and thinning can be understood as lights. The plug-in has three conditions, x, y, and xy; the conditions must be iterated to choose the fit polynomial that only presents one maximum in the histogram distribution and that maximizes the  ω  parameter in the Lorentzian adjust (Figure 4). With this enhancement, the histogram distribution is homogenized, allowing us to highlight the tempering materials hidden in the sherd geometry (Figure 5).
With the Lorentzian adjust, a threshold was applied in three different regions: The low radiodensity region between  0  and  x c ω 2 ; in this region, the thresholding highlights the areas with thinness; the medium radiodensity region between  x c ω 2  and  x c + ω 2 ; this region represents most of the pixels in the radiography and it is linked to matrix clay; and the high radiodensity region between  x c + ω 2  and  255 ; in this region the thresholding highlights the regions with thickness. With this thresholding, analyze particles was used to get the parameters of Area, Feret’s diameter, and Shape descriptors.

2.2.3. Analysis of Parameters

The three parameters used to describe the tempering materials are area, to determine the proportion of tempering materials in the pottery; Feret’s diameter, to describe the grain size [30] (the tempering material’s grain size is less than  5   m m  [31,32]; due to the flat panel resolution, this distance is  35   p x  ( 5.04   m m )); and circularity, aspect ratio, and roundness, to describe the shape of the tempering material.
The distinction between the tempering materials from the clay matrix was made considering the grain size, with the thresholding highlighting all the regions with gray levels in the range defined and corresponding with the clay matrix. Consequently, grain sizes larger than  35   p x  with low roundness and circularity are considered a clay matrix, since the clay matrix does not have a defined shape, and since it represents the most significant part of pottery, the clay matrix has to be large, and the parameters of shape are irrelevant with areas less than  5   p x 2 .

2.2.4. Digital Microscopy Images

Microscopical side views were acquired with a USB-microscope Dino-Lite model AM4815ZTL-EDGE to describe surface details and possibly identify structures and tempering materials present in the paste. The images were recorded with DinoCapture 2.0 using the EDOF algorithm.

3. Results and Analysis

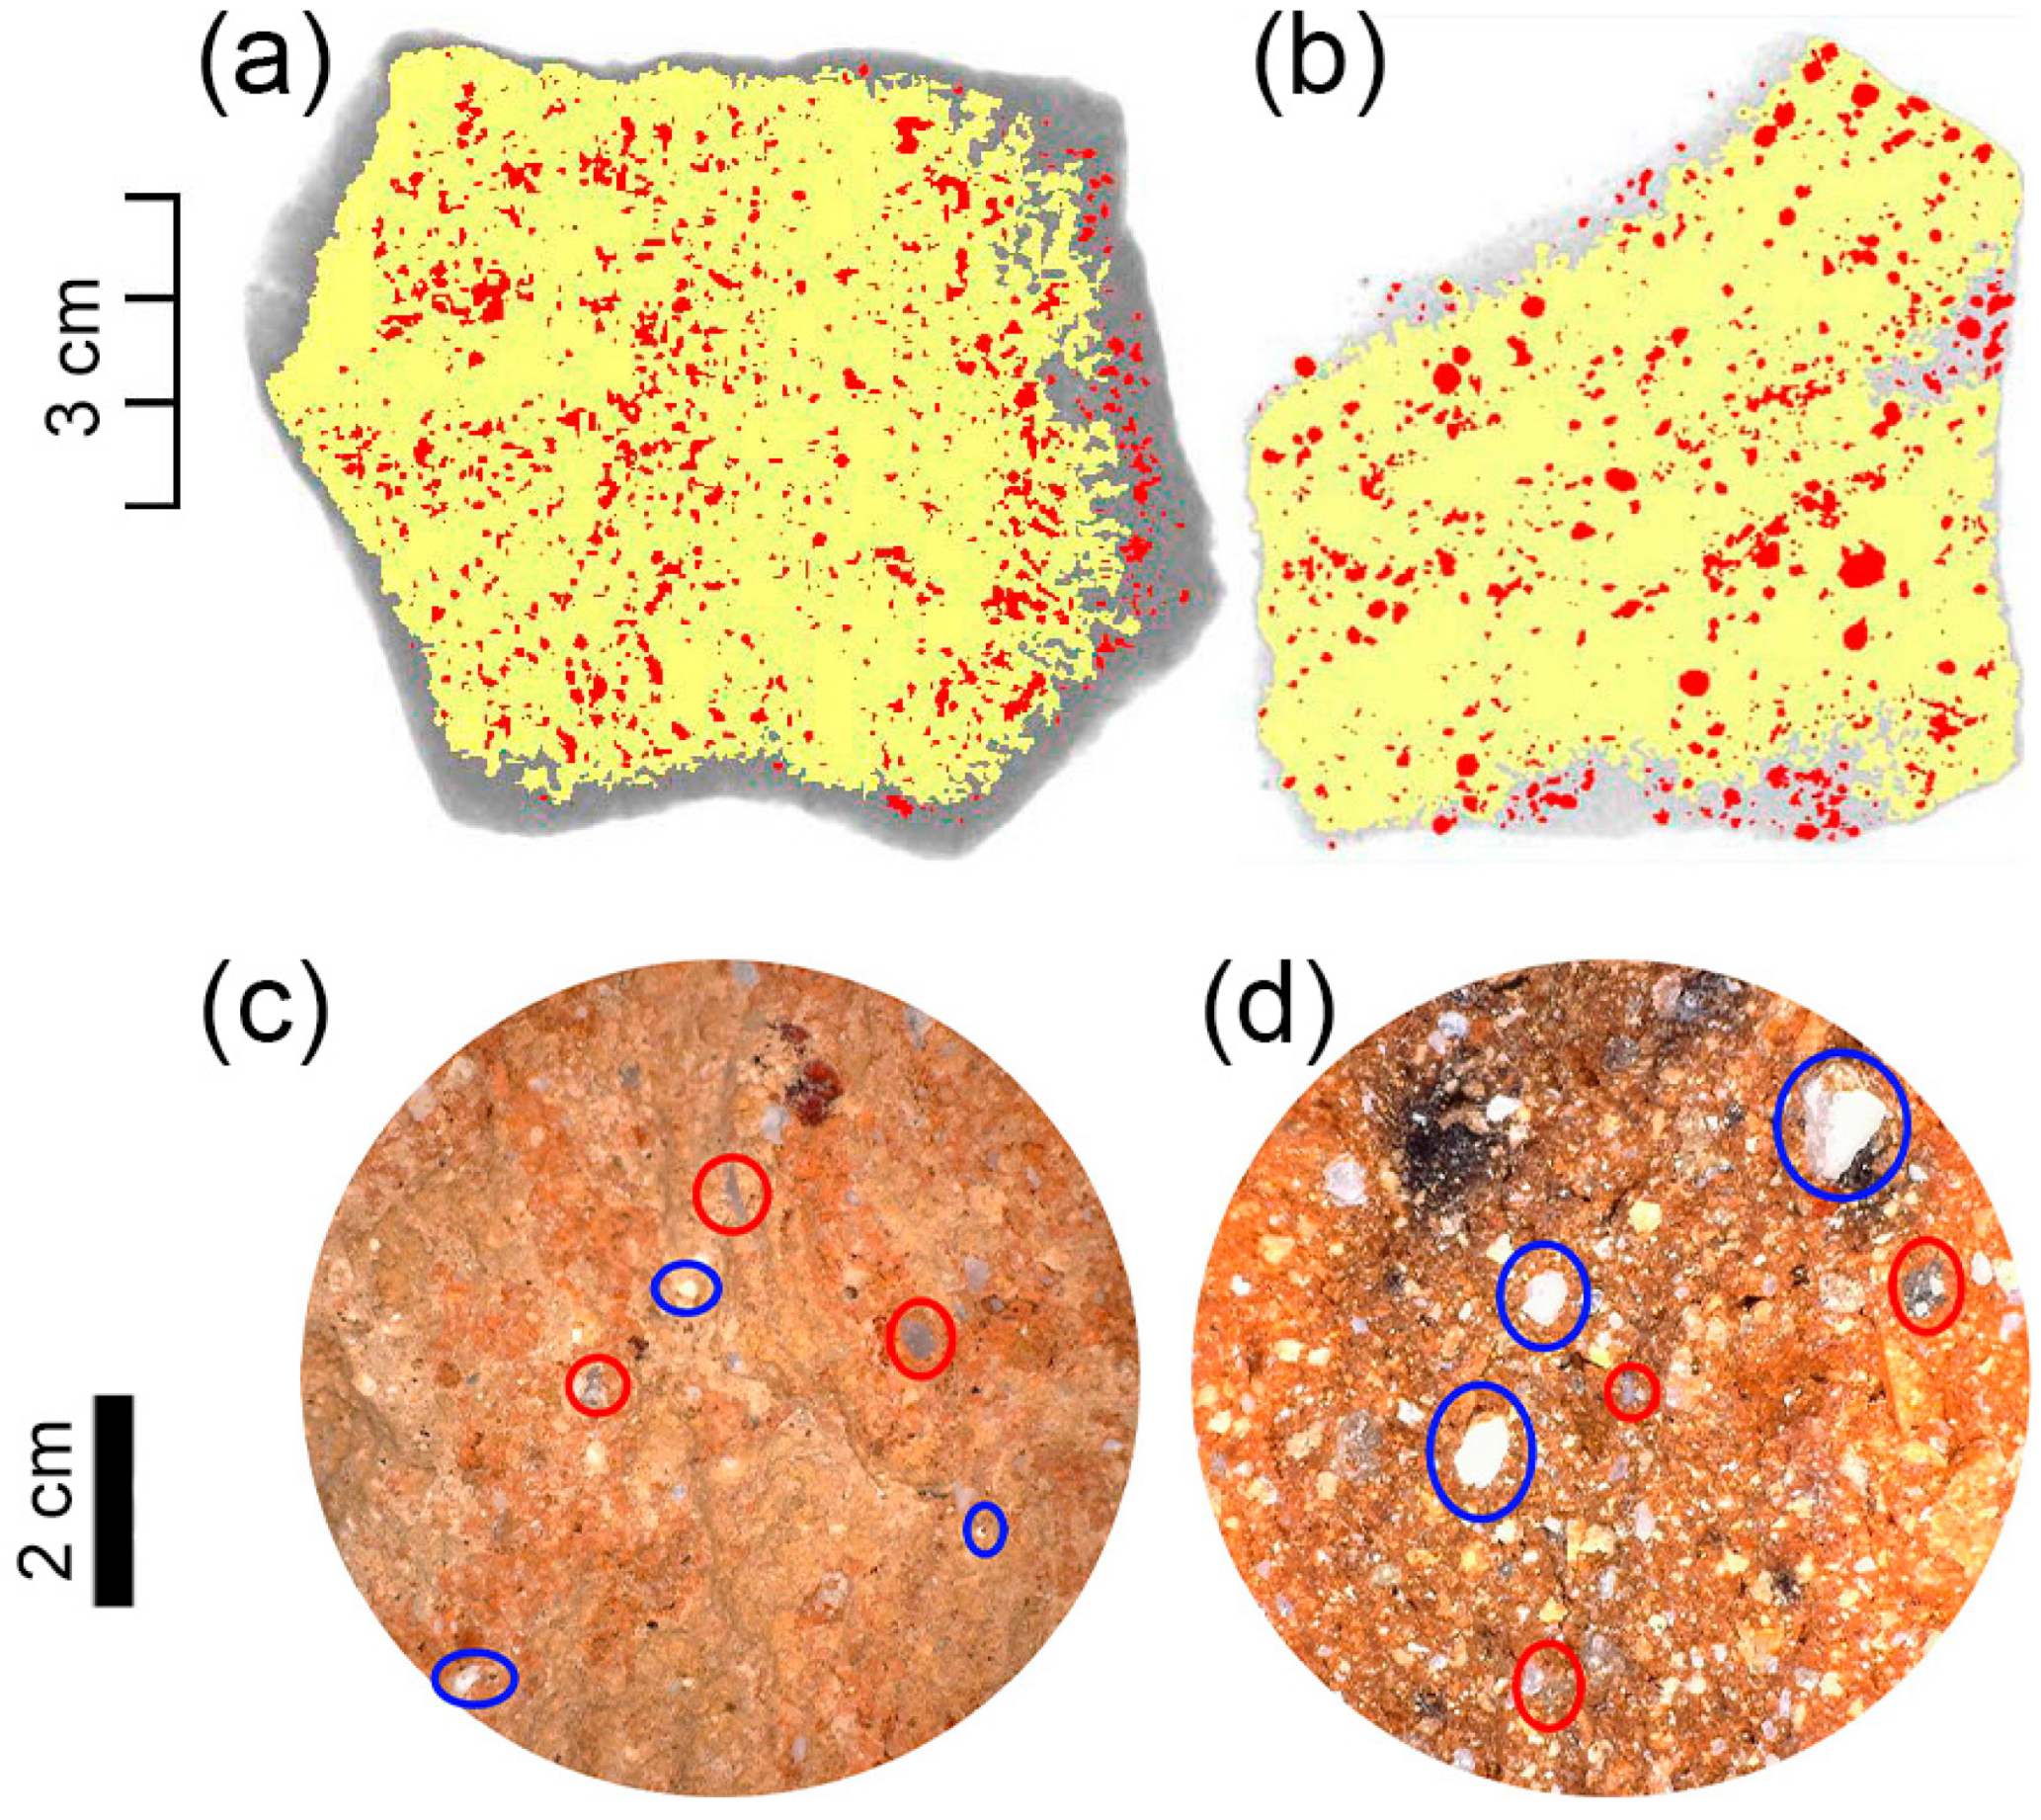
Figure 6 (top) shows two objects with different tempering materials highlighted in red. The tempering materials were discriminated from clay matrix according to grain size.
The analyze particles method allows us to identify two different tempering materials. Figure 6a shows an object in which the tempering materials are predominantly not well-formed, i.e., with a parameter of roundness low at  0.5 , and grain size between  0   a n d   0.5   m m , with high predominant silt-size inclusions. The second type of tempering materials are shown in Figure 6b, which are predominantly well-formed, with a roundness parameter high at  0.7  and grain size high at  1   n m .
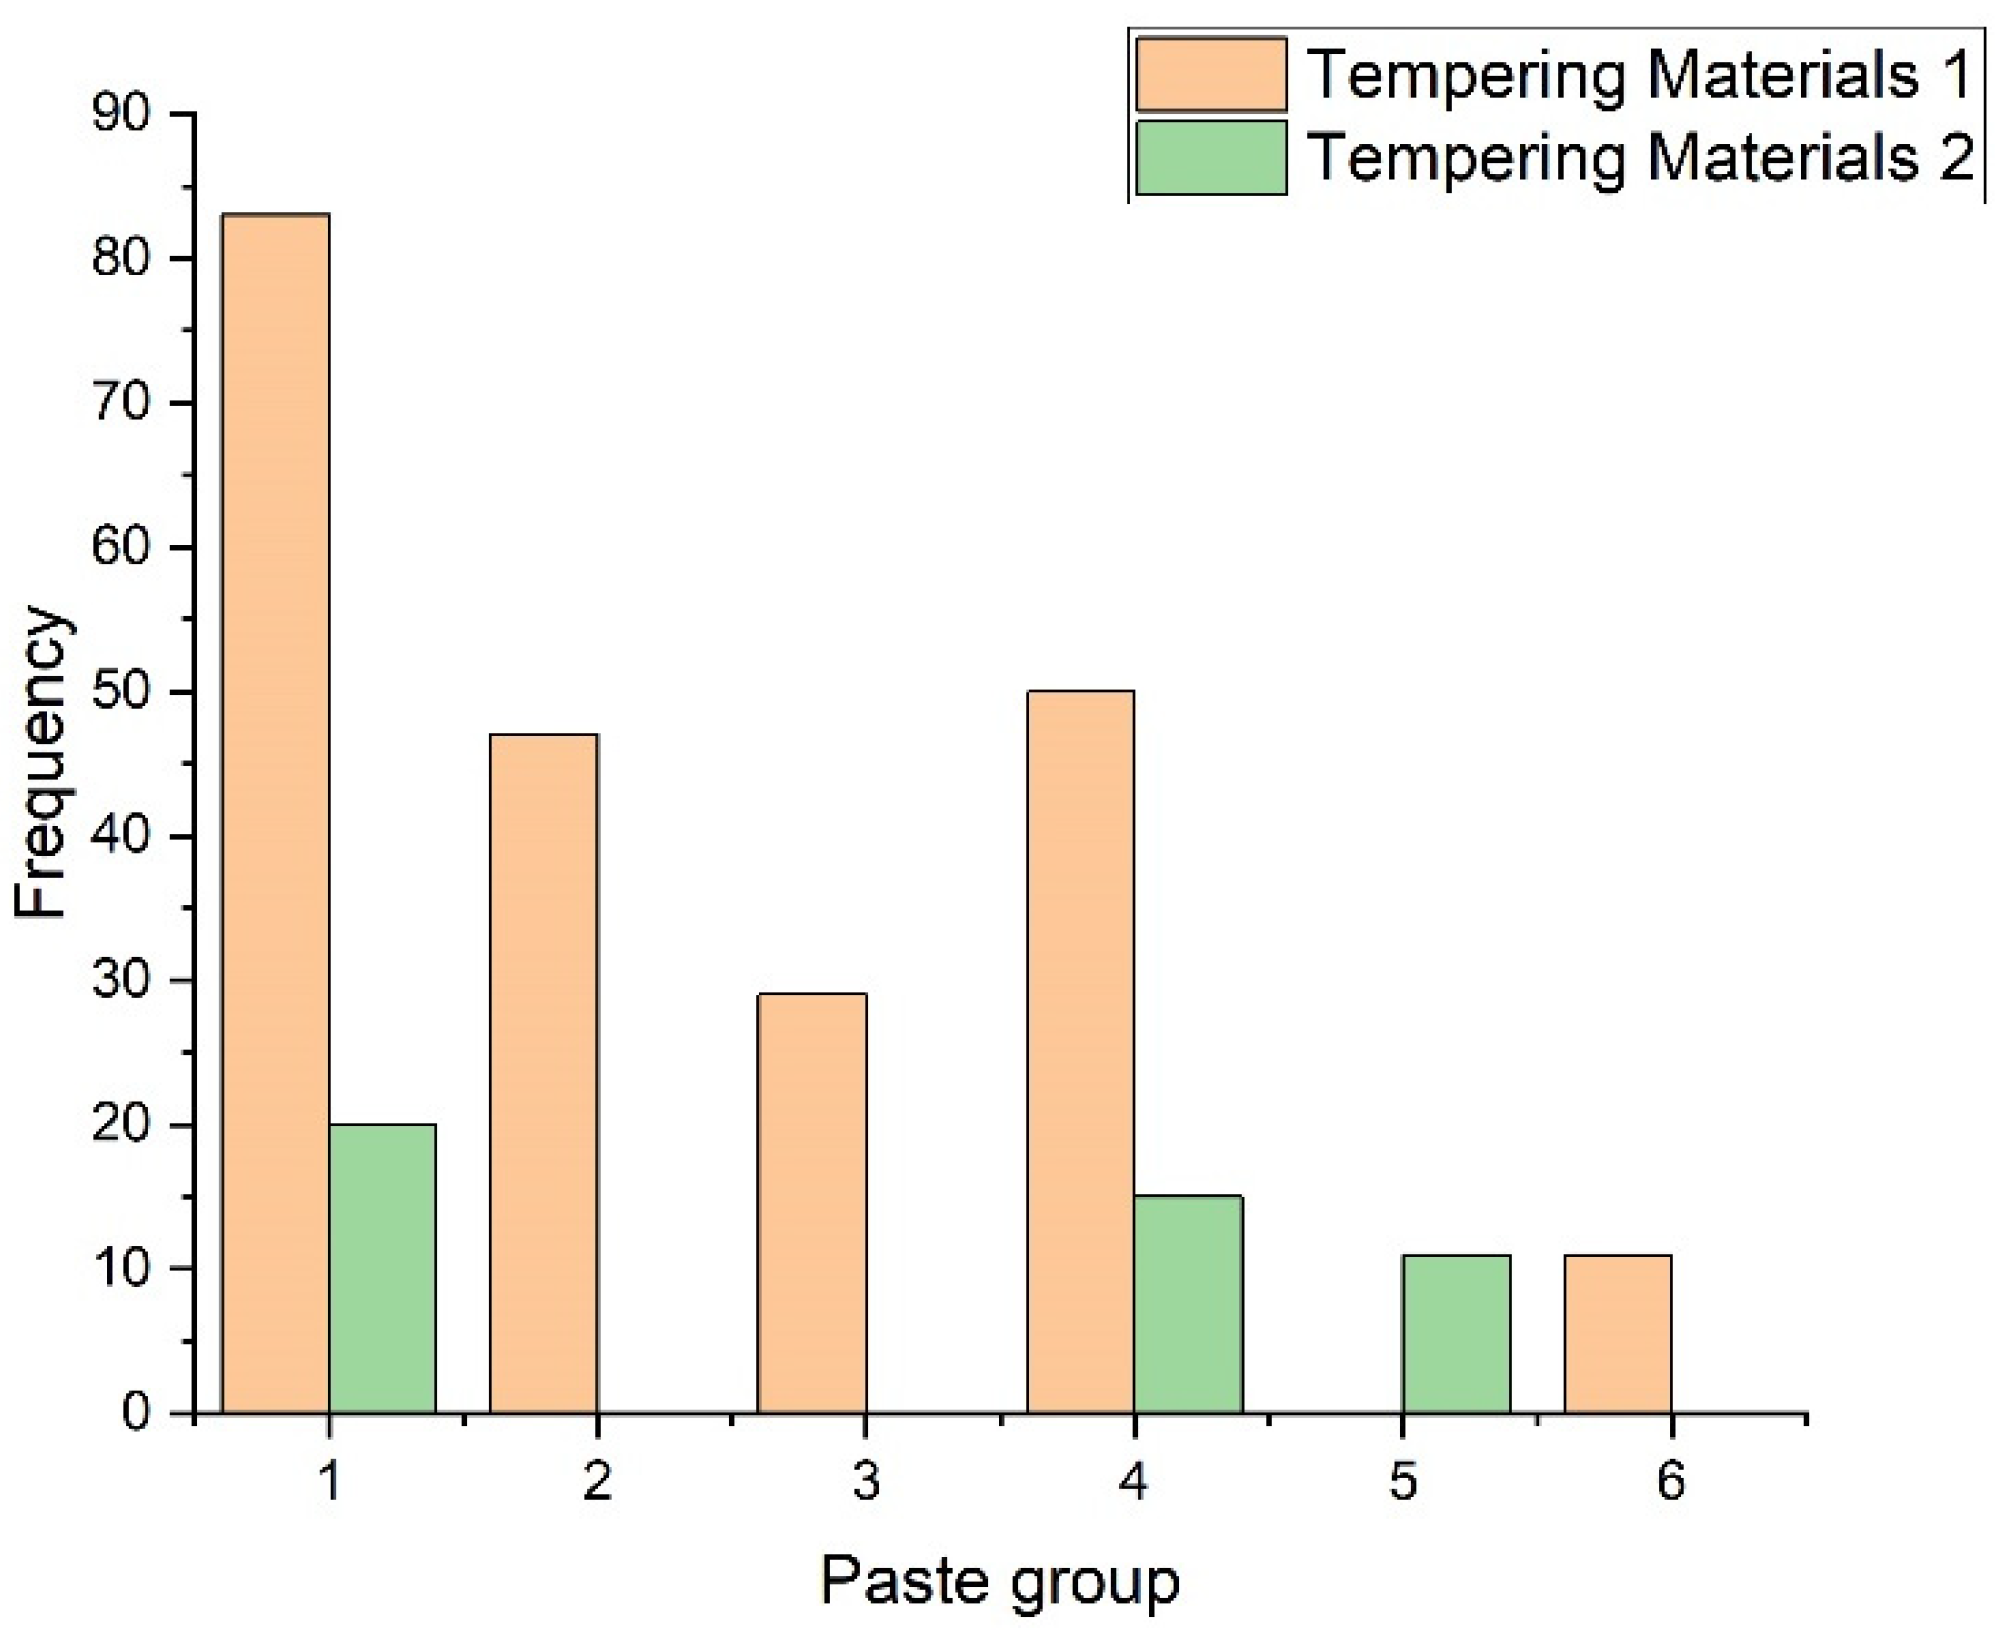
A second classification of pottery was performed, considering the different types of tempering materials. Figure 7 shows the frequency of different sherds. It was found that different types of tempering materials were used in the same clay matrix. The most common type of tempering material (labeled as 1 in Figure 7) was in 82.10% of total objects; the second type (labeled as 2 in Figure 7) appears only in selected objects with very low frequency (17.90%). Four groups only have a single kind of tempering material, and two groups share tempering materials.
Paste 2, Paste 3 and Paste 6 do not present the second type of tempering materials that agree with our previous description of this pottery. These Paste groups have symmetrical distributions and high material homogeneity. In the case of Paste 1 and Paste 4, the second type of tempering materials could explain the appearance of the shoulder on the right. In these groups, only a small percentage contains the second type of tempering materials. In the case of Paste 5, the presence of a second type of tempering material contributed to the low homogeneity. It is worth mentioning that all objects in the group contained the same kind of tempering material.
The parameters described in these objects provide information about the purpose of the pottery. The grain size affects the final characteristics of pottery; for example, in the calcite case, a small grain size produces lime spalling [33,34,35]; the roundness is inversely related to toughness [9] and volume fraction, such as the case of quartz, and a higher concentration of these tempering materials in the final product achieves higher toughness [36]. This is in addition to other characteristics that require other techniques; for instance, using quartz increases the heat conductivity, contrary to calcite, which reduces the heat conductivity [37] but requires the correct mineral characterization. Because of that, this method does not substitute traditional techniques but provides a fast, noninvasive, and nondestructive way to find interesting objects to analyze.

4. Conclusions

Our work has led to the development of a nondestructive method that provides detailed information on the material characteristics of pottery pastes, focusing on the analysis of tempering materials. This method, based on basic physics concepts such as the attenuation of X-rays in matter, systematically describes the pixel distributions in digital radiographic images using mathematical algorithms. This represents a significant improvement over previous contributions, which focused solely on the description of radiographic images. Compared with microscopical observations, the developed method provides information without sampling, making it a noninvasive and nondestructive methodology. This method allows us to analyze a great number of objects without sampling them and with minimal supervision. And the parameters resulting from our analysis, such as grain size or Feret’s diameter and shape descriptions, that have not been previously considered a result of this kind of radiographic image analyses, thus provide insights into tempering materials in a variety of pottery that can be compared with those resulting from more invasive and typical methods such as thin section petrographic analysis or microscopies, which usually require sample preparation and destruction of the studied objects.
The method proposed here complements conventional techniques for the characterization of tempering materials. The description of these allows the classification of different sherds and additionally provides information for the use of other techniques, such as the location of different particles using XRF or XRD, or else the election of representative sherds using petrography, to identify the materials. In this work, it was possible to distinguish two kinds of tempering materials; one of them appears to be of more common occurrence, corresponding with highly homogeneous pastes, with radiography histograms highly symmetrical, while the other kind appears only in few of the studied objects, where the pastes are typically inhomogeneous and produce radiography histograms with a superposition of different pixel distributions.
The information generated by this analysis allows us to provide insights into the pottery manufacturing techniques employed by the ancient Maya civilization, which, in a future work, along with an elemental and molecular characterization and a correlation with mineralogical determination techniques, could provide answers to specific archaeological questions, such as provenance, existence of material reutilization, material source locations, or innovations performed over the different archaeological horizons.
This work has a potentially significant impact due to further applications of the developed method (since, at this point, we showed only a small amount of application examples), which, along with an archeological or archaeometric interpretation, will soon produce results that are of interest to different research areas.

Author Contributions

A.N.: Writing—original draft, Methodology, Software, Formal analysis, Investigation. O.G.d.L.: Writing—review and editing, Methodology, Visualization, Investigation, Funding acquisition, Project administration. S.O.R.: Writing—review and editing, Methodology, Archaeological Investigation, Archaeological Findings Interpretation. E.U.G. and C.P.L.: Archaeological Research Manager, Writing—review, Archaeological Investigation. W.C.A.: Writing—review, Archaeological Investigation. All authors have read and agreed to the published version of the manuscript.

Funding

This research was funded by CONAHCYT, grant number CF 2019 No. 731762 and by DGAPA-PAPIIT grant number IG-100424. Experimental work was possible thanks to the support by CONAHCYT grants LN293904, LN299076, LN314846, LN315853.

Data Availability Statement

Images and resulting calculations are available upon request.

Acknowledgments

Experimental results were possible due to the support granted by Laboratorio Nacional de Ciencias para la Investigación y Conservación del Patrimonio Cultural (LANCIC-IF). We acknowledge the technical support of J. Cañetas and A. Mitrani as well as the constructive discussion and guidance of Teresa Pi Puig.

Conflicts of Interest

The authors declare no conflicts of interest.

Appendix A

Table A1. List of studied objects, associated main parameters, paste and tempering material classification results with temporality.
ObjectTemporalityPaste TypeTempering Material Type
C001Middle Preclassic11
C002 41
C003Middle Preclassic11
C004Middle Preclassic42
C005Middle Preclassic to Early Classic11
C006Middle Preclassic to Early Classic41
C007Middle Preclassic 11
C008Middle Preclassic 41
C009 41
C010Middle Preclassic 11
C011Middle Preclassic41
C012Middle Preclassic41
C013Middle Preclassic11
C014Middle Preclassic 11
C015Middle Preclassic 11
C016Middle Preclassic11
C017Middle Preclassic12
C018Middle Preclassic12
C019Early Classic12
C020Middle Preclassic42
C021Middle Preclassic41
C022Middle Preclassic11
C023Middle Preclassic11
C024Middle Preclassic31
C025Middle Preclassic21
C026Middle Preclassic11
C027Middle Preclassic11
C028Middle Preclassic11
C029 21
C030Middle Preclassic41
C031Middle Preclassic11
C032Middle Preclassic11
C033Middle Preclassic41
C034Middle Preclassic11
C035Middle Preclassic31
C036Middle Preclassic11
C037Middle Preclassic11
C038Middle Preclassic41
C039Middle Preclassic41
C040 11
C041Middle Preclassic21
C042Middle Preclassic42
C043Middle Preclassic12
C044Middle Preclassic12
C045Middle Preclassic11
C046Middle Preclassic12
C047 11
C048Middle Preclassic11
C049Middle Preclassic21
C050Middle Preclassic21
C051Middle Preclassic31
C052Middle Preclassic11
C053Middle Preclassic11
C054Middle Preclassic11
C055Middle Preclassic11
C056Middle Preclassic42
C057Middle Preclassic11
C058Middle Preclassic12
C059Middle Preclassic11
C060Middle Preclassic11
C061Middle Preclassic12
C062Middle Preclassic21
C063Middle Preclassic11
C064Middle Preclassic41
C065Middle Preclassic12
C066Middle Preclassic52
C067Middle Preclassic31
C068Middle Preclassic12
C069Late Preclassic11
C070Late Preclassic11
C071Late Preclassic61
C072Late Preclassic11
C073Late Preclassic42
C074Late Preclassic11
C075Late Preclassic11
C076Middle Preclassic11
C077Late Preclassic42
C078Late Preclassic11
C079Late Preclassic31
C080Late Preclassic11
C081Late Preclassic31
C082Late Preclassic31
C083Late Preclassic21
C084Late Preclassic21
C085Late Preclassic11
C086Late Preclassic41
C087Late Preclassic11
C088Late Preclassic41
C089Late Preclassic11
C090Late Preclassic11
C091Late Preclassic41
C092Late Preclassic11
C093Late Preclassic11
C094 31
C095Middle Preclassic11
C096Middle Preclassic11
C097Middle Preclassic11
C098Middle Preclassic11
C099Middle Preclassic11
C100Late Preclassic31
C101Early Classic61
C102Late Preclassic31
C103Late Preclassic31
C104Late Preclassic31
C105 52
C106Early Classic41
C107Early Classic11
C108Early Classic11
C109Early Classic11
C110Early Classic41
C111Late Preclassic31
C112 31
C113Early Classic12
C114 11
C115Late Preclassic31
C116 41
C117Late Preclassic11
C118Early Classic11
C119Early Classic21
C120Early Classic41
C121Late Preclassic52
C122Early Classic11
C123Early Classic11
C124Early Classic42
C125Early Classic12
C126Early Classic11
C127Early Classic41
C128Early Classic11
C129Early Classic11
C130Early Classic11
C131Early Classic12
C132Early Classic12
C133Early Classic12
C134Early Classic31
C135Early Classic21
C136Late Classic11
C137Late Classic11
C138Late Classic11
C139Late Classic12
C140Late Classic11
C141Late Classic11
C142Late Classic11
C143Early Classic11
C144Early Classic52
C145 61
C146Late Classic61
C147Late Classic41
C148Late Classic41
C149Terminal Classic11
C150Terminal Classic11
C151Terminal Classic12
C152Late Classic52
C153Late Classic11
C154Late Classic12
C155Late Classic11
C156Late Classic41
C157Late Classic41
C158Late Classic31
C159Late Classic21
C160 11
C161Late Classic11
C162Late Classic11
C163Terminal Classic12
C164Late Classic61
C165Late Classic21
C166Late Classic31
C167Terminal Classic12
C168Terminal Classic11
C169Late Classic31
C170 41
C171Late Classic41
C172Late Classic41
C173Late Classic41
C174Late Classic41
C175Late Classic11
C176Late Classic41
C177Late Classic11
C178Late Classic11
C179Postclassic21
C180Postclassic21
C181Postclassic21
C182Postclassic11
C183Postclassic11
C184Late Classic11
C185Late Classic21
C186Late Classic61
C187Late Classic21
C188 31
C189Early Classic52
C190Early Classic52
C191Early Classic61
C192Middle Preclassic31
C193Middle Preclassic31
C194 61
C195 61
C196 41
C197 41
C198 31
C199 61
C200 61
C201 52
D001Middle Preclassic42
D002Middle Preclassic42
D003Middle Preclassic41
D004Middle Preclassic42
D005Middle Preclassic42
D008Late Preclassic61
D009Late Preclassic31
D013Late Preclassic31
D014Early Classic31
D016Early Classic31
D017Early Classic41
D019Early Classic31
D020Early Classic31
D022Early Classic41
D023AEarly Classic41
D025Early Classic41
D025Early Classic41
D027Early Classic41
D028Late Classic42
D029Late Classic42
D030Late Classic41
D031Late Classic41
D031Late Classic41
D033Late Classic41
D033Late Classic/Terminal Classic42
D035Late Classic/Terminal Classic42
D036Late Classic/Terminal Classic41
D039Late Classic/Terminal Classic41
D041Late Classic/Terminal Classic41
D042Late Classic/Terminal Classic61
D043Late Classic/Terminal Classic61
D044Late Classic/Terminal Classic31
D046Late Classic/Terminal Classic31
D047Late Classic/Terminal Classic31
D048Late Classic/Terminal Classic31
D049Terminal Classic31
D050Terminal Classic41
D051Terminal Classic52
E001Mock-ups21
E002Mock-ups21
E003Mock-ups21
E004Mock-ups21
E005Mock-ups21
E006Mock-ups21
E007Mock-ups21
E008Mock-ups21
E009Mock-ups21
E010Mock-ups21
E011Mock-ups21
E012Mock-ups21
E013Mock-ups21
E014Mock-ups21
E015Mock-ups21
E016Mock-ups21
E017Mock-ups21
E018Mock-ups21
E019Mock-ups21
E020Mock-ups21
E021Mock-ups21
E022Mock-ups21
E023Mock-ups21
E024Mock-ups21
E025Mock-ups21
E026Mock-ups21
E027Mock-ups21
E028Mock-ups21
E029Mock-ups21
E030Mock-ups21
E031Mock-ups21
E032Mock-ups21
E033Mock-ups21
E034Mock-ups21
E035Mock-ups21

Appendix B

We used SEM analysis with a Hitachi TM3030 Plus and Bruker Quantax 75 for elemental analysis and mapping to identify the mineral composition without using petrography. Figure A1a shows the measurement area mentioned in Figure 6d. Figure A1b displays the map of Ca concentration, and Figure A1c displays the map of Si concentration. Both elements cluster in certain regions, with the Ca regions corresponding to white dots and the Si regions corresponding to gray regions, described as silicate particles in Section 3.
Figure A1. (a) Microscopy side view of the pottery (Figure 6) with the SEM-analysis area highlighted. (b) SEM elemental mapping of Ca. (c) SEM elemental mapping of Si.
Ndt 02 00028 g0a1
This result supports the idea that these materials are added to the clay matrix. Figure A1c clearly shows that the Si is spread throughout all pottery, caused by the clay matrix, but the concentration differs in tempering material aggregates, highlighting these ones.
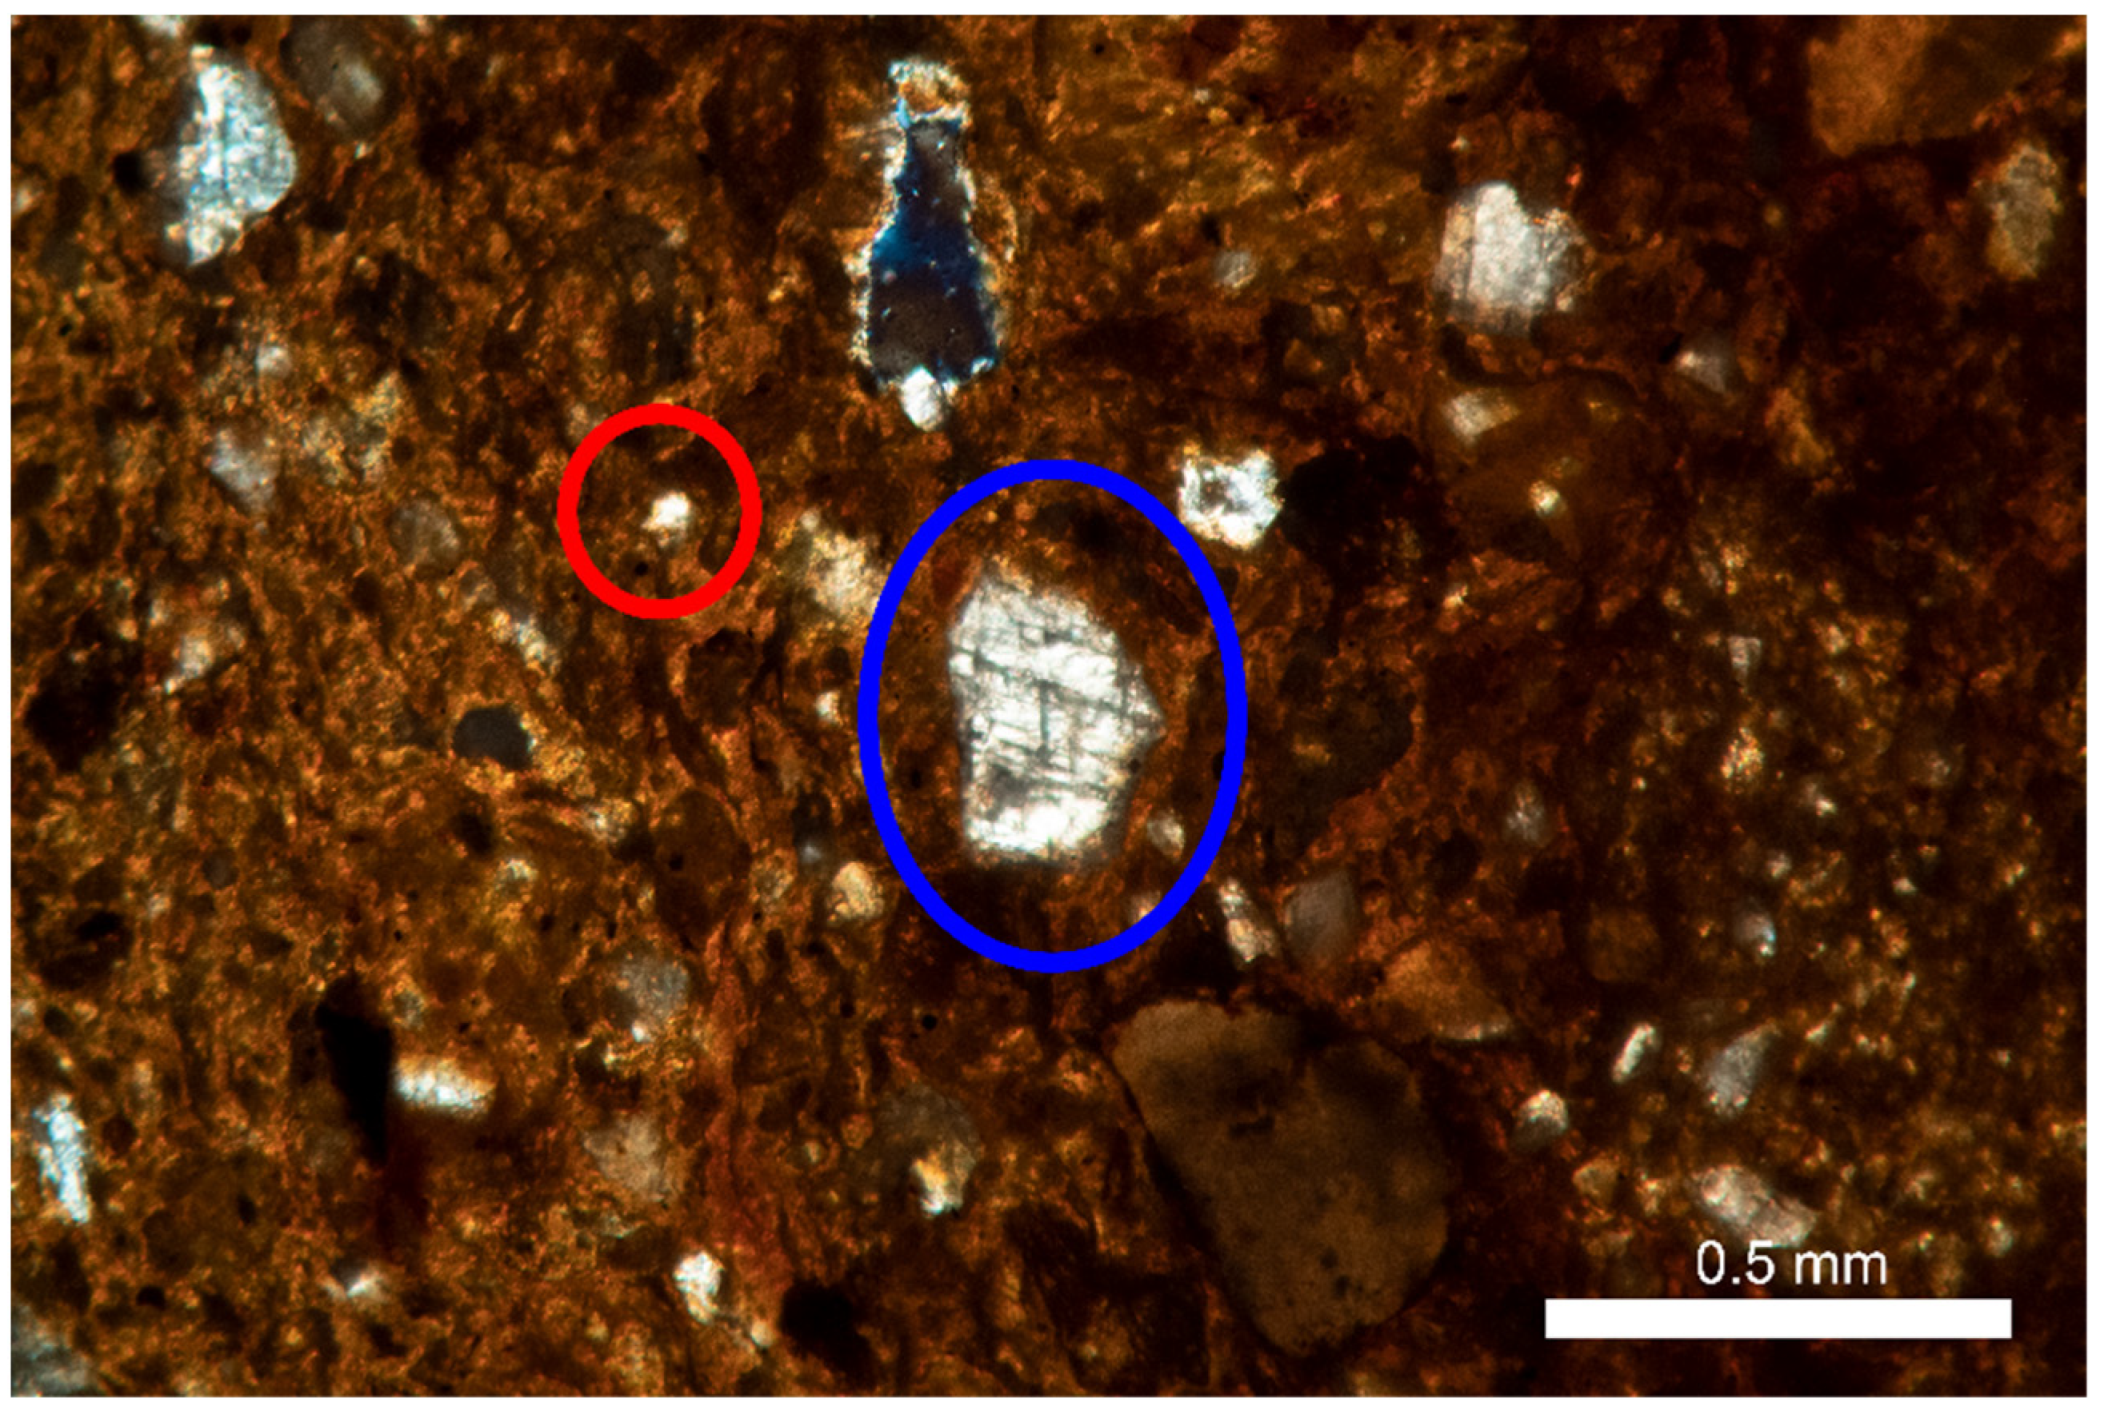
We conducted petrographic analysis on specific pieces using conventional methods. In Figure A2, the thin section of object D005 is displayed, revealing the presence of the second type of tempering material. The section exhibits well-formed calcite particles, as detailed in Section 3. However, quartz particles are not identifiable by radiographic analysis in this sample since the resolution is higher than 0.144 mm in a flat panel.
Figure A2. Thin section NX 30 mm of object D005. The blue circle indicates the calcite, with a grain size of 0.3 mm, and the red circle indicates quartz, with a grain size of less than 0.1 mm, so this is not distinguishable in the radiography image due to flat panel resolution.
Ndt 02 00028 g0a2

References

  1. Rice, P. Pottery Analysis: A Sourcebook; University of Chicago Press: Chicago, IL, USA, 2006; pp. 309–446. [Google Scholar]
  2. Quinn, P.S.; Zhang, S.; Xia, Y.; Li, X. Building the terracotta army: Ceramic craft technology and organisation of production at qin shihuang’s mausoleum complex. Antiquity 2017, 91, 966–979. [Google Scholar] [CrossRef]
  3. Titterrington, P.F. Certain bluff mounds of western jersey county, Illinois. Am. Antiq. 1935, 1, 6–46. [Google Scholar] [CrossRef]
  4. Ikeoka, R.A.; Appoloni, C.R.; Scorzelli, R.B.; Santos, E.D.; Rizzutto, M.D.A.; Bandeira, A.M. Study of ancient pottery from the brazilian amazon coast by edxrf, pixe, xrd, mössbauer spectroscopy and computed radiography. Minerals 2022, 12, 1302. [Google Scholar] [CrossRef]
  5. McCarthy, B. Examination of processing techniques in cultural heritage objects with radiography. Am. Ceram. Soc. Bull. 2020, 99, 24–29. [Google Scholar]
  6. Norris, D.; Watson, O. Illuminating the imperceptible, researching mina’i ceramics with digital imaging techniques. J. Imaging 2021, 7, 233. [Google Scholar] [CrossRef]
  7. Okońska-Bulas, M.; Mikołajska, A. Wheel-made pottery of the przeworsk culture in the light of digital radiography examinations. Preliminary study of vessels from the microregion to the east of the lower raba river. Acta Archaeol. Carpathica 2022, 57, 115–142. [Google Scholar] [CrossRef]
  8. Thér, R. Ceramic technology. How to reconstruct and describe pottery-forming practices. Archaeol. Anthropol. Sci. 2020, 12, 172. [Google Scholar] [CrossRef]
  9. Müller, N.S.; Vekinis, G.; Day, P.M.; Kilikoglou, V. The influence of microstructure and texture on the mechanical properties of rock tempered archaeological ceramics. J. Eur. Ceram. Soc. 2015, 35, 831–843. [Google Scholar] [CrossRef]
  10. Sterba, J.H.; Mommsen, H.; Staeinhauser, G.; Bichler, M. The influence of different tempers on the composition of pottery. J. Archaeol. Sci. 2009, 36, 1582–1589. [Google Scholar] [CrossRef]
  11. Berg, I. Looking through pots: Recent advances in ceramics x-radiography. J. Archeol. Sci. 2008, 35, 1177–1188. [Google Scholar] [CrossRef]
  12. Soares Batista, S.; Panzarella, F.K.; Tavano, O.; Filho, A.M.; Junqueira, J.L.C. Image adjustments on digital panoramic radiographs using adobe photoshop CS3 software. RSBO Rev. Sul-Bras. Odontol. 2013, 10, 394–401. [Google Scholar] [CrossRef]
  13. Lu, W.; Zhang, N.; Ren, N.; Ding, Z.; Yang, F.; Hu, Q.; Li, J. Bubble-induced formation of new intermetallic compounds in an al–mn alloy during heating observed by synchrotron radiography. Materialia 2021, 15, 1000991. [Google Scholar] [CrossRef]
  14. Martins, A.; Davis, E.; Kwartler, T. Max ernst’s woman, old man, and flower (1923–1924): Four paintings in one revealed by technical imaging. Heritage 2021, 4, 2224–2236. [Google Scholar] [CrossRef]
  15. Yahaghi, E.; Garcia, J.A.M.; Movafeghi, A. Fracture and internal structure detection of ceramic objects using improved digital radiography images. J. Cult. Herit. 2020, 44, 152–162. [Google Scholar] [CrossRef]
  16. Gozes, O.; Greenspan, H. Bone structures extraction and enhancement in chest radiographs via cnn trained on synthetic data. In Proceedings of the 2020 IEEE 17th International Symposium on Biomedical Imaging (ISBI), Iowa City, IA, USA, 3–7 April 2020; pp. 858–861. [Google Scholar] [CrossRef]
  17. Greene, A.F.; Hartley, C.W.; Dupuy, P.N.D.; Chinander, M. The digital radiography of archaeological pottery: Program and protocols for the analysis of production. J. Archaeol. Sci. 2017, 78, 120–133. [Google Scholar] [CrossRef]
  18. Schneider, C.; Rasband, W.; Eliceiri, K. Nih image to imagej: 25 years of image analysis. Nat. Methods 2012, 9, 671–675. [Google Scholar] [CrossRef]
  19. Geiger, M.; Blem, G.; Ludwig, A. Evaluation of imagej for relative bone density measurement and clinical application. J Oral J. Oral Health Craniofacial Sci. 2016, 1, 12–21. [Google Scholar] [CrossRef]
  20. Satir, S.; Buyukcavus, M.H.; Orhan, K. A novel approach to radiographic detection of bucco-palatal/lingual dilacerations: A preliminary study with imageJ. Proc. Inst. Mech. Eng. Part H J. Eng. Med. 2021, 235, 1310–1314. [Google Scholar] [CrossRef]
  21. Harman, J. Using decorrelation stretch to enhance rock art images. Am. Rock Art Res. Assoc. Annu. Meet. 2005, 28, 1–4. [Google Scholar]
  22. Saunders, D.; Collmann, R.; Borda, A. Reflectance transformation imaging and imagej: Comparing imaging methodologies for cultural heritage artefacts. In Electronic Visualisation and the Arts (EVA 2017); BCS Learning & Development: Swindon, UK, 2017. [Google Scholar]
  23. Nagaya, A.; Tlacuilo, R.; de Lucio, O.; Ortiz, S. Desarrollo de un método de clasificación de pastas cerámicas basado en el análisis de imágenes de radiografía digital. Boletín La Soc. Geológica Mex. 2024, 76, A101223. [Google Scholar] [CrossRef]
  24. Reedy, C.L.; Anderson, J.; Reedy, T.J. Quantitative porosity studies of archaeological ceramics by petrographic image analysis. MRS Online Proc. Libr. 2014, 1656, 9–14. [Google Scholar] [CrossRef]
  25. Sbalzarini, I.F.; Koumoutsakos, P. Feature point tracking and trajectory analysis for video imaging in cell biology. J. Struct. Biol. 2005, 151, 182–195. [Google Scholar] [CrossRef] [PubMed]
  26. Kuru, K. Optimization and enhancement of H&E stained microscopical images by applying bilinear interpolation method on lab color mode. Theor. Biol. Med Model. 2014, 11, 9. [Google Scholar] [CrossRef]
  27. Smith, R.E. The Pottery of Mayapan Including Studies of Ceramic Material from Uxmal, Kabah, and Chichen Itza; Peabody Museum of Archaeology and Ethnology, Harvard University: Cambridge, MA, USA, 1971. [Google Scholar]
  28. Peraza Lope, C.; Masson, M.A.; Cruz Alvarado, W.; Russell, B.W. Effigy Censer and Figurine Production at the Postclassic Maya City of Mayapan, Mexico. Anc. Mesoam. 2023, 34, 455–475. [Google Scholar] [CrossRef]
  29. Cruz Alvarado Wilberth, A. Distribución y Cronología de sitios Arqueológicos del Centro-sur de Yucatán. Bachelor’s Thesis, Universidad Autónoma de Yucatán, Mérida, México, 2010. [Google Scholar]
  30. Tomaszewski, P.E. The uncertainty in the grain size calculation from X-ray diffraction data. Phase Transit. 2013, 86, 260–266. [Google Scholar] [CrossRef]
  31. Virto, I.; Moni, C.; Swanston, C.; Chenu, C. Turnover of intra- and extra-aggregate organic matter at the silt-size scale. Geoderma 2010, 156, 1–10. [Google Scholar] [CrossRef]
  32. Sheppard, P.; Walter, R.; Dickinson, W.; Felgate, M.; Ross-Sheppard, C.; Azemard, C. A solomon sea interaction sphere. In The Lapita Cultural Complex in Time and Space: Expansion Routes, Chronologies and Typologies; Archeologia Pasifika, Institut d’archaeologie de la Novelle-Caledonie et du Pacific: Noumea, New Caledonia, 2015; pp. 63–80. [Google Scholar]
  33. Eramo, G. Ceramic technology: How to recognize clay processing. Archaeol. Anthropol. Sci. 2020, 12, 164. [Google Scholar] [CrossRef]
  34. Maritan, L.; Ganzarolli, G.; Antonelli, F.; Rigo, M.; Kapatza, A.; Bajnok, K.; Coletti, C.; Mazzoli, C.; Lazzarini, L.; Vedovetto, P.; et al. What kind of calcite? Disclosing the origin of sparry calcite temper in ancient ceramics. J. Archaeol. Sci. 2021, 105358, 129. [Google Scholar] [CrossRef]
  35. Allegreta, I.; Pinto, D.; Giacomo, E. Effects of grain on the reactivity of limestone temper in a kaolinitic clay. Appl. Clay Sci. 2016, 126, 223–234. [Google Scholar] [CrossRef]
  36. Kilikoglou, V.; Vekinis, G.; Maniatis, Y.; Day, P.M. Mechanical performance of quartz-tempered ceramics: Part I, strength and toughness. Archaeometry 1998, 40, 261–279. [Google Scholar] [CrossRef]
  37. Allegretta, I.; Eramo, G.; Pinto, D.; Hein, A. The effect of temper on the thermal conductivity of traditional ceramics: Nature, percentage and granulometry. Thermochim. Acta 2014, 581, 100–109. [Google Scholar] [CrossRef]
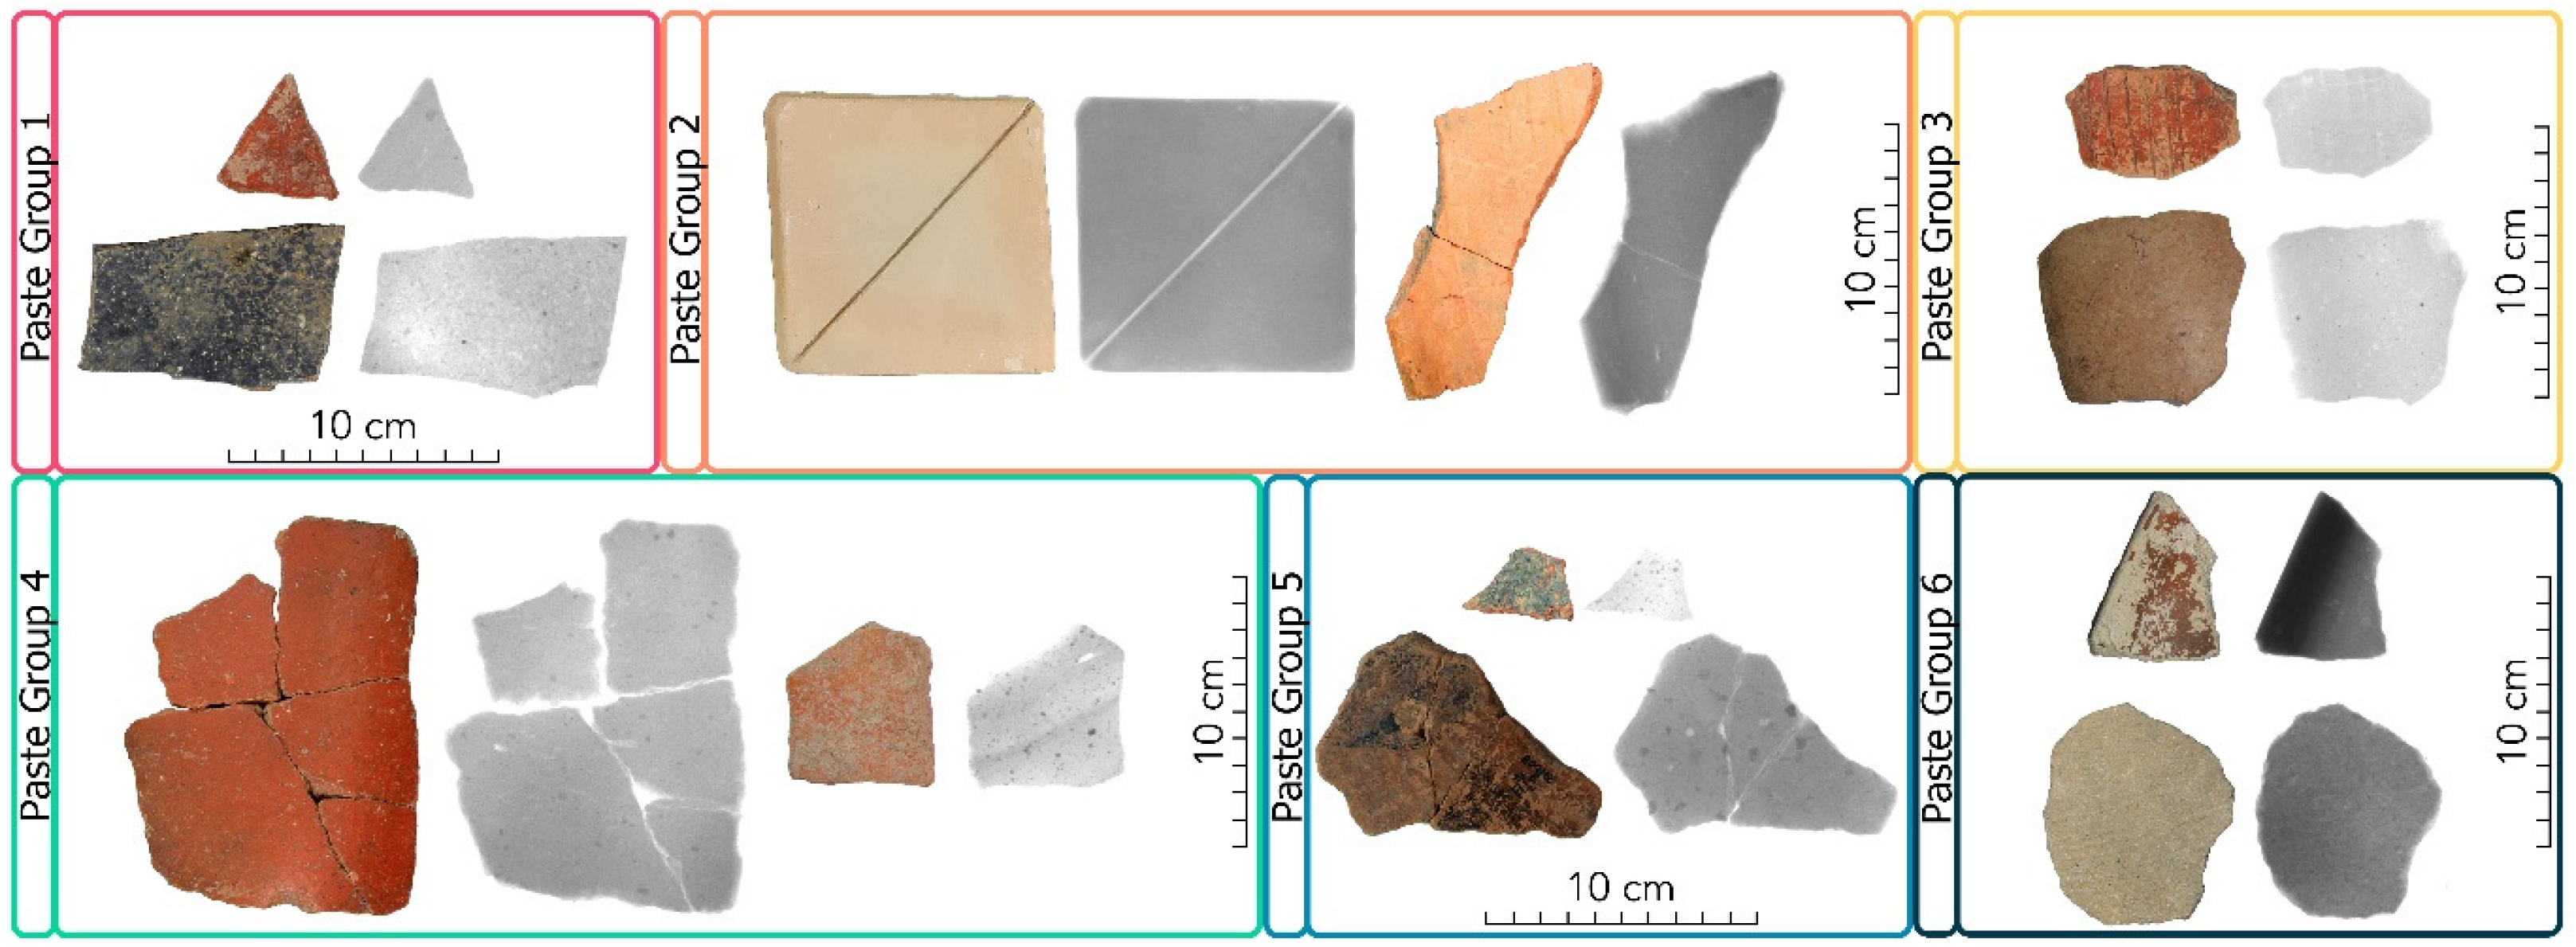
Figure 1. Representative objects of the six different types of clays, according to [23].
Ndt 02 00028 g001
Figure 2. Flowchart of the methodology for analyzing tempering materials.
Ndt 02 00028 g002
Figure 3. Representative histograms of three sherds. (a) Single maximum histogram, in which we apply directly the Lorentzian adjust. (b) Histogram with two maxima, in which, due to the sherd decoration, it is not possible for the plot profile enhancement. (c) Histogram with two maxima, in which it is possible the plot profile enhances due to the second maximum being caused by the sherd shape.
Ndt 02 00028 g003
Figure 4. (a) Iteration of the parameters x, y, and xy, with the other two fixed. (b) Iteration of x and y parameter with xy fixed.
Ndt 02 00028 g004
Figure 5. Histogram of sherd presented in Figure 3c after fit polynomial enhancement with parameters x = 6 y = 5 xy = 5.
Ndt 02 00028 g005
Figure 6. (Top) Highlight of clay matrix (yellow) and tempering materials (red). (a) This object has 6.42% of tempering materials with respect to the total pottery, and they are not well-formed. (b) This object has 5.5% tempering materials with respect to the total pottery and predominantly has well-formed inclusions. (Bottom) Microscopy side view of the pottery, with red circles marking the calcite and blue circles indicating the possibly silicate particles. (c) No well-formed tempering materials object. (d) Well-formed tempering materials object. See Appendix B for complementary information.
Ndt 02 00028 g006
Figure 7. Frequency of paste groups and tempering materials.
Ndt 02 00028 g007
Disclaimer/Publisher’s Note: The statements, opinions and data contained in all publications are solely those of the individual author(s) and contributor(s) and not of MDPI and/or the editor(s). MDPI and/or the editor(s) disclaim responsibility for any injury to people or property resulting from any ideas, methods, instructions or products referred to in the content.