Abstract
This research investigates the characterization of bituminous mixes utilizing microwave imaging and non-destructive testing. We studied the electromagnetic characteristics of various samples, including bituminous concrete (BC) and open-grade friction course (OGFC) samples. A novel ring filter with log-periodic feedlines, designed on the RT/Duroid 5880 substrate, was utilized within the frequency range of 0.3–0.7 GHz. The samples were assessed using average attenuation and group delay measures, which detailed clear electromagnetic characteristics. The samples’ flow value and specific gravity were correlated to these parameters. The calculated flow value and specific gravity (using the filter) and measured flow value and specific gravity (using the conventional method) coincided well. The filter could predict the parameters of the samples with a high accuracy of roughly 99.8% for the flow value and specific gravity, whereas the OGFC sample displayed an accuracy of 99.7%, correspondingly, as shown in high R2 values. This demonstrates that the filter can precisely measure the parameters required for studying the interaction between the binder and aggregate in bituminous mixes without being invasive. The findings indicate a significant disparity between OGFC and BC samples in their responses to electromagnetic fields and their characteristics. This demonstrates the high sensitivity and significant value of microwave techniques in the study of bitumen and the construction of roadways.
1. Introduction
Flexible pavement is the predominant choice for road construction globally, making up about 95% of the road network [1]. The bituminous mixture is bound by the surface course, which possesses both durability and wear resistance. This layer contains a bituminous mix, which is a combination of aggregates, bitumen, filler, and additives. Flexible pavement quality and the bituminous mixture are usually tested to determine different parameters. The flow value and specific gravity are some of the most common parameters defined by Marshall’s mix design method [2]. This method evaluates the optimum binder content and optimizes the asphalt mix design. It enhances the quality of the bituminous mixture and increases the amount of binder present.
The term “flow value” refers to the vertical deformation of a sample before it fails [3]. The Ministry of Road Transport and Highways (MoRT&H) of India has proposed a Marshall flow range of 2 to 4 mm for viscosity-grade (VG) paving bitumen, which is generally consistent with international standards, for which the typical range varies between 2 and 5 mm, depending on regional specifications [4]. A flow value of less than 2 mm indicates a poor mix characterized by rigidity and inflexibility. Roads with low flow values are more prone to cracking or breaking after experiencing heavy traffic. An overly high flow value indicates that the mixture is challenging to handle, leading to the sliding of aggregates and perhaps affecting the performance of pavement rutting [4].
Specific gravity determines the volume occupied in various mixes and computes the aggregate voids. In hot-mix asphalt (HMA), the specific gravity of both coarse and fine aggregates is crucial for determining the content of the asphalt binder absorbed into the aggregate and calculating the percentage of voids in the aggregate [5,6] in order to assess the flow value and specific gravity of the constructed flexible pavement, which hampers the overall structural integrity of the pavement.
In the field, destructive techniques such as the core-cutting method are conventionally used, and specific obstacles prevent the accurate determination of the flow value of flexible pavement. Consequently, various microwave imaging techniques and studies on road conditions using microwaves have been developed since the outset. In microwave imaging, a planar cavity creates an opening that mimics dielectric materials with metallic flaws [7,8]. Real-time microwave techniques are commonly used to aid in investigations involving water–bitumen systems, modified back-propagation, and improved bituminous binders with nano-dispersed additives [9,10]. The ground-gap-coupled configuration interrogates the microwave-coupled split ring resonator sensor, as mentioned by [11]. A study aimed to investigate microwave imaging techniques for identifying cracks in concrete tunnels [12,13]. According to [14], using a wideband imaging radar system that operates across many frequency ranges is essential to conducting radar measurements.
The assessment of binder aggregate behavior in bituminous mixes has been a critical area of research in road infrastructure development. However, traditional destructive testing methods have limitations in terms of accuracy, efficiency, and resource consumption. To address these gaps, our study explores the application of non-destructive testing methods for evaluating crucial properties such as the flow values and specific gravity of bituminous mixes. This research leverages microwave imaging, combined with a two-port ring filter system enhanced using log-periodic feedlines. By focusing on the precise measurement of group delay and attenuation within cylindrical bituminous specimens, we aimed to advance the understanding of how variations in composition and structure affect the mechanical properties of these materials.
Figure 1 outlines the step-by-step process of the methodological framework, including the preparation of samples, microwave imaging setup, data collection, and analysis of group delay and attenuation.

Figure 1.
Step-by-step process of the methodological framework.
2. Proposed Microstrip-Filter Configuration
2.1. Equivalent Lumped Model
The microwave filter in this study is connected to the input and output log-periodic structured feedlines, forming a ring-shaped transmission line. The feedlines are interconnected with the transmission line. Figure 2a displays a detailed lumped-circuit model that incorporates all aspects of the proposed filter. The Advanced Design System (ADS) tool transformed each transmission line into an individual lumped component. By employing our meticulous method, we effectively captured the intricate electrical attributes of every transmission line. Subsequently, these discrete modeled components were interconnected to generate a complete analogous circuit. The circuit design procedure considered both the geometric attributes and the qualities of the substrate material. Furthermore, the intricate architectural design of the filter was duly considered. By following these procedures, we confirmed that the developed lumped-circuit model adequately depicted the complex electrical characteristics of the complete filter system.
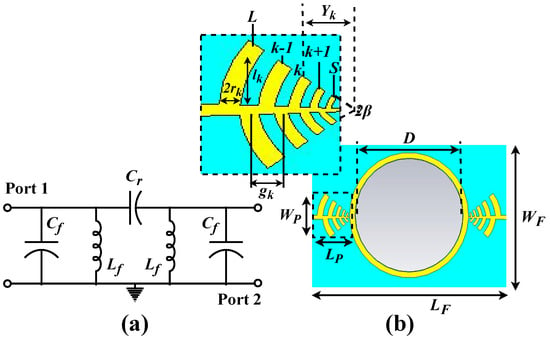
Figure 2.
(a) Equivalent circuit model of filter (where = 5.89 pF, = 9.3 nH, and = 9.69 pF) and (b) structural configuration of the filter (where = 5 cm, = 4 cm, and D = 10 cm).
The preferred geometry of the filter is presented in Figure 2b, and the values are given in Table 1. Although the recommended ring design vibrates at a particular frequency, the two feedlines are coupled through capacitance, causing frequency splitting. The splitting can be altered by optimizing the geometrical parameters of the feedline. These adjustments directly impact the extent to which the two feedlines are interconnected [15,16].

Table 1.
Values of the parameters of the filter.
The resonant frequency of the proposed ring can be derived using a formula that incorporates the effective permittivity of the surrounding air, denoted as , the length of the ring, represented by p, and the speed of light in a vacuum, denoted as c.
We provide evidence that the log-periodic feedlines exhibit superior performance compared to alternative configurations in terms of transmission and reflection characteristics, as depicted in the and values shown in Figure 3a. The log periodic design achieves greater performance by utilizing changes in the element size along the feedline and an adjustable shape, enabling comprehensive frequency band coverage and consistent performance over various frequencies. Furthermore, our feedlines surpass current topologies designed for specific frequency ranges in preserving impedance matching throughout a broad spectrum, which is crucial for efficient power transmission and minimizing signal reflection. The logarithmic periodicity of the log periodic feedlines results in a more consistent impedance distribution, reducing the standing wave ratio. It enhances the efficiency of signal transmission in comparison to feedline architectures that are not as optimized.
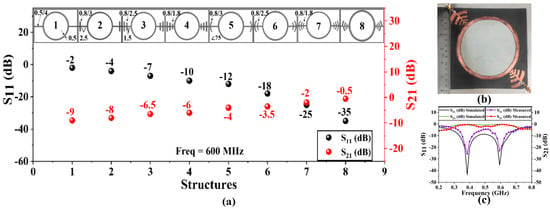
Figure 3.
(a) Step-by-step configuration of the filter (with dimensions in width/length (cm)), (b) the developed filter prototype, and (c) measured and simulated S-parameter results for the filter.
The feedline exhibits a relatively straightforward configuration, consisting of linear fins forming a coplanar array uniformly [17]. These fins are alternately fed via a transmission line, with the geometric proportions of the elements adhering to a distinct pattern, as illustrated in Figure 2b. The scaling factor, defined by the following equation, governs the logarithmic progression of the feedline array. This relationship is influenced by a scaling factor () and a spacing factor ():
where represents half the component’s length, denotes the distance between the component k from the apex of the feedline, indicates the distance of lines k+1 and k, and represents the line’s radius of k.
The radius of the fin does not follow an exact geometric progression. The spacing factor () is defined as follows:
where is the length of the component.
A parameter of frequency-independent layouts is the apex angle, denoted as 2, which is defined in relation to the parameters and .
where N is the number of fins, is the longest fins’ length, and is the shortest fins’ length.
After N is determined, and can be calculated. is defined as = , and is = = , where and are the lower and upper truncation coefficients.
The distance between lines can be computed as follows:
The feedline’s total length () corresponds to the distance between the longest and smallest fins:
Additionally, the thickness of the fin is represented by the following ratio:
2.2. Operational Mechanism of the Filter
The working principle of the ring filter, which functions within the 0.3 GHz-to-0.7 GHz frequency range, is fundamentally based on the resonant frequency response theory. This idea serves as the foundation for the functioning of the ring filter. The device’s construction was carefully executed to ensure that the resonance frequencies align precisely with the intended frequencies. Furthermore, the filter’s ring design was carefully crafted to provide precise connections for accurate attenuation and group delay measurement. This was achieved by enabling bituminous mix samples to flow through the central opening of the filter without any disruptions.
Changes in the sample’s electromagnetic surroundings significantly affect the resonant frequency response of the filter when placed around the sample. The effect described in this context is caused by alterations in the system’s impedance. The variations in the dielectric characteristics of the solid material and the air gaps it contains are responsible for these modifications. The presence of voids in bituminous mix samples causes changes in the effective permittivity of the medium, resulting in transformations in the dielectric environment. Due to this, the resonant frequency response of the filter experiences a substantial alteration.
2.3. Filter Fabrication
The design of the feedline incorporates a log-periodic configuration implemented on an RT/Duroid 5880 substrate selected for its superior dielectric properties. The low dielectric constant and loss tangent of Duroid 5880 ensure efficient signal transmission with minimal loss [16,18]. Moreover, its excellent temperature stability, mechanical robustness, and ease of fabrication enhance the reliability and repeatability of the sensing device, making it an ideal substrate choice. The LPF is connected to both ends of the ring, as illustrated in Figure 3b.
The layout of the filter was fabricated using conventional etching methods. Figure 3c compares the simulated and measured results, demonstrating a high degree of agreement between them. Achieving the correlation between measurement and simulation was a primary objective of this study. However, it is essential to acknowledge that slight variations may occur due to material characteristics, manufacturing tolerances, and environmental influences.
3. Bituminous Mix Characteristics
During the experiment, specimens measuring 10 cm in diameter and 6.4 cm in height were used to make bituminous mixes. The test featured two mixtures: bituminous concrete (BC) and open-grade friction course (OGFC). BC is a viscous blend containing 3–5% air voids and a high density of fine particles. OGFC exhibits voids ranging from 18–20% and contains very few or no fine particles. Aggregates are crucial for maintaining the structural integrity of bituminous mixtures. Coarse materials, such as fragmented stones or gravel, contribute to the overall stability [19]. The materials used in this study are local aggregates obtained from a nearby quarry in Meghalaya, India. Coarse aggregates consist of particles that are 4.75 mm and more prominent, while fine aggregates consist of particles ranging from 0 mm to 4.75 mm. The study employed Portland pozzolana cement as the mineral filler and VG 40 bitumen for the experiment. Table 2 provides the physical features of coarse and fine aggregates [20,21].
The Marshall mix design method was employed in this study. The specimens were fabricated in the laboratory according to the relevant code of practice. The samples were prepared by individually heating the bitumen and aggregate. The composition was created utilizing the Marshall mix design process. The aggregates were measured per the requirements and then kept in the oven at 160–170 °C for 24 h. Afterward, hot bitumen was added to the aggregates. The designated proportions of these constituents were mixed, and the loose blends were poured into a cylindrical mold with a diameter of 100 mm. Subsequently, both sides of the mixture were subjected to 75 strikes using a conventional Marshall hammer. Once the samples were gathered, they were cooled at room temperature before the extraction procedure. After extraction, the mixes were tested to ascertain their flow value and specific gravity values. Before the testing phase, the samples were placed in a water bath at a temperature of 60 °C for 30 min. The prepared specimens were thereafter subjected to a constant load at a rate of 51 mm/min until the samples reached the point of failure. The resistance to deformations at the point of failure was measured in terms of the flow value.
To perform tests for specific gravity, ASTM standards (C127/C127M 2001) [22] were adopted for coarse and fine aggregates, respectively. To determine the specific gravity of an aggregate sample, first, the aggregate was immersed in water for 24 ± 6 h to fill the pores and achieve a saturated surface-dry (SSD) condition. After immersion, they were removed from the water and then dried. The surface moisture used an absorbent cloth, ensuring that the pores remained water-filled. The SSD sample was weighed, and the mass was recorded as MSSD (the mass of the saturated dry sample). Next, the volume of the SSD sample was determined by submerging it in water and measuring the displaced volume, which was recorded as a . Finally, the aggregate sample was dried in an oven at 100–110 °C until it reached a constant mass, typically taking 24 h or more, and then the mass was weighed and recorded as . An aggregate’s specific gravity was calculated using the following equation:
where X represents the aggregate’s oven-dry weight () in grams, Y is the saturated surface-dry weight (MSSD) of the material in the air in gms, and Z is the weight of the saturated material in water () in gms.

Table 2.
Physical properties of aggregates.
Table 2.
Physical properties of aggregates.
| Properties | Result | Standard |
|---|---|---|
| Los Angeles Abrasion (%) | 13.04 | ASTM DC-131 [23] |
| Aggregate Impact (%) | 17.53 | ASTM C131/C131M [23] |
| Bulk Specific Gravity (Coarse Agg.) | 2.95 | ASTM C127 [22] |
| Bulk Specific Gravity (Fine Agg.) | 3.012 | ASTM C128 [24] |
| Water Absorption (%) | 1.3 | ASTM DD7172 [25] |
4. Measurement Setup
A precise connection has been established between the filter and the Vector Network Analyzer (VNA) to optimize signal transmission and reception performance, ensuring minimal loss and maximum accuracy in measurements. The VNA underwent calibration utilizing the Short–Open–Load–Through (SOLT) method, a widely recognized procedure in RF and microwave measurements. Calibration standards, including short, open, and load, are essential for the SOLT method to ensure that the characteristic impedance of the system and the device under test (DUT) are properly matched. This calibration method was carried out using the Agilent 85052D calibration kit, which provides precise standards for the SOLT process.
To ensure comprehensive data collection, each sample was measured at consistent intervals of 0.5 cm in height and 10 degrees in angle, as depicted in Figure 4. These precise measurements were necessary to capture the spatial variability in the attenuation properties of the samples. The cylindrical coordinate system was employed to facilitate these measurements, with the radius, angle, and height being the primary variables. This meticulous approach ensured that the dataset was robust and representative of the sample’s properties.
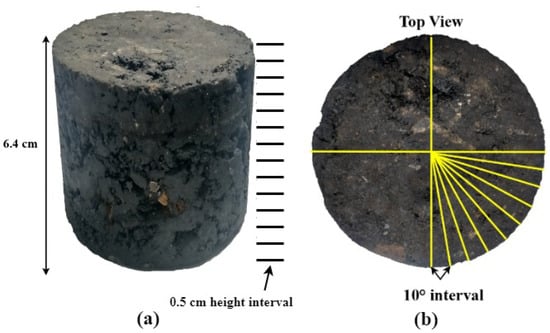
Figure 4.
(a) Measurement procedure of the samples and (b) top view of the samples.
The filter was designed in an annular shape, facilitating the convenient insertion of cylindrical specimens into the measurement setup. This design choice enhances the practicality and repeatability of the measurements. The experimental setup, as depicted in Figure 5, comprises a signal generator (SG) and a signal analyzer (SA). The SG is responsible for producing electromagnetic impulses transmitted through the samples, serving as the signal propagation medium. These impulses are essential for characterizing the samples’ frequency response and attenuation properties. Conversely, the SA gathers and analyzes the transmitted signals, extracting crucial information regarding the attenuation characteristics of the materials under test.

Figure 5.
(a) OGFC samples; (b) BC samples; setup: group delay measurement in VNA for (c) free space and (d) BC samples; (e) OGFC samples’ attenuation measurement in SA and SG for (f) BC samples and (g) OGFC samples.
During the experimental procedures, stringent adherence to recognized standards for room conditions was maintained. The ambient temperature was controlled within 20 to 25 °C (68 to 77 °F), which is typical for standard laboratory conditions. The humidity level was also maintained within the standard range for the specific geographic area, typically between 60% and 80%. These controlled environmental conditions are crucial for minimizing the influence of external factors on the measurements, thereby ensuring the reliability and repeatability of the experimental results.
The attenuation coefficient () of electromagnetic waves passing through the samples can be determined using the following equation [26,27]:
where the variable h denotes the height of the samples, whereas indicates the imaginary component of the complex permittivity of bitumen, which depends on the angular frequency () and depth (z).
The properties of the BC and OGFC samples are shown in Table 3 and Table 4. These tables are critical for highlighting the differences in the properties of the BC and OGFC samples, providing insights into their performance characteristics and suitability for various applications in road construction. The detailed comparison of flow values, specific gravity, binder content, and weight helps in understanding the material behavior and its implications for practical use.

Table 3.
Properties of BC samples.

Table 4.
Properties of OGFC samples.
5. Data Compilation, Processing, and Visualization
A detailed representation of the attenuation and group delay data acquired from the proposed LPF-based ring filter is presented. To accomplish this, we employed a rigorous methodology utilizing Python and various tools, including Pandas, NumPy, Matplotlib, and Scikit-learn. The visualization entailed the conversion of cylinder coordinates to Cartesian coordinates, followed by the creation of a 3D cylindrical contour plot to depict the data appropriately.
Firstly, we utilized the Pandas library to extract the data from CSV files. The dataset contained columns for the radius (measured in cm), angle (measured in degrees), height (measured in cm), and attenuation (measured in dB). The method of extracting data includes putting these columns into a Pandas DataFrame and then turning the extracted columns into NumPy arrays to optimize numerical computations.
To simplify converting from cylindrical to Cartesian coordinates, we utilized NumPy’s radians function to transform the angle data from degrees to radians. The conversion was essential, as NumPy’s trigonometric functions require input in radians. Next, we applied the cylindrical-to-Cartesian coordinate transformation formulas to convert the coordinates. This conversion enabled us to depict the data in a 3D Cartesian coordinate system, which is better suited for display with Matplotlib.
Upon converting the coordinates, we modified the arrays to conform to the intended dimensions for visualization. The reshaping was essential to allow an accurate interpretation of the data using Matplotlib’s 3D charting tools. Subsequently, we generated a three-dimensional figure with axes utilizing Matplotlib. To plot the surface of the cylindrical contour, we used the plot surface function from Matplotlib’s Axes3D module. This function necessitates the inclusion of the x, y, and z coordinates, as well as the attenuation values, to color the surface. We utilized the Blues colormap to visually distinguish the attenuation amounts on the surface. The color intensity depicted the degree of attenuation, offering a lucid and instinctive comprehension of the distribution of attenuation across the surface of the cylinder.
In addition, we utilized the MinMaxScaler function from the Scikit-learn library to standardize the attenuation values, ensuring that they fell within the range of 0 to 1. Normalization was crucial to represent the relative variations in attenuation over the surface of the cylinder appropriately through color mapping. The normalized attenuation values were utilized to create a heatmap data array, which was then visualized using Matplotlib.
We generated an additional 3D plot to depict the cylinder’s surface visually. The plots for the BC and OGFC samples are shown in Figure 6 and Figure 7, respectively. We incorporated a color bar, ranging from blue (lower values) to red (higher values), that correlated the normalized attenuation and group delay values with the colors in the viridis colormap to offer a complete and detailed depiction of the data. The color bar aided in understanding the amounts of attenuation and group delay at different locations on the surface of the cylinder. We utilized the normalized attenuation data to build a heatmap. The parameters of the cylinder were specified, with a radius of 5.0 cm and a height of 7.0 cm. We utilized NumPy’s linspace function to generate a grid of points representing the surface of the cylinder. The angle range was defined from 0° to 360°, while the height range was set from 0.5 to 7.0 cm. The mesh grid function produced the grid points for the angle and height dimensions. In contrast, the Cartesian coordinates for the grid points were calculated using the identical cylindrical-to-Cartesian translation algorithms. The plot surface function was used to generate a heatmap on the surface of the cylinder. The viridis colormap was applied to depict the normalized attenuation values. The surface’s transparency was adjusted to 0.5 to enhance the plot’s visual attractiveness and interpretability. Labels for the axes and a title were included in this plot, guaranteeing that the representation was clear and easily understandable. The baseline attenuation in free space was measured at 4.6 dB, while the group delay was recorded at 16 ps.
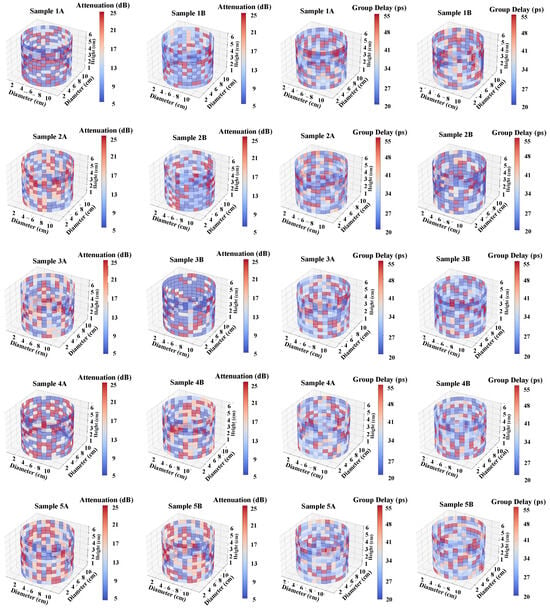
Figure 6.
Microwave imaging of BC samples.
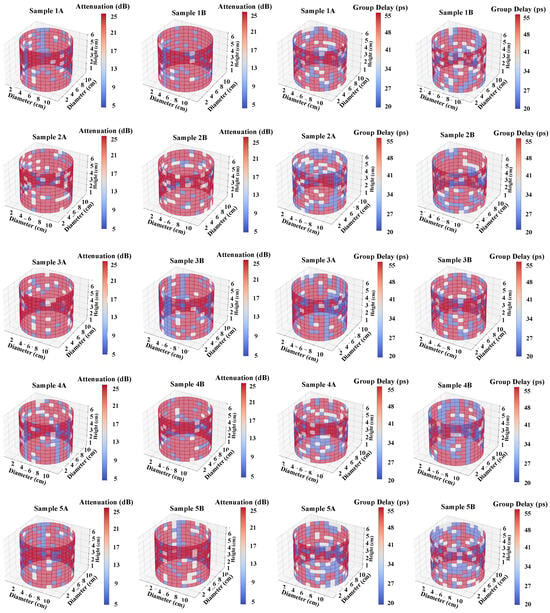
Figure 7.
Microwave imaging of OGFC samples.
6. Results and Discussions
The contour plots show distinct attenuation and group delay patterns for the BC and OGFC samples. The color distribution, particularly the transitions from blue to red, provides insights into the varying attenuation and group delay levels across the sample surfaces. The BC samples’ attenuation and group delay appear more uniformly distributed with localized areas of higher data. This suggests a relatively consistent material composition and density, with certain regions potentially having higher binder content or aggregate packing. In contrast, the OGFC samples display a more pronounced variation in attenuation and group delay, with larger areas exhibiting higher attenuation values. This can be attributed to the open-graded structure of the OGFC mix, which typically has a higher air void content than BC. The areas of higher attenuation and group delay may correspond to regions where the material has a higher concentration of fines or where the binder has accumulated, leading to an increased absorption of microwave energy.
These observations are crucial, as they provide insights into the material characteristics and their potential impact on performance. For instance, areas with higher attenuation and group delay in the OGFC sample could indicate regions more susceptible to moisture infiltration, which could affect the long-term durability of the pavement. Similarly, the relatively uniform attenuation and group delay in the BC sample might suggest better resistance to deformation under load due to its denser structure.
Figure 8a,b depict regression plots that demonstrate the correlation between flow value, specific gravity, group delay, and attenuation of BC samples. Similarly, Figure 8c,d show regression plots of OGFC samples with high values. Furthermore, as the regression plots demonstrate, we have effectively formulated equations that correlate flow value (FV), specific gravity (SG), group delay (), and attenuation ().
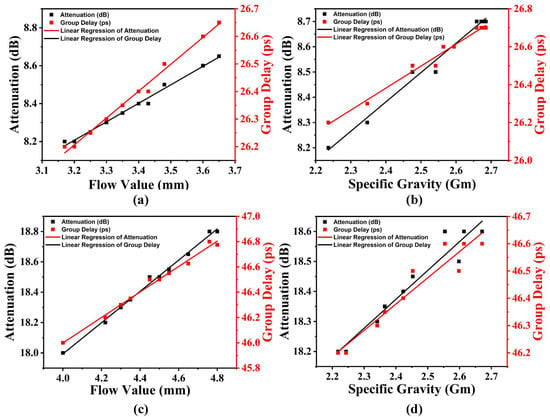
Figure 8.
Linear fits and measurements of group delay () and attenuation () for BC samples: (a) vs. flow value (mm) ( = 0.99) and (b) vs. specific gravity (Gm) ( = 0.99). For OGFC samples, (c) vs. flow value ( = 0.99) and (d) vs. specific gravity ( = 0.95).
For the BC samples,
For the OGFC samples,
Table 5 compares the average values obtained for attenuation, group delay, flow value, and specific gravity for the BC and OGFC samples. The calculated values produced using the microstrip filter and the measured values acquired via the standard Marshall method are included. The BC sample had an average attenuation of 8.5 dB and an average group delay of 26.5 ps. The calculated flow value was 3.4 mm. However, the measured flow value was 3.47 mm, resulting in an error of roughly 0.02 and an accuracy of 99.8%. The calculated specific gravity was 2.545, compared to the measured value of 2.5, resulting in a discrepancy of approximately 0.018 and an accuracy of 99.8%. The OGFC sample exhibited an average attenuation of 18.5 dB and an average group delay of 46.5 ps. The calculated flow value was 4.5 mm. However, the measured flow value was 4.61 mm, leading to an error of roughly 0.024 and an accuracy of 99.75%. The computed specific gravity was 2.448, while the measured value was 2.53, resulting in an error of approximately 0.032 and an accuracy of 99.7%. The minute inaccuracies emphasize the precision and dependability of the microstrip filter approach in calculating the flow value and specific gravity of bituminous mixes, showcasing its potential as a feasible substitute for conventional measuring techniques.

Table 5.
Parameter values for each sample.
Table 6 compares this study and various sensors developed employing microwave technology to analyze bituminous mixtures. Our research employs microwave imaging and a log-periodic feedlines-based filter to examine binder aggregate in bituminous mixes. Unlike other methods, our technique specifically examines the relationship between attenuation and group delay, leading to a comprehensive comprehension of the structural strength of bituminous mixes. This nuanced understanding is crucial for assessing the quality of road-construction materials.

Table 6.
Comparison with the state of the art.
7. Conclusions
This work has thoroughly investigated the use of a log periodic feedline-based ring filter to evaluate the behavior of binder aggregates in bituminous mixes, which is essential for the construction of road infrastructure. The novel methodology employs microwave imaging and a two-port ring filter to quantify attenuation and group delay at different angles and heights within cylindrical bituminous specimens. This methodology offers excellent insights into the flow values and specific gravity, providing a sophisticated understanding crucial for evaluating road-building materials.
The experimental results, verified by conducting a thorough comparison with traditional measuring techniques, showcase the precision and dependability of the microstrip filter technology. The computed flow values and specific gravities exhibit negligible discrepancies compared to the measured values obtained via the Marshall method. The filter can predict the parameters of the samples with a high accuracy of roughly 99.8% for flow value and specific gravity, whereas the OGFC sample displays an accuracy of 99.7%, correspondingly, as shown in the high values. The findings highlight the potential of the suggested method as a feasible and accurate alternative to conventional measurement techniques. The proposed method not only provides accurate results but also has other practical benefits. These include the capability to conduct non-destructive testing and the potential for the real-time monitoring of the structural integrity of bituminous mixtures. This research enhances the understanding of material qualities by examining the dynamic link between attenuation and group delay. This information is crucial for optimizing the performance and lifespan of road infrastructure.
The ring filter represents notable progress in bituminous mix analysis. Its capacity to deliver precise, dependable, and comprehensive measurements renders it an indispensable asset for researchers and engineers engaged in non-destructive road building and maintenance testing. While this study provides valuable insights into the performance of the log-periodic feedline-based filter, it is important to acknowledge some limitations. The research was confined to a specific RT duroid substrate, which may limit the applicability of the findings to other materials with different dielectric properties. Future research should include investigations using a variety of substrates to assess the filter’s versatility and consider real-world testing conditions to evaluate performance under more complex scenarios.
This study introduces a novel integration of electromagnetic response analysis into evaluating bituminous mixtures, marking a significant advancement in material characterization and mix design. By examining the dielectric properties of bituminous materials, this approach uncovers anomalies and variations that traditional methods might miss, thereby enhancing the precision of non-destructive testing techniques. Our findings highlight this method’s potential to improve the spatial resolution analysis of samples and pave the way for more accurate and robust mix-design procedures in future road infrastructure development. This innovative technique, therefore, holds promise for transforming current practices and addressing existing gaps in knowledge within the field.
Author Contributions
Conceptualization, S.M., P.K.G. and A.P.; methodology, S.M. and P.K.G.; software, A.P.; validation, A.P.; formal analysis, A.P., H.K. and R.S.; investigation, A.P., H.K. and R.S.; resources, S.M. and P.K.G.; data curation, A.P., H.K. and R.S.; writing—original draft preparation, A.P.; writing—review and editing, A.P.; visualization, S.M.; supervision, S.M. and P.K.G.; project administration, P.K.G.; funding acquisition, P.K.G. All authors have read and agreed to the published version of the manuscript.
Funding
The project was financially sponsored by the SERB-funded project (Sr. No. CRG/2022/008018 and EEQ/2022/000397).
Institutional Review Board Statement
Not applicable.
Informed Consent Statement
Not applicable.
Data Availability Statement
The data substantiating the conclusions of this study can be obtained from the corresponding author upon a reasonable request.
Acknowledgments
The authors thank the Science and Research Engineering Board for its financial assistance. The authors express their gratitude to Rogers Corporation for generously supplying RT-Duroid 5880 substrate samples for our research and to the Advanced Microwave and Wireless Communication Lab at NIT Meghalaya for granting us access to their state-of-the-art resources, which greatly facilitated the development of the filter.
Conflicts of Interest
The authors declare no conflicts of interest.
References
- Qiao, Y.; Dawson, A.R.; Parry, T.; Flintsch, G.; Wang, W. Flexible Pavements and Climate Change: A Comprehensive Review and Implications. Sustainability 2020, 12, 1057. [Google Scholar] [CrossRef]
- Abedali, A.H.U. MS-2 Asphalt Mix Design Methods, 7th ed.; Asphalt Institute: Lexington, KY, USA, 2009. [Google Scholar]
- Vamegh, M.; Ameri, M.; Chavoshian Naeni, S.F. Experimental investigation of effect of PP/SBR polymer blends on the moisture resistance and rutting performance of asphalt mixtures. Constr. Build. Mater. 2020, 253, 119197. [Google Scholar] [CrossRef]
- Ogundipe, O.M. Marshall Stability and Flow of Lime-modified Asphalt Concrete. Transp. Res. Procedia 2016, 14, 685–693. [Google Scholar] [CrossRef]
- Kandhal, P.S.; Mallick, R.B.; Huner, M. Development of a new test method for measuring bulk specific gravity of fine aggregates. Transp. Res. Rec. 1999, 1721, 81–90. [Google Scholar] [CrossRef]
- Leiva-Villacorta, F.; Vargas-Nordcbeck, A. Repeatability and Reproducibility of Pavement Density Profiling Systems. NDT 2024, 2, 190–203. [Google Scholar] [CrossRef]
- Yurduseven, O.; Gowda, V.R.; Gollub, J.N.; Smith, D.R. Printed Aperiodic Cavity for Computational and Microwave Imaging. IEEE Microw. Wirel. Components Lett. 2016, 26, 367–369. [Google Scholar] [CrossRef]
- Shahsavarani, S.; Ibarra-Castanedo, C.; Lopez, F.; Maldague, X.P.V. Deep Learning-Based Superpixel Texture Analysis for Crack Detection in Multi-Modal Infrastructure Images. NDT 2024, 2, 128–142. [Google Scholar] [CrossRef]
- Baghelani, M. A Single-Wire Microwave Sensor for Selective Water and Clay in Bitumen Analysis at High Temperatures. IEEE Trans. Instrum. Meas. 2021, 70, 9512508. [Google Scholar] [CrossRef]
- Mamulat, S.; Burmistrov, I.; Mamulat, Y.; Metlenkin, D.; Shekhovtsova, S. The Introduction of Micro- & Nanodispersed Fillers into the Bitumen Binders for the Effective Microwave Absorption). In Advances in Road Infrastructure and Mobility; Springer International Publishing: Berlin/Heidelberg, Germany, 2022; pp. 1071–1082. [Google Scholar]
- Baghelani, M.; Abbasi, Z.; Daneshmand, M. Noncontact high sensitivity chipless tag microwave resonator for bitumen concentration measurement at high temperatures. Fuel 2020, 265, 116916. [Google Scholar] [CrossRef]
- Alidoustaghdam, H.; Çayören, M. Non-Destructive Testing of Concrete Tunnels with Qualitative Microwave Imaging. In Proceedings of the 2020 German Microwave Conference (GeMiC), Cottbus, Germany, 9–11 March 2020; pp. 29–31. [Google Scholar]
- Jiya, E.A.; Anwar, N.S.N.; Abdullah, M.Z. Detection of Cracks in Concrete Structure Using Microwave Imaging Technique. Int. J. Microw. Sci. Technol. 2016, 1–6. [Google Scholar] [CrossRef]
- Rhim, H.C.; Büyüköztürk, O. Wideband Microwave Imaging of Concrete for Nondestructive Testing. J. Struct. Eng. 2000, 126, 1451–1457. [Google Scholar] [CrossRef]
- Gugliandolo, G.; Vermiglio, G.; Cutroneo, G.; Campobello, G.; Crupi, G.; Donato, N. Development, Characterization, and Circuit Modeling of Inkjet-Printed Coupled Ring Resonators for Application in Biological Samples. IEEE Trans. Instrum. Meas. 2023, 72, 8002810. [Google Scholar] [CrossRef]
- Paul, A.; Bhargava, G.; Majumdar, S. Impact of holes in an interdigital parallel folded coupled line-based wideband bandpass filter for X-band applications. Microw. Opt. Technol. Lett. 2023, 66, e33903. [Google Scholar] [CrossRef]
- Vieira, G.C. Log-Periodic Dipole Antennas in Printed Circuit Technology. Master’s Thesis, Instituto Superior Technico, Lisboa, Portugal, June 2018. [Google Scholar]
- Paul, A.; Sarkar, P. Compact Multi-Band Bandpass Filters Using Substrate Integrated Waveguide and Fractal Resonators. In Proceedings of the International Conference on Data, Electronics and Computing, Singapore, 15–16 December 2023; pp. 333–340. [Google Scholar]
- Pingale, A.D.; Gautam, D.; Owhal, A.; Deshwal, D.; Belgamwar, S.U.; Rao, V.K.P. Development of Non-Destructive Dynamic Characterization Technique for MMCs: Predictions of Mechanical Properties for Al@Al2O3 Composites. NDT 2023, 1, 22–34. [Google Scholar] [CrossRef]
- Bhargava, G.; Majumdar, S.; Gugliandolo, G.; Campobello, G.; Donato, N.; Crupi, G. Design and Validation of a Low-Cost Antenna-Based Solution for Microwave Imaging of RCC Structure. IEEE Sensors Lett. 2023, 7, 3500604. [Google Scholar] [CrossRef]
- Paul, A.; Bhargava, G.; Gautam, P.K.; Majumdar, S. Non-Destructive Evaluation of Strength and Porosity of Bituminous Mixes Using Log- Periodic Feedlines-Based Ring Filter. IEEE Trans. Instrum. Meas. 2024, 73, 8003110. [Google Scholar] [CrossRef]
- ASTM C127-01; Standard Test Method for Density, Relative Density (Specific Gravity), and Absorption of Coarse Aggregate. ASTM International: West Conshohocken, PA, USA, 2001. [CrossRef]
- ASTM C131/C131M-20; Standard Test Method for Resistance to Degradation of Small-Size Coarse Aggregate by Abrasion and Impact in the Los Angeles Machine. ASTM International: West Conshohocken, PA, USA, 2001. [CrossRef]
- ASTM C128; Standard Test Method for Density, Relative Density (Specific Gravity), and Absorption of Coarse Aggregate. ASTM International: West Conshohocken, PA, USA, 2001. [CrossRef]
- ASTM D2172-95; Standard Test Methods for Quantitative Extraction of Bitumen from Bituminous Paving Mixtures. ASTM International: West Conshohocken, PA, USA, 1995. [CrossRef]
- Yamamoto, Y.; Nagahara, M.; Khargonekar, P.P. Signal Reconstruction via H∞ Sampled-Data Control Theory—Beyond the Shannon Paradigm. IEEE Trans. Signal Process. 2012, 60, 613–625. [Google Scholar] [CrossRef]
- Paul, A.; Bhargava, G.; Majumdar, S. Development and characterization of log periodic feedline based filter for water leakage detection in size invariant PVC pipes. Flow Meas. Instrum. 2024, 98, 102647. [Google Scholar] [CrossRef]
- Baghelani, M.; Abbasi, Z.; Daneshmand, M. High-Dynamic-Range Chipless Microwave Resonator-Based Strain Sensor. IEEE Trans. Instrum. Meas. 2021, 70, 8003207. [Google Scholar] [CrossRef]
Disclaimer/Publisher’s Note: The statements, opinions and data contained in all publications are solely those of the individual author(s) and contributor(s) and not of MDPI and/or the editor(s). MDPI and/or the editor(s) disclaim responsibility for any injury to people or property resulting from any ideas, methods, instructions or products referred to in the content. |
© 2024 by the authors. Licensee MDPI, Basel, Switzerland. This article is an open access article distributed under the terms and conditions of the Creative Commons Attribution (CC BY) license (https://creativecommons.org/licenses/by/4.0/).