Article

Acoustic Emission Analysis of Mode II Interlaminar Fracture Toughness of 3D Reinforced CFRP

by
Thiago Luiz Lara Oliveira
1,2,*,
Daniel Brighenti Bortoluzzi
1,
Lorena Cristina Miranda Barbosa
1 and
Antônio Carlos Ancelotti, Jr.
1
1
Institute of Mechanical Engineering, Universidade Federal de Itajubá, UNIFEI, Itajubá 37500-903, MG, Brazil
2
Institut Clement Ader, Université Paul Sabatier, 31062 Toulouse, France
*
Author to whom correspondence should be addressed.
NDT 2024, 2(1), 32-52; https://doi.org/10.3390/ndt2010003
Submission received: 29 October 2023 / Revised: 3 December 2023 / Accepted: 13 December 2023 / Published: 12 January 2024

Abstract

:
The use of composites in industry is increasing due to their ability to replace traditional materials. Carbon fiber-reinforced polymers offer a favorable strength-to-weight ratio, making them advantageous in numerous applications. Delamination is a common failure mode for composite materials, making it a crucial factor in ensuring material safety during service life. While fiber orientation in composites is designed for specific directional reinforcement, out-of-plane loads are often neglected, posing a critical challenge. Implementing through-thickness reinforcement, such as tufting, can enhance out-of-plane resistance, enabling more accurate structural designs. Non-destructive testing methods, particularly acoustic emission, play a significant role in ensuring component safety by detecting early damage and flaws. This study focused on monitoring mode II interlaminar fracture toughness and end-notched flexure (ENF), using acoustic emissions to compare the performance of samples with different through-thickness reinforcements against that of nonreinforced samples. The research analyzed acoustic emission patterns during testing, revealing a strong correlation with failure stages and the resistance induced by reinforcements. This approach provided valuable insights into damage characterization, supported by fractography analysis, especially concerning the final stages of failure due to damage, and the effects of different thread reinforcements. Acoustic emission proved crucial for real-time monitoring, enabling informed decisions to be made regarding component repair and lifespan extension in composite materials.

1. Introduction

During the past century, the use of composite materials to replace traditional materials has accelerated. Due to a general enhanced capacity to design materials for specific uses, from mechanical structures to electrical devices, the use of composite materials has also grown in different industrial fields. Nowadays, composite materials are largely used in automotive, aeronautical, and naval structures due to their high mechanical resistance and light weight. Carbon fiber-reinforced plastics (CFRP) are frequently chosen in aeronautical and space engineering design due to their substantial capacity for fuel economy and reduction in overall aircraft weight. In aeronautical applications, components made from composites are subject to diverse impacts, loading modes, and levels during service life. Eventually, a loading out-of-plane may cause delamination defects or catastrophic failure [1]. This limitation has generated the opportunity to develop other mitigation strategies through the addition of structural and non-structural functions [2], for example, the use of self-healing structures or parts capable of absorbing damage [3,4]. Another example is reinforcing composite materials through thickness, which mitigates design limitations and the need for oversizing parts. Reinforcing composite materials in the Z direction is achieved by using other manufacturing techniques, such as Z-pinning or tufting [5]. Such materials are frequently designed for an application when, for example, the material has a higher resistance for a loading direction. However, structures may be subject to eccentrical loadings and small variations from the symmetry plane can significantly change the material response, leading to complex failure mechanisms and decreased strength resistance [6].
Composite materials are also different from other classes of materials in terms of damage mechanism. Their disadvantages include them being hazardous and difficult to recycle [7,8]. The categorization of defects into classes is frequently the subject of study, with authors continuously improving defect definitions. Several types of defects exist: one classification comprises six categories, with an emphasis on micro-cracking and delamination phenomenology [9]. Delamination is one of the most significant modes of failure: a form of damage that affects the life of composite materials while in service and their structural stability by reducing stiffness [10]. Thus, in an attempt to mitigate delamination, different approaches have been tested for improving interlaminar fracture toughness. The most used methods for increasing out-of-plane resistance are stitching, z-anchoring, tufting, z-pinning, and 3D weaving [11,12,13,14,15]. Each technique is particularly suited for certain applications, and each technique exhibits differences in terms of mechanical properties, behavior, and fracture mechanism. Among these, tufting can increase out-of-plane resistance, usually in dry preforms, by accessing the preform only on one side so the insertions do not create tension on the surface laminate. The tuft insertion is performed via a hollow needle, and the loops thus created are maintained inside the preform by friction. While a tufting reinforcement usually affects ultimate tensile strength negatively, the process significantly increases delamination resistance and crack propagation [16]. Some aspects of the tufting process influence the material reinforcement response; for example, tufting line spacing, way and height of insertion, and tuft reinforcement material [17,18]. Thus, tufting acts as an advanced method of 3D reinforcement that allows designs variations, making it useful for different applications.
Regarding 3D reinforcement techniques, the choice of technique relies on specific structure needs, considering advantages and drawbacks in toughness, damage tolerance, and mechanical properties [19]. Ongoing research aims to address challenges and expand applicability in aircraft structures. For example, Z-pinning and tufting are distinct reinforcement techniques employed in composite materials for aeronautical purposes. Both techniques aim to introduce mechanical links between composite plies to enhance performance and damage tolerance. Z-pinning has been found to significantly improve delamination resistance, damage tolerance, and joint strength, but it can also reduce in-plane mechanical properties such as elastic modulus, strength, and fatigue performance [20]. Tufting has been shown to increase pull-off resistance and prevent delamination, particularly in stiffener-to-skin T-joints. Z-pinning’s failure mode involves pin pullout, while tufting alters failure to flexural bending [21]. Thus, the selection between Z-pinning and tufting techniques depends on the specific requirements of the composite structure, considering advantages and drawbacks in terms of interlaminar toughness, damage tolerance, and in-plane mechanical properties.
Often, delamination in composite structures occurs below the surface and is invisible or barely visible, making visual inspection ineffective [22]. Materials used in aerospace applications are costly, and using conventional evaluation methods on them may result in unwanted damage that is also expensive to repair. This factor makes non-destructive techniques (NDT) ideal for detecting, locating, and monitoring the occurrence of defects without compromising material properties and has hence resulted in their development [23]. Using uniaxial tests, different levels of damage and defect formation were recorded with a further use of NDT for three-dimensional characterization [9]. A similar study investigated failure modes in composite fibers, regarding the mechanism of fracture and energy dissipation. Reviewing the use of destructive and non-destructive methods to detect and evaluate defects, the study evaluated the suitability of these techniques and their capacity to identify the various fracture mechanisms involved in failure [24]. Another study also showed the similarity of results obtained from destructive and non-destructive techniques for evaluating a composite sample subjected to tensile testing. While a few differences were found between the two techniques, they both showed an ability to detect microstructural features [25]. A possible approach is to develop numerical tests of composite materials, aiming to understand in detail the failure mechanisms. Due to the complexity of the experimental tests, the numerical tests can provide more information, especially if both are performed with similar conditions [26].
Acoustic emission (AE) analysis is an NDT method based on detecting and analysing acoustic waves emitted by changes in stress emanating from the origin of the defect [27]. AE can detect diverse types of defects, such as matrix micro-cracking, fiber-matrix debonding, localized delamination, fiber pullouts, fiber breakage, and stages of crack propagation caused by fatigue. Since AE is a highly sensitive monitoring technique, it allows locating the damage in real time and global inspection through the use of multiple sensors [28]. AE signals are used in analysis to identify the relationship between damage and event, are directly related to damage mechanisms, and aid in damage detection, particularly through disregarding noise [29]. Recent studies show the high applicability of AE signal analyses for monitoring real-time processes, in mechanical tests, structural monitoring, and manufacturing processes [30,31,32]. The findings support the application of AE sensing technology for future automation, in which it is possible to visualize defect and crack development in real time, allowing higher-quality products and enhancing safety. Some studies have identified a relationship between acoustic emission features and defects occurrence during mechanical tests. Detection of damage in a CFRP specimen during a tensile test showed the relationship between signal amplitude and the class of defect. Matrix cracking, interface failure, and fiber breakage were successfully identified as the signature of the acoustic emission burst [33]. A CFRP specimen was tested in delamination mode I, with the aim of identifying the relationship between AE signals and the test stages or defect generation. The AE signal analysis showed that it is possible to differentiate nucleation from defect propagation [34]. Acoustic emission and other NDTs are an accurate way of monitoring the evolution of damage. Another study focused on AE burst evolution during the crack growth of CFRP specimens during an interlaminar fracture toughness testing mode I. The results showed a burst of AE signal energy linked to matrix properties [30].
In a research investigation, AE was employed for the detection and identification of damage mechanisms in CFRP specimens undergoing open hole tests. The findings of the study revealed that AE analysis has the capability to differentiate between nucleation and defect propagation, as well as discern effects related to events taking place in the matrix and fibers. The paper proposes that this novel approach can offer comprehensive insights into the damage condition of mechanically stressed materials [35]. A different investigation examined the response of CFRP composite laminates under fatigue loading in mode II through the end-notched flexural (ENF) test. The study concentrated on the fatigue-induced damage in specimens subjected to mode II conditions with a sinusoidal cyclic load, employing acoustic emission (AE) and scanning electron microscopy (SEM) techniques. The findings of the study suggest a connection between heightened AE energy and the existence of more substantial, rougher cusps, and striation features on the fracture surface [36]. Acoustic emission analysis was used in an investigation examining monitoring delamination in unidirectional laminated composites of carbon fiber-reinforced polymer under mode I loading conditions. The conclusions showed how acoustic emission analysis serves as a valuable non-destructive method for assessing delamination damage in CFRP, offering significant insights into the underlying failure mechanism [37]. The use of AE with an algorithm to monitor delamination mechanisms in carbon fiber-reinforced polymer samples in real time was explored by another study. The algorithm was able to effectively distinguish AE signals associated with various damage mechanisms, such as fiber breakage and matrix micro-cracking, through the analysis of spectral and energy features within distinct frequency bands [38]. The research conducted a comparative analysis of composite plates employing thermoset and thermoplastic resins through mode II mechanical tests for fracture toughness. The results indicated superior interlaminar fracture resistance and enhanced resistance to crack propagation in the case of the thermoplastic resin. Examination of the fracture surfaces through fractographic analysis unveiled features indicative of pure mode II shear failure, characterized by interfacial fiber/matrix failures and shear cusps reminiscent of those observed in epoxy matrices [39].
This comprehensive experimental investigation delved into the analysis of AE signal characteristics during mode II fracture toughness testing of CFRP. The focus was on understanding the influence of different tufting reinforcements on damage initiation, propagation, and failure modes in composite materials subjected to mode II interlaminar fracture toughness. Real-time monitoring of mechanical tests, along with subsequent specimen characterization, was conducted using CFRP with different tufting threads, as well as a reference material without reinforcement. The study also employed fractography analysis for a detailed examination of the results from the mechanical tests. The analysis of AE signal features revealed correlations between displacement, loading, and the impact of tufting reinforcement on the mechanical response. The study provides new perspectives of analysis and insights into the effects of tufting on the performance of woven CFRP composites in the out-of-plane direction.

2. Materials and Methods

The CFRP used in this study was manufactured using a 2D carbon woven fabric and epoxy resin, with and without 3D reinforcement. The carbon fabric used was a 6 k plain weave with a surface density of 300 g/m2 from SIGATREX model SKDL 8051, and the fiber was manufactured using Grafil/Pyrofil TR50S. The composite plates had 10 or 12 layers of dry woven fabric, reinforced and nonreinforced, respectively; the layers were arranged in a cross-ply configuration, comprising a thickness of approximately 4 mm. In this arrangement, the 0° direction aligns with the warp, while the 90° direction aligns with the weft. The epoxy resin system used in this work was Araldite® LY 5052 base resin with Aradur® 5052 hardener, commercialized by Huntsman; the mix ratio by mass was 100:38. The carbon fabric was selected for its low weight and high resistance, and the resin for its low viscosity, high compatibility with carbon fibers, and reliable mechanical properties after the curing process. For the 3D reinforcement, different configurations and materials were tested. A base sample without reinforcement was manufactured with the aim of testing the behavior of different reinforcements and comparing them with a nonreinforced material. The 3D-reinforced plates used in this study had preforms comprised of 10 plies, and the nonreinforced preform plates had 12 plies. The 3D reinforced preforms comprised fewer layers because the inserted threads resulted in higher thickness, as compared to the preforms not reinforced after the resin infusion process. The two different thread materials used for reinforcement were fibre glass and polyamide. The Texiglass company produced the multifilament fibre glass, and the Mazzaferro company produced the monofilament polyamide (also called Nylon 6). The properties of both threads are listed in Table 1. A standard tensile test was used to determine the ultimate strength of the polyamide reinforcement thread; the test followed the methods described in Standard Test Method for Tensile Properties of Yarns by the Single-Strand Method (ASTM D2256-02) [40].
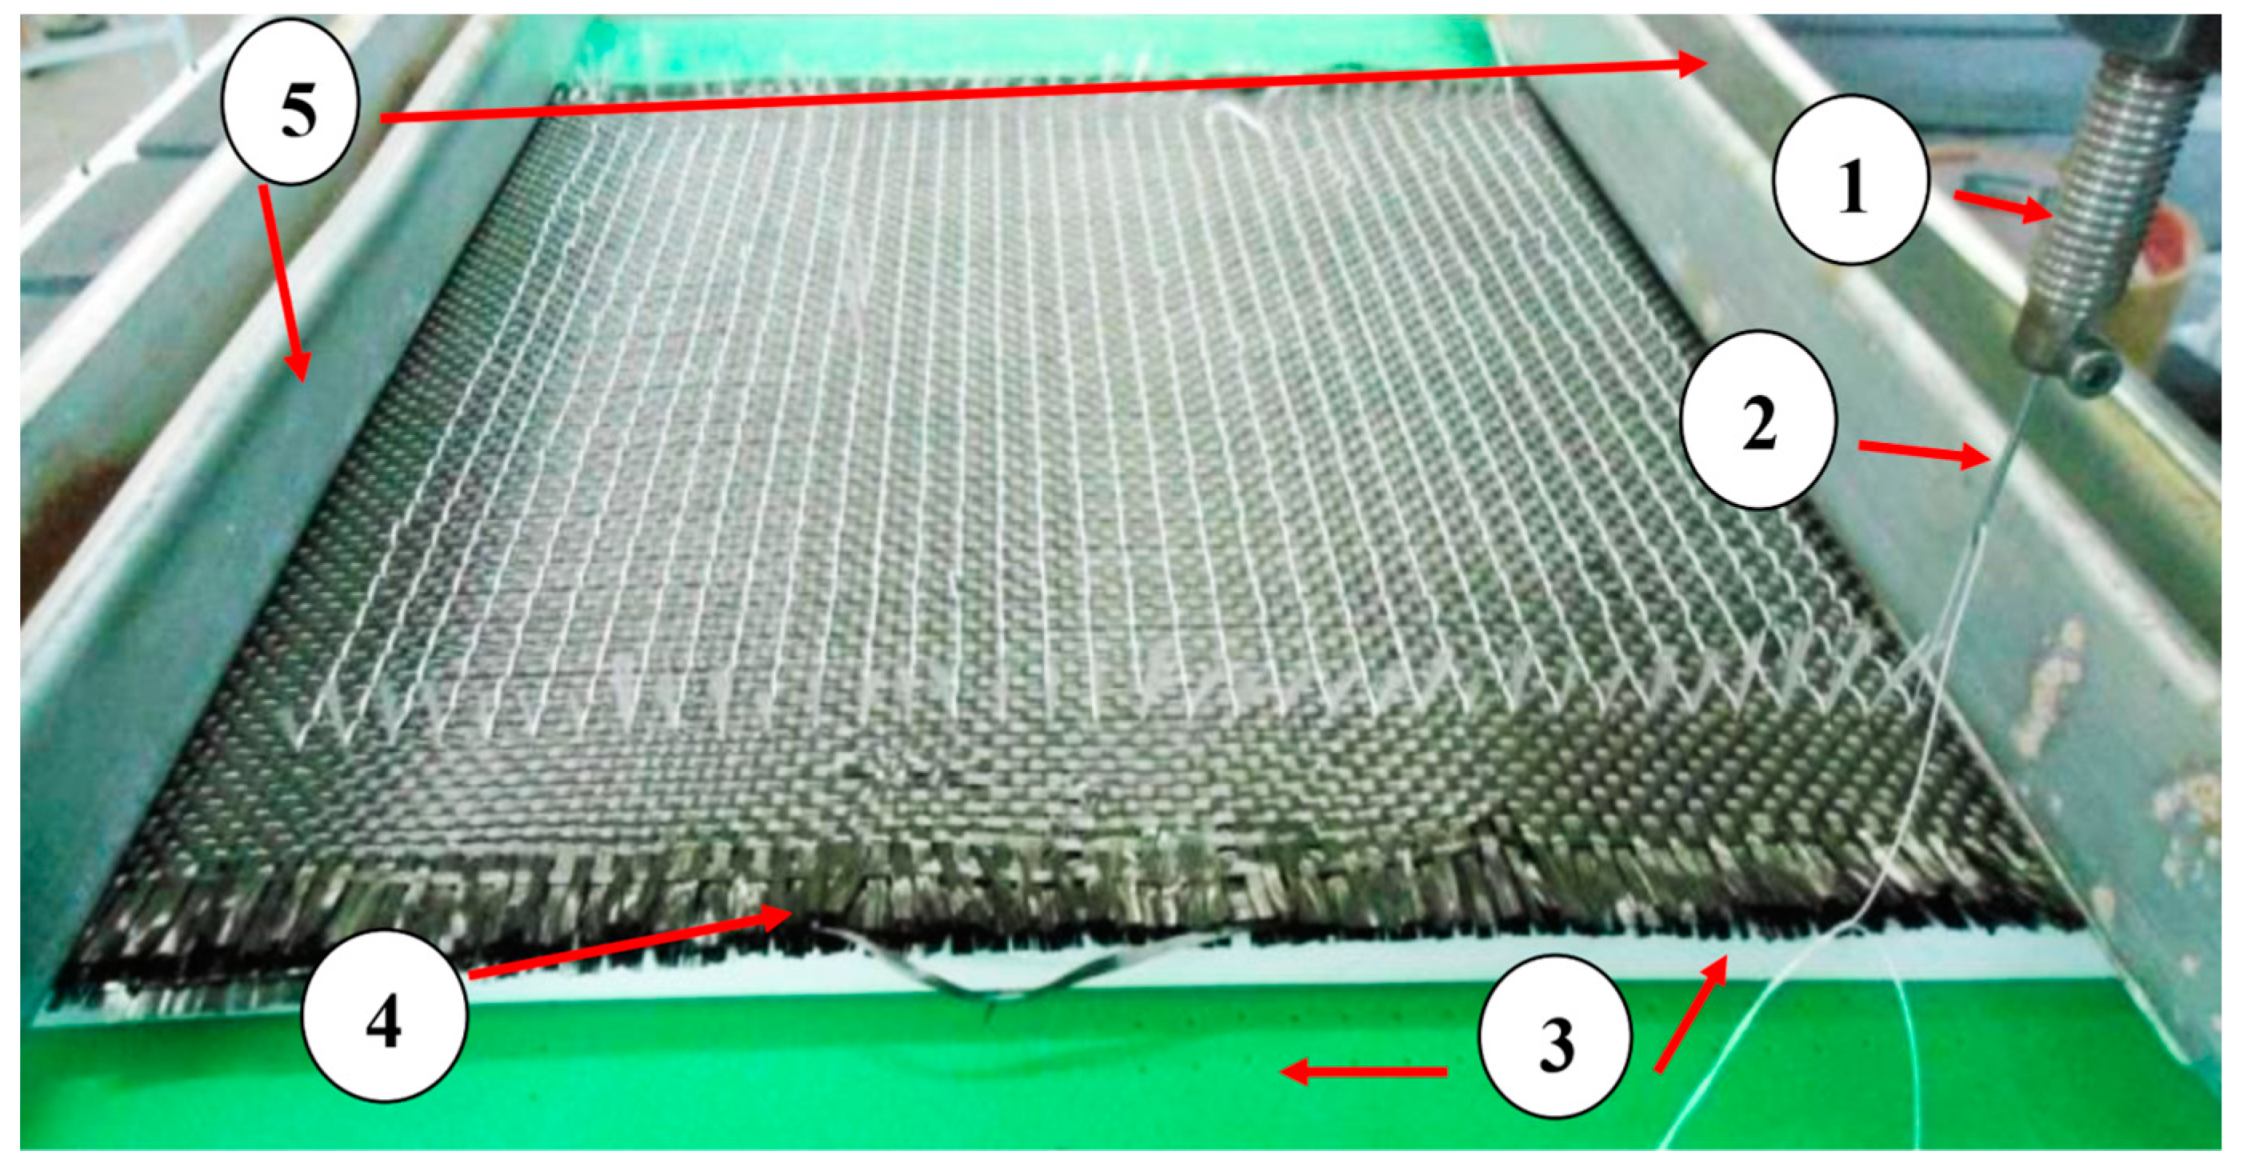
The tufting process here consisted of reinforcing the composite plates in the Z direction by using a continuous thread through woven carbon layers. The thread insertion was performed using a mechanically aided needle in the vertical direction, through all the layers of dry fabric, until the desired depth of preform was reached, and the thread was then returned vertically, generating a free loop on the bottom. The friction between the inserted thread and the fabric allowed the tuft to remain in the preform, and the EVA plate and the polyamide (PA) film helped to form and hold the free loop in the bottom surface of the preform. After generating the tuft, the needle moved horizontally to generate the chosen square pattern with a tuft space of 7 mm (7 × 7). This process is illustrated further in Figure 1.
Through-thickness reinforcement was implemented using a CNC Router machine, and a G-code algorithm was developed to generate the needle’s movement. Figure 2 provides a real-time depiction of the tufting process during fibre glass insertion into the CFRP preform. The CNC machine controlled the needle drive based on the G-code, with the needle holding the thread for through-thickness reinforcement of the dry preform. Support for the preform was provided by an EVA plate, and additional bars were employed to secure the preform in its position.
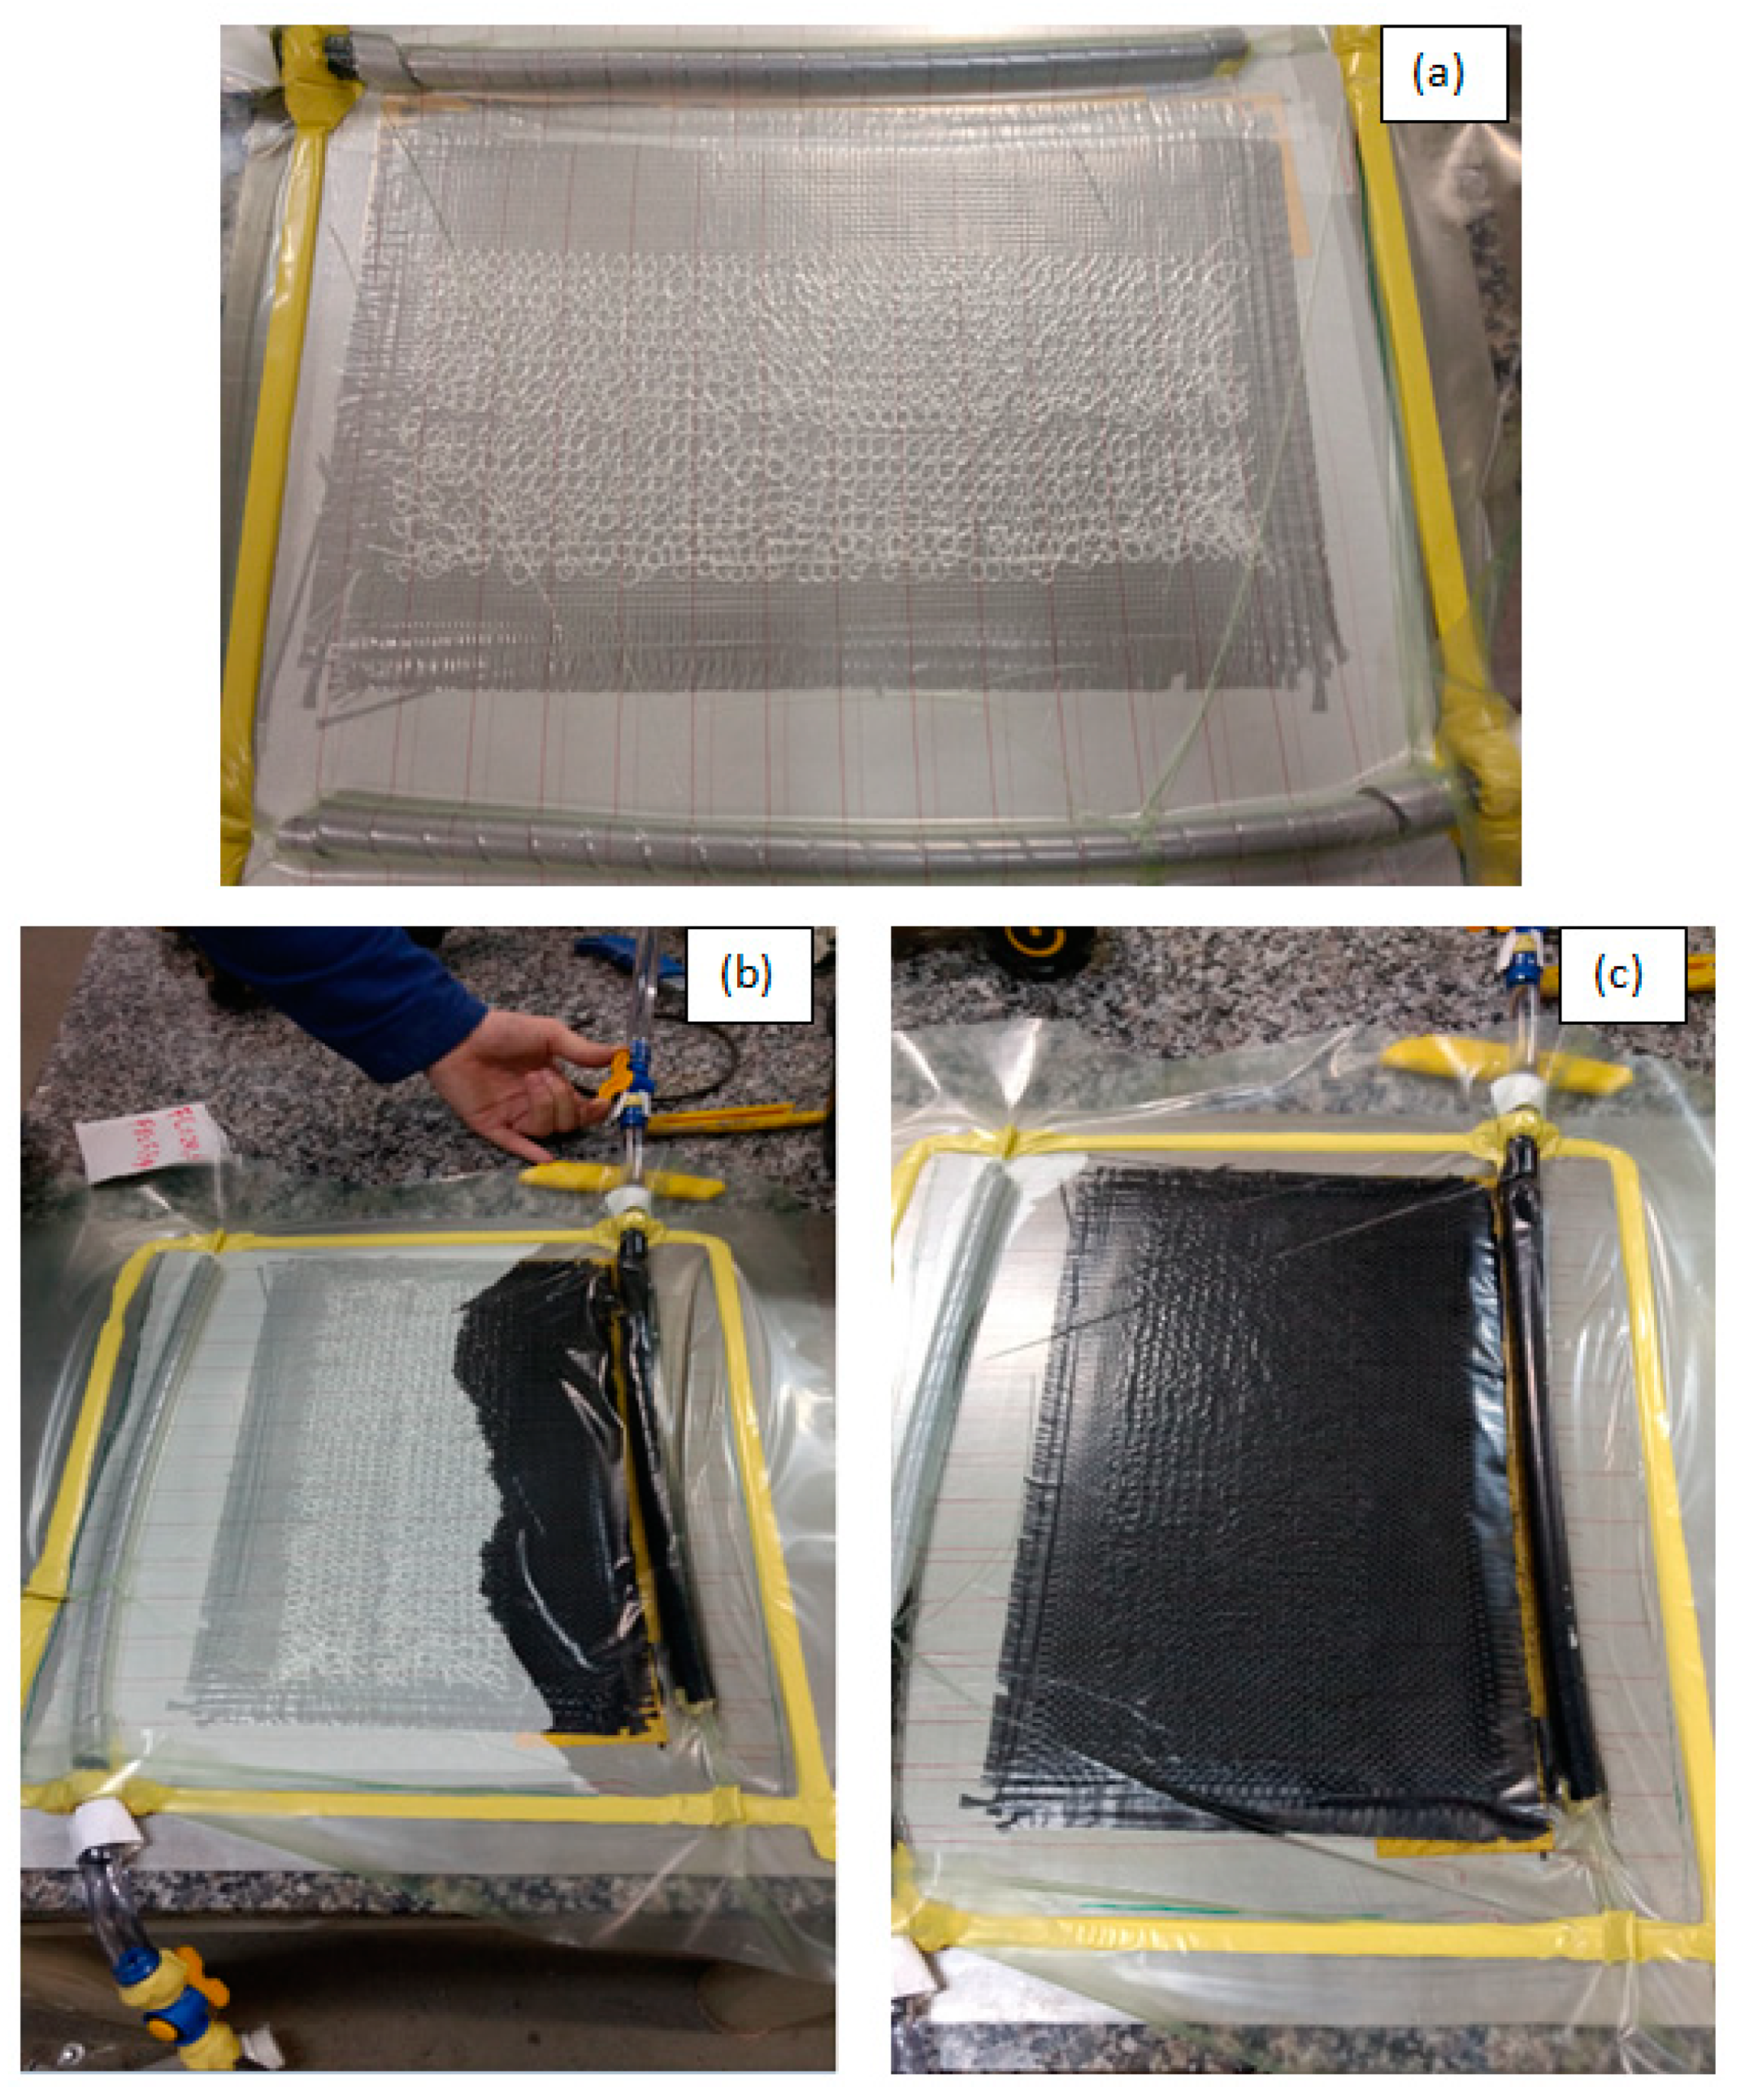
After tufting reinforcement, the composite laminates were manufactured with a vacuum-assisted resin transfer molding process (VARTM). After the VARTM process, the composite was cured for 4 h at 80 °C. Figure 3 shows the preform (a) before, (b) during, and (c) after the resin infusion.
Interlaminar mode II (ENF) tests were performed using a 3-point bend device installed in an INSTRON universal servo-hydraulic test machine, model 8801. The fracture toughness properties of the 3 different kinds of composites were tested. The end-notched flexure (ENF) specimens were 165 mm long and 30 mm wide. Interlaminar delamination tests were conducted in accordance with the Standard Test Method for Determination of the Mode II Interlaminar Fracture Toughness of Unidirectional Fiber-Reinforced Polymer Matrix Composites (ASTM D7905:2014) [41]. Prior to the test, it was necessary to paint the side edges of the specimens in white, facilitating compliance calibration (compliance calibration markings) from the tip of the insert (a_o). The abovementioned ASTM test states that testing has to be performed in two stages called non-pre-cracked (NPC) and pre-cracked (PC). The Figure 4 shows a scheme of the ENF test where a delamination length of 30 mm is used in the fracture test, and L is the specimen half-span (50 mm) where the loading (p) is applied with a displacement speed of 0.5 mm/min, which initiates and increasingly causes delamination.
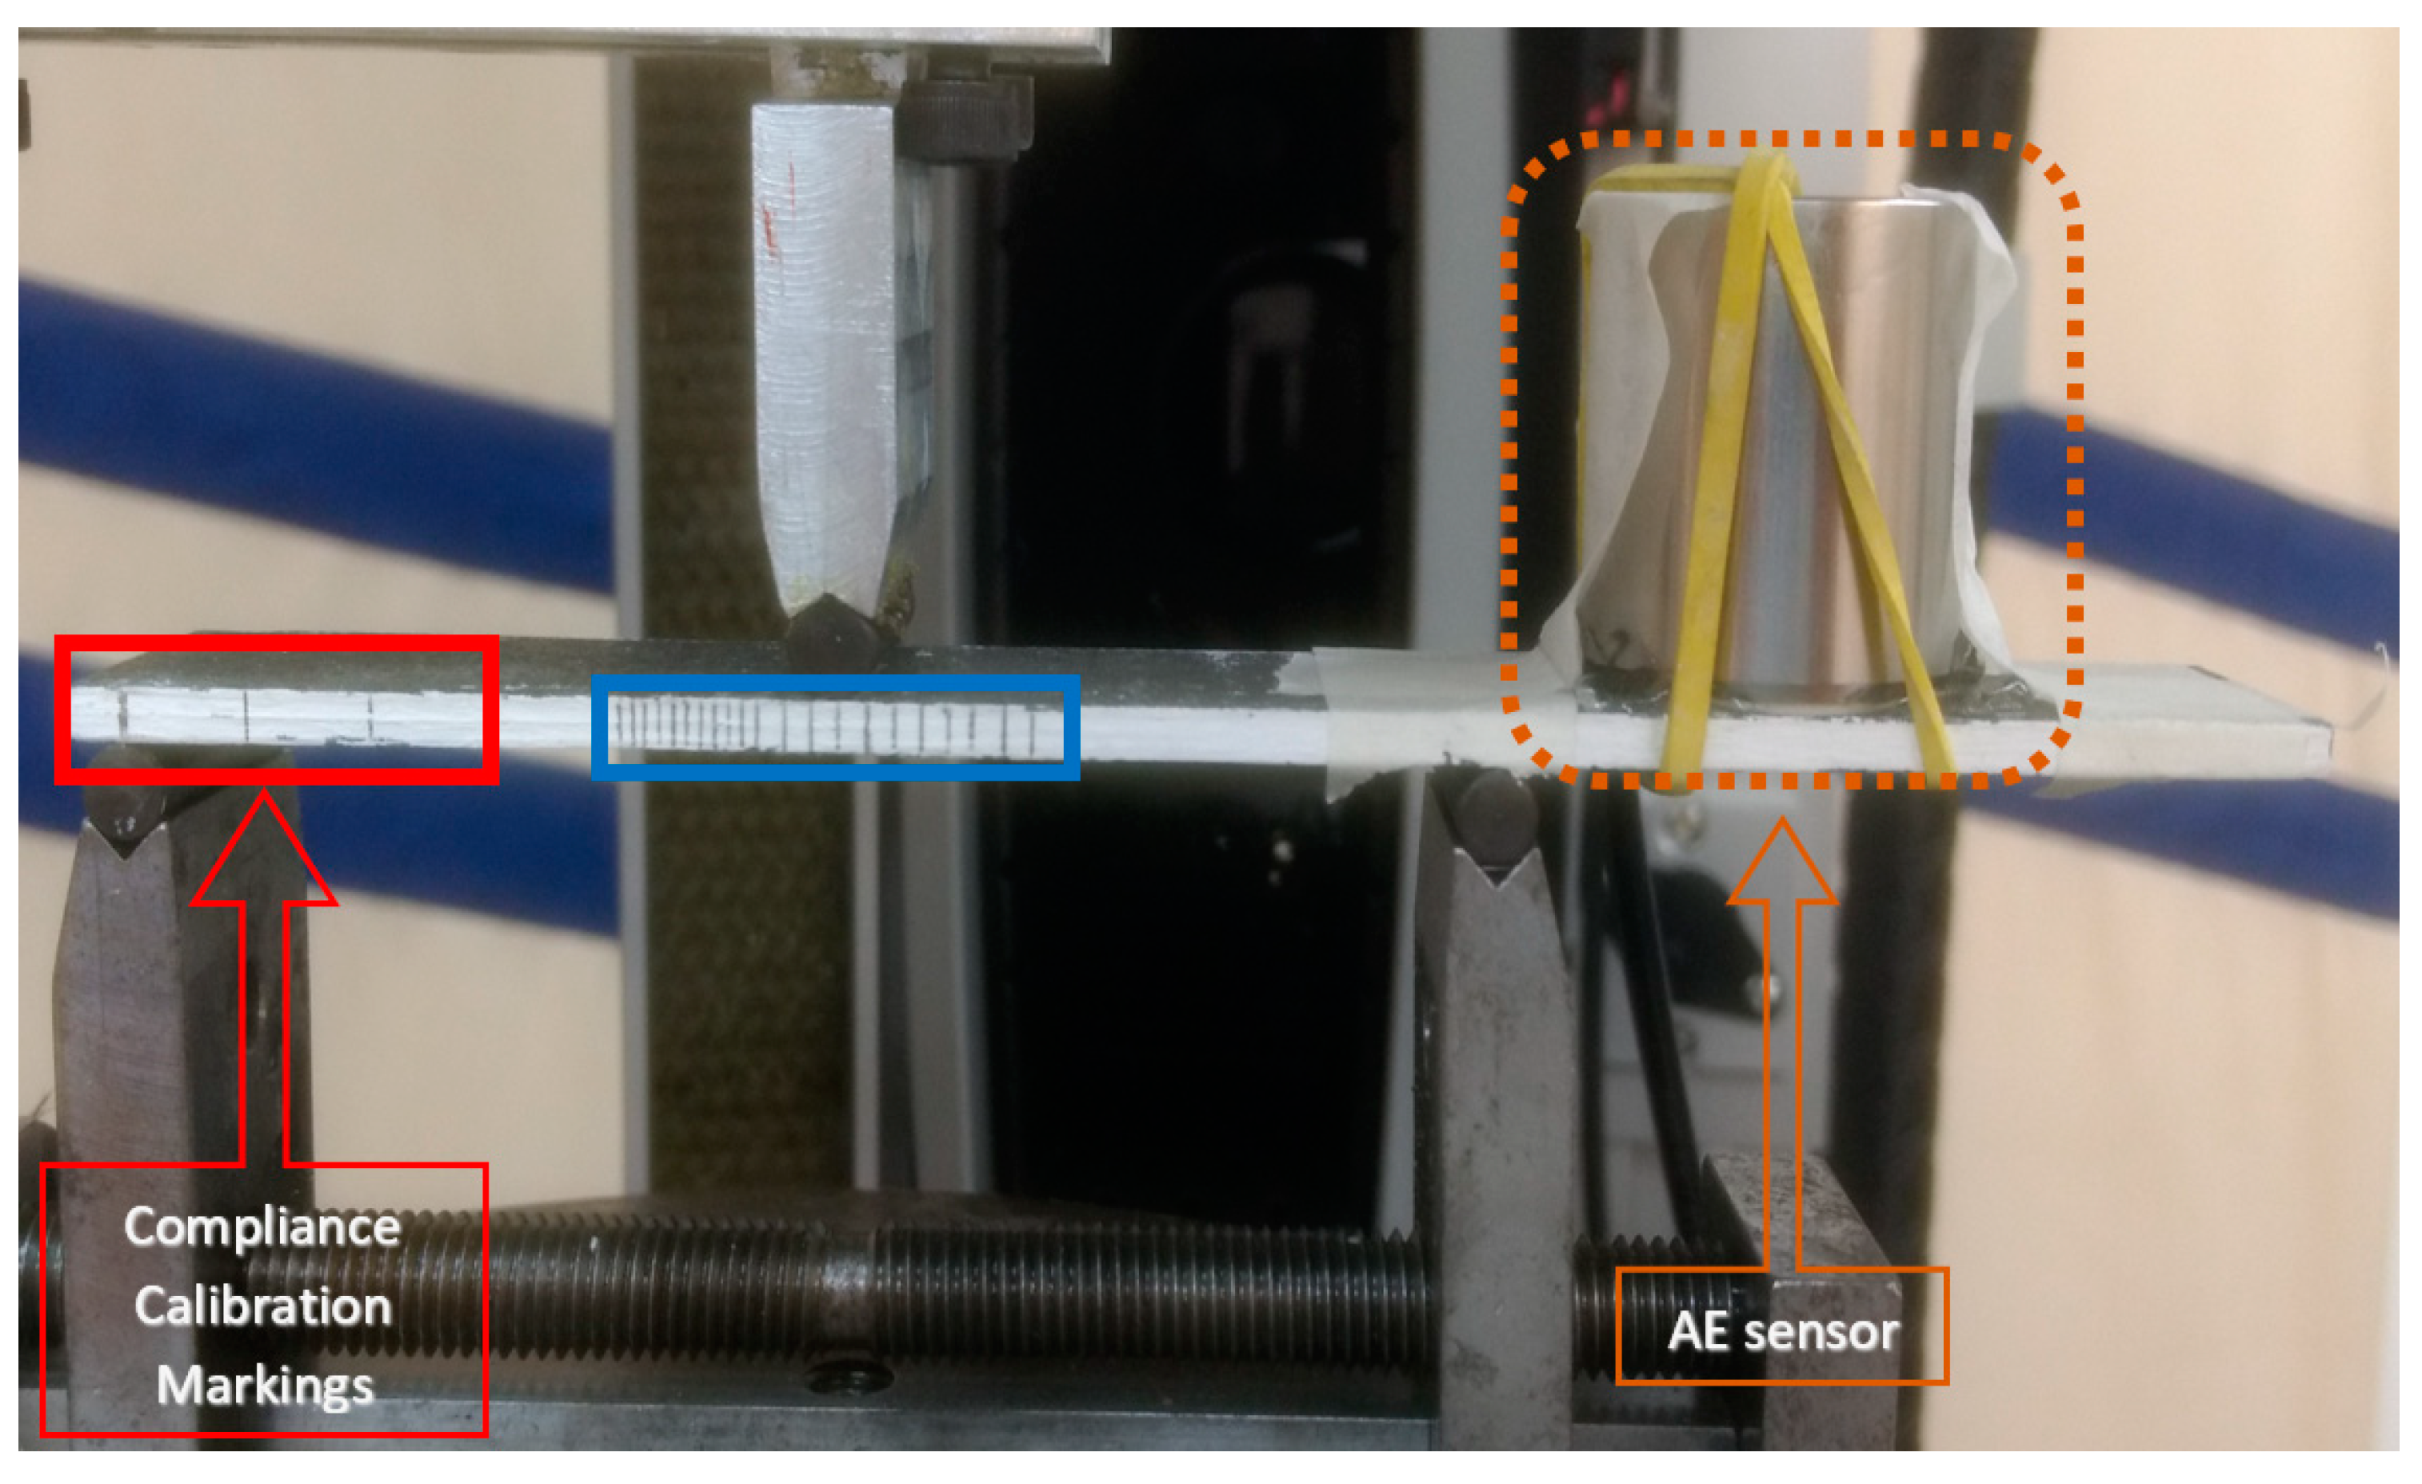
In the first stage, NPC, the specimen was tested until the delamination crack started and was stopped right after the maximum force was achieved. After that, the PC tests occurred in the same way but with new compliance calibration markings. Figure 5 and Figure 6 show the specimen during the NPC and PC tests, respectively. Crack growth was determined by measuring the crack displacement in the markings selected in blue (Figure 6). Crack growth was evaluated at different stages before a fracture ensued, and the mid-span location thus varied for each of these stages.
In order to investigate mode II interlaminar delamination testing using AE signal processing, a sensor was securely attached to the top surface of the CFRP samples using a gel-based coupling phase, as depicted in Figure 5 and Figure 6. The chosen equipment for this study was the Physical Acoustics Sensor Model R151I-AST, equipped with an integrated preamplifier offering a gain of 40 dB and a frequency range from 50 kHz to 400 kHz. This equipment, manufactured by Mistras Group, was optimized for research purposes, boasting a low noise level and high-speed resolution. The system was set up on a dedicated computer, ensuring precise and efficient data collection. The acquired data from the entire mechanical test underwent thorough processing and analysis, facilitated by the AEWin Version E 4.30 software (https://www.innerspec.com/portable/aewin-software (accessed on 1 December 2023)), enabling comprehensive post-analysis study.

3. Results

3.1. Acoustic Emission Signals in Interlaminar Mode II Fracture Testing

The mechanical test results indicated that tufting influenced out-of-plane resistance. Figure 7 shows the average results for load and displacement from ENF test values, with three trials for each material configuration for the PC tests. PC tests were selected for analysis since crack propagation in the NPC phase occurs mainly in the region of the matrix. Additionally, this is the step that will generate delamination and allow the forces causing rupture in through-thickness reinforcements to be assessed. The fibre glass reinforced samples and nonreinforced ones achieved a maximum load higher than those reinforced with polyamide filament. The difference between fibre glass reinforced samples and nonreinforced (base) ones as compared to those reinforced with polyamide was higher than 20% and 25%, respectively. The tufting process using fiberglass threads showed higher displacement as compared to polyamide-reinforced and nonreinforced samples, by 57% and 43%, respectively. Although the load for the nonreinforced samples was higher, the displacement needed to overcome frictional resistance in the tufted samples was higher than that for nonreinforced samples. The smaller load resulting from polyamide reinforcement can be related to the low interface with the thermoset resin and low impregnation around the tufts, leading to embrittlement of the composite, unlike the results with fibre glass, which had a good interface with the resin and became part of the composite. The results obtained from composite materials reinforced with fibre glass here are similar to those of other studies, with some authors reaching up to 60% of resistance increase [42,43,44,45].
Different AE signal features are used for assessing damage levels and classification in mechanical testing procedures for composite materials. Damage characterization for composite materials via AE presented diverse results, with a similar outcome, with correlation of damage during testing with acoustic emission features, amplitude, energy, number of hits, and duration being among the most common [33,45,46,47,48].
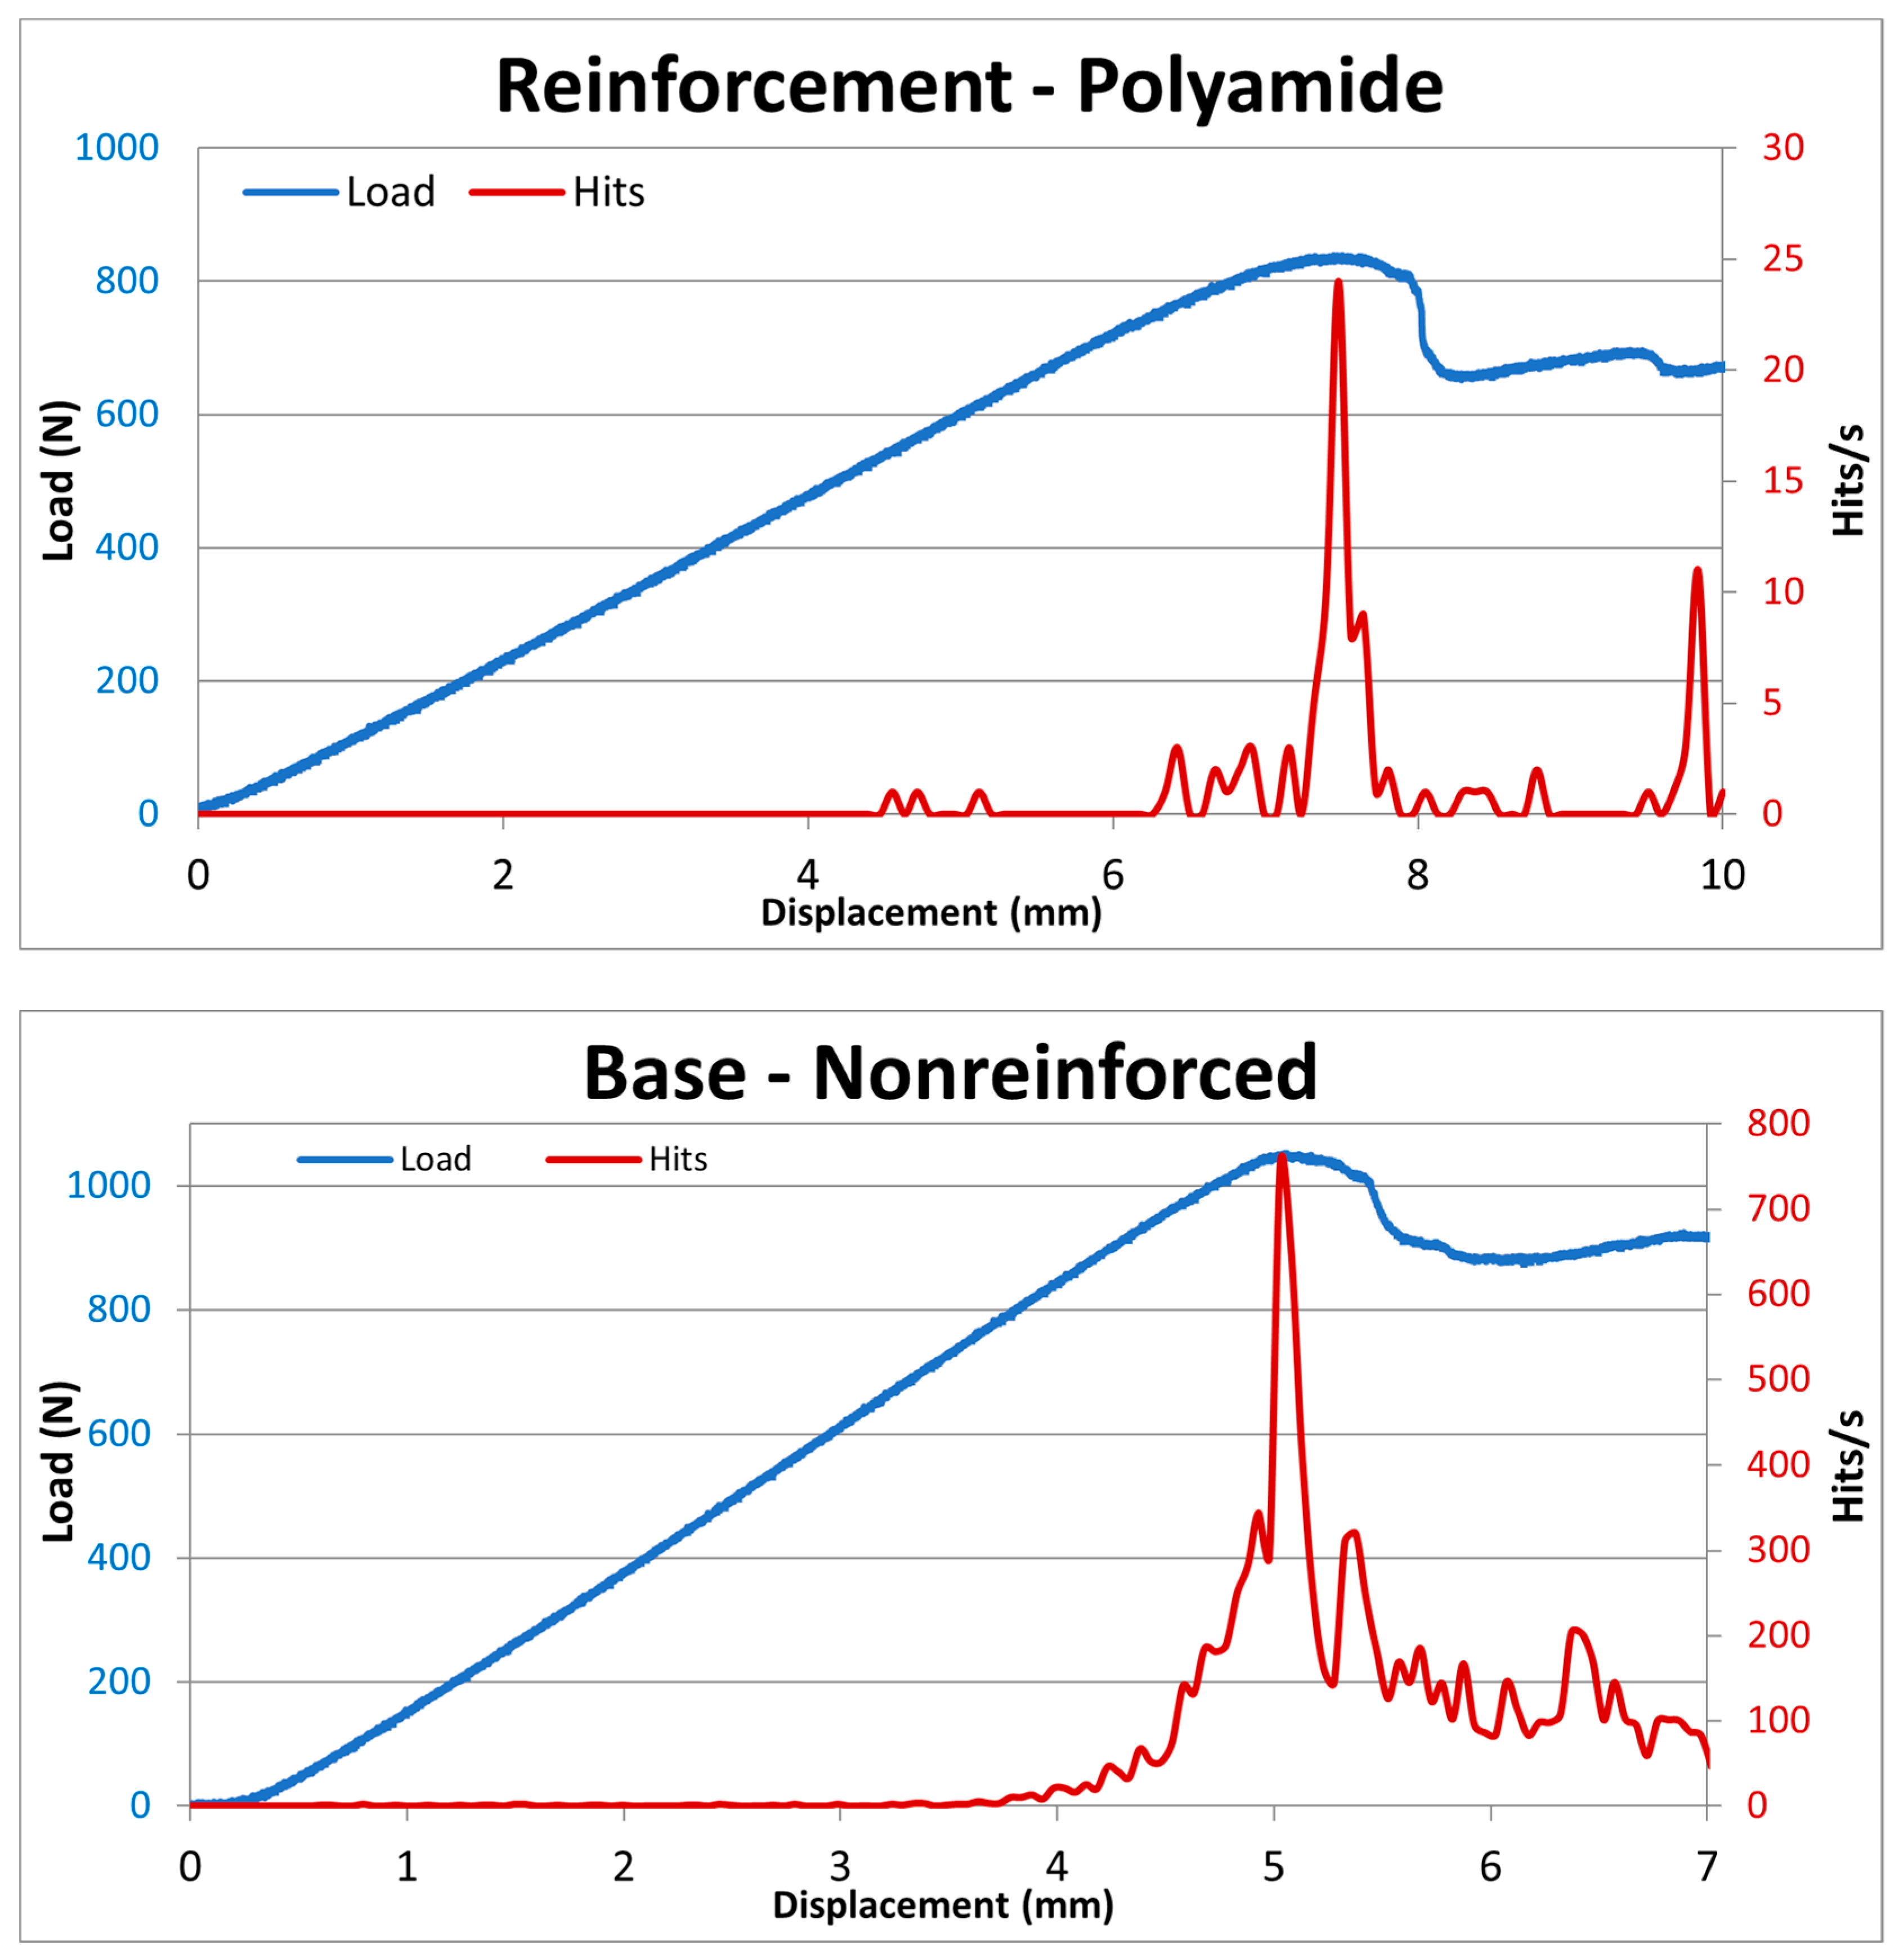
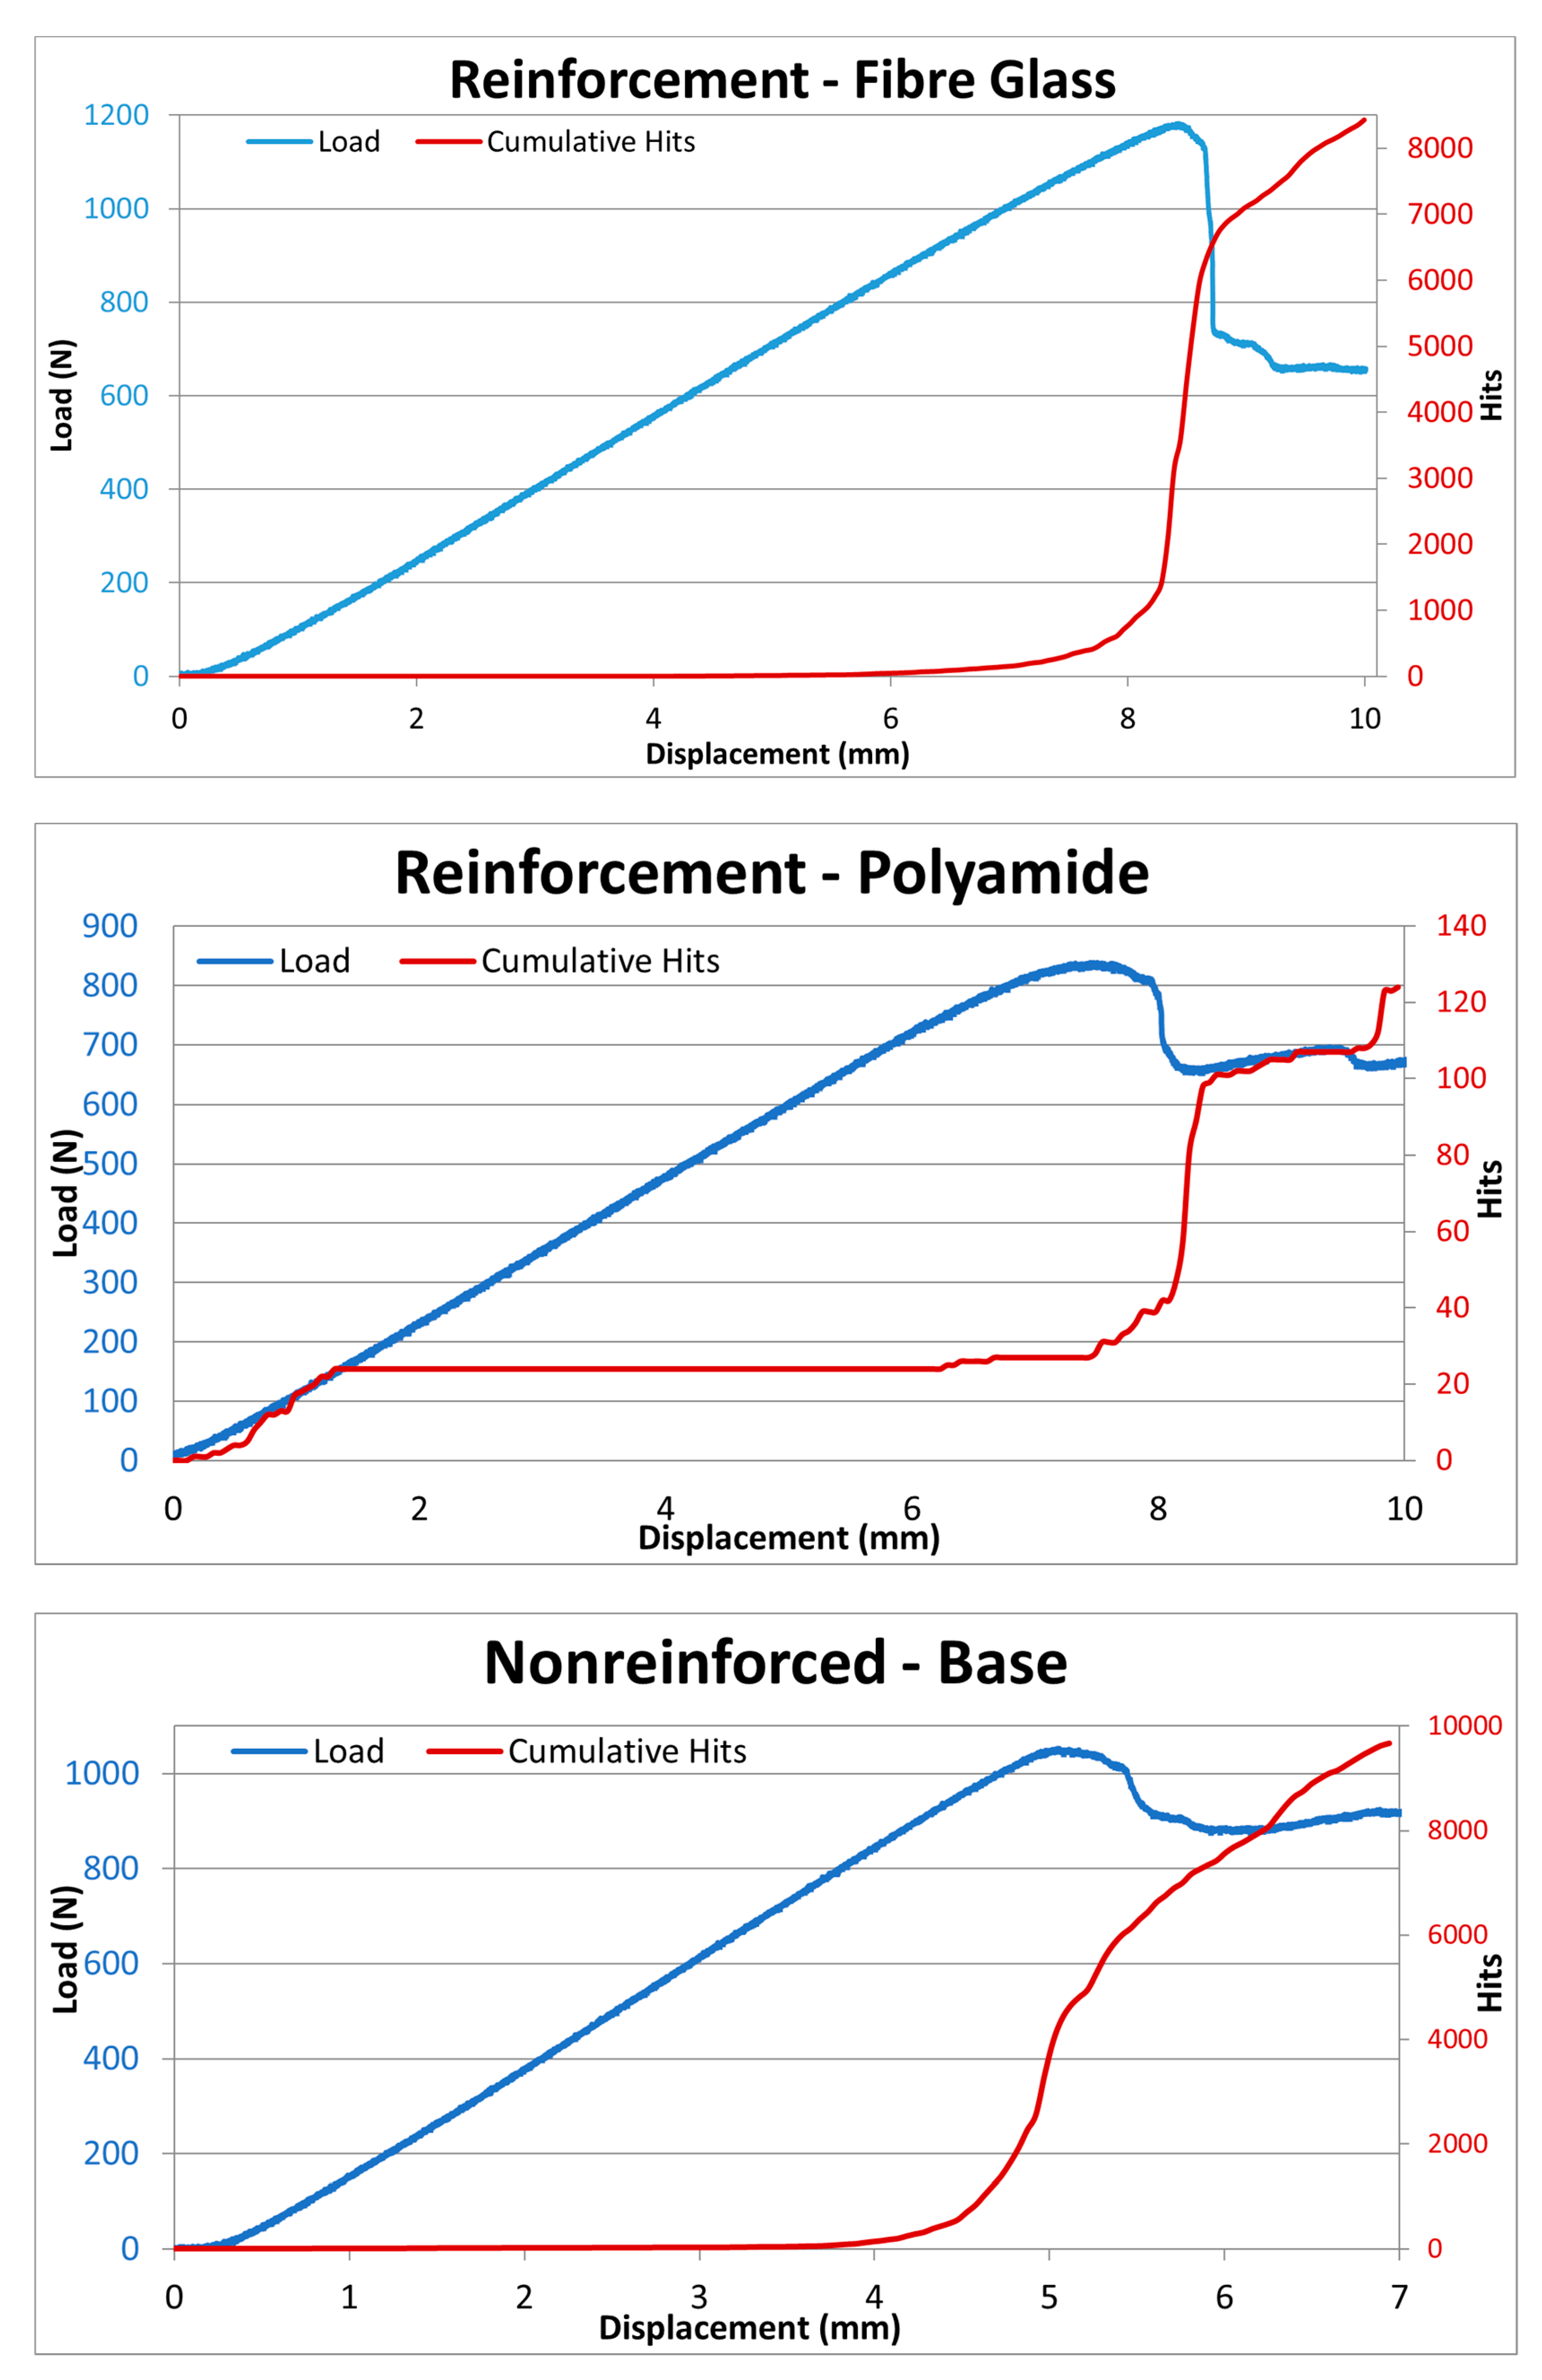
The evaluation of AE signal behavior during the delamination mode II tests showed the relevance of six AE features: amplitude, duration, energy, cumulative energy, number of hits, and cumulative number of hits. In Figure 8, a delamination mode II test showed a combined effect of loading, displacement, and AE hits for all tested conditions. It can be observed that there was no significant number of hits prior to 4 mm of displacement, few hits after 4 mm and 7 mm of displacement, and an increase in hits as from 7 mm, with the number of hits peaking between 8 and 9 mm. This peak (1057 hits/s) coincided with the maximum loading at 1180 N. The number of hits also followed the trend of material failure with a decrease in loading. These three phases or regions were also reported by other authors [49]. The relationship between AE hits in stage II may be a result of micro-cracks, with the advance in stage III being due to a coalescence of these micro-cracks and specimen failure [50]. Comparing the peak number of hits for base and polyamide-reinforced samples showed that the peak number of hits for these was generally lower than for fibre glass reinforced samples (ranging from 1057 hits/s to 1156 hits/s). Base nonreinforced samples ranged from 976 hits/s to 1066 hits/s while peak numbers of hits for polyamide-reinforced samples lied between 718 hits/s and 835 hits/s. Observing this feature of AE makes it possible to monitor material behavior and conclude that the peak number of hits indicates a relationship between the behavior of AE signals and the maximum loading of the material.
The relationship between the number of AE hits and loading during the test becomes clearer in Figure 9, where cumulative hits are seen to vary inversely with loading in the final stages. Material micro-cracking emissions started at 4 mm with a low number of AE hits. It seems that the coalescence of micro-cracks near 6 mm changed significantly the number of cumulative hits and created an upward concavity, with a peak in the number of hits coinciding with the maximum material resistance in a slope. Finally, material failure generated a lower number of AE hits, causing the trend in cumulative hits to change, becoming opposite to the trend in loading. After material resistance peaked and failure subsequently ensued, most of the loading energy release was released. The remaining energy released was found to be linked to lower material resistance.
Similarly, AE duration was used as a parameter for the evaluation of delamination mode II tests using a fibre glass reinforced specimen (Figure 10). AE duration (in μs) is generally perceived to increase with higher levels of loading, generating cracks, fiber breakage, and delamination [51,52]. The average values of peak AE duration for each of the samples for the different types of reinforcement were 839.967 μs for fibre glass, 647.570 μs for base (nonreinforced), and 107.707 μs for polyamide. The AE duration peaks show that materials with higher maximum loads also went through higher AE durations, suggesting a dependence on material resistance. Considering that critical loading is the main cause of catastrophic failure by delamination, the elastic wave released in this moment is characterized by a long AE duration [53]. Thus, it seems reasonable to assume that material with higher resistance generates waves with longer duration, thanks to higher levels of energy release.
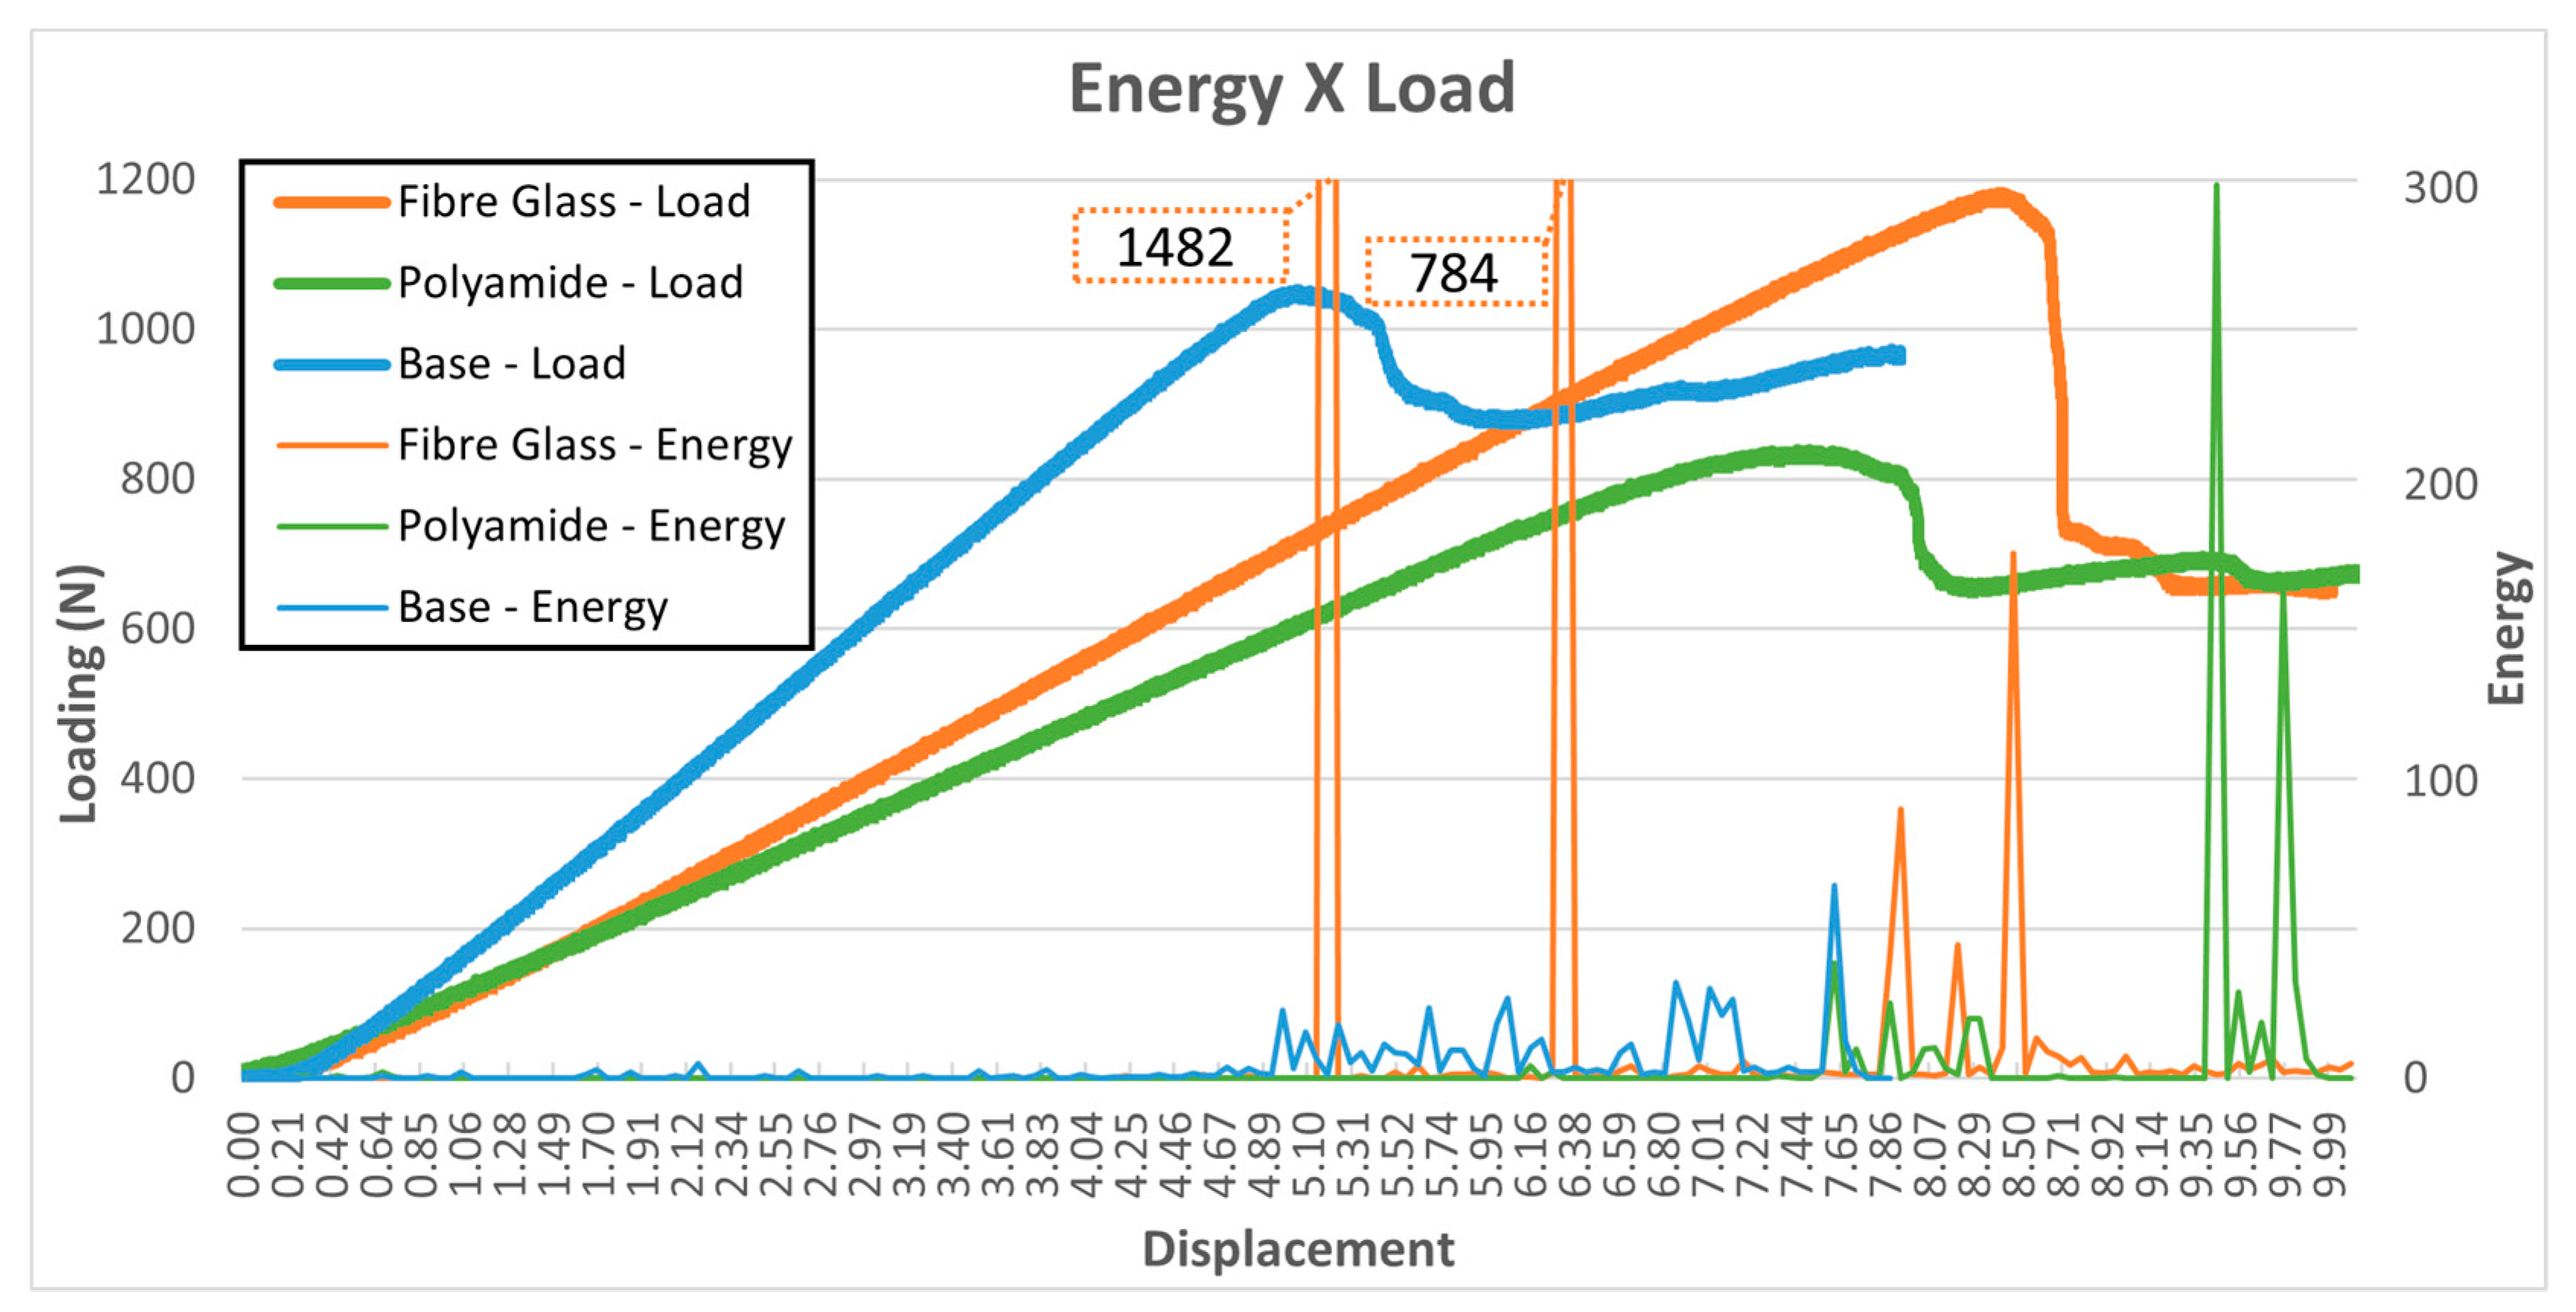
AE energy represents the elastic wave energy released in an event, and its investigation helps in predicting material failure, since energy release tends to increase preceding failure [54,55]. The elastic wave energy of an event is related to the damage mechanism: low AE energy values are related to events in the composite matrix, while high AE energy release is related to the fibers (fiber pullout and breakage), and intermediary AE energy values relate to damage events in the mixed fiber and matrix phases [56,57]. Results of the delamination mode II testing regarding load, displacement, and AE energy are shown in Figure 11, with fibre glass reinforced samples showing events with higher AE energy, while polyamide-reinforced and base samples had similar levels of cumulative energy. The AE energy in fibre glass reinforced samples peaked before maximum loading was reached, with a prior high release just before maximum loading. The polyamide-reinforced sample registered lower levels of AE energy, the highest value of AE energy being after maximum loading but preceding the failure after recovering loading resistance (near 9.4 mm of displacement). The nonreinforced base sample showed lower average signals of AE energy, with an increase right before maximum loading, and a general increase of AE energy between maximum loading and catastrophic failure. In the base specimen, this phase coincided with larger crack propagation due to higher AE energy events [33]. Analysis of the cumulative AE energy showed that fibre glass reinforced samples had an average of 3000 energy units, with polyamide-reinforced samples and base nonreinforced samples having a similar cumulative energy range from 550 energy units to 700 energy units. As a result, polyamide-reinforced and base samples showed similar levels of total energy with different AE energy behavior during the tests. These results are in accordance with the existing literature, in which events characterized by low energy values are linked to incidents happening within the matrix, whereas elevated energy values can be attributed to occurrences in the fibers. The majority of signals observed in the later stages of the mechanical tests are likely indicative of damage and the complete rupture of the fibers. Thus, the results show that AE energy is related to material strength and the differences observed during the test are due to differences in material structure and reinforcement.
Analysis of the AE amplitude behavior during mechanical tests indicates that the signal and damage are related. Some studies established the relationship between the range of amplitude and the type of damage caused during testing. The AE amplitude range varied from one study to another but followed a trend: lower decibels of AE amplitude, for instance, were shown to be related to matrix micro-cracking and/or friction, while intermediate decibels (dB) of AE amplitudes were seen when debonding and decohesion occurred, and high dB were the result of fiber breakage [33,47,48]. The difference between AE amplitude ranges may be a result of variations in material composition, processing, equipment, and ultimately testing procedures [58].
Figure 12 shows how amplitude and load are related though displacement for three different specimens, each with a condition of reinforcement. The analysis of polyamide-reinforced sample loading differs from that of fibre glass reinforced and base nonreinforced material, with dB producing higher AE amplitudes and intermittent recordings. The higher dB may be a result of different crack modes, and the polyamide-reinforced specimen recovered partially the loading capacity (below maximum load) between 8 mm and 9.4 mm, with subsequently high dB levels and catastrophic failure. The base and polyamide-reinforced samples had initial signals of AE amplitude, with amplitude of ≤60 dB, the main cause being friction in early stages. Before reaching 4 mm of displacement, the base sample initiated continuous AE amplitude emission, similar to fibre glass reinforced samples, in which this behavior started at a later stage, around 5.8 mm displacement. This continuous emission of lower dB AE amplitudes suggests a uniform process coalescence of micro-cracking, with both samples having AE amplitude lower than 70 dB. AE signals are related to material damage; the signal characteristic accuracy varies with identified damage, testing method, and material [45,59]. Thus, the subsequent fractography analysis here was essential for verifying the relationship between acoustic emission signal characteristics and testing response variables to clarify failure modes.

3.2. Fractographic Analysis

Fractography serves as a complementary analysis to the mechanical characterization of composites and provides a valuable contribution to the optimization of material processing. In order to achieve superior mechanical performance in composites, a strong interfacial adhesion between the fiber and matrix is necessary. When thermoplastic and thermoset composites are mechanically loaded, the matrix undergoes deformation, generating stresses at the fiber surface, which can result in interfacial stresses. The difference between the elastic properties of the fiber and polymeric matrix primarily causes these stresses [33,60,61].
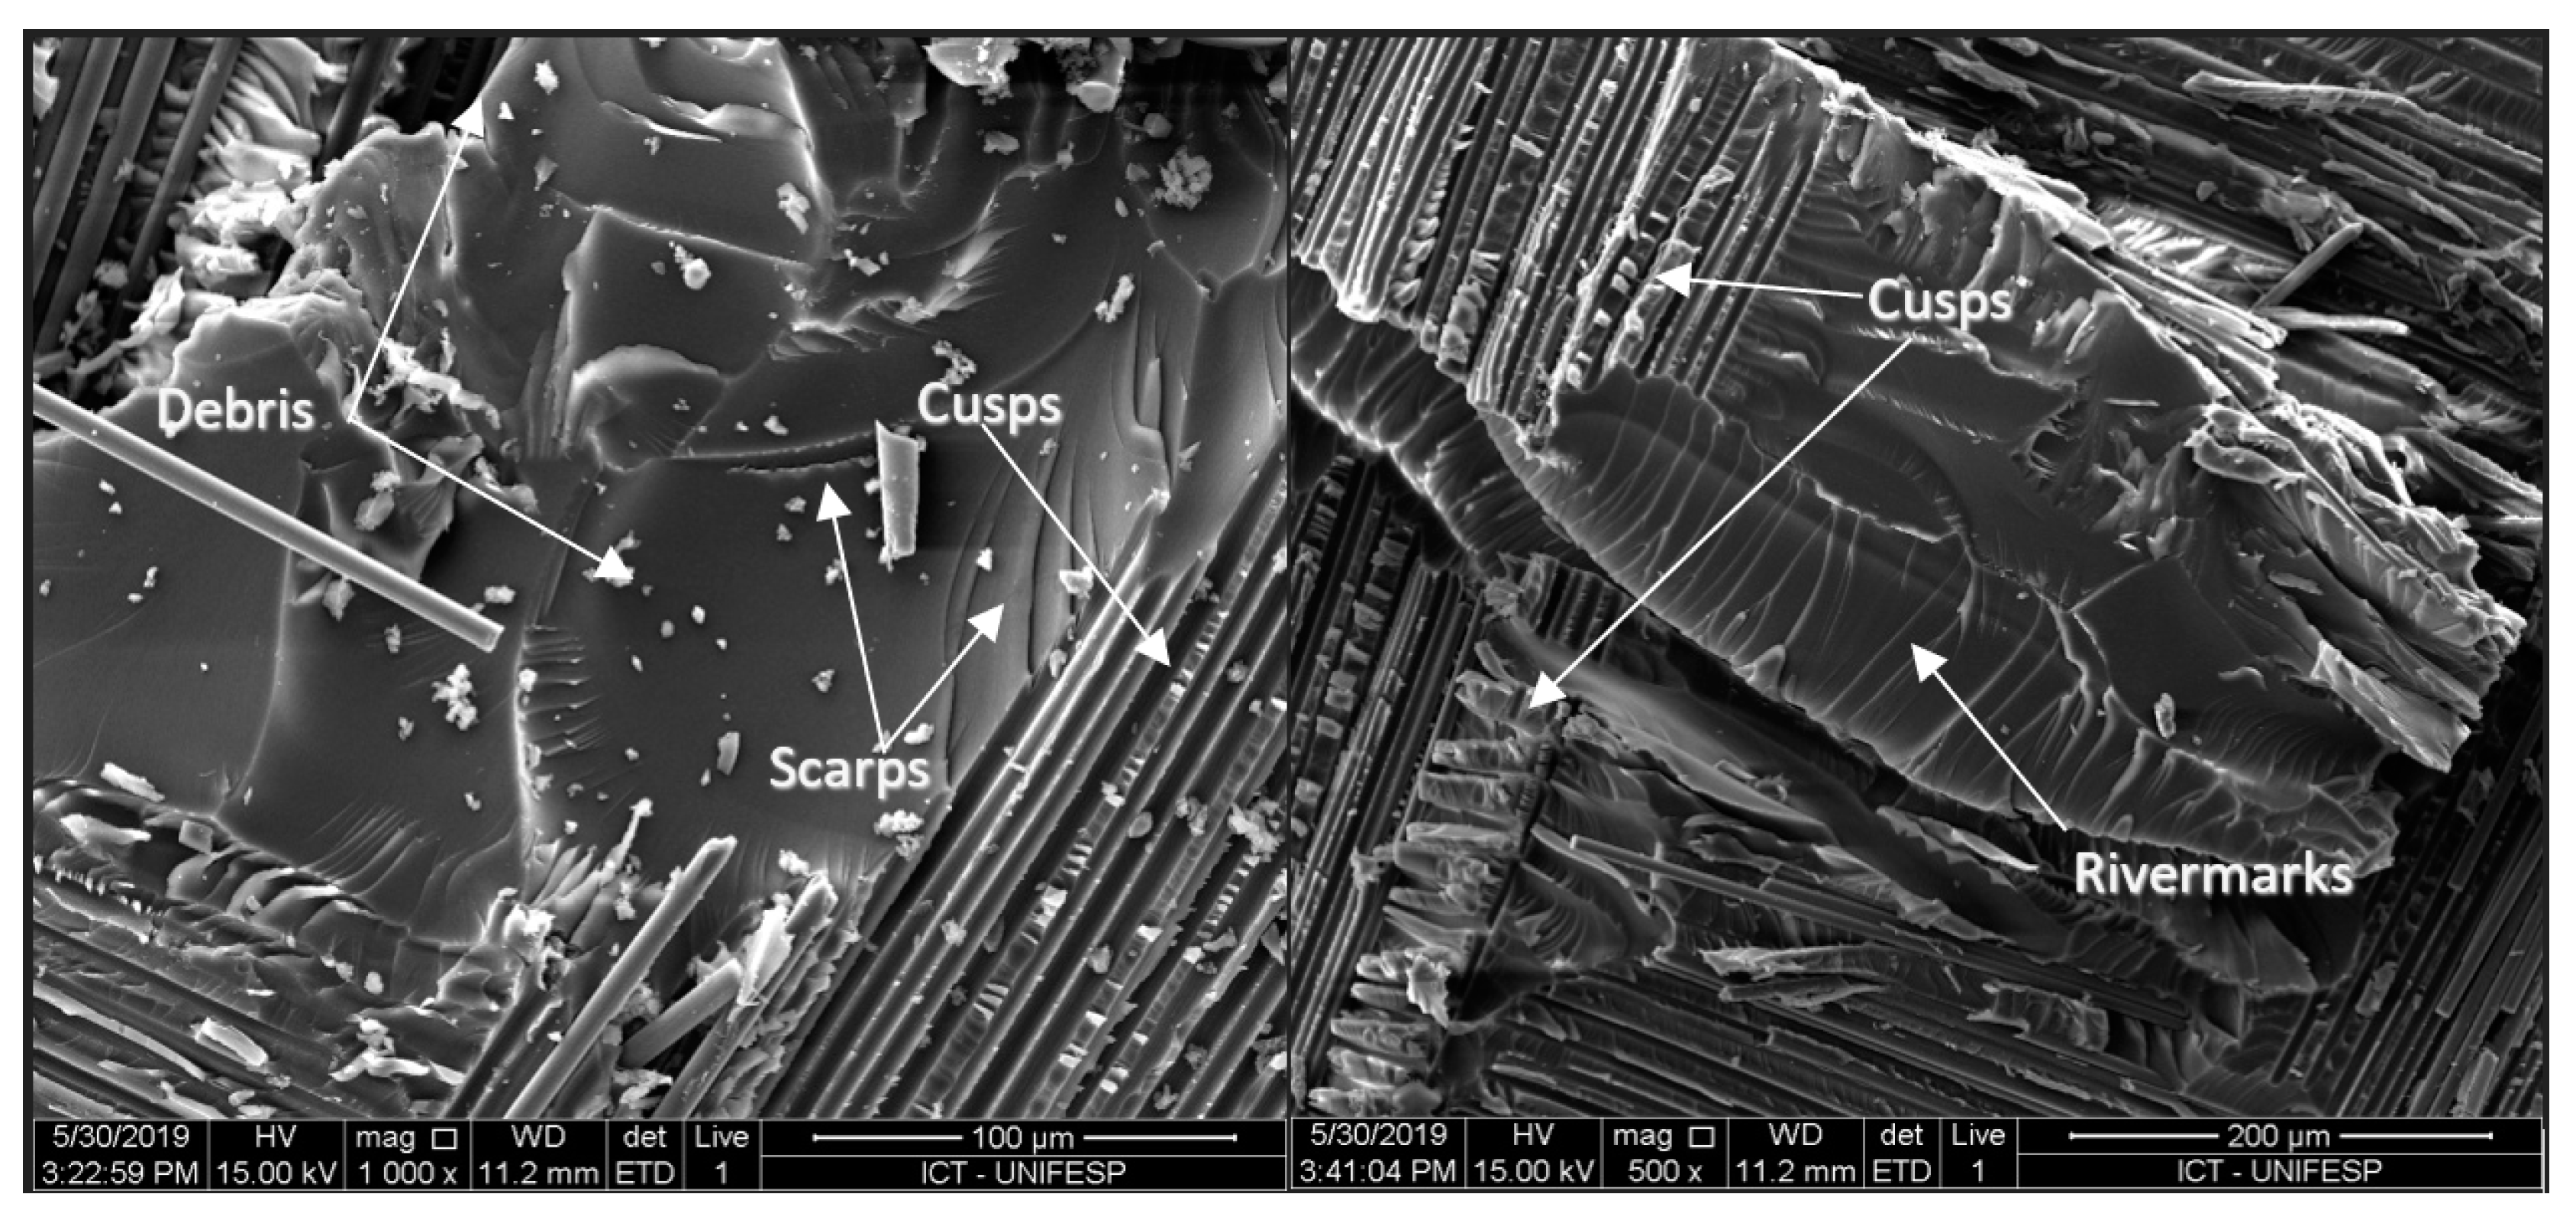
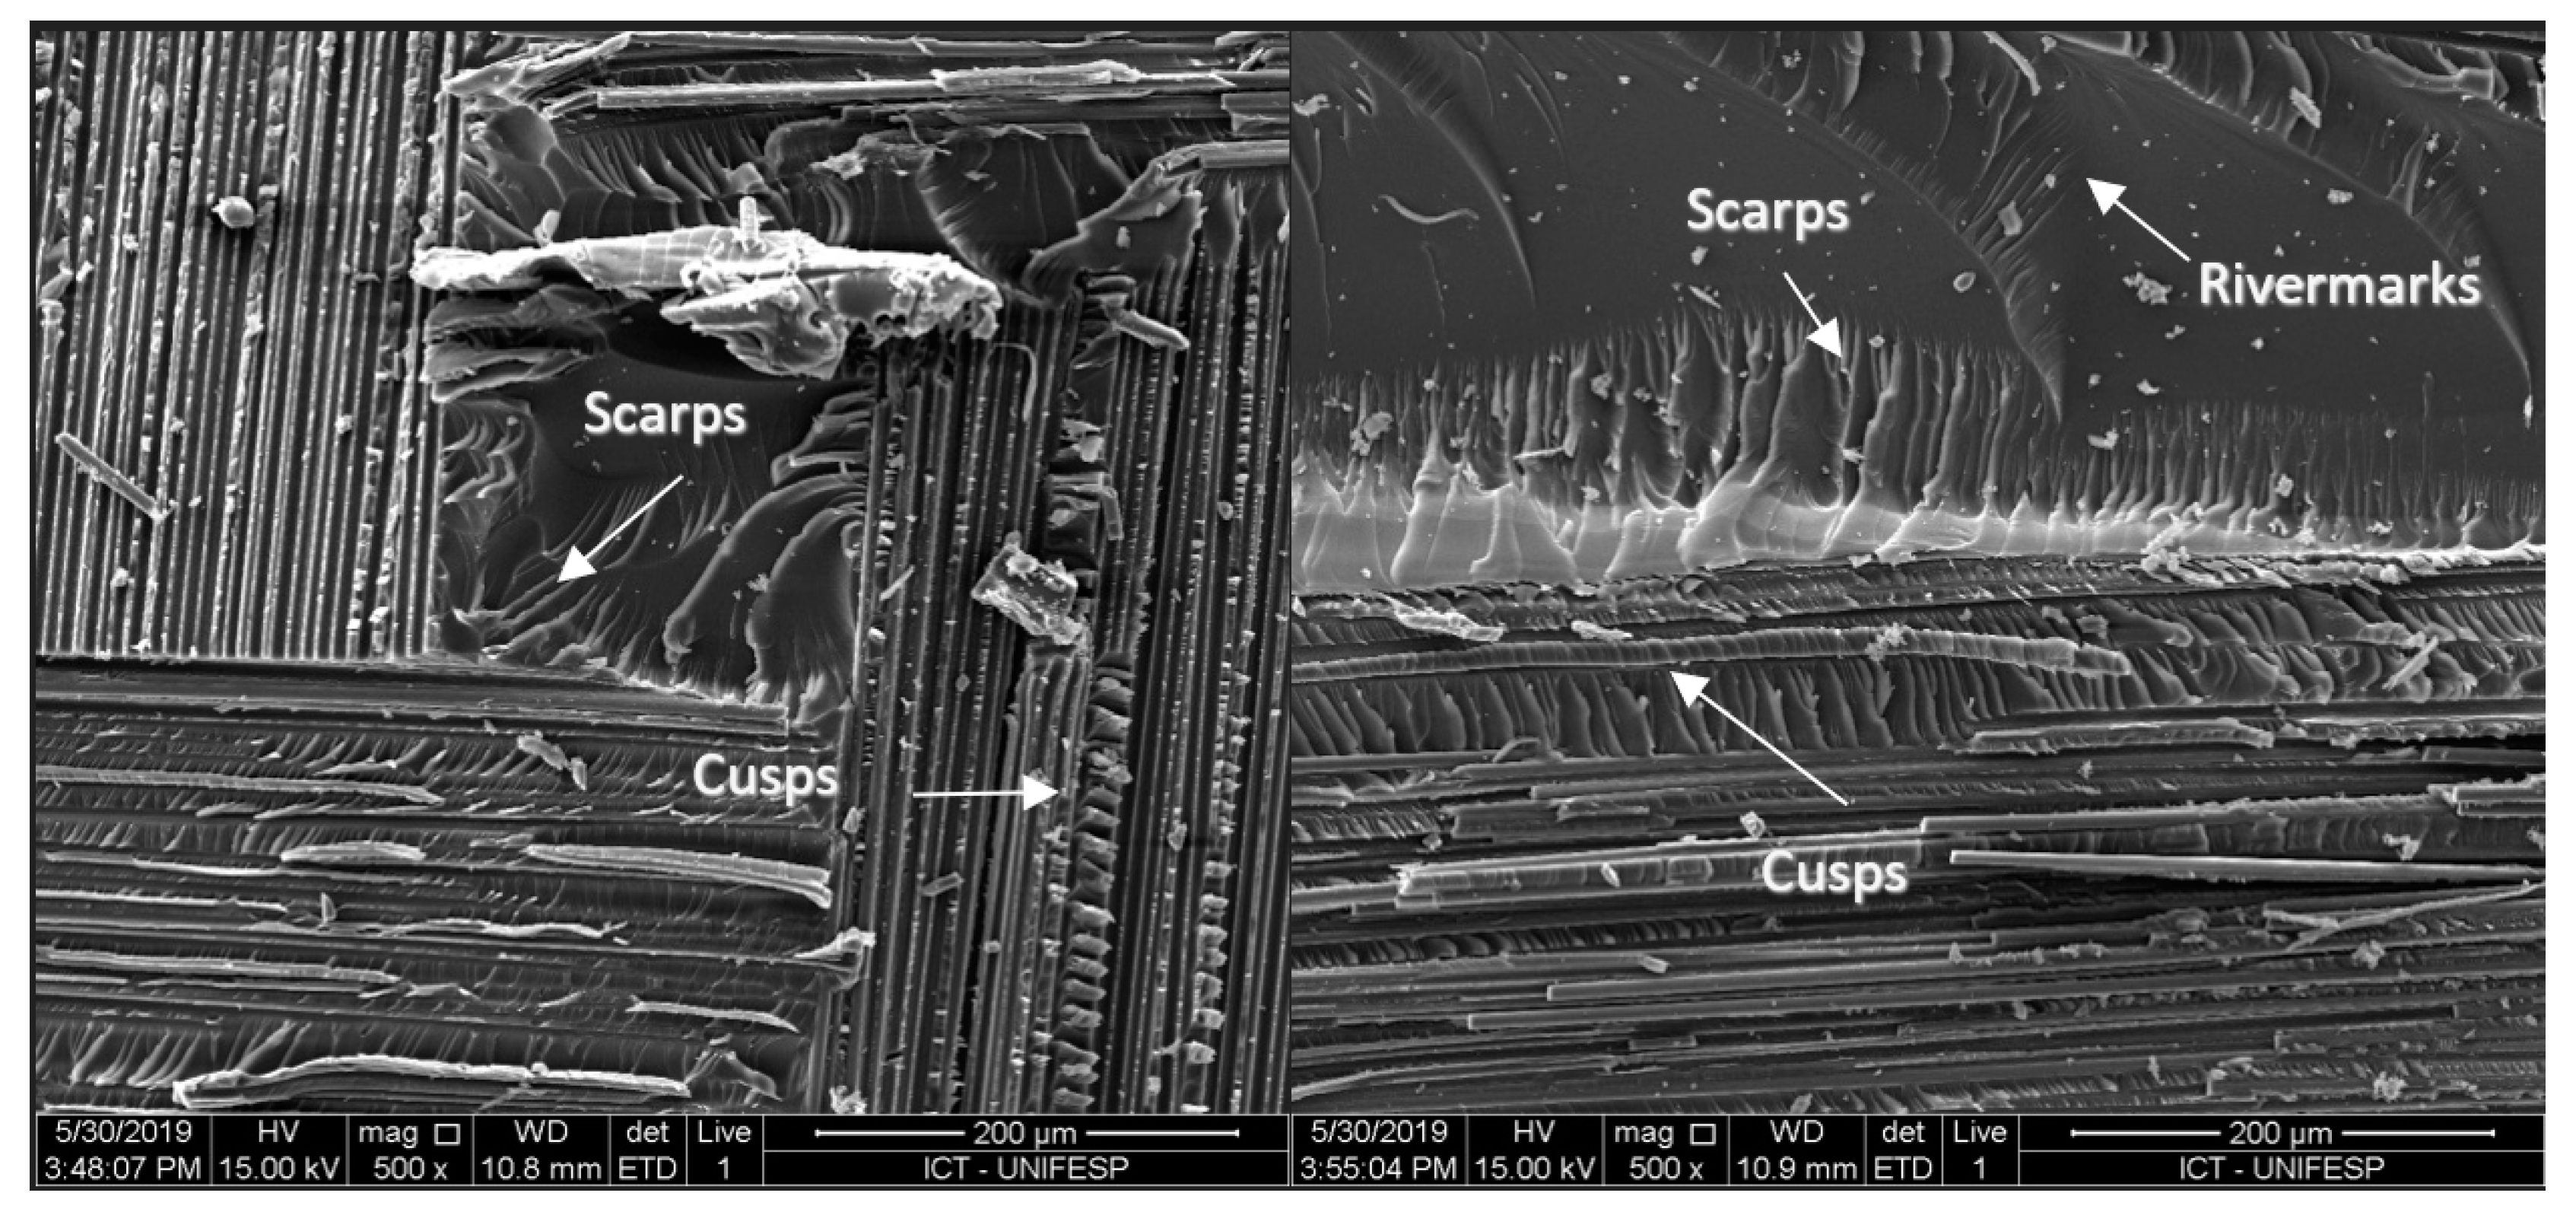
Representative fracture surfaces of the CFRP with and without 3D reinforcement specimens are shown in Figure 13, Figure 14 and Figure 15. Note that the fracture surfaces are rich in fractographic aspects with the presence of typical aspects representative of shear failures mainly located at the matrix-rich regions. Fragile morphology was observed in the fracture of all composite dispositions, primarily due to the debonding of the carbon fibers from the matrix. This aspect can be confirmed by the presence of clean fiber tracks in the matrix-dominated face of the fracture surfaces.
In general, the fractographic aspects observed in laminates with an orientation of 0°/90° are caused by the polymer matrix and are present in both materials, such as river lines and scarps. River line marks are created by several pairs of uneven crack planes that converge into a single crack plane during the process of failure propagation. The direction of crack growth is indicated by the converging aspect of the river line marks towards the scarps. Shear cusps can also be observed, which are inclined platelets developed in the spaces between fibers. This aspect arises because the applied loads on the fiber surface during the ENF test generate interlaminar shear at the fiber/matrix interface. The dimensions and distribution of these fractographic aspects are influenced by the matrix volume and distance between fibers, which are parameters determined during the composite material consolidation stage. Additionally, the inclination of the cusps indicates the direction of failure propagation, with leftward inclination indicating movement from left to right [62,63].
It is also possible to identify fractographic aspects that suggest shell shape presence, which originates from cusps’ separation on the opposite face of the fracture surface. The presence of this aspect, as it is consistently observed in shear failures, does not yield much information about the origin and failure direction. Figure 13, Figure 14 and Figure 15 reveal a cohesive fracture of the polymeric matrix and ruptured fibers, indicating good fiber/matrix interfacial adhesion. This suggests that the failure propagated near the fiber/matrix interface, as evidenced by the presence of fiber imprinting on the fracture surface [33].
We also noted a fragile fracture aspect characterized by the matrix abrasion region. According to Purslow (1987), these aspects are attributed to the cleavage of the matrix caused by high loading rates and relative counter movements of surfaces [33]. Another aspect observed in the fractographic analysis was related to features such as river line marks. River line marks are formed by several pairs of unequal crack planes that converge into a single crack plane during failure propagation. The aspect of scarps is formed in the direction of crack growth, where the river line marks converge [33].
Although all composite types presented a higher resistance to crack propagation and despite the fractographic aspects being found to be representative of pure shear, it was possible to verify by acoustic emission analysis that there were some differences between these materials’ mechanical results. These differences can be linked to differences in 3D reinforcement types. Regarding Figure 16, it is possible to notice that the fibre glass 3D reinforcement was composed of several microfibers. These microfibers had the function of attenuating the applied stresses and had good interfacial adhesion with the matrix, allowing a uniform distribution of stresses for the composite. On the other hand, for the composites reinforced with polyamide, the tow interrupted the orientation of the fibers and acted as a stress concentrator in the material structure, diminishing the integrity of the composite and the distribution of mechanical stresses. In addition, as it was a thermoplastic polymer, the poor adhesion with the thermoset matrix also favored the weakening of this material.

4. Discussion

The outcomes of mechanical tests demonstrated the significant impact of tufting on out-of-plane resistance, as depicted in Figure 7, where average load and displacement values from ENF tests for different material configurations, including PC tests with three replicas, are presented. The focus on PC analyses stemmed from crack propagation occurring mainly within the matrix-rich region of the NPC phase. PC tests were specifically chosen to generate delamination and assess forces required to rupture the through-thickness reinforcements. Comparing samples reinforced with fibre glass and polyamide filament, and nonreinforced samples, it was possible to observe that fibre glass reinforced and nonreinforced samples had higher maximum loads than polyamide-reinforced ones. Tufting with fibre glass threads led to higher displacement compared to polyamide-reinforced and nonreinforced samples, recording 57% and 43% more displacement, respectively. The observed lower load results in polyamide-reinforced samples could be attributed to the weak interface with the thermoset resin and poor impregnation around the tufts, resulting in composite embrittlement. These differences in 3D reinforcements significantly influence composite behavior, a fact corroborated by various authors.
Furthermore, the analysis of AE signals in delamination mode II tests revealed the relevance of six AE features: amplitude, duration, energy, cumulative energy, number of hits, and cumulative number of hits. Figure 8 illustrates this relationship, highlighting the synchronization of loading, displacement, and the AE feature hits. The presence of hits, particularly around 8–9 mm displacement, coincided with the material’s maximum loading, emphasizing the correlation between AE hits and the material’s failure stages. The cumulative hits diagram exhibited an inverse relationship with loading, with micro-cracking emissions initiating at 4 mm and intensifying near 6 mm, suggesting a significant change in cumulative hits’ behavior. Acoustic emission duration, depicted in Figure 10, showed an increase with higher loading levels, indicating cracks, fiber breakage, and delamination. Higher duration values were associated with materials exhibiting higher resistance, emphasizing the relationship between AE duration and material strength. AE energy, depicted in Figure 11, reflected the energy release preceding failure, with fibre glass reinforced samples showing higher AE energy events compared to polyamide-reinforced and base samples. AE amplitude analysis, illustrated in Figure 12, revealed variations among different specimens, with lower dB amplitudes linked to matrix micro-cracking and higher dB values resulting from fiber breakage. The continuous emission of lower dB AE amplitudes indicated uniform micro-crack coalescence. Fractography analysis was crucial to understanding the relationship between AE signal characteristics and failure modes, highlighting the complexity of composite damage characterization during testing.
Regarding fractography, it is shown here how it plays a vital role in the analysis of composite materials, complementing the mechanical performance results. Achieving superior mechanical performance in composites relies on a robust bond between the fiber and matrix. When thermoplastic and thermoset composites undergo mechanical stress, the matrix deforms, generating stresses at the fiber surface, leading to interfacial stresses primarily caused by differences in elastic properties between the fiber and polymer matrix. Fractographic analysis of CFRP specimens, both with and without 3D reinforcement, revealed distinctive features such as shear failures concentrated in matrix-rich regions. As observed in laminates with a 0°/90° orientation, fractographic aspects such as river lines and shear cusps were prominent, indicating the direction of failure propagation and interlaminar shear at the fiber/matrix interface. Additionally, shell-shaped features and matrix abrasion regions suggested specific failure mechanisms. The presence of these aspects, indicative of pure shear, suggested strong fiber/matrix adhesion. Notably, differences in 3D reinforcement types, particularly with fibre glass and polyamide, influence composite behavior. Fiberglass reinforcement, consisting of microfibers, attenuated stresses and maintained uniform stress distribution. In contrast, polyamide reinforcement interrupted fiber orientation, acting as a stress concentrator and weakening the composite integrity due to poor adhesion with the thermoset matrix. These findings, supported by acoustic emission results, highlight the impact of 3D reinforcement on mechanical properties, providing essential insights into composite behavior.

5. Conclusions

In conclusion, the investigation into tufting-reinforced carbon fiber-reinforced polymer (CFRP) composites, with a focus on 3D reinforcements using fiberglass and polyamide threads, has provided valuable insights into the materials’ mechanical performance and damage characteristics. Through a holistic approach encompassing mechanical testing, acoustic emission signal analysis, and fractographic examination, several key findings have emerged:
  • Tufting significantly influenced out-of-plane resistance in composite materials;
  • Fibre glass reinforced and nonreinforced samples exhibited higher maximum loads compared to polyamide-reinforced ones;
  • Tufting with fibre glass threads resulted in higher displacement compared to polyamide-reinforced and nonreinforced samples;
  • Six key AE features (amplitude, duration, energy, cumulative energy, number of hits, cumulative number of hits) played a crucial role in assessing delamination mode II tests;
  • AE hits, particularly around 8–9 mm displacement, coincided with the materials’ maximum loading, emphasizing their correlation with failure stages;
  • Differences in 3D reinforcements, particularly with fibre glass and polyamide, significantly influenced composite behavior;
  • Although the forces needed to start delamination were smaller for the through-thickness reinforced composite, adding 3D reinforcement helped mitigate and slow down crack propagation, especially in fibre glass reinforced samples where higher energy and displacement were required for delamination initiation and crack propagation;
  • Fractographic analysis served to identify main failure morphologies in matrix-rich regions, attributed to failure propagation, including shear cusp aspects representative of pure shear.

Author Contributions

The main manuscript text was authored by T.L.L.O., and the mechanical test was conducted by D.B.B. with assistance from L.C.M.B., D.B.B. and T.L.L.O. collaboratively established the acoustic emission (AE) instrumentation and conducted data analyses. T.L.L.O. undertook the revisions. L.C.M.B. assessed the fractography of the fractured material, while A.C.A.J. provided project supervision. All authors have read and agreed to the published version of the manuscript.

Funding

This study was funded by CAPES and CNPq.

Institutional Review Board Statement

Not applicable.

Informed Consent Statement

Not applicable.

Data Availability Statement

The data that support the findings of this study are available from the corresponding author, Thiago Luiz Lara Oliveira, upon reasonable request.

Acknowledgments

The authors would like to thank The Coordination for the Improvement of Higher Education Personnel (CAPES), the National Council for Scientific and Technological Development (CNPq), The Federal University of Itajubá (UNIFEI) for their financial and structural support as well as to Institut Clement Ader (ICA), Atef Sawalmeh, Neha Dhonoooah for the support.

Conflicts of Interest

The authors have no competing interests as defined by Springer, or other interests that might be perceived to influence the results and/or discussion reported in this paper.

References

  1. Zimmermann, N.; Haowang, P. A review of failure modes and fracture analysis of aircraft composite materials. Eng. Fail. Anal. 2020, 115, 104692. [Google Scholar] [CrossRef]
  2. Narayana, K.J.; Burela, R.G. A review of recent research on multifunctional composite materials and structures with their applications. Mater. Today Proc. 2018, 5, 5580–5590. [Google Scholar] [CrossRef]
  3. Norris, C.; Bond, I.; Trask, R. The role of embedded bioinspired vasculature on damage formation in self-healing carbon fibre reinforced composites. Compos. Part A Appl. Sci. Manuf. 2011, 42, 639–648. [Google Scholar] [CrossRef]
  4. Post, W.; Kersemans, M.; Solodov, I.; Abeele, K.V.D.; García, S.; van der Zwaag, S. Non-destructive monitoring of delamination healing of a CFRP composite with a thermoplastic ionomer interlayer. Compos. Part A 2017, 101, 243–253. [Google Scholar] [CrossRef]
  5. Dell’anno, G.; Treiber, J.W.G.; Partridge, I.K. Manufacturing of composite parts reinforced through-thickness by tufting. Robot. Comput. Integr. Manuf. 2016, 37, 262–272. [Google Scholar] [CrossRef]
  6. Wysmulski, P. The effect of load eccentricity on the compressed CFRP Z-shaped columns in the weak post-critical state. Compos. Struct. 2022, 301, 116184. [Google Scholar] [CrossRef]
  7. Seibert, J.F. Composite Fiber Hazards; Air Force Occupational and Environmental Health Laboratory (AFSC): Brooks Air Force Base, TX, USA, 1990. [Google Scholar]
  8. Yang, Y.; Boom, R.; Irion, B.; Heerden, D.; Kuiper, P.; Wit, H. Recycling of composite materials. Chem. Eng. Process. Process Intensif. 2012, 51, 53–68. [Google Scholar] [CrossRef]
  9. Tatiparthi, A. Investigation of Microcrack Growth in [0/90]s Graphite Epoxy Composite Laminates Using X-ray Microtomography. Master’s Thesis, University of New Orleans, New Orleans, LA, USA, 2004. [Google Scholar]
  10. Fotouhi, M.; Najafabadi, M.A. Acoustic emission-based study to characterize the initiation of delamination in composite materials. J. Thermoplast. Compos. Mater. 2014, 29, 519–537. [Google Scholar] [CrossRef]
  11. Labanieh, A.R.; Legrand, X.; Vladan, K.; Soulat, D. Development in the multiaxis 3D weaving technology. J. Reinf. Plast. Compos. 2013, 32, 700–712. [Google Scholar] [CrossRef]
  12. Ravandi, M.; Teo, W.S.; Tran, L.Q.N.; Yong, M.S.; Tay, T.E. The effects of through-the-thickness stitching on the Mode I interlaminar fracture toughness of flax/epoxy composite laminates. Mater. Des. 2016, 105, 659–669. [Google Scholar] [CrossRef]
  13. Bortoluzzi, D.B. Desenvolvimento de Reforços Tridimensional por Meio de Costura em Compósitos de Fibra de Carbono/Epóxi. Master’s Thesis, Universidade Federal de Itajubá, Itajubá, Brasil, 2017. [Google Scholar]
  14. M’membe, B.; Gannon, S.; Yasaee, M.; Hallett, S.R.; Partridge, I.K. Mode II delamination resistance of composites reinforced with inclined Z-pins. Mater. Des. 2016, 94, 565–572. [Google Scholar] [CrossRef]
  15. Kusaka, T.; Watanabe, K.; Hojo, M.; Fukuoka, T.; Ishibashi, M. Fracture behavior and toughening mechanism in Zanchor reinforced composites under mode II loading. Compos. Sci. Technol. 2009, 69, 2323–2330. [Google Scholar] [CrossRef]
  16. Dell’Anno, G.; Cartié, D.D.; Partridge, I.K.; Rezai, A. Exploring mechanical property balance in tufted carbon fabric/epoxy composites. Compos. Part A Appl. Sci. Manuf. 2007, 38, 2366–2373. [Google Scholar] [CrossRef]
  17. Henao, A.; Carrera, M.; Miravete, A.; Castejón, L. Mechanical performance of through-thickness tufted sandwich structures. Compos. Struct. 2010, 92, 2052–2059. [Google Scholar] [CrossRef]
  18. Hartley, J.W.; Kratz, J.; Ward, C.; Partridge, I.K. Effect of tufting density and loop length on the crushing behaviour of tufted sandwich specimens. Compos. Part B Eng. 2017, 112, 49–56. [Google Scholar] [CrossRef]
  19. Cartié, D.D.R.; Dell’Anno, G.; Poulin, E.; Partridge, I.K. 3D reinforcement of stiffener-to-skin T-joints by Z-pinning and tufting. Eng. Fract. Mech. 2006, 73, 2532–2540. [Google Scholar] [CrossRef]
  20. Mouritz, A.P. Review of z-pinned composite laminates. Compos. Part A Appl. Sci. Manuf. 2007, 38, 2383–2397. [Google Scholar] [CrossRef]
  21. Gnaba, I.; Legrand, X.; Wang, P.; Soulat, D. Literature review of tufted reinforcement for composite. Mater. Sci. Eng. 2017, 254, 042011. [Google Scholar] [CrossRef]
  22. Karbhari, V.M. Introduction: The future of non-destructive evaluation (NDE) and structural health monitoring (SHM). In Non-Destructive Evaluation (NDE) of Polymer Matrix Composites; Woodhead Publishing Limited: Arlington, TX, USA, 2013; Chapter 1; pp. 3–11. [Google Scholar]
  23. Katunin, A.; Dragan, K.; Dziendzikowski, M. Damage identification in aircraft composite structures: A case study using various non-destructive testing techniques. Comp. Struct. 2015, 127, 1–9. [Google Scholar] [CrossRef]
  24. Cantwell, W.J.; Morton, J. The significance of damage and defects and their detection in composite materials: A review. J. Strain Anal. Eng. Des. 1992, 27, 29–42. [Google Scholar] [CrossRef]
  25. Hanhan, I.; Agyei, R.; Xiao, X.; Sangid, M.D. Comparing non-destructive 3D X-ray computed tomography with destructive optical microscopy for microstructural characterization of fiber reinforced composites. Compos. Sci. Technol. 2019, 184, 10. [Google Scholar] [CrossRef]
  26. Rozylo, P. Comparison of Failure for Thin-Walled Composite Columns. Materials 2022, 15, 167. [Google Scholar] [CrossRef] [PubMed]
  27. Bohsea, J.; Brunner, J. 8—Acoustic emission in delamination investigation. In Delamination Behaviour of Composites; Sridharan, S., Ed.; Woodhead Publishing Series in Composites Science and Engineering; Woodhead Publishing: Sawston, UK, 2008; pp. 217–277. [Google Scholar]
  28. Gholizadeh, S. A review of non-destructive testing methods of composite materials. Procedia Struct. Integr. 2016, 1, 50–57. [Google Scholar] [CrossRef]
  29. ASTM 1316; Standard Terminology for Nondestructive Examinations. American Society for Testing and Materials: West Conshohocken, PA, USA, 2023.
  30. Lissek, F.; Haeger, A.; Knoblauch, V.; Hloch, S.; Pude, F.; Kaufeld, M. Acoustic emission for interlaminar toughness testing of CFRP: Evaluation of the crack growth due to burst analysis. Compos. Part B 2018, 136, 55–62. [Google Scholar] [CrossRef]
  31. Tan, X.; Abu-Obeidah, A.; Nassif, H.; Masreddine, W. Measurement and visualization of strains and cracks in CFRP post-tensioned fiber reinforced concrete beams using distributed fiber optic sensors. Autom. Constr. 2021, 124, 103604. [Google Scholar] [CrossRef]
  32. Oliveira, T.L.L.; Zitoune, R.; Ancelotti, A.C., Jr.; Cunha, S.S., Jr. Smart machining: Monitoring of CFRP milling using AE and IR. Compos. Struct. 2020, 249, 112611. [Google Scholar] [CrossRef]
  33. Munoz, V.; Valès, B.; Perrin, M.; Pastor, M.L.; Welemane, H.; Cantarel, A.; Karama, M. Damage detection in CFRP by coupling acoustic emission and infrared thermography. Compos. Part B Eng. 2016, 85, 68–75. [Google Scholar] [CrossRef]
  34. Barile, C.; Casavola, C.; Pappalettera, G.; Vimalathithan, P.K. Damage characterization in composite materials using acoustic emission signal-based and parameter-based data. Compos. Part B 2019, 178, 107469. [Google Scholar] [CrossRef]
  35. Baril, C. Innovative mechanical characterization of CFRP by using acoustic emission technique. Eng. Fract. Mech. 2019, 210, 414–421. [Google Scholar] [CrossRef]
  36. Mohammadi, R.; Saeedifar, M.; Najafabadi, M.; Toudeshky, H.H. Acoustic Emission based Methodology to Evaluate the Fracture Toughness in carbon/epoxy composites. Amirkabir J. Mech. Eng. 2017, 49, 379–386. [Google Scholar]
  37. Carvelli, V.; D’Ettorre, A.; Lomov, S.V. Acoustic emission and damage mode correlation in textile reinforced PPS composites. Compos. Struct. 2017, 163, 399–409. [Google Scholar] [CrossRef]
  38. Martínez-Jequier, J.; Gallego, A.; Suárez, E.; Juanes, F.J.; Valea, Á. Real-time damage mechanisms assessment in CFRP samples via acoustic emission Lamb wave modal analysis. Compos. Part B Eng. 2015, 68, 317–326. [Google Scholar] [CrossRef]
  39. Barbosa, L.C.M.; Bortoluzzi, D.B.; Ancelotti, J.A.C. Analysis of fracture toughness in mode II and fractographic study of composites based on Elium® 150 thermoplastic matrix. Compos. Part B Eng. 2019, 175, 107082. [Google Scholar] [CrossRef]
  40. ASTM D2256-02; Standard Test Method for Tensile Properties of Yarns by the Single-Strand Method. American Society for Testing and Materials: West Conshohocken, PA, USA, 2004.
  41. ASTM D7905:2014; Standard Test Method for Determination of the Mode II Interlaminar Fracture Toughness of Unidirectional Fiber-Reinforced Polymer Matrix Composites. American Society for Testing and Materials: West Conshohocken, PA, USA, 2014.
  42. Cândido, G.M.; Rezende, M.C.; Donadon, M.V.; Almeida, S.F.M. Fractografia de Compósito Estrutural Aeronáutico Submetido ao Ensaio de Tenacidade à Fratura Interlaminar em Modo II. Polímeros Ciência E Tecnol. 2014, 24, 65–71. [Google Scholar] [CrossRef]
  43. Bortoluzzi, D.B.; Gomes, G.F.; Hirayama, G.F.; Ancelotti, A.C. Development of a 3D reinforcement by tufting in carbon fiber/epoxy composites. Int. J. Adv. Manuf. Technol. 2019, 100, 1593–1603. [Google Scholar] [CrossRef]
  44. Osmiani, C.; Mohamed, G.; Treiber, J.W.G.; Allegri, G.; Partridge, I.K. Exploring the influence of micro-structure on the mechanical properties and crack bridging mechanisms of fibrous tufts. Compos. Part A Appl. Sci. Manuf. 2016, 91, 409–419. [Google Scholar] [CrossRef]
  45. Zhang, X.; Khellil, K.; Aboura, Z. Mechanical Behavior of stitched 3D composites. In Proceedings of the 15th European Conference on Composite Materials, Venice, Italy, 24–28 June 2012; pp. 24–28. [Google Scholar]
  46. Bravo, A.; Toubal, L.; Koffi, D.; Erchiqui, F. Characterization of Tensile Damage for a Short Birch Fiber-reinforced Polyethylene Composite with Acoustic Emission. Int. J. Mater. Sci. 2013, 3, 3. [Google Scholar]
  47. El Mahi, A.E.A. Analyse par émission acoustique de l’endommagement des matériaux éco-composites. In Proceedings of the 10ème Congrès Français d’Acoustique, Lyon, France, 12–16 April 2010. [Google Scholar]
  48. Kotsikos, G.; Evans, J.T.; Gibson, A.G.; Hale, J. Use of Acoustic Emission to Characterize Corrosion Fatigue Damage Accumulation in Glass Fiber Reinforced Polyester Laminates. Polym. Compos. 2004, 8, 689–696. [Google Scholar] [CrossRef]
  49. Barile, C.; Casavola, C. Fracture Behavior of Unidirectional Composites Analyzed by Acoustic Emissions Technique. In Fracture, Fatigue, Failure and Damage Evolution, Volume 7: Proceedings of the 2017 Annual Conference on Experimental and Applied Mechanics; Springer: Cham, Switzrland, 2018; pp. 121–128. [Google Scholar]
  50. Daneshjoo, Z.; Shokrieh, M.M.; Fakoor, M.; Alderliesten, R.; Zarouchas, D. Physics of delamination onset in unidirectional composite laminates under mixed-mode I/II loading. Eng. Fract. Mech. 2019, 211, 82–98. [Google Scholar] [CrossRef]
  51. Park, J.Y.; Cho, H.D.; Han, S.H.; Choi, M.Y. Detection of Crack Source Location on RC Structures Strengthened with CFRP Plate for Health Monitoring System. Key Eng. Mater. 2004, 270, 1971–1976. [Google Scholar] [CrossRef]
  52. Roques, A.; Browne, M.; Thompson, J.; Rowland, C.; Taylor, A. Investigation of fatigue crack growth in acrylic bone cement using the acoustic emission technique. Biomaterials 2004, 25, 769–778. [Google Scholar] [CrossRef] [PubMed]
  53. Barile, C.; Casabola, G.; Pappalettera, G. Acoustic emission waveform analysis in CFRP under Mode I test. Eng. Fract. Mech. 2019, 210, 408–413. [Google Scholar] [CrossRef]
  54. Momon, S.; Moevus, M.; Godin, N.; R’mili, M.; Reynaud, P.; Fantozzi, G.; Fayolle, G. Acoustic emission and lifetime prediction during static fatigue tests on ceramic-matrix-composite at high temperature under air. Compos. Part A Appl. Sci. Manuf. 2010, 41, 913–918. [Google Scholar] [CrossRef]
  55. Kang, J.-J.; Xu, B.-S.; Wang, H.-D.; Wang, C.-B.; Zhu, L.-N. Delamination failure monitoring of plasma sprayed composite ceramic coatings in rolling contact by acoustic emission. Eng. Fail. Anal. 2018, 86, 131–141. [Google Scholar] [CrossRef]
  56. Aslan, M. Investigation of damage mechanism of flax fibre LPET commingled composites by acoustic emission. Compos. Part B Eng. 2013, 54, 289–297. [Google Scholar] [CrossRef]
  57. Karger-Kpcis, J.; Czigány, T. Fracture behaviour of glass-fibre mat-reinforced structural nylon RIM composite studied by microscopic and acoustic emission techniques. J. Mater. Sci. 1993, 28, 2438–2448. [Google Scholar] [CrossRef]
  58. Nimdum, P.; Renard, J. Use of acoustic emission to discriminate damage modes in carbon fibre reinforced epoxy laminate during tensile and buckling loading. In Proceedings of the CCM 15—15th European Conference on Composite Material, Venice, Italy, 24–28 June 2012; pp. 8–17. [Google Scholar]
  59. Malolan, V.; Wuriti, G.; Srinivasa Gopal, A.S.; Thomas, T. Comparison of acoustic emission parameters for fiber breakage and de-lamination failure mechanisms in carbon epoxy composites. J. Eng. Technol. Res. 2016, 8, 21–30. [Google Scholar]
  60. Purslow, D. Matrix fractography of fibre-reinforced thermoplastics, part 1. peel failures. Composites 1987, 18, 365–374. [Google Scholar] [CrossRef]
  61. Aggelis, D.G.; Soulioti, D.V.; Sapouridiz, N.M.; Barkoula, A.S.; Paipetis, A.S.; Matikas, T.E. Acoustic emission characterization of the fracture process in fibre reinforced concrete. Constr. Build. Mater. 2011, 25, 4126–4131. [Google Scholar] [CrossRef]
  62. Barbosa, L.C.M. Mechanical characterization of composites based on a novel vacuum-infused thermoplastic matrix. Ph.D. Thesis, Universidade Federal de Itajubá, Itajubá, Brazil, 2020. [Google Scholar]
  63. Greenhalgh, E.S. Failure Analysis and Fractography of Polymer Composites, 1st ed.; Woodhead Publishing Limited: Cambridge, UK, 2009. [Google Scholar]
Figure 1. Schematization of the tufting process.
Ndt 02 00003 g001
Figure 2. Tufting reinforcement device: (1) needle drive, (2) needle, (3) EVA plate; (4) preform; (5) holder bars for fixing preform.
Ndt 02 00003 g002
Figure 3. VARTM process (a) before, (b) during, and (c) after the resin infusion of a tufted preform.
Ndt 02 00003 g003
Figure 4. ENF test fixture and specimen scheme (left) and dimensions (right) [42].
Ndt 02 00003 g004
Figure 5. Specimen in the device before the start of NPC testing.
Ndt 02 00003 g005
Figure 6. Specimen in the device before the start of PC testing.
Ndt 02 00003 g006
Figure 7. Comparison between material reinforcements by maximum loading or displacement for ENF tests.
Ndt 02 00003 g007
Figure 8. Behavior of delamination mode II tests regarding the correlation between loading, displacement, and number of AE hits.
Ndt 02 00003 g008aNdt 02 00003 g008b
Figure 9. The correlation between the cumulative number of hits and loading during the test, showing an inverse relationship as material fracture ensues.
Ndt 02 00003 g009
Figure 10. The trend in AE duration during delamination mode II testing, with the duration peak coinciding with maximum loading at the point of catastrophic failure.
Ndt 02 00003 g010aNdt 02 00003 g010b
Figure 11. Comparison between energy and load values for different material reinforcements, with tufted samples showing higher AE energy waves.
Ndt 02 00003 g011
Figure 12. Relationship between AE amplitude and loading through time during a delamination mode II test.
Ndt 02 00003 g012
Figure 13. SEM of fracture surfaces of CFRP with fibre glass 3D reinforcement.
Ndt 02 00003 g013
Figure 14. SEM of fracture surfaces of CFRP PA with 3D reinforcement.
Ndt 02 00003 g014
Figure 15. SEM of fracture surfaces of CFRP without 3D reinforcement.
Ndt 02 00003 g015
Figure 16. SEM of fracture surfaces of CFRP: (A) fibre glass 3D reinforcement and (B) polyamide 3D reinforcement.
Ndt 02 00003 g016
Table 1. Properties of 3D reinforcement threads.
PropertiesPolyamideFiberglass
Filament specific mass (g/cm3)1.152.54
Ultimate strength (kgf)46.8
Elongation (mm/mm)36.82.8
Tex (g/km)66.8136
Fiber/strands14
Threads/filaments-250
Number of filaments-1000
Thread diameter (mm)0.250.25
Disclaimer/Publisher’s Note: The statements, opinions and data contained in all publications are solely those of the individual author(s) and contributor(s) and not of MDPI and/or the editor(s). MDPI and/or the editor(s) disclaim responsibility for any injury to people or property resulting from any ideas, methods, instructions or products referred to in the content.