Article

Investigation of the Impact of Testing Machine and Control Modes on the Portevin-Le Chatelier Effect in Aluminum Alloy with Diffusible Solute Magnesium

by
Roberto Doglione
1,* and
Francesco Tanucci
2
1
INSTM (National Interuniversity Consortium of Materials Science and Technology), UdR Torino Politecnico, Corso Duca Degli Abruzzi 24, 10129 Torino, Italy
2
Independent Researcher, 63087 Comunanza, AP, Italy
*
Author to whom correspondence should be addressed.
J. Exp. Theor. Anal. 2025, 3(3), 25; https://doi.org/10.3390/jeta3030025
Submission received: 30 April 2025 / Revised: 5 June 2025 / Accepted: 28 August 2025 / Published: 31 August 2025

Abstract

The Portevin-Le Chatelier (PLC) effect has been studied for many decades, yet the influence of testing modes has received limited attention. In the past 20 years, it has become increasingly recognized that the stiffness of the testing machine can significantly affect the occurrence of jerky flow, particularly the serrations observed during tensile tests. This study addresses this issue by conducting tests on the Al-Mg alloy AA5083H111, which contains a substantial amount of diffusible magnesium in solid solution and exhibits dynamic strain aging, resulting in a pronounced PLC effect. Both electromechanical and servohydraulic testing machines were used in the tests; these machines differ in stiffness and control technology for applied strain rates. The study also explored different control modes, including stroke control for both machines and true strain control for the servohydraulic machine. The findings indicate that machine stiffness has a moderate effect on material behavior, and no single machine or testing mode can precisely control the strain rate in the sample during the PLC effect. However, it was noted that true strain rate control using a servohydraulic machine comes closest to accurately reflecting the material’s behavior during jerky flow.

1. Introduction

The Portevin-Le Chatelier (PLC) effect has been the focus of extensive research for many decades. It occurs in a variety of structural engineering materials under specific conditions of temperature, strain rate, and mechanical constraint. This effect primarily influences ferrous and aluminum alloys, which are the most commonly used materials in structural engineering applications. The PLC effect can result in surface defects, typically of a cosmetic nature, during shaping processes, and may lead to a reduction in ductility, such as tensile elongation and fracture toughness in these alloys. These issues are associated with an irregular phenomenon of plastic flow that can cause unpredictable plastic instability. In many cases, the PLC effect is linked to dynamic strain aging in alloys that contain diffusible solutes. These solutes can create Cottrell atmospheres around dislocations, effectively immobilizing them. This paper does not intend to delve into the underlying explanations of the PLC effect, as there is already a significant amount of literature on the subject. Numerous relevant papers can be referenced [1,2,3,4,5,6,7,8,9,10,11,12,13,14,15].
One often-overlooked aspect of the phenomenon is how the degree of mechanical constraint imposed on specimens during tensile tests affects the stability of plastic flow. Some researchers have highlighted the impact of machine stiffness on this phenomenon. For instance, Tong and Zhang [16] conclude that the magnitude of stress drops may not accurately reflect the phenomenon without additional information regarding machine stiffness. The authors in [17] note that the stiffness of the testing machine alters the displacement rate at the moving end of the specimen. While the crosshead speed remains constant, the non-linear behavior of the material can lead to fluctuations in the actual displacement rate experienced by the sample. Yamasaki et al. [18] suggest that both machine stiffness and specimen geometry have a combined effect on the serrated stress-strain curve. They advocate for the use of high-stiffness machines because they exert less influence on specimen strain. Further investigating this issue, Guillermin et al. [19] conducted simulations of stress-strain curves considering the Portevin-Le Chatelier (PLC) effect while varying machine stiffness. Their findings indicate that lower machine stiffness is associated with a lower critical plastic strain for the onset of serrations, a lower frequency of serrations, and a higher amplitude of serrations. Similar results were obtained in the simulations conducted by Luo et al. [20]. Tretyakova and Tretyakov [21] achieved closely aligned experimental results by varying machine stiffness using a specially designed mechanical device.
The exploration of how testing machines influence results is both intriguing and presents new research opportunities, although it has only been examined in a limited number of cases so far. Most published findings on the Portevin-Le Chatelier (PLC) effect have been derived from experiments conducted with electromechanical machines that utilize screw-driven crosshead displacement control at a constant speed. The crosshead speed is set to achieve the desired strain rate in the sample, resulting in an approximately constant (though not exactly) strain rate. However, there is limited published data regarding machine stiffness, which makes it challenging to accurately assess the reliability of the data related to PLC effect serrations. One possible advancement in testing conditions would be the use of servohydraulic machines, but the existing literature only includes a few recent reports on this method (e.g., refs. [16,19,21,22,23,24]). Another approach is to compare results obtained under the same nominal conditions, such as strain rate and specimen geometry, across different types of testing machines, like electromechanical and servohydraulic machines. Unfortunately, examples of such comparisons are even rarer [25,26].
Due to the ongoing uncertainty surrounding the most effective test procedures for examining the mechanical aspects of the Portevin-Le Chatelier (PLC) effect, this study aims to compare various mechanical testing machines and control modes. All specimens analyzed have the same geometry and are tested under identical nominal strain rate conditions. The focus of this investigation is on the Al-Mg system, in which magnesium (Mg) serves as the diffusible solute capable of inducing dynamic strain aging. There is a significant amount of research on the PLC effect in Al-Mg alloys; however, this paper does not intend to review the existing literature. Interested readers can refer to papers [27,28,29,30,31,32,33,34,35,36,37] for insights into the challenges associated with these alloys. Among the range of available alloys, AA5083H111 was chosen for this study. This specific alloy contains approximately 5% Mg by mass and is commonly used in temper H111, resulting in a very soft metal that is suitable for fabrication through plastic deformation. In this context, plastic deformation and its potential instabilities are of considerable interest to the industry.

2. Materials and Methods

Tensile tests were performed on AA 5083 alloy, provided in a 3 mm thick sheet. The chemical composition of this material is outlined in Table 1. This particular aluminum alloy was chosen due to its high magnesium content, which makes the PLC effect more pronounced. The supplied state H111 corresponds to nearly annealed metal with a low dislocation density.
The PLC effect was highlighted by performing tensile tests (minimum 3 samples per type) at room temperature (20 °C) with a strain rate of 10−4 s−1, which are typical conditions for observing this phenomenon. To ensure consistency, tests were conducted using two different machines under the same conditions:
  • MTS 793 series (MTS Systems Corporation, Minneapolis, MN, USA), 100 kN force, servohydraulic, equipped with FlexTest SE Plus electronic system (MTS Systems Corporation, Minneapolis, MN, USA); extensometer for strain measurement is model MTS 634.12F-25 with measuring base (L0) 25 mm.
  • electromechanical MTS Criterion C43 (MTS Systems Corporation, Minneapolis, MN, USA), 50 kN force, equipped with TestSuite TW electronic system (MTS Systems Corporation, Minneapolis, MN, USA); extensometer for strain measurement is model MTS 632.12F-20 with measuring base (L0) 25 mm.
During the tests, signals were collected from three transducers in the equipment: actuator displacement (MTS Flextest SE Plus, MTS Systems Corporation, Minneapolis, MN, USA), crosshead displacement (MTS Criterion, MTS Systems Corporation, Minneapolis, MN, USA), force (load cell), and strain (extensometer). To accurately capture the signals during the load drops associated with the PLC serrations, the data acquisition frequency was set to 20 Hz.
Tension samples were cut from the sheet metal using laser cutting, oriented perpendicular to the rolling direction. The geometry of these samples is shown in Figure 1. It is important to note that, as is standard practice, the measuring base length of the extensometer is 25 mm, while the length of the useful section of the test sample is 40 mm. This difference may impact the testing process, particularly when the machine’s control relies on the signal from the extensometer.
Tension tests were carried out in three different modes:
(a)
using the electromechanical machine, the displacement of the moving crosshead, or stroke control, acts as the control channel to achieve the predetermined strain rate.
(b)
using the servohydraulic machine, the displacement of the hydraulic actuator, or stroke control, serves as the control channel to achieve the predetermined strain rate.
(c)
using a servohydraulic machine, we utilized a virtual true strain channel; this was formulated through an equation using the extensometer signal, which represents the engineering strain, serving as the control channel to achieve the predetermined strain rate.
The tests mentioned earlier were made possible by carefully controlling the modes of action of the control channels, specifically focusing on stroke and true strain controls. To achieve this, it was essential to tune the machines for these conditions. This involved experimentally determining, through preliminary tests in the elastic range, the PIDF (Proportional, Integral, Differential, Feed-forward) gain parameters that optimize the machines’ responses under the specified testing conditions. For each test condition, at least three samples were examined.

3. Results

The summary of the test results is presented in Table 2, which displays the average mechanical properties for each set of samples. The strength characteristics are quite similar across the three different control modes. However, there are noticeable differences in the elongations at break, ranked in increasing order as follows: true strain control, servohydraulic stroke, and electromechanical stroke. There is a certain difference between the standard deviation values: there is greater scatter in true strain control. This suggests that the type of control affects the material’s behavior. Additionally, variations in stress drops are observed, with the following ascending order: servohydraulic stroke, electromechanical stroke, and true strain control.
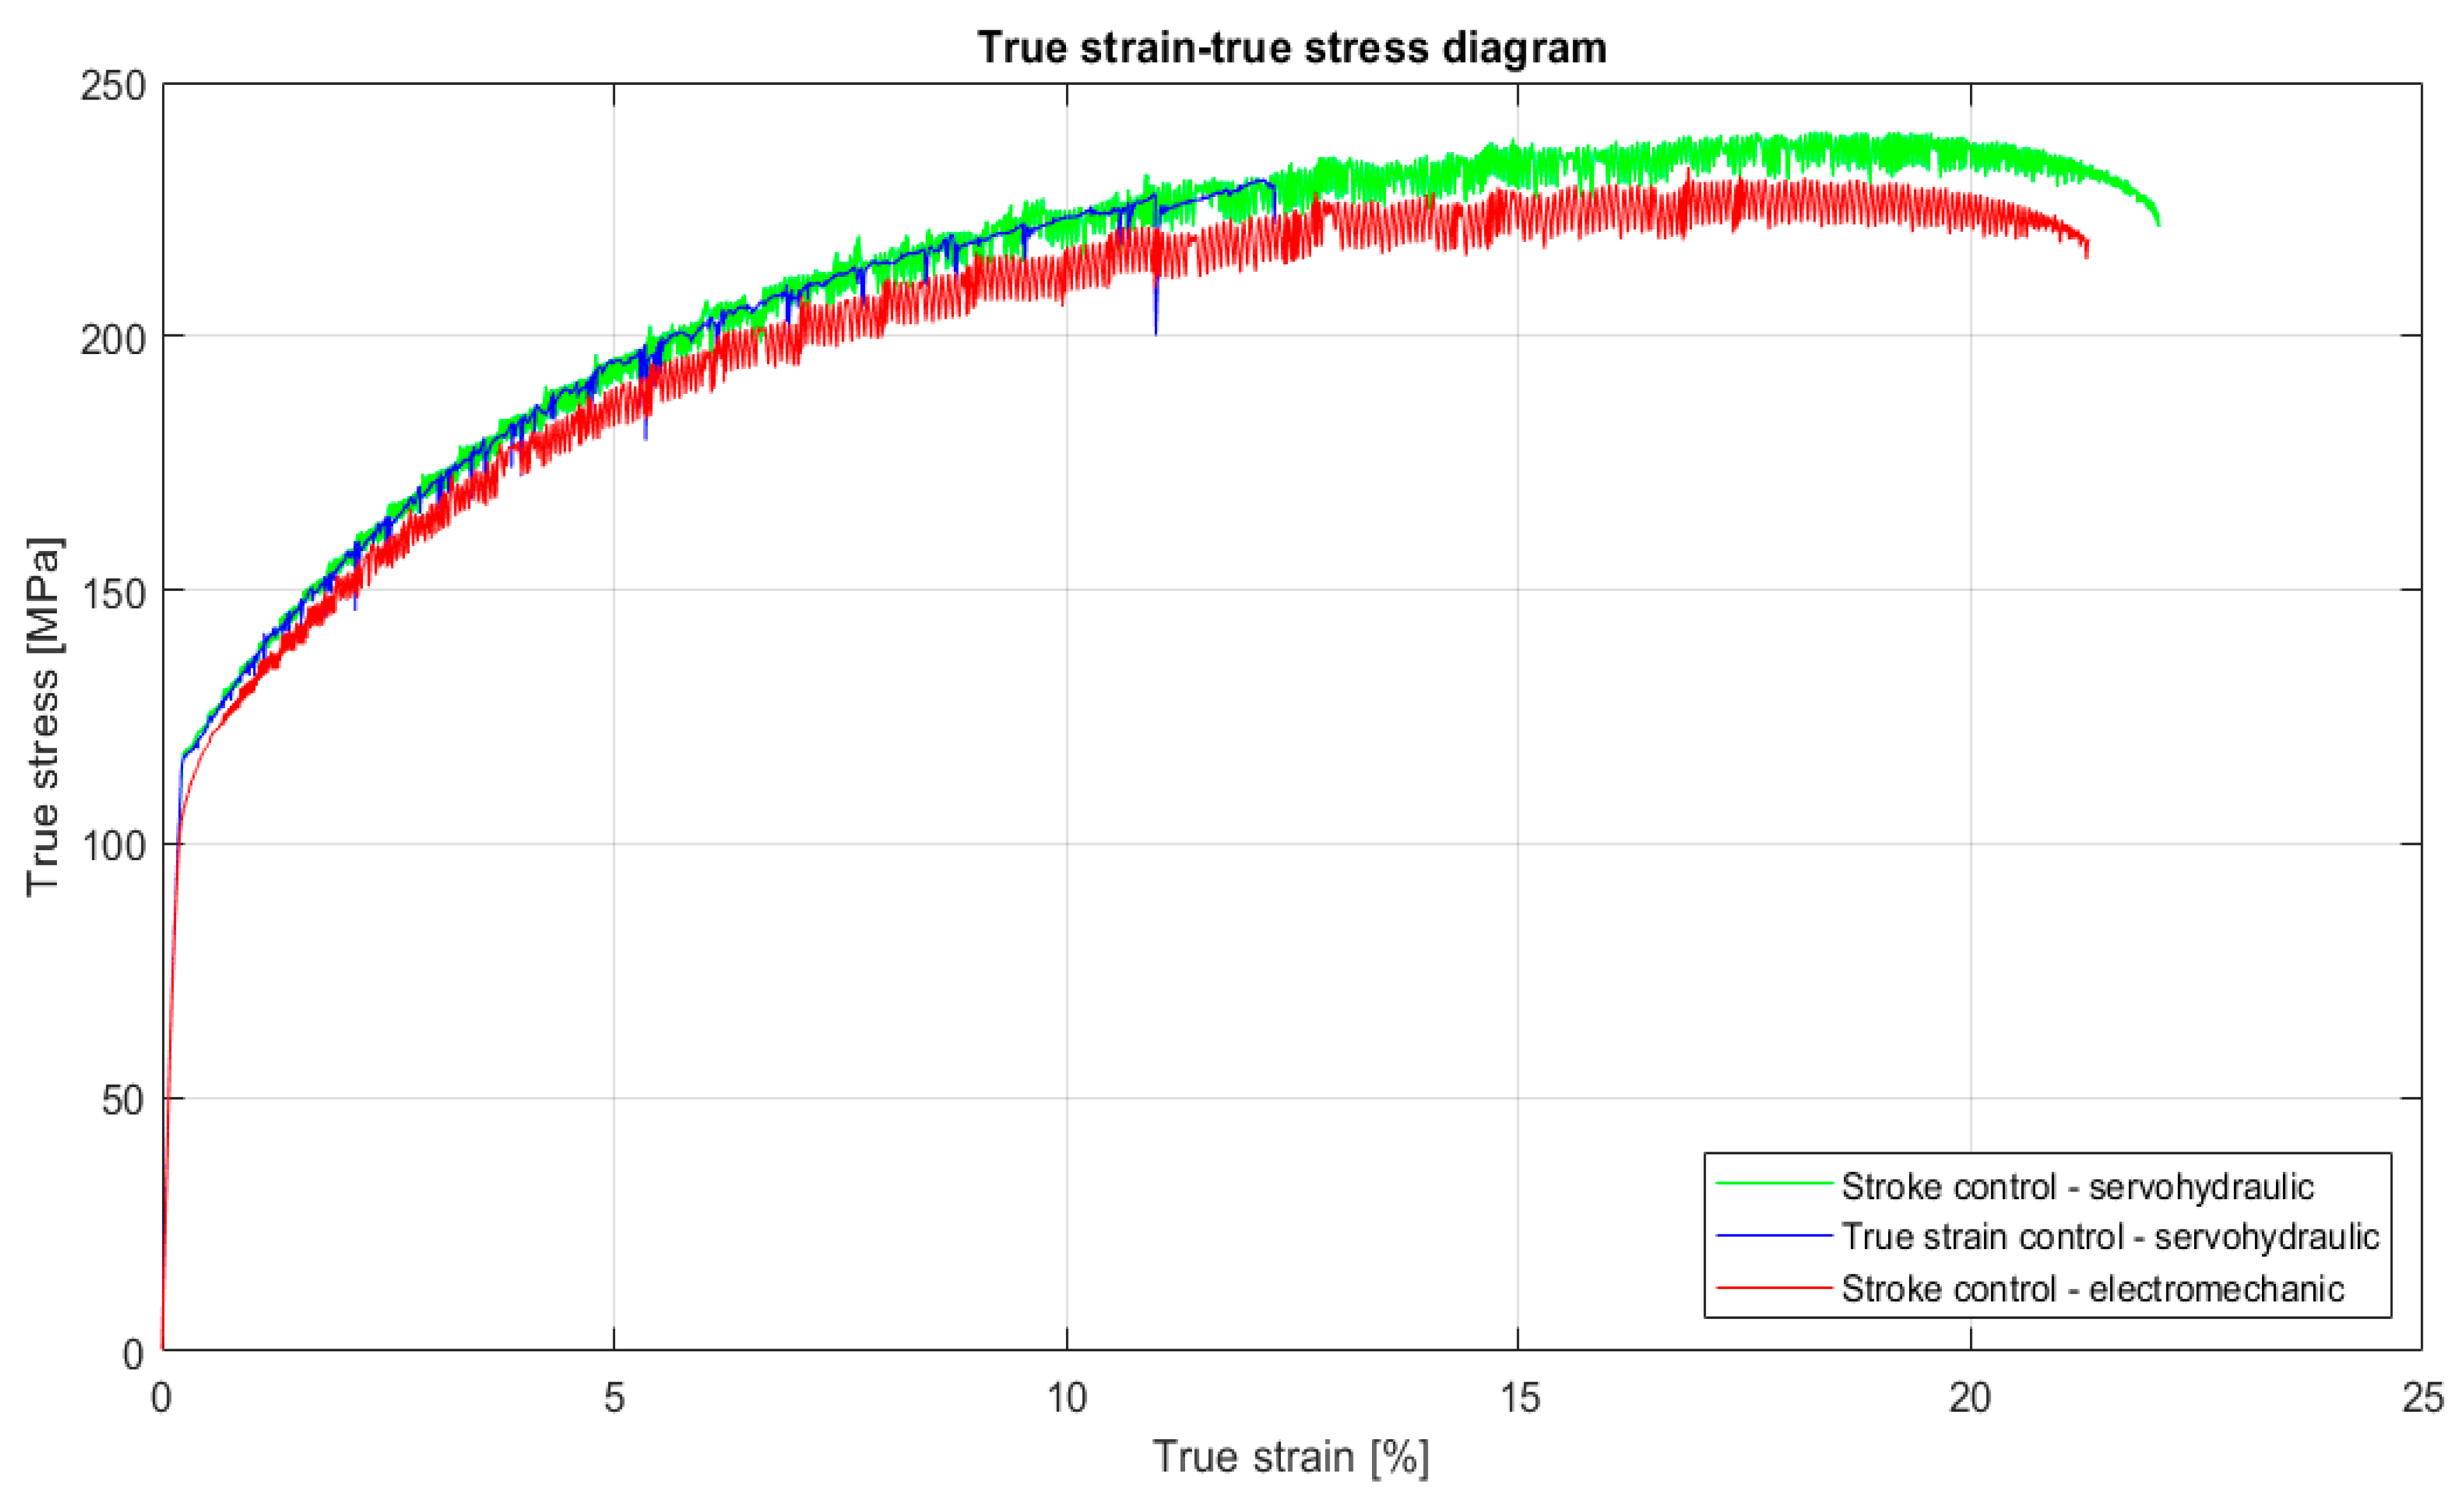
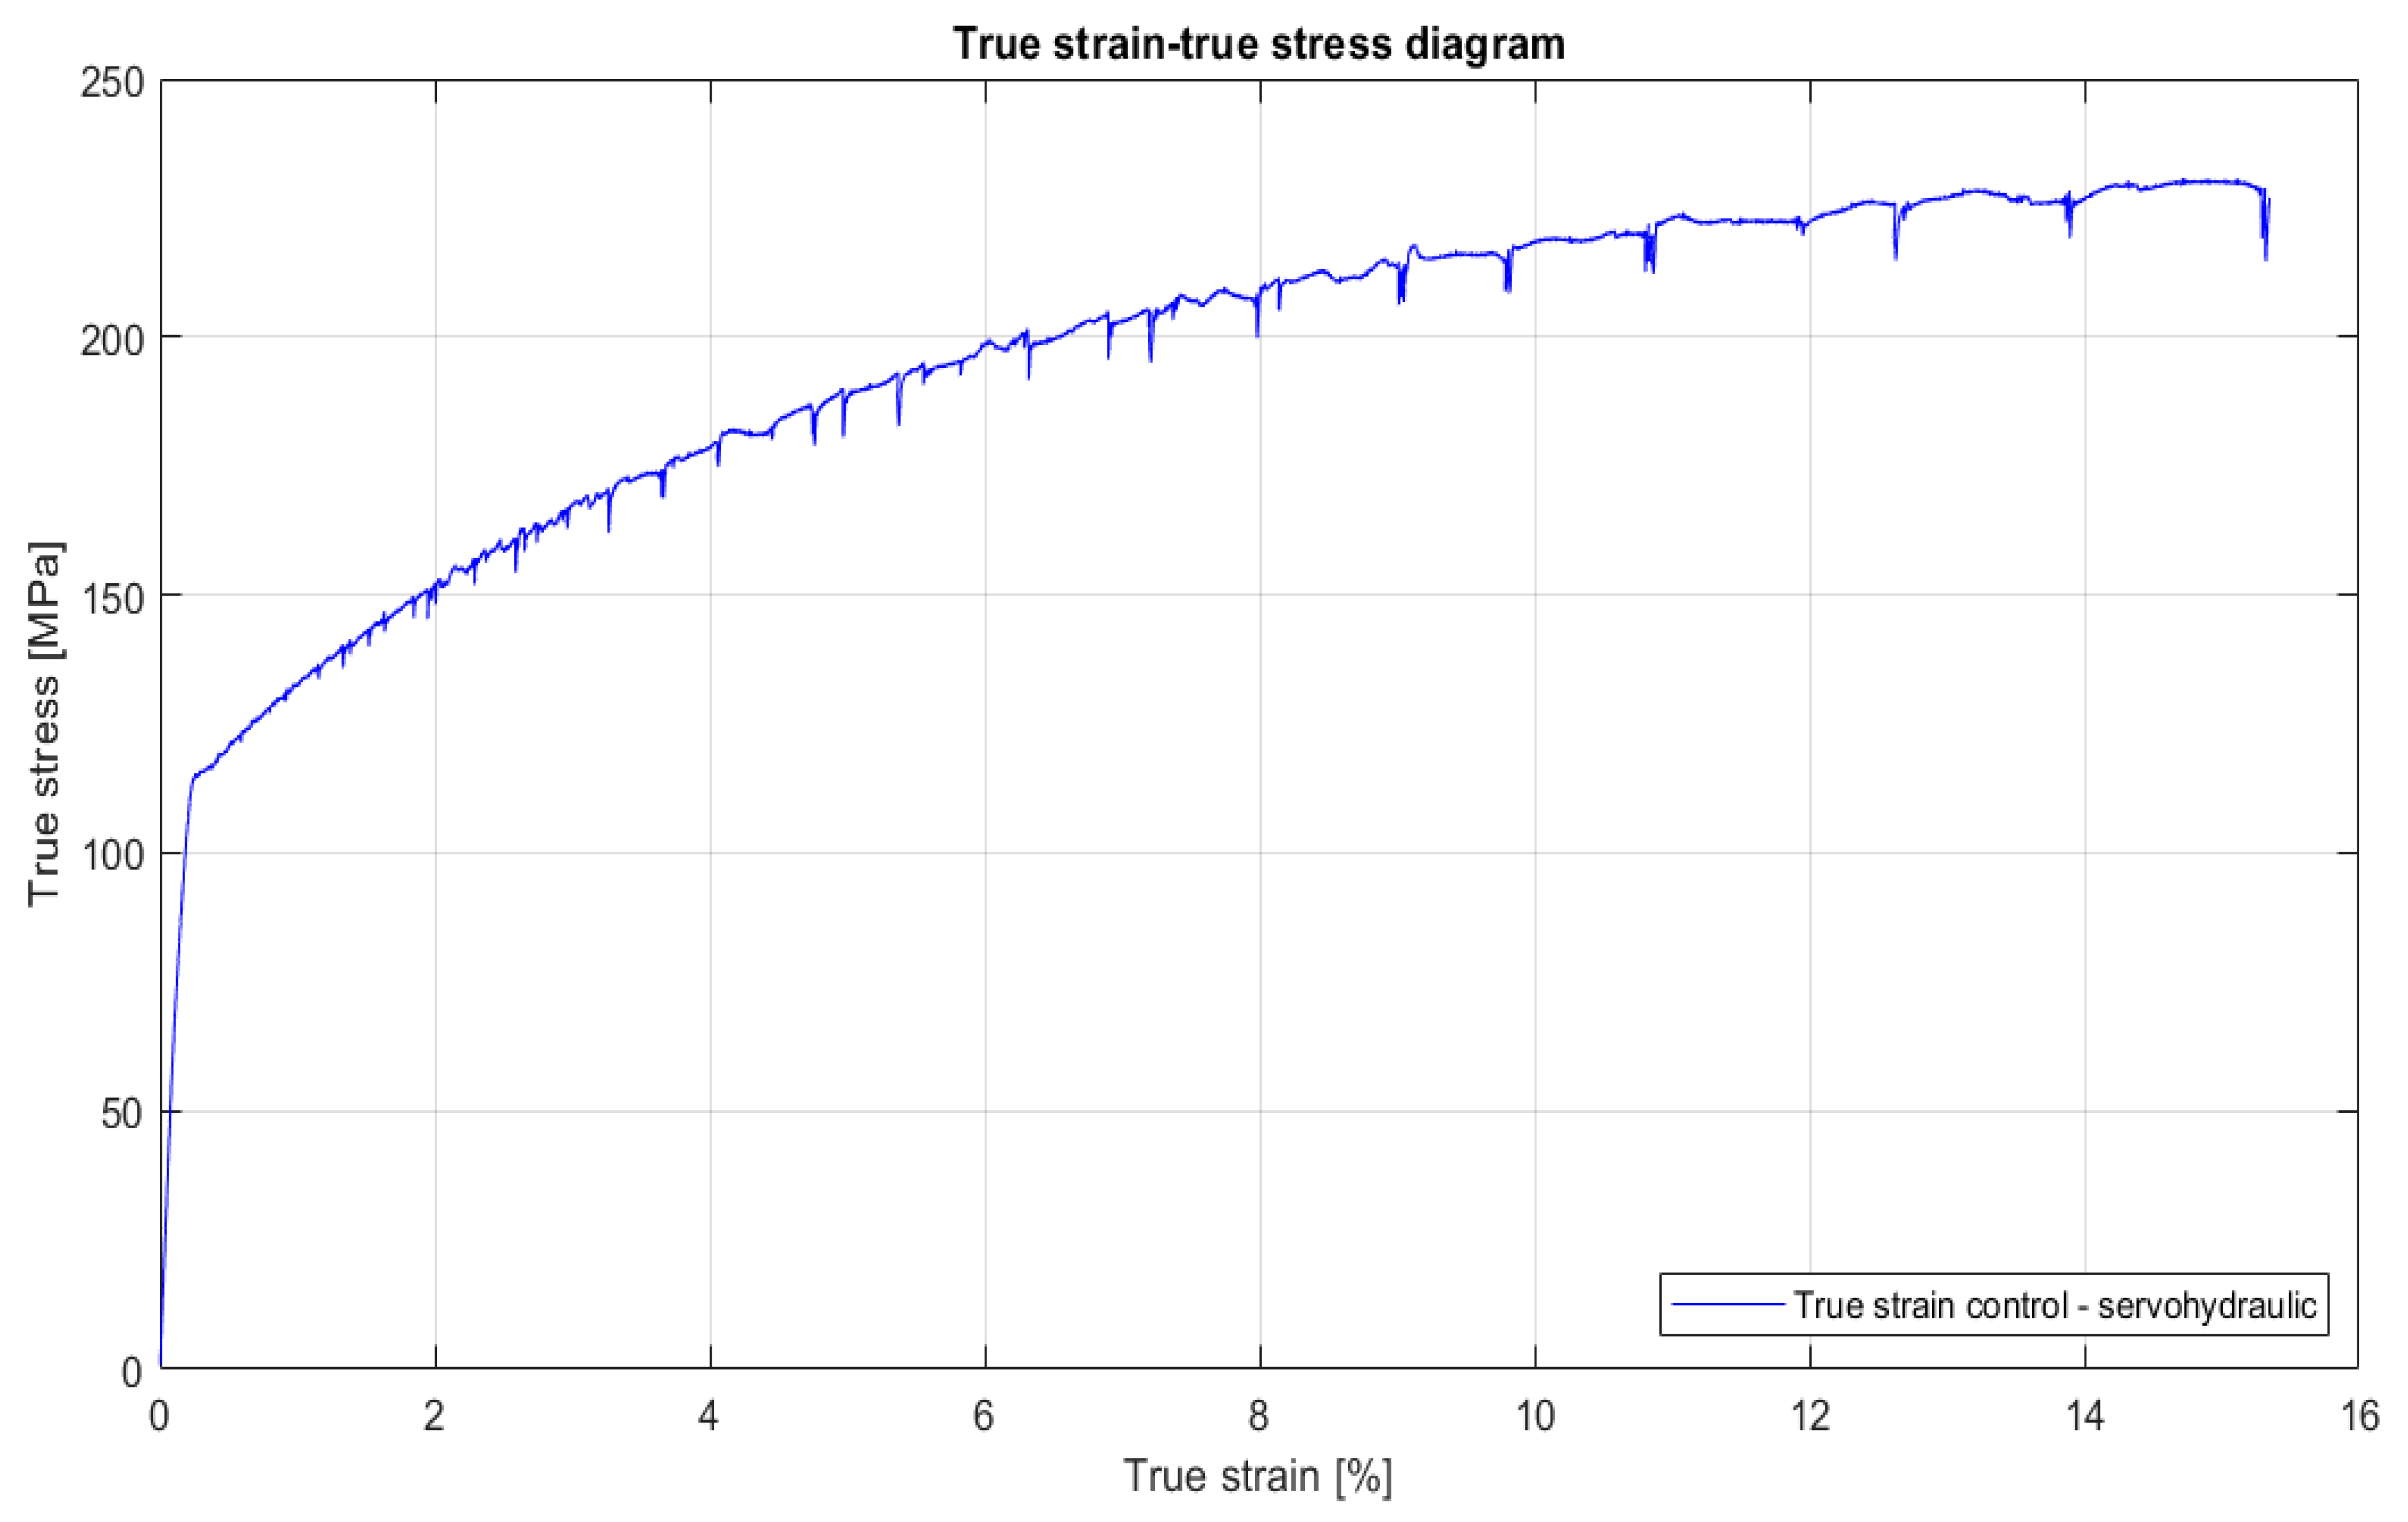
The PLC effect can be observed by analyzing the true stress-true strain curves, which are presented in Figure 2 in different colors for three samples, each corresponding to one of three control modes. In the true strain control mode, as shown in Figure 3, the jerky flow exhibits two distinct components. The first is a discreet, barely noticeable component that is consistently present from a true strain of 1% onward. The second is a sporadic component characterized by progressively pronounced load jumps as plastic strain increases. These significant jumps correspond to the formation of localized plastic bands, which are generated by the avalanche motion of coordinated packets of dislocations dislodging from their Cottrell atmospheres. Eventually, striction occurs, although it can be somewhat difficult to observe. In contrast, the curves under stroke control appear very similar for both the servohydraulic and electromechanical machines, as illustrated in Figure 2. Here, the jerky flow begins quite densely and persists throughout the entire true stress-true strain curve. The stress fluctuations gradually increase up to a true strain of approximately 6–7%, after which they remain relatively constant until near the end of the curve. In the final portion, a necking phenomenon occurs, leading to a significant decrease in the intensity of the stress jumps. If there is a slight difference between the two curves, it is that the curve from the servohydraulic machine is somewhat more irregular, featuring blocks of constant stress jumps separated by narrower, less uniform regions.
The data collected from the tests allowed us to calculate the stiffness of the two testing machines used. The electromechanical machine (MTS Electromechanical, MTS Systems Corporation, Minneapolis, MN, USA) exhibited a stiffness of 34,500 N/mm, while the servohydraulic machine (MTS Flextest SE, MTS Systems Corporation, Minneapolis, MN, USA) displayed a stiffness of 60,600 N/mm. This alignment with the structural characteristics of both machines is noteworthy. However, as illustrated in Figure 2, there is no significant difference in the serrations of the stroke control curves obtained from each machine. The greater irregularity in the serrations observed in the servohydraulic machine may be attributed to the differing operating modes of its actuator compared to the crosshead. Additionally, the distinct behavior observed in true strain control does not appear to be related to the machine’s stiffness and is markedly different from the behavior exhibited by the servohydraulic machine under stroke control.

4. Discussion

The results suggest that machine stiffness may influence the PLC effect. However, studies by Guillermin et al. [19] and experimental data from Tretyakova [2] indicate that noticeable effects only occur when there are significant changes in stiffness, up to an order of magnitude. Both studies examine stroke control modes used with servohydraulic machines, but there are some inconsistencies. For instance, in the case of low stiffness at 25 kN/mm, Guillermin et al. [19] observe that the load drops are not vertical; instead, they are inclined, resembling load control modes. In these modes, there are no actual load drops, but rather sudden increases in strain. Conversely, Tretyakova [21], working with a stiffness of 5 kN/mm, records vertical load drops, even though this stiffness is significantly lower than that reported by Guillermin.
The information presented indicates that various factors influence behavior. One key question to consider is how effectively the testing machine can maintain a constant or nearly constant strain rate. In our study, we chose to conduct tests at a nominal strain rate of 10−4 s−1. Using our data, recorded at an acquisition rate of 20 Hz, we calculated the true strain rate experienced by the specimen during the test by utilizing the values measured by the extensometer. If we let ε represent the strain and t denote time, we can apply the forward finite difference calculation method:
ε ˙ j = ε t ε j + 1 ε j t j + 1 t j
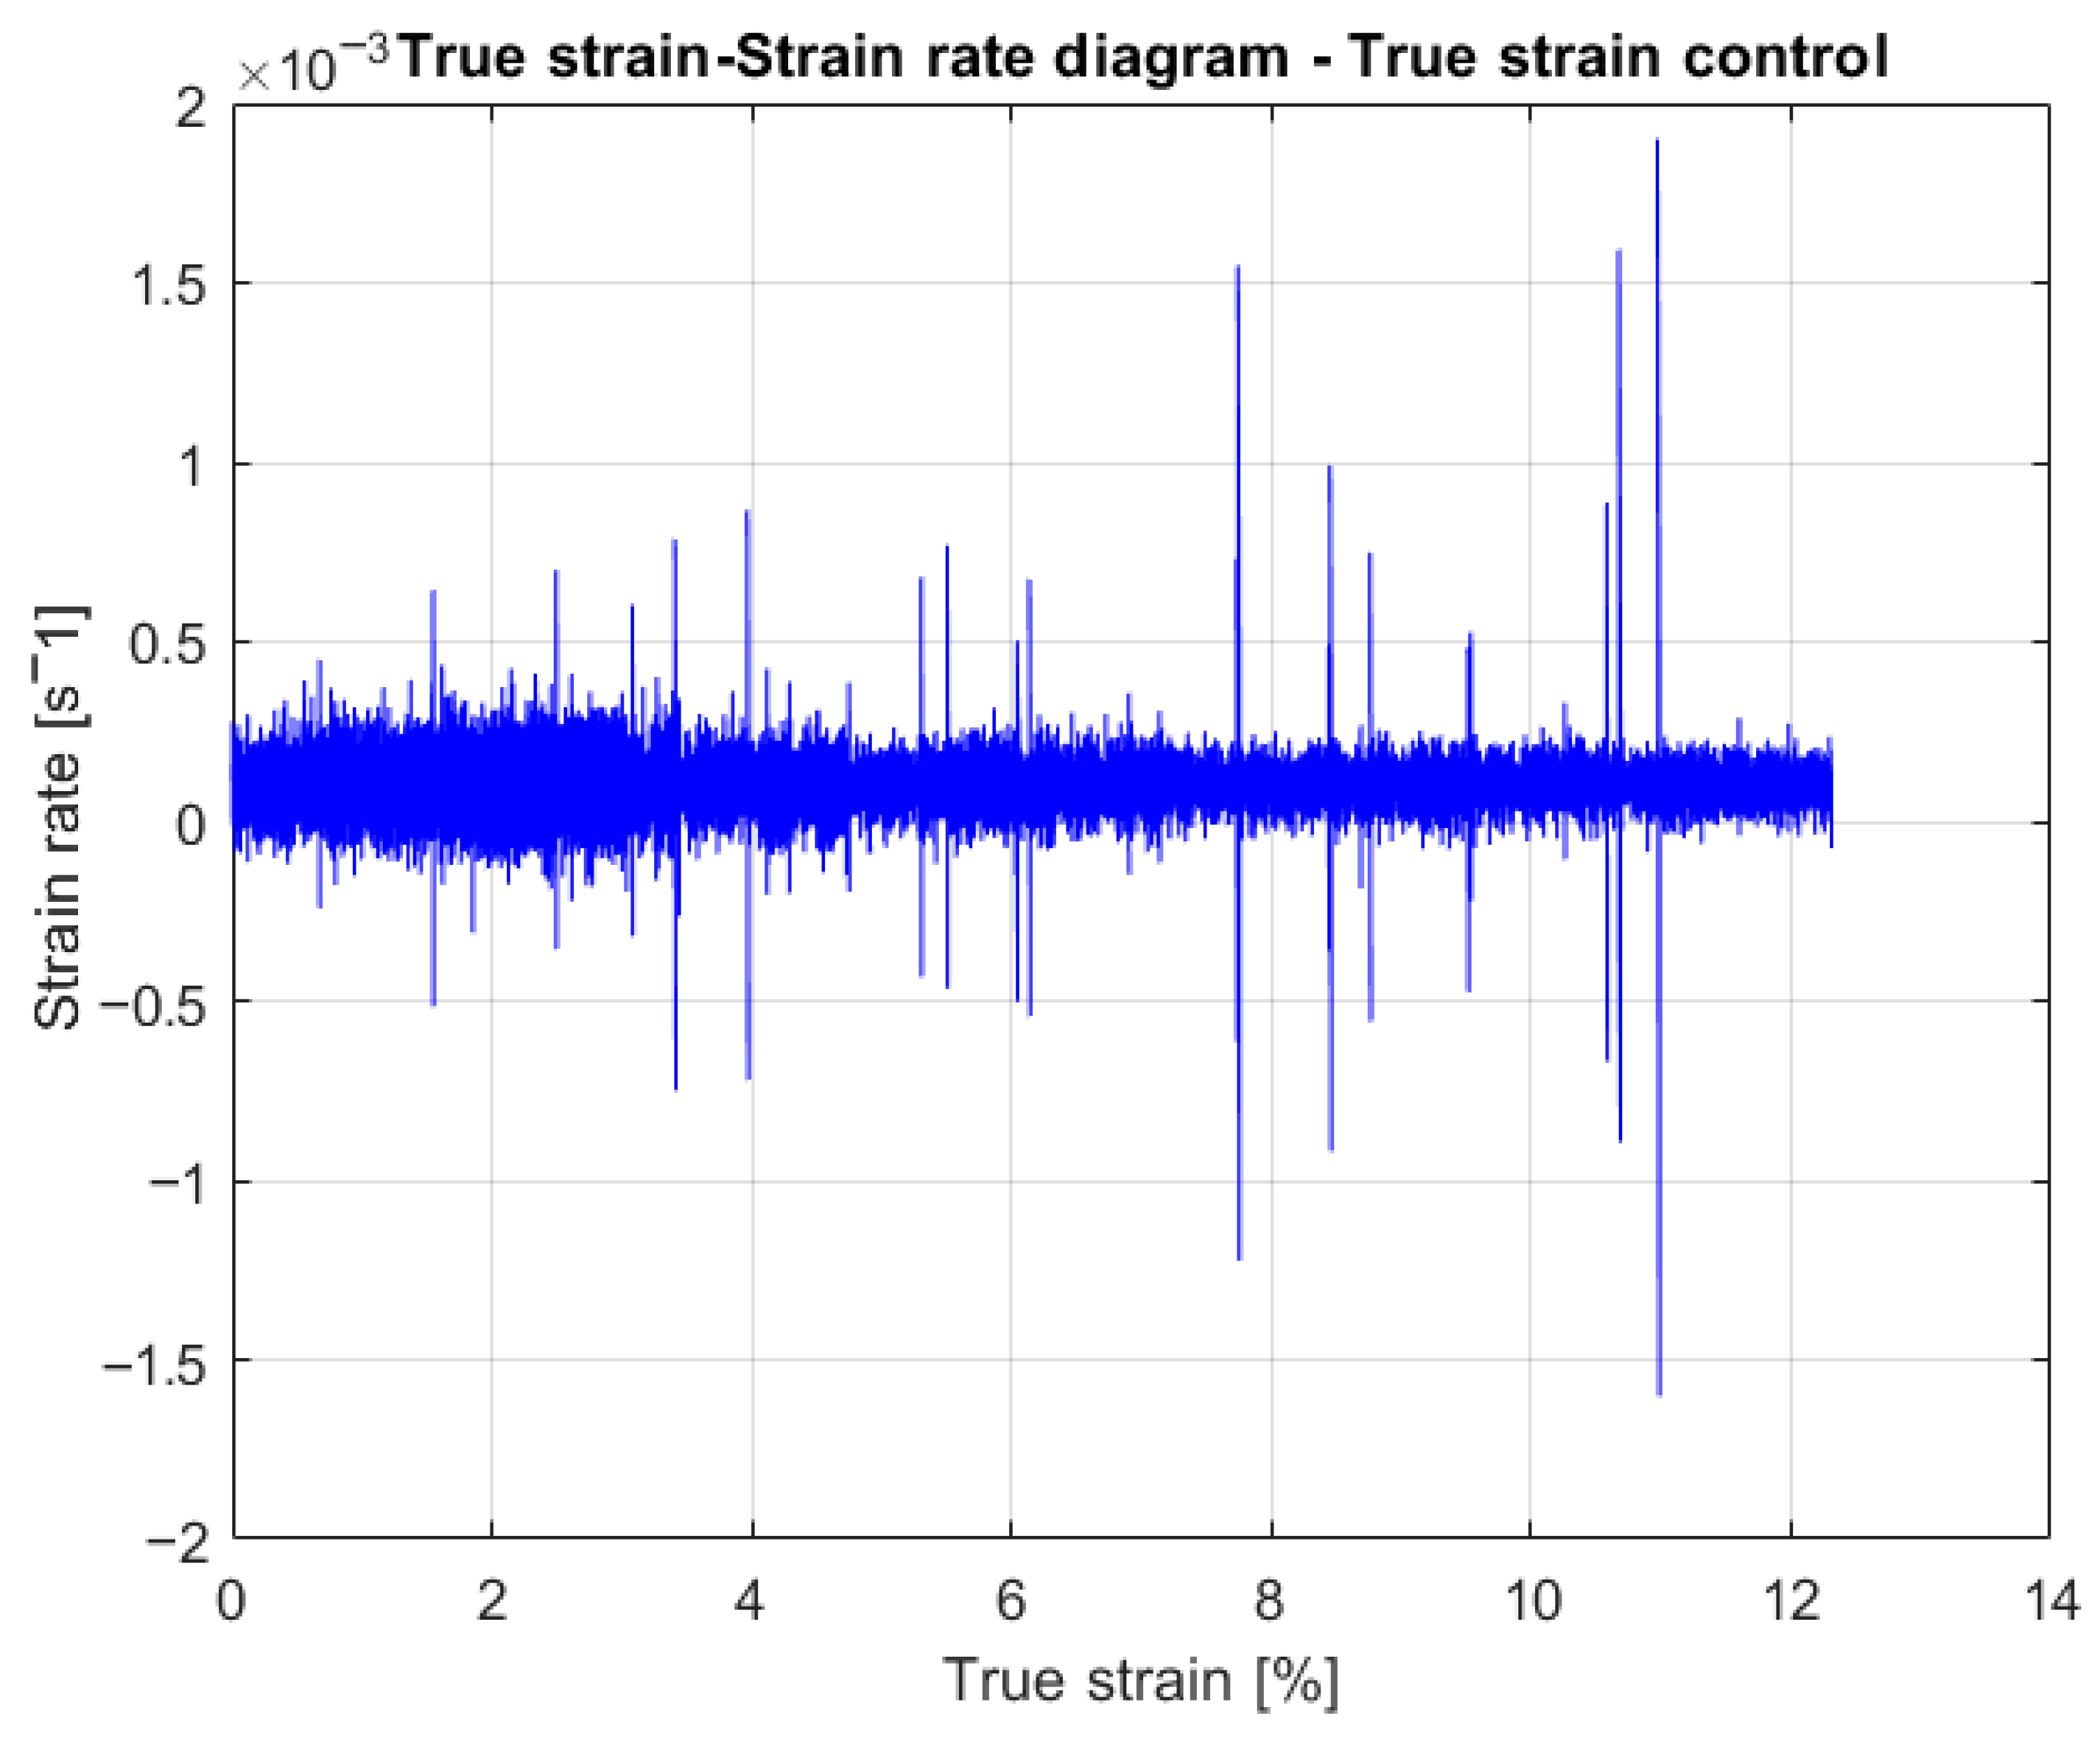
The index j = 1, 2, …, n refers to the experimental data points collected. When applying Equation (1) to the data acquired from stroke control and true strain control using the servohydraulic MTS machine, the results are shown in Figure 4 and Figure 5, respectively. It is important to note that the Flextest SE Plus controller, along with the MultiPurpose TestWare software, operates a servoloop at a frequency of approximately 5 kHz. This high frequency allows the system to quickly minimize the error between the command and the actual response. In Figure 4, which examines stroke control, it is clear that the actuator only approximately maintains the desired strain rate; the measured strain fluctuates significantly around the target set point. Additionally, there is substantial background noise, and the load drops caused by the serrations are not sufficiently compensated for by the servoloop.
The current control mode employed faces significant challenges in maintaining a constant strain rate across the sample. Several factors contribute to this issue, including background noise generated from the discretization of calculations based on Equation (1). Additionally, the actuator must accommodate various distant deformations, such as the elastic deformations of the machine frame, grips, and the sample itself. These deformations arise from multiple sources: elastic deformations at the connections, the part of the sample clamped by the grips, plastic deformations within the bands due to the Portevin-Le Chatelier (PLC) effect, and elastic relaxation in areas adjacent to these bands. Consequently, it is clear that achieving a constant strain rate in the specimen, particularly in the plastic band, is practically impossible when using stroke control, the method currently employed for conducting tensile tests to study the PLC effect.
In reference to Figure 5, which covers true strain control, the situation appears significantly improved compared to Figure 4. While there is still some background noise, much of it can be attributed to the discretization of the calculations used to assess the strain rate. For most points, the fluctuations in strain rate are around 10−4 s−1, representing a notable decrease from the 10−3 s−1 observed in Figure 4. This improvement is expected, as the current measurements are taken directly from the extensometer on the deformed section of the sample, focusing on the localized plastic strains resulting from the Portevin-Le Chatelier (PLC) effect, rather than measuring overall displacement from a distance (the actuator). However, not everything is fully controlled; Figure 5 still exhibits spikes that tend to increase in amplitude along with the overall plastic deformation, indicating that the system is struggling to manage these fluctuations.
In studying the deformation kinetics characteristic of the PLC effect, where each serration represents a plastic band, the following aspects must be considered:
  • The bands form and eventually propagate, sometimes within the zone monitored by the extensometer and sometimes outside of it, often near the connections of the calibrated central zone with the sample heads due to the local notch effect.
  • The strain rate within the bands is significantly higher than that imposed by the machine.
Due to the placement of the plastic band outside the measuring zone and the rapid occurrence of related phenomena, accurately determining the average strain rate in the sample’s measured area using current mechanical testing methods is impractical. Moreover, controlling the strain rate within the band itself is unrealistic. Existing mechanical equipment and contact extensometers lack the capacity to manage the rapid dynamics of PLC plastic bands. A potential solution for the future could involve using video extensometry combined with Digital Image Correlation (DIC). This approach would enable real-time monitoring of the strain rate within the band, allowing the information to be used retroactively to evaluate the response of the testing machine.
In this case, it is clear that using true strain offers a more accurate observation of the phenomena associated with the PLC effect. By removing the influence of passive phenomena occurring outside the measured area of the sample, we can avoid some of the limitations imposed by the machine’s stiffness during stroke control.
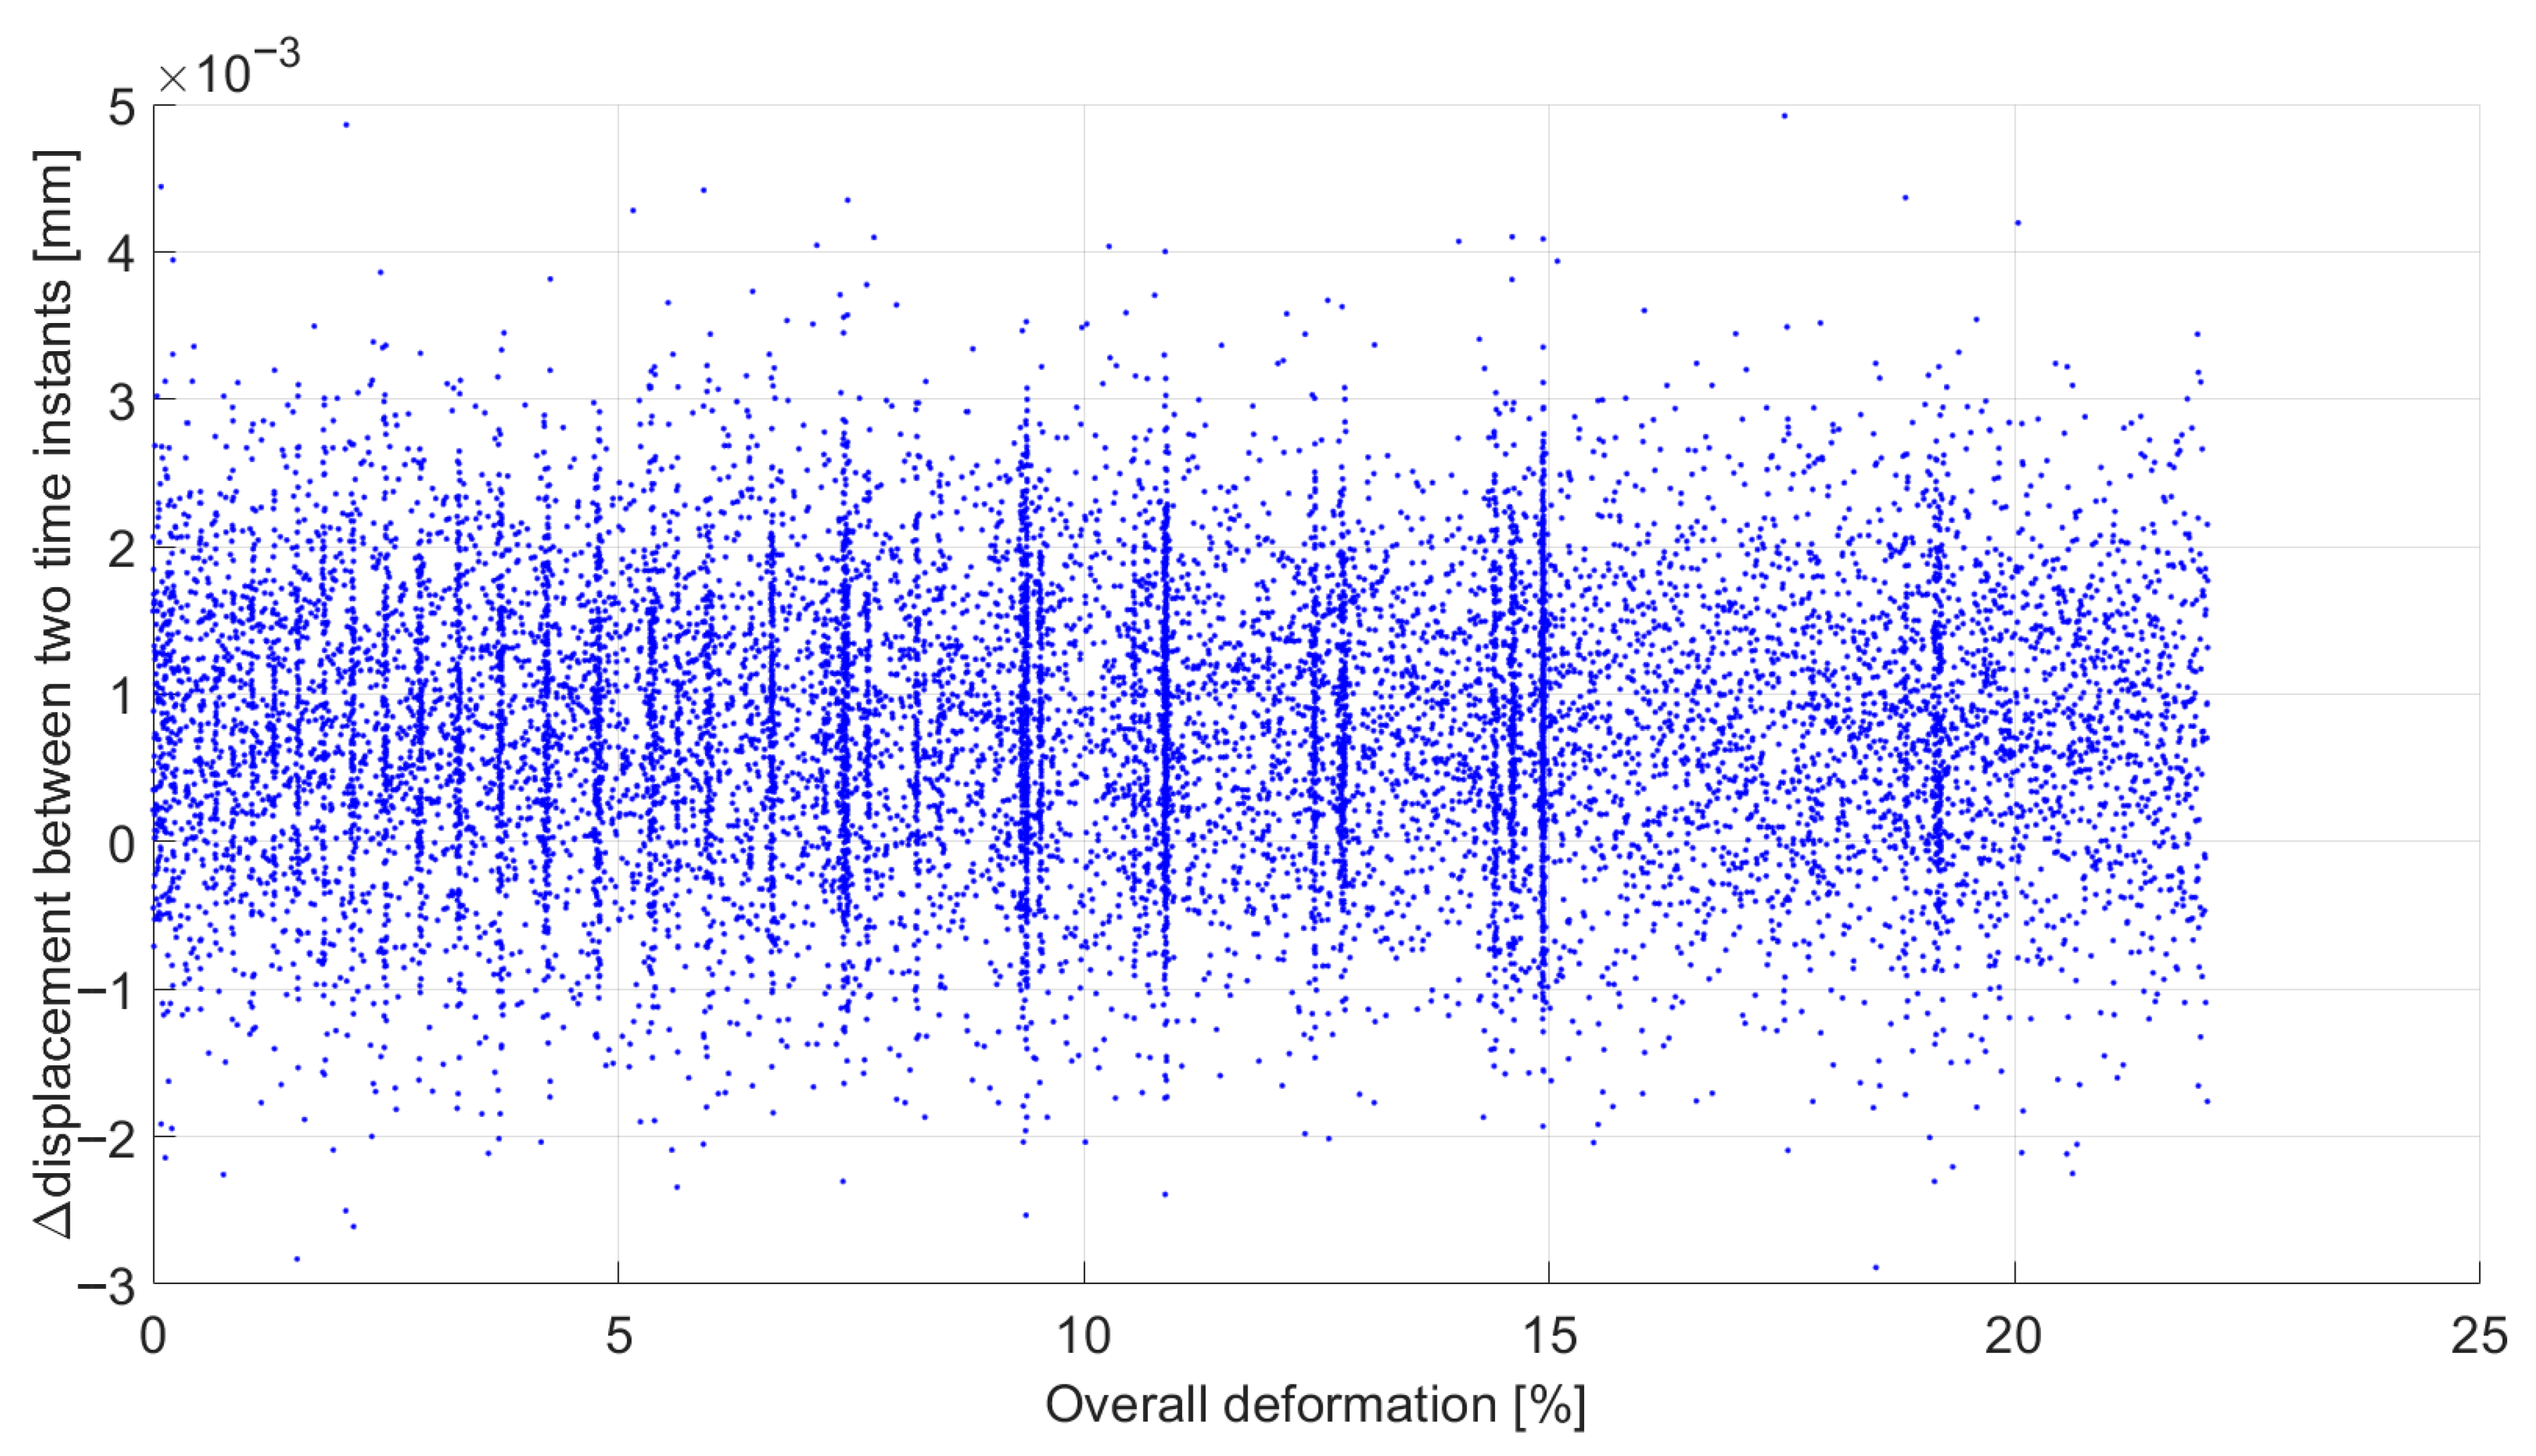
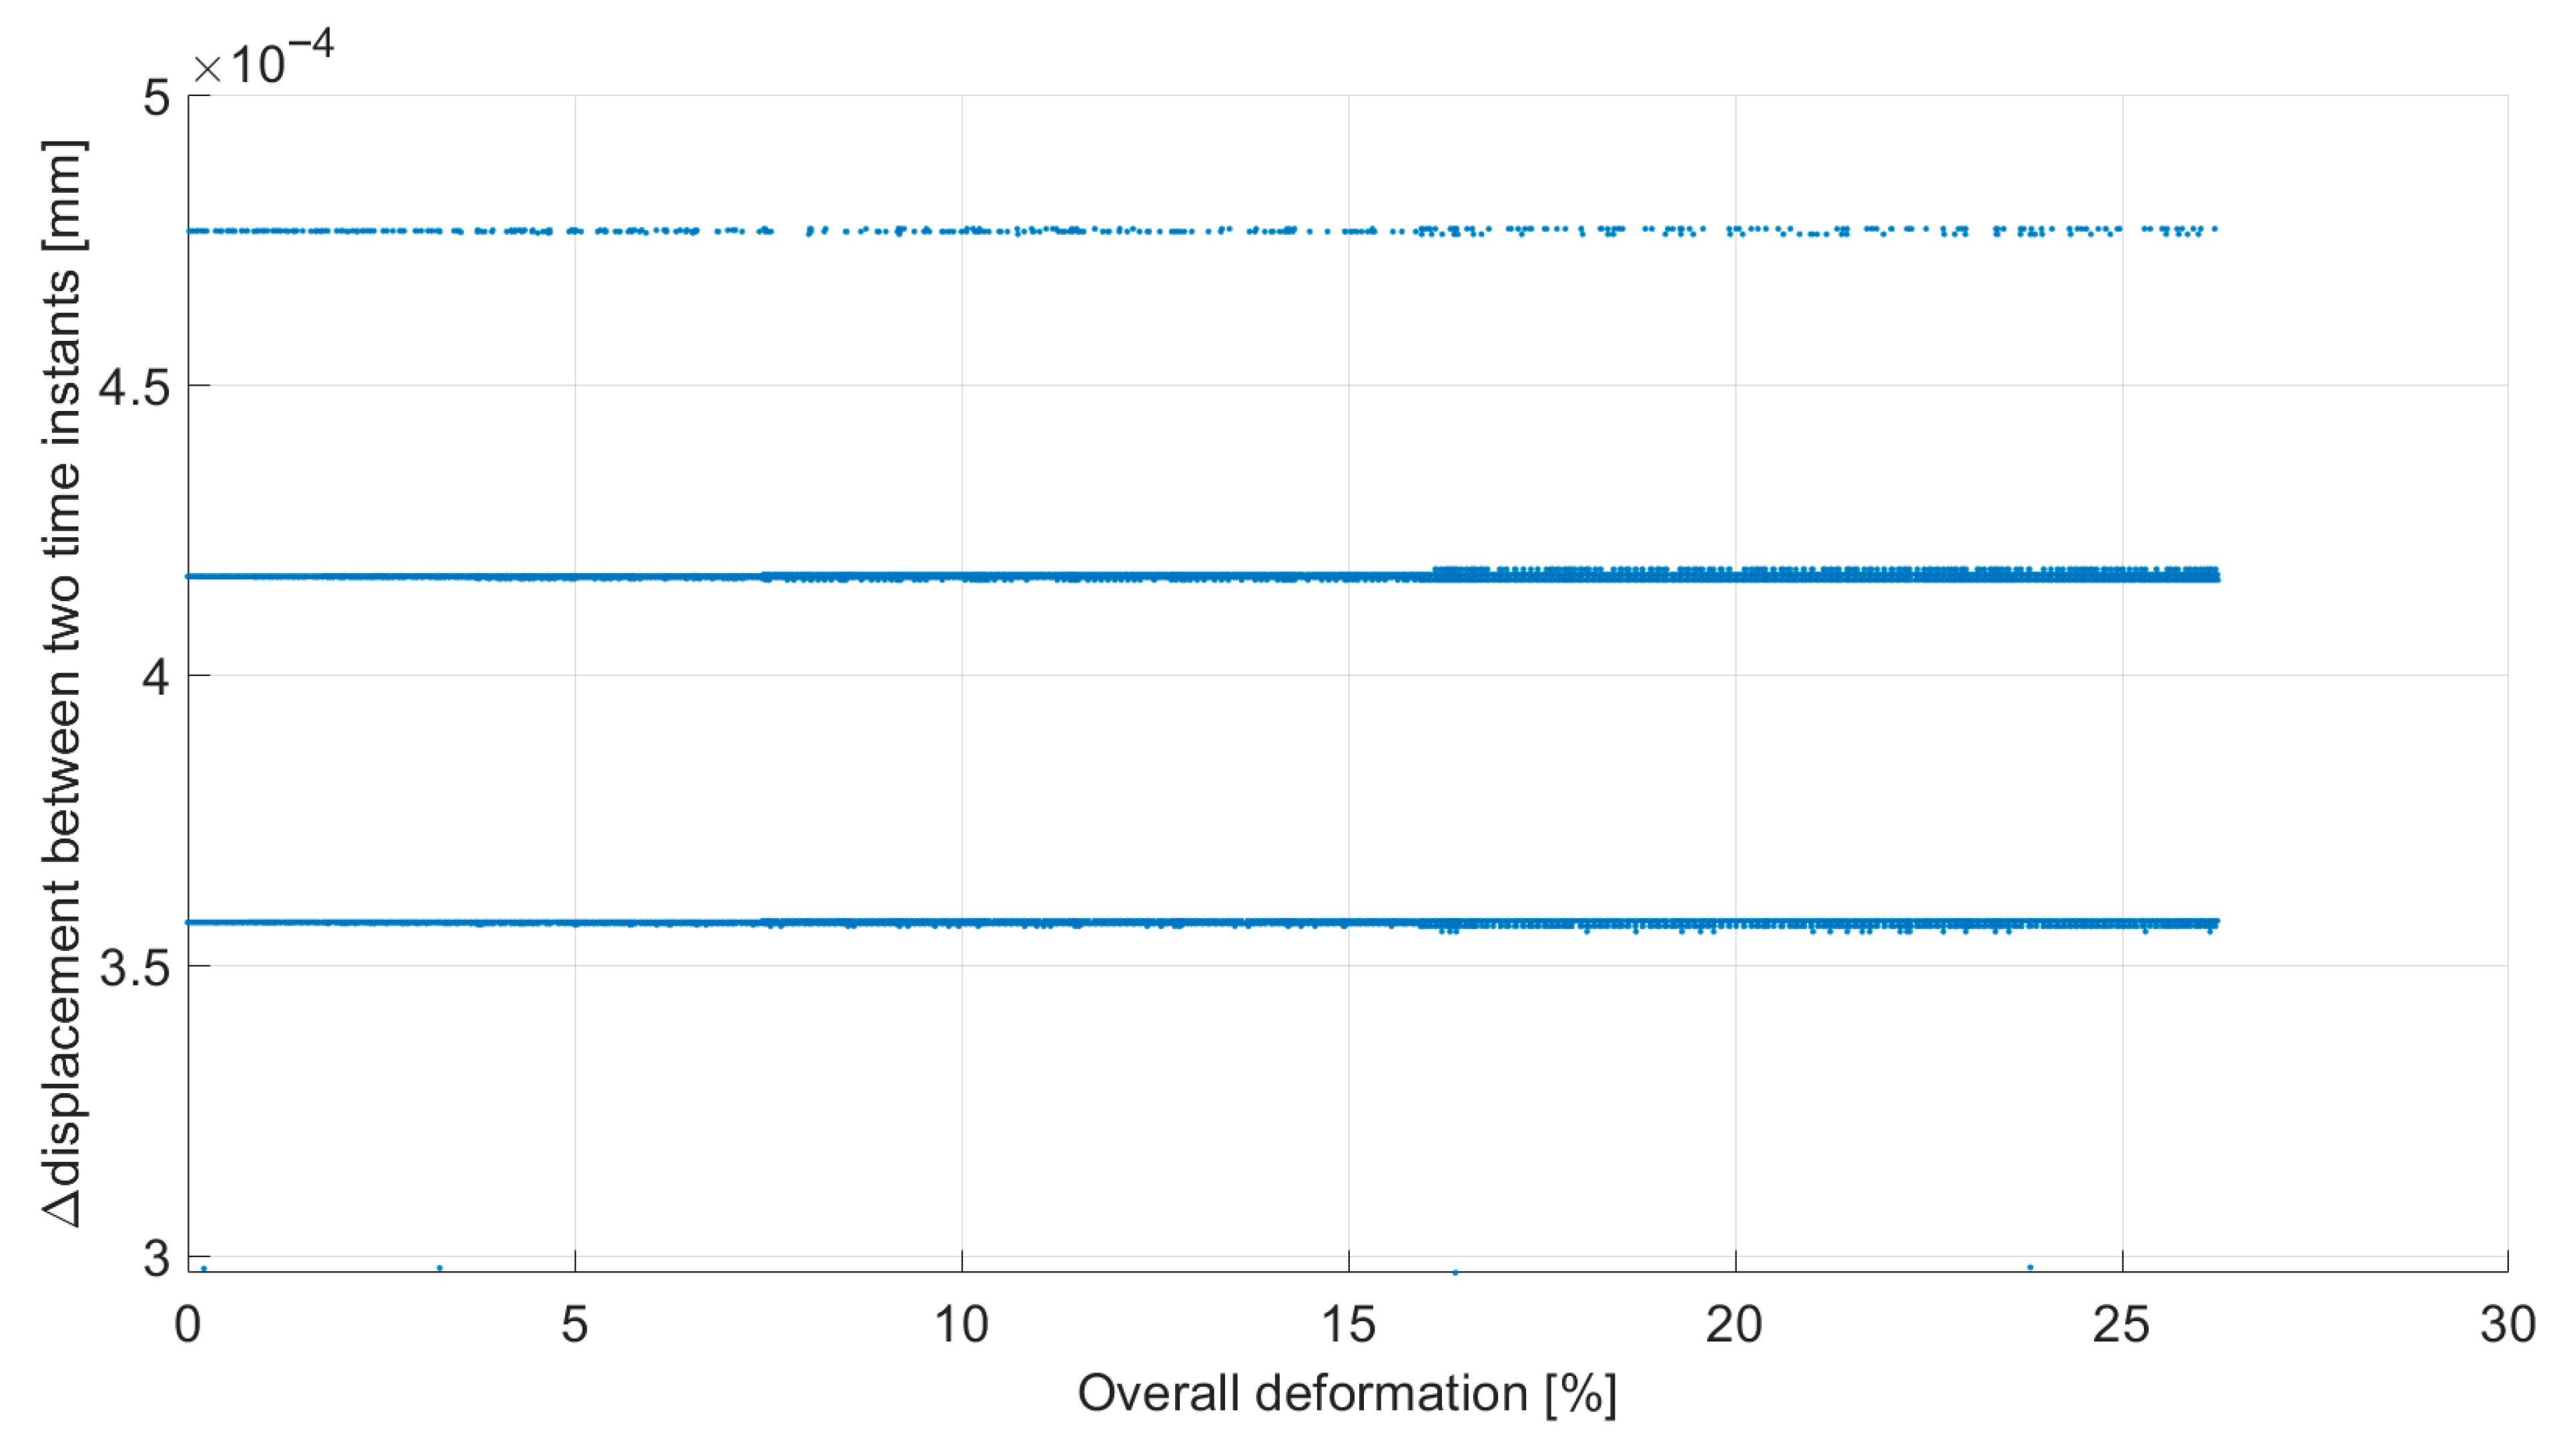
When comparing the true strain-true stress curves presented in Figure 2 and Figure 3, it can be concluded, supported by literature on the Digital Image Correlation (DIC) technique, that each serration in true strain control corresponds to the formation of a new plastic band. This assumption is more challenging to justify when using stroke control, where the number of plastic bands appears to be significantly higher. Stroke control imposes mechanical constraints that inhibit the full development of these bands, making their formation more straightforward under true strain control. To better understand the limitations of stroke control, one can examine the displacement of the actuator for the servo-hydraulic machine (shown in Figure 6) and the crosshead for the electromechanical machine (shown in Figure 7) during the deformation of the test sample.
During the formation of a band, an instability occurs that is subsequently managed by the control system of the machine. In a servohydraulic machine, the actuator’s displacement is adjusted according to the requirements at the moment, allowing for continuous variation during deformation. This movement typically ranges within approximately 3 µm. In contrast, the electromechanical machine features a crosshead that moves in a consistent and fixed manner at three specific levels: 0.36 µm, 0.42 µm, and 0.48 µm. As shown in Figure 7, the lines represent clusters of points corresponding to these fixed displacement levels executed by the crosshead. The electromechanical machine operates using two servomotors, one for each screw of the two columns, that are driven by electric pulses. These pulses cause the screws to rotate, which is connected to the movable crosshead. The system is rigid because the servomotors function only in discrete impulses rather than continuously. This results in specific displacement levels and uniformity in the PLC effect serrations. However, the stepwise operation of the movable crosshead limits the potential for the complete development of a plastic band.
The information provided clarifies the values of elongation and its scatter measured during the tests. True strain control imposes the least restrictions on band formation, allowing it to more readily reach conditions of global instability, even without a visible striction (see Figure 2 and Figure 3). In contrast, stroke control imposes constraints that prevent the bands from becoming unstable, enabling the development of significant necking. In this scenario, the electromechanical machine applies the strictest constraints due to the discrete and limited displacements typical of the drive motors (Figure 7), which ultimately allows the metal to achieve greater elongation before rupture.

5. Conclusions

This study aimed to highlight the aspects of tensile testing that influence the occurrence of the Portevin-Le Chatelier (PLC) effect. For this purpose, we selected the Al-Mg alloy AA5083H111, which contains a significant amount of diffusible magnesium, making it particularly susceptible to the phenomenon of dynamic strain aging. This alloy effectively demonstrates various characteristics of the PLC effect. The tests were conducted using two types of machines: an electromechanical machine and a servohydraulic machine. These machines differ in stiffness and in the methods used to control the strain rate applied to the specimens. We employed either stroke control or true strain control to impose a nominal strain rate of 10−4 s−1. The results provide new insights into how the PLC effect takes place during experimental trials:
  • The stiffness of the machine moderately affects the Portevin-Le Chatelier (PLC) effect, especially regarding serrations;
  • No method of control, whether stroke control or true strain control, can consistently guarantee the nominal strain rate in the specimen;
  • Stroke control tends to inhibit the development of plastic bands during jerky flow;
  • An electromechanical machine that controls the applied strain rate using electric pulse servomotors minimizes the development of these bands and delays breaking, resulting in greater elongations;
  • True strain rate control places fewer limitations on plastic band formation, resulting in more widely spaced serrations, each representing an individual plastic band;
  • True strain control is the most effective control mode for achieving an applied strain rate that closely approximates the nominal value, thereby allowing for a better observation of the PLC effect.

Author Contributions

Conceptualization; R.D.; Methodology: R.D., F.T.; Software,: F.T.; Validation: F.T., R.D.; Formal Analysis: F.T.; Investigation: R.D., F.T.; Resources: R.D.; Data Curation: F.T., R.D.; Writing—Original Draft Preparation: R.D.; Writing—Review & Editing: R.D., F.T.; Visualization: R.D., F.T.; Supervision: R.D.; Project Administration: R.D.; Funding Acquisition: R.D. All authors have read and agreed to the published version of the manuscript.

Funding

This research received no external funding.

Data Availability Statement

The data presented in this study are openly available [PORTO@IRIS] at [https://www.dist.polito.it/en/research/publications, accessed date 27 August 2025].

Conflicts of Interest

The authors declare no conflict of interest.

References

  1. Zhang, P.; Liu, G.; Sun, J. A critical review on the Portevin-Le Chatelier effect in aluminum alloys. J. Central South Univ. 2022, 29, 744–766. [Google Scholar] [CrossRef]
  2. Scott, V.; Franklin, F.; Mertens, M.M. Portevin–Le Chatelier effect. Phys. Rev. E 2000, 62, 8195–8206. [Google Scholar] [CrossRef]
  3. Tamimi, S.; Andrade-Campos, A.; Pinho-Da-Cruz, J. Modelling the Portevin-Le Chatelier effects in aluminium alloys: A review. J. Mech. Behav. Mater. 2015, 24, 67–78. [Google Scholar] [CrossRef]
  4. Yilmaz, A. The Portevin–Le Chatelier effect: A review of experimental findings. Sci. Technol. Adv. Mater. 2011, 12, 063001. [Google Scholar] [CrossRef] [PubMed]
  5. Lebyodkin, M.A.; Lebedkina, T.A. The Portevin-Le Chatelier Effect and Beyond. In High-Entropy Materials: Theory, Experiments, and Applications; Brechtl, J., Liaw, P.K., Eds.; Springer Nature: Cham, Switzerland, 2021; ISBN 978-3-030-77640-4. [Google Scholar]
  6. Jiang, H.; Zhang, Q.; Chen, X.; Chen, Z.; Jiang, Z.; Wu, X.; Fan, J. Three types of Portevin–Le Chatelier effects: Experiment and modelling. Acta Mater. 2007, 55, 2219–2228. [Google Scholar] [CrossRef]
  7. Hähner, P.; Rizzi, E. On the kinematics of Portevin–Le Chatelier bands: Theoretical and numerical modelling. Acta Mater. 2003, 51, 3385–3397. [Google Scholar] [CrossRef]
  8. Rizzi, E.; Hähner, P. On the Portevin–Le Chatelier effect: Theoretical modeling and numerical results. Int. J. Plast. 2004, 20, 121–165. [Google Scholar] [CrossRef]
  9. Hähner, P.; Ziegenbein, A.; Rizzi, E.; Neuhäuser, H. Spatiotemporal analysis of Portevin–Le Châtelier deformation bands: Theory, simulation, and experiment. Phys. Rev. B 2002, 65, 134109. [Google Scholar] [CrossRef]
  10. Mansouri, L.Z.; Thuillier, S.; Manach, P.Y. Thermo-mechanical modeling of Portevin–Le Châtelier instabilities under various loading paths. Int. J. Mech. Sci. 2016, 115–116, 676–688. [Google Scholar] [CrossRef]
  11. Lebedkin, M.A.; Dunin-Barkovskii, L.R. Dynamic mechanism of the temperature dependence of the Portevin-Le Châtelier effect. Phys. Solid State 1998, 40, 447–452. [Google Scholar] [CrossRef]
  12. Wang, W.M.; Sluys, L.J.; De Borst, R. Viscoplasticity for Instabilities Due to Strain Softening and Strain-Rate Softening. Int. J. Numer. Methods Eng. 1997, 40, 3839–3864. [Google Scholar] [CrossRef]
  13. Cui, C.; Zhang, R.; Zhou, Y.; Sun, X. Portevin-Le Châtelier effect in wrought Ni-based superalloys: Experiments and mechanisms. J. Mater. Sci. Technol. 2020, 51, 16–31. [Google Scholar] [CrossRef]
  14. Rowlands, B.S.; Rae, C.; Galindo-Nava, E. The Portevin-Le Chatelier effect in nickel-base superalloys: Origins, consequences and comparison to strain ageing in other alloy systems. Prog. Mater. Sci. 2023, 132, 101038. [Google Scholar] [CrossRef]
  15. Vinogradov, A. Signatures of Plastic Instabilities and Strain Localization in Acoustic Emission Time-Series. Metals 2025, 15, 46. [Google Scholar] [CrossRef]
  16. Tong, W.; Zhang, N. On Serrated Plastic Flow in an AA5052-H32 Sheet. J. Eng. Mater. Technol. 2007, 129, 332–341. [Google Scholar] [CrossRef]
  17. Wang, H.D.; Berdin, C.; Mazière, M.; Forest, S.; Prioul, C.; Parrot, A.; Le-Delliou, P. Experimental and numerical study of dynamic strain ageing and its relation to ductile fracture of a C–Mn steel. Mater. Sci. Eng. A 2012, 547, 19–31. [Google Scholar] [CrossRef]
  18. Yamasaki, S.; Miike, T.; Mitsuhara, M.; Nakashima, H.; Akiyoshi, R.; Nakamura, T.; Kimura, S. Quantitative analysis of the Portevin–Le Chatelier effect by combining digital image correlation and dead-weight-type tensile test. Mater. Sci. Eng. A 2021, 816, 141277. [Google Scholar] [CrossRef]
  19. Guillermin, N.; Besson, J.; Köster, A.; Lacourt, L.; Mazière, M.; Chalons, H.; Forest, S. Experimental and numerical analysis of the Portevin–Le Chatelier effect in a nickel-base superalloy for turbine disks application. Int. J. Solids Struct. 2023, 264, 112076. [Google Scholar] [CrossRef]
  20. Luo, S.; Xiao, L.; Jiang, J.; Li, J.; Zeng, L. Influence of Machine Stiffness on the Portevin–Le Chatelier Effect of Ti-12Mo Alloy Based on a Modified McCormick Constitutive Model. Met. Mater. Int. 2024, 30, 2685–2698. [Google Scholar] [CrossRef]
  21. Tretyakova, T.; Tretyakov, M. Spatial-Time Inhomogeneity Due to the Portevin-Le Chatelier Effect Depending on Stiffness. Metals 2023, 13, 1054. [Google Scholar] [CrossRef]
  22. Tretyakova, T.V.; Wildemann, V.E. Influence the loading conditions and the stress concentrators on the spatial-time inhomogeneity due to the yield delay and the jerky flow: Study by using the digital image correlation and the infrared analysis. Fract. Struct. Integr. 2017, 11, 303–314. [Google Scholar] [CrossRef]
  23. Doglione, R.; Ashtiani, P.H.; Berdin, C. Rolling Effect on Serrated Flow in an Al-Li-Cu-Mg Alloy Plate. Mater. Perform. Charact. 2015, 4, 73–86. [Google Scholar] [CrossRef]
  24. Mohammed, S.M.A.K.; Chen, D.L. Effect of Auto-Tuning on Serrated Flow Behavior. Metals 2019, 9, 845. [Google Scholar] [CrossRef]
  25. Tretyakova, T.V.; Wildemann, V.E.; Lomakin, E.V. Studying the influence of the loading system on the spatialtime inhomogeneity of inelastic deformation in metals by analyzing strain and temperature fields. AIP Conf. Proc. 2016, 1785, 4967053. [Google Scholar] [CrossRef]
  26. Tretyakova, T.V.; Wildemann, V.E. Interrelation between local strain jumps and temperature bursts due to the jerky flow in metals under the complicate loading conditions: Experimental study by using the DIC-technique and the IR-analysis. Procedia Struct. Integr. 2016, 2, 3393–3398. [Google Scholar] [CrossRef]
  27. Sheikh, H. Investigation into Characteristics of Portevin-Le Chatelier Effect of an Al-Mg Alloy. J. Mater. Eng. Perform. 2010, 19, 1264–1267. [Google Scholar] [CrossRef]
  28. Zdunek, J.; Brynk, T.; Mizera, J.; Pakieła, Z.; Kurzydłowski, K.J. Digital Image Correlation investigation of Portevin–Le Chatelier effect in an aluminium alloy. Mater. Charact. 2008, 59, 1429–1433. [Google Scholar] [CrossRef]
  29. Kang, J.; Wilkinson, D.S.; Jain, M.; Embury, J.D.; Beaudoin, A.J.; Kim, S.; Mishira, R.; Sachdev, A.K. On the sequence of inhomogeneous deformation processes occurring during tensile deformation of strip cast AA5754. Acta Mater. 2006, 54, 209–218. [Google Scholar] [CrossRef]
  30. Joshi, S.P.; Eberl, C.; Cao, B.; Ramesh, K.T.; Hemker, K.J. On the Occurrence of Portevin–Le Châtelier Instabilities in Ultrafine-Grained 5083 Aluminum Alloys. Exp. Mech. 2009, 49, 207–218. [Google Scholar] [CrossRef]
  31. Wen, W.; Morris, J.G. The effect of cold rolling and annealing on the serrated yielding phenomenon of AA5182 aluminum alloy. Mater. Sci. Eng. A 2004, 373, 204–216. [Google Scholar] [CrossRef]
  32. Samuel, E.; Jonas, J.J.; Samuel, F.H. Serrated Flow and Enhanced Ductility in Coarse-Grained Al-Mg Alloys. Met. Mater. Trans. A 2011, 42, 1028–1037. [Google Scholar] [CrossRef]
  33. Saad, G.; Fayek, S.A.; Fawzy, A.; Soliman, H.N.; Nassr, E. Serrated flow and work hardening characteristics of Al-5356 alloy. J. Alloys Compd. 2010, 502, 139–146. [Google Scholar] [CrossRef]
  34. Kang, J.; Wilkinson, D.S.; Bruhis, M.; Jain, M.; Wu, P.D.; Embury, J.D.; Mishra, R.K.; Sachdev, A.K. Shear Localization and Damage in AA5754 Aluminum Alloy Sheets. J. Mater. Eng. Perform. 2008, 17, 395–401. [Google Scholar] [CrossRef]
  35. Ait-Amokhtar, H.; Boudrahem, S.; Fressengeas, C. Spatiotemporal aspects of jerky flow in Al–Mg alloys, in relation with the Mg content. Scr. Mater. 2006, 54, 2113–2118. [Google Scholar] [CrossRef]
  36. Zdunek, J.; Spychalski, W.L.; Mizera, J.; Kurzydłowski, K.J. The influence of specimens geometry on the PLC effect in Al–Mg–Mn (5182) alloy. Mater. Charact. 2007, 58, 46–50. [Google Scholar] [CrossRef]
  37. Abbadi, M.; Hähner, P.; Zeghloul, A. On the characteristics of Portevin–Le Chatelier bands in aluminum alloy 5182 under stress-controlled and strain-controlled tensile testing. Mater. Sci. Eng. A 2002, 337, 194–201. [Google Scholar] [CrossRef]
Figure 1. Geometry of tensile samples. Dimensions are given in mm.
Jeta 03 00025 g001
Figure 2. True stress-true strain curves of three samples for each testing mode, in different color. In blue is true strain control, in red is stroke control for electromechanical machine, in green is stroke control for servohydraulic machine.
Jeta 03 00025 g002
Figure 3. True stress-true strain curve in true strain control. The details of the PLC effect can be better appreciated.
Jeta 03 00025 g003
Figure 4. Strain rate measured during the tensile test using the extensometer applied to the tested specimen in stroke control mode.
Jeta 03 00025 g004
Figure 5. Strain rate measured during the tensile test by the extensometer applied to the sample tested in true strain control mode.
Jeta 03 00025 g005
Figure 6. Movements made by the actuator of the servo hydraulic machine while the overall deformation is being carried out inside the extensometer.
Jeta 03 00025 g006
Figure 7. Movements made by the crosshead of the electromechanical machine during the overall deformation within the extensometer.
Jeta 03 00025 g007
Table 1. Mass percentage chemical composition of the 3 mm thick sheet used in the study.
MgMnCrSiFeCuZnTiAl
4.620.670.130.280.210.060.180.12Bal.
Table 2. Characteristics of the true strain-true stress curves for 5083H111 alloy sheet in the three different control modes of tensile tests. The largest load drop recorded during serrations is also reported.
Testing ControlR0.2 [MPa]Rm [MPa]A%A% Standard DeviationΔσmax [MPa]
true strain128244141.4616
stroke, servohydraulic124245170.9611
stroke, electromechanical120245210.9414
Disclaimer/Publisher’s Note: The statements, opinions and data contained in all publications are solely those of the individual author(s) and contributor(s) and not of MDPI and/or the editor(s). MDPI and/or the editor(s) disclaim responsibility for any injury to people or property resulting from any ideas, methods, instructions or products referred to in the content.