1. Introduction
The increasing capabilities of sensors and the expectations of public and government bodies regarding the safety and reliability of structures have resulted in an increase in research on structural health monitoring. This means that methods for the early detection of damage and, if present, finding its location and assessing its severity are seen as having significant potential for practical applications. One of the common topics of research is the effect of cracks on the vibration behaviour of structures and the use of this knowledge in identification of cracks [
1,
2,
3,
4,
5]. The method of measuring frequency changes to establish the location and severity of damage has received the attention of researchers for several decades, and a recent literature review focussed on these efforts can be found in [
6].
In the context of structural health monitoring, damage is broadly defined as changes to the material and/or geometric properties of a system which adversely affect its current or future performance [
7]. This paper is limited to an investigation into the use of frequency measurements for detecting cracks, specifically focussed on identifying the location of a crack without any knowledge of severity through measurements of multiple frequencies. Cracks may be treated as small slots which generate changes in the cross-sectional area, breaking the structural continuity. Following Irwin [
8], this slot can be modelled as a rotational spring whose stiffness is computed through the local compliance obtained from fracture mechanics using strain energy density functions [
9]. For the purpose of structural analysis, cracked structures are represented by connecting the structural parts on either side of the crack, assuming translational rigidity but representing rotationally flexibility by means of a spring of finite rotational stiffness [
10]. The effect of damage over a finite domain in a structure such as a beam with reduced cross-sectional area over a length [
11] is more noticeable than the effect of damage occurring over a very small domain such as a crack. Therefore, detecting and assessing cracks is a more challenging task.
Although numerous papers on determining the natural frequency of a cracked structure directly for a given crack severity at a prescribed location have been published, to the authors’ knowledge, there are no published works that give a method for calculating the rotational stiffness (or flexibility) of the crack at a given location. This paper is an attempt to address this gap, using the Dynamic Stiffness Matrix method, which has been in use for several decades for the vibration analysis of frameworks [
12,
13], with subsequent advances in its development and applications making it suitable for more complex structural systems [
14].
This paper is organised as follows. Mathematical derivations are presented in
Section 2. In
Section 3, this is followed by a numerical example using a portal frame with a crack to demonstrate the use of the derivations in
Section 2.
Section 4 shows how the derived formulae can be applied using the finite element method. Conclusions are presented in
Section 5. The coefficients of the exact Dynamic Stiffness Matrix of a beam element are given in
Appendix A and the dynamic stiffness formulation for the frame used in the example is given in
Appendix B.
2. Mathematical Derivations
The task of finding the location of a crack from frequency measurements without knowing the severity of the crack is possible because of an equation that gives the rotational stiffness of the cracked section in terms of the measured frequencies at any given location. This stiffness calculation can be performed at any of the measured natural frequencies, and irrespective of the mode number, the calculated stiffness will be the same if the correct location of the crack is used. Thus, plotting the calculated stiffness against possible crack location for the measured natural frequencies for the first few modes can reveal the crack location at the intersection of the curves.
Thus, the first step is to obtain an equation for the rotational stiffness of the cracked section as a function of the frequency and the crack location. This is achieved using an interesting relationship between the determinants of the Dynamic Stiffness Matrix (DSM) of three structures, namely the intact structure, the structure with a hinge at the crack location, and the actual structure with a crack of finite severity.
The Dynamic Stiffness Method takes into account the distribution of mass and stiffness in structural elements exactly. The new equation we present here for the rotational stiffness and its proof is valid whether or not we have the expressions for the exact stiffness coefficients. Although these expressions are used in illustrating the applicability of the method in one of the examples presented here, it is not necessary to be able to express the stiffness in an exact form and in
Section 4, the finite element method is used to show this.
2.1. A Relationship Between the Determinants of the DSM of the Intact, Cracked, and Hinged Structures
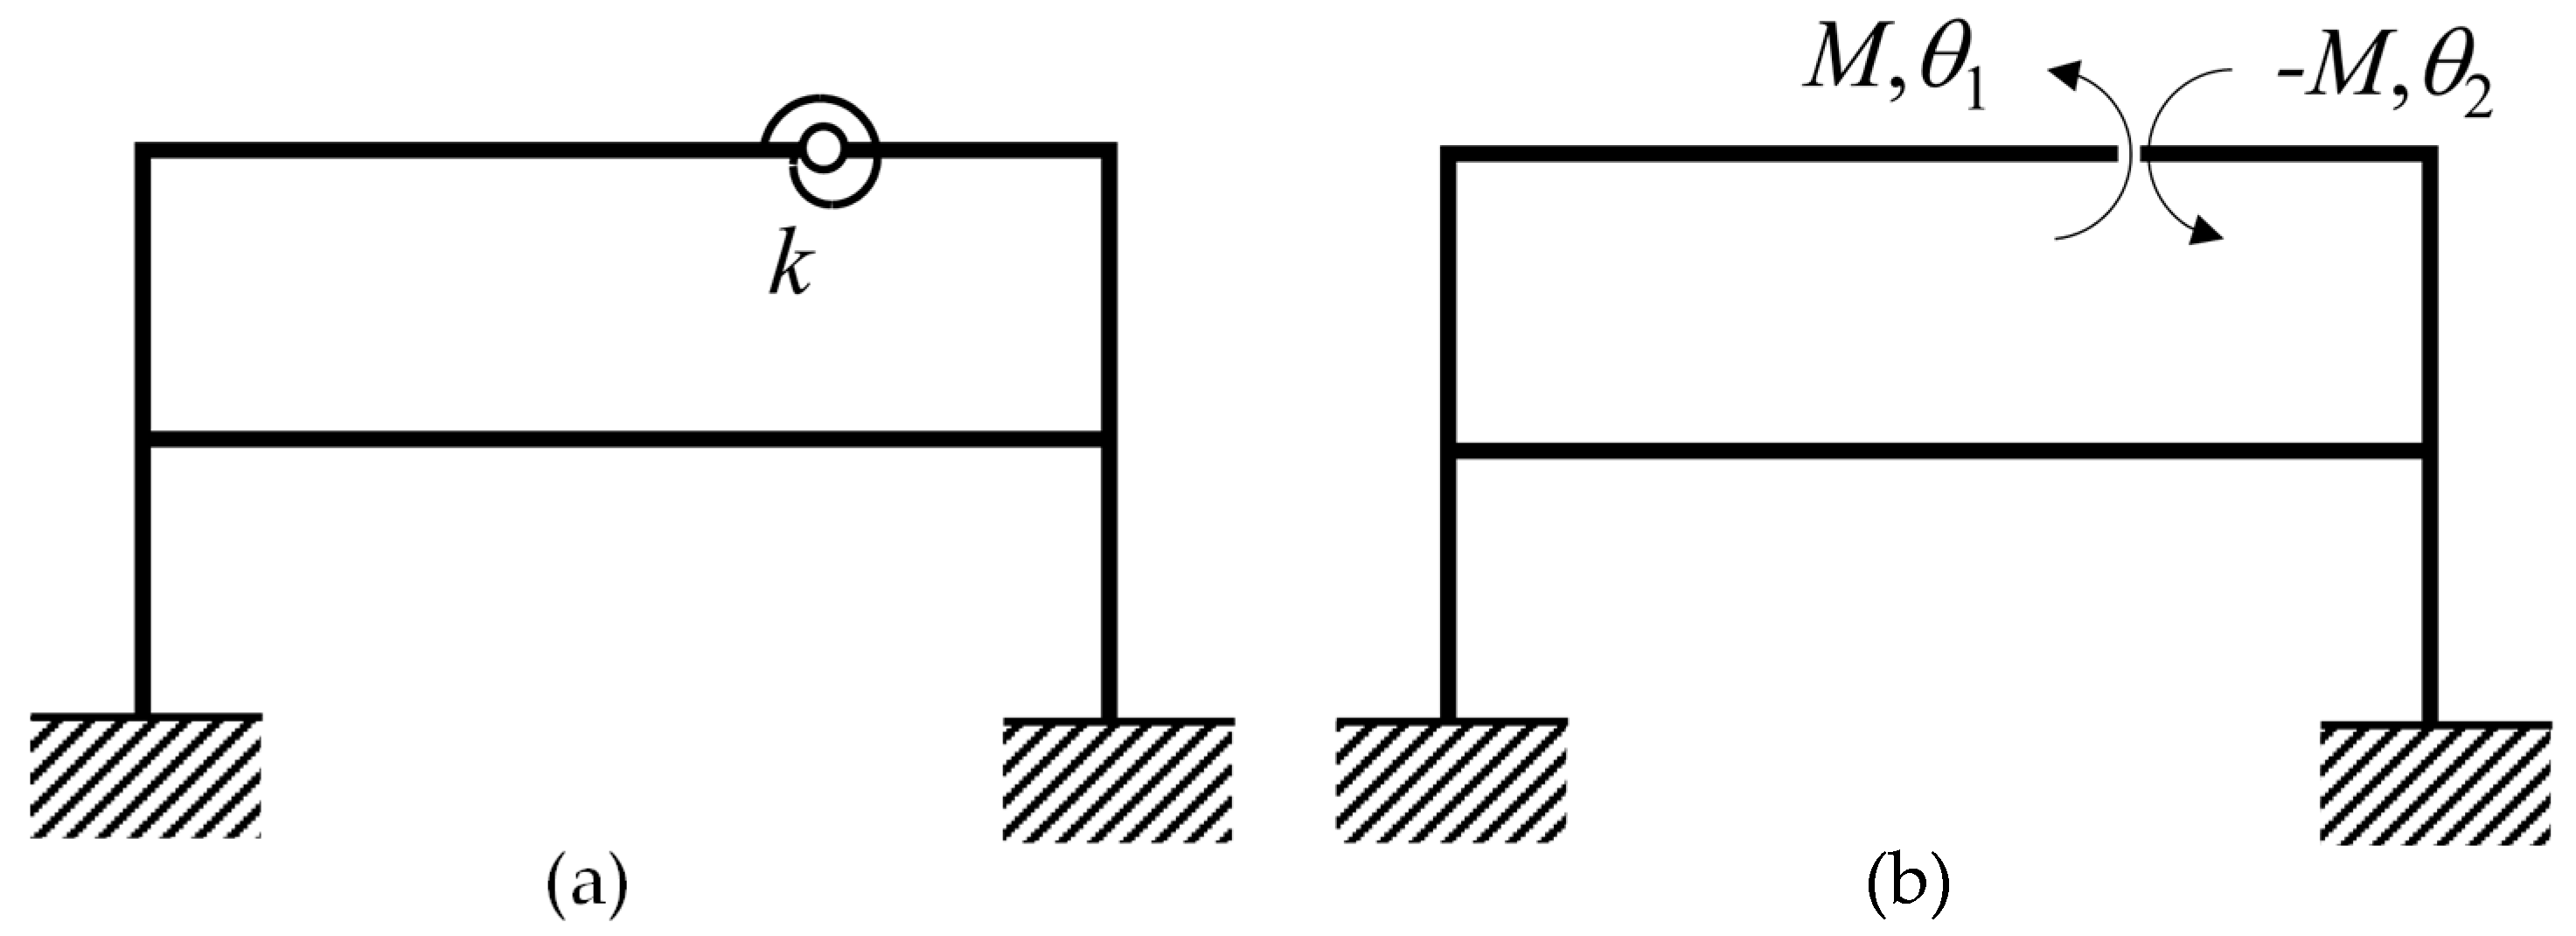
Although the methodology being discussed is applicable to any skeletal structure with a DSM, for illustrative purposes, let us consider the vibration of a single-bay two-storey plane frame with a crack within its top horizontal member represented by a spring, limiting the relative rotation of the two segments of the beam at the crack, as shown in
Figure 1a. For the purpose of the derivations, let the spring connection be removed from the structure and its effect represented by two equal and opposite internal bending moments, which are now shown as external to the split structure in
Figure 1b. The rotations of the structure at the two sides of the crack location are labelled
and
. According to Newton’s third law, the associated internal bending moments (
) will be equal and opposite, noting that the crack effect represented by a rotational spring does not introduce a discontinuity in the bending moment. Then, for the structure shown in
Figure 1b, the following DSM equation can be derived:
where each element
of the matrix represents the stiffness coefficient, in this case the moment required to cause a unit rotation, which may be obtained from the DSM of the structure through condensation, leading us to define the internal moments as
It may be worth mentioning that the general derivations here are performed to obtain a fundamental relationship between the characteristics of the structure and it is not necessary to know what these coefficients are. For any linear elastic structure, there exists a unique relationship between the actions (these may be forces or moments) and displacements (these may be translations or rotations). The relationship in Equation (2) applies for the structure in
Figure 1b. In the special case when there is no spring in the structure,
and Equation (2) lead to the determinantal equation for the frame hinged at the point
p (the location of the crack is shown as a vector to show that the position could be anywhere in the structure) with the form
Using the rotational spring model for a crack of stiffness
,
the rotations either side of the crack are related by
which, when substituted into Equation (2), gives
Adding expressions for
M in Equation (6) gives the determinant for the cracked structure as
The determinant is a function of the crack location , the frequency , and rotational stiffness of the beam at the crack .
For the original (intact, undamaged) structure, the continuity in the slope requires that
Substituting Equation (8) into Equation (2), the moment over rotation ratio for the original structure is obtained
leading to the determinantal equation for the original structure as
It may be noted that this determinant is still expressed as a function of the potential crack location p, because the stiffness coefficients are formed for the structure with a node at this location.
Equations (3), (7) and (10) give the following determinantal relationship:
which is true at any frequency. However, its potential use in crack detection comes from applying it at the natural frequencies
of the cracked structure, where
Thus, from Equation (11),
so that
2.2. Identifying Crack Location from the Measured Frequencies
The above relationship has significant implications because it provides a direct way to calculate the equivalent rotational stiffness at a crack as a function of any potential location and the measured natural frequencies. For example, given experimental results
for the first three natural frequencies of the cracked structure, then for any potential crack location
p, the stiffness can be calculated directly from Equation (14). Then, using the same procedure employed commonly by other researchers [
15,
16], that is, by plotting the stiffness against the test location of the crack, the correct crack location can be identified as the point where all three curves meet. The difference between this approach and the earlier work [
15,
16] is that Equation (14) permits direct computation of the stiffness from the determinants of two Dynamic Stiffness Matrices, without having to calculate natural frequencies. This has been demonstrated by applying it to a portal frame in
Section 3, and its use in conjunction with a finite element method is given in
Section 4.
2.3. Direct Calculation of the Natural Frequencies of a Cracked Structure
The determinantal relationship in Equation (11) also leads to approximate equations for the changes in a natural frequency due to a crack, when the crack severity is either very small or very large, as explained below.
Equation (11) may be written in terms of the rotational flexibility of the crack
, as
Consider a crack of very small flexibility
which causes a natural frequency
of the original structure to change by
, so that
Because
is a natural frequency of the original structure,
Taking the first term of the Taylor series, the determinantal values of the hinged and original structures at frequency
may be expressed as follows:
where a dash denotes differentiation with respect to
.
Substituting Equation (17) into Equation (19) gives
Substituting Equations (18) and (20) into Equation (16) gives
so that
Equation (22) gives the change in frequency from that of an undamaged structure due to the presence of a crack with a small equivalent joint flexibility
. As
,
Thus, the decrease in frequency due to a small joint flexibility is proportional to the flexibility.
Similarly for a severely cracked structure, the change in natural frequency compared to the natural frequency of a structure with a hinge at the crack location can be obtained as follows.
A first-order Taylor series approximation gives
Since, for the hinged structure,
Equation (25) reduces to
so that
Thus, in this case, the deviation in frequency of a severely cracked beam from that of a hinged beam (with the hinge located at the same position as the crack) is proportional to the rotational stiffness at the very small crack. It should noted that while Equation (23) gives the variation in the natural frequency of a slightly cracked beam as a small deviation from that of an intact beam, Equation (29) gives the deviation of the natural frequency of a beam with a severe crack as a small deviation from the natural frequency of a beam with a hinge at the crack location.
In
Section 3, calculations based on Equation (14), which is exact, are used to investigate the validity of the approximate Equations (23) and (29), for cracks with, respectively, very small and very large severity. The results suggest that these equations may serve as potential tools to quickly calculate the frequencies of a cracked structure for very slight cracks and very severe cracks. Before proceeding with presentation of numerical results, the DSM will be used to explain the lack of sensitivity of the natural frequencies to cracks in certain regions.
2.4. Relationship Between the Moment in the Original Structure and the Determinant of a Hinged Structure
The derivations in the preceding section lead to an interesting relationship between the bending moment in an undamaged structure at one of its natural frequencies at any given point, and the determinantal equation for a structure with a hinge at that particular location as shown below.
Multiplying Equation (9) gives
Using Equations (3) and (10) in Equation (30),
At a natural frequency
of the original structure, Equation (17) leads to
where
is the bending moment in the undamaged structure when it vibrates at natural frequency
. Equation (32) shows that the value of the determinant of the hinged structure is proportional to the square of the bending moment of the undamaged structure at the potential crack location when it vibrates in one of its natural mode shapes. This helps us to understand why in some locations in a structure the crack severity has little or no effect on some of the natural frequencies.
Consider vibration at a natural frequency
of an undamaged structure. If the corresponding natural mode has one or more points of contraflexure
where the bending moment
is zero, then from Equation (32), if a hinge is inserted at
, then
Then, for a crack of stiffness
located at
, substituting Equations (17) and (33) into Equation (11),
irrespective of the magnitude of the stiffness
. This explains the insensitivity of the natural frequency to the severity of cracks at the points of contraflexure for each particular mode, in line with the observations in [
17,
18,
19].
3. Illustrative Examples and Discussion
To investigate the implications of the relationships found in
Section 2, consider the single-bay single-story portal frame consisting of Euler–Bernoulli beams studied by Greco and Pau [
16].
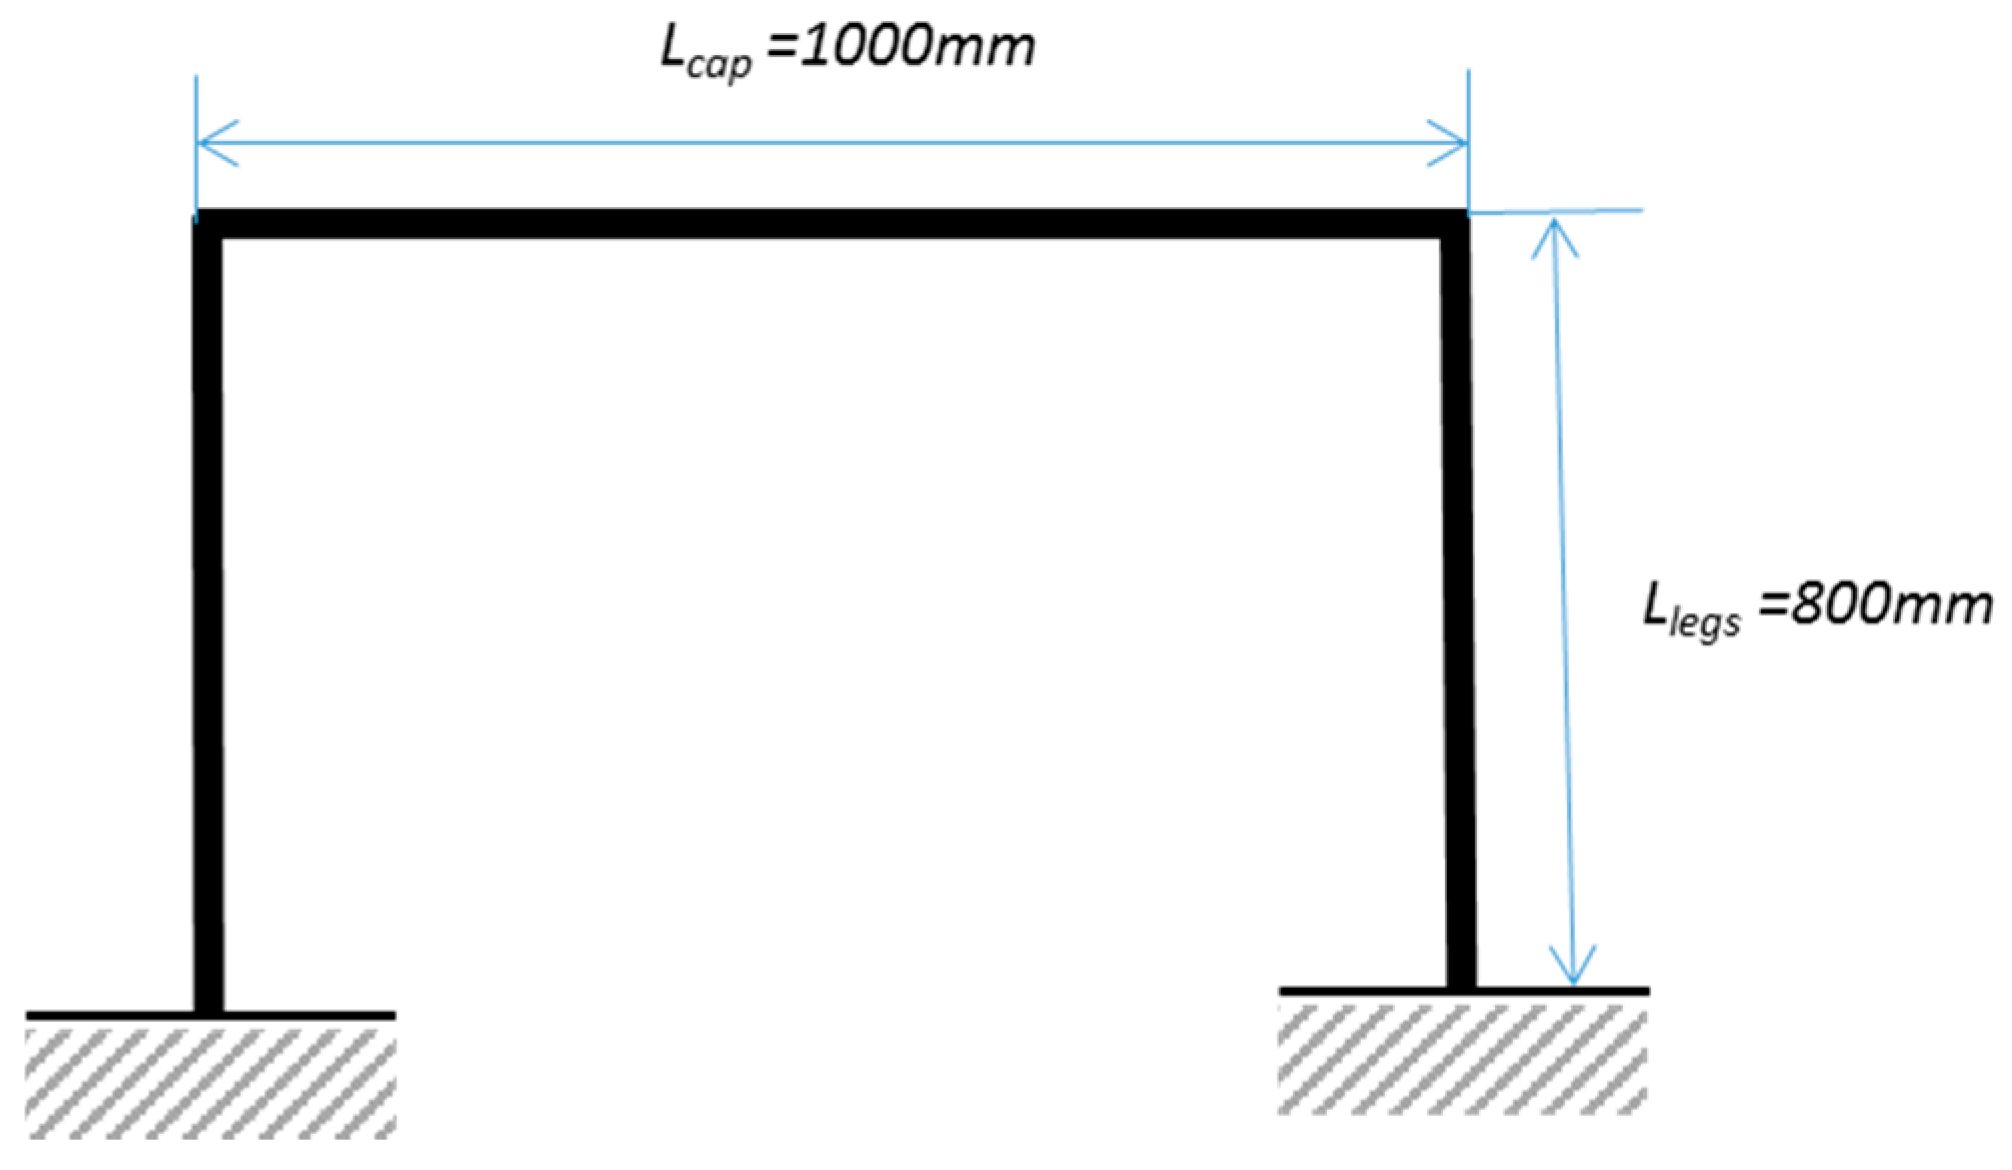
Figure 2 shows the dimensions used. The frame is made of steel with an elastic modulus of 200 GN/m
2 and a density of 7849 kg/m
3. The legs and cap have lengths of 0.8 m and 1.0 m, respectively, and have a uniform rectangular sectional area of 40 × 8 mm
2. Note that only flexural in-plane vibrations are considered and the 40 mm dimension is the width of the beam measured perpendicular to the plane of vibration.
The first three natural frequencies of the uncracked frame are
,
, and
. The first and second natural frequencies of the cracked structure
and
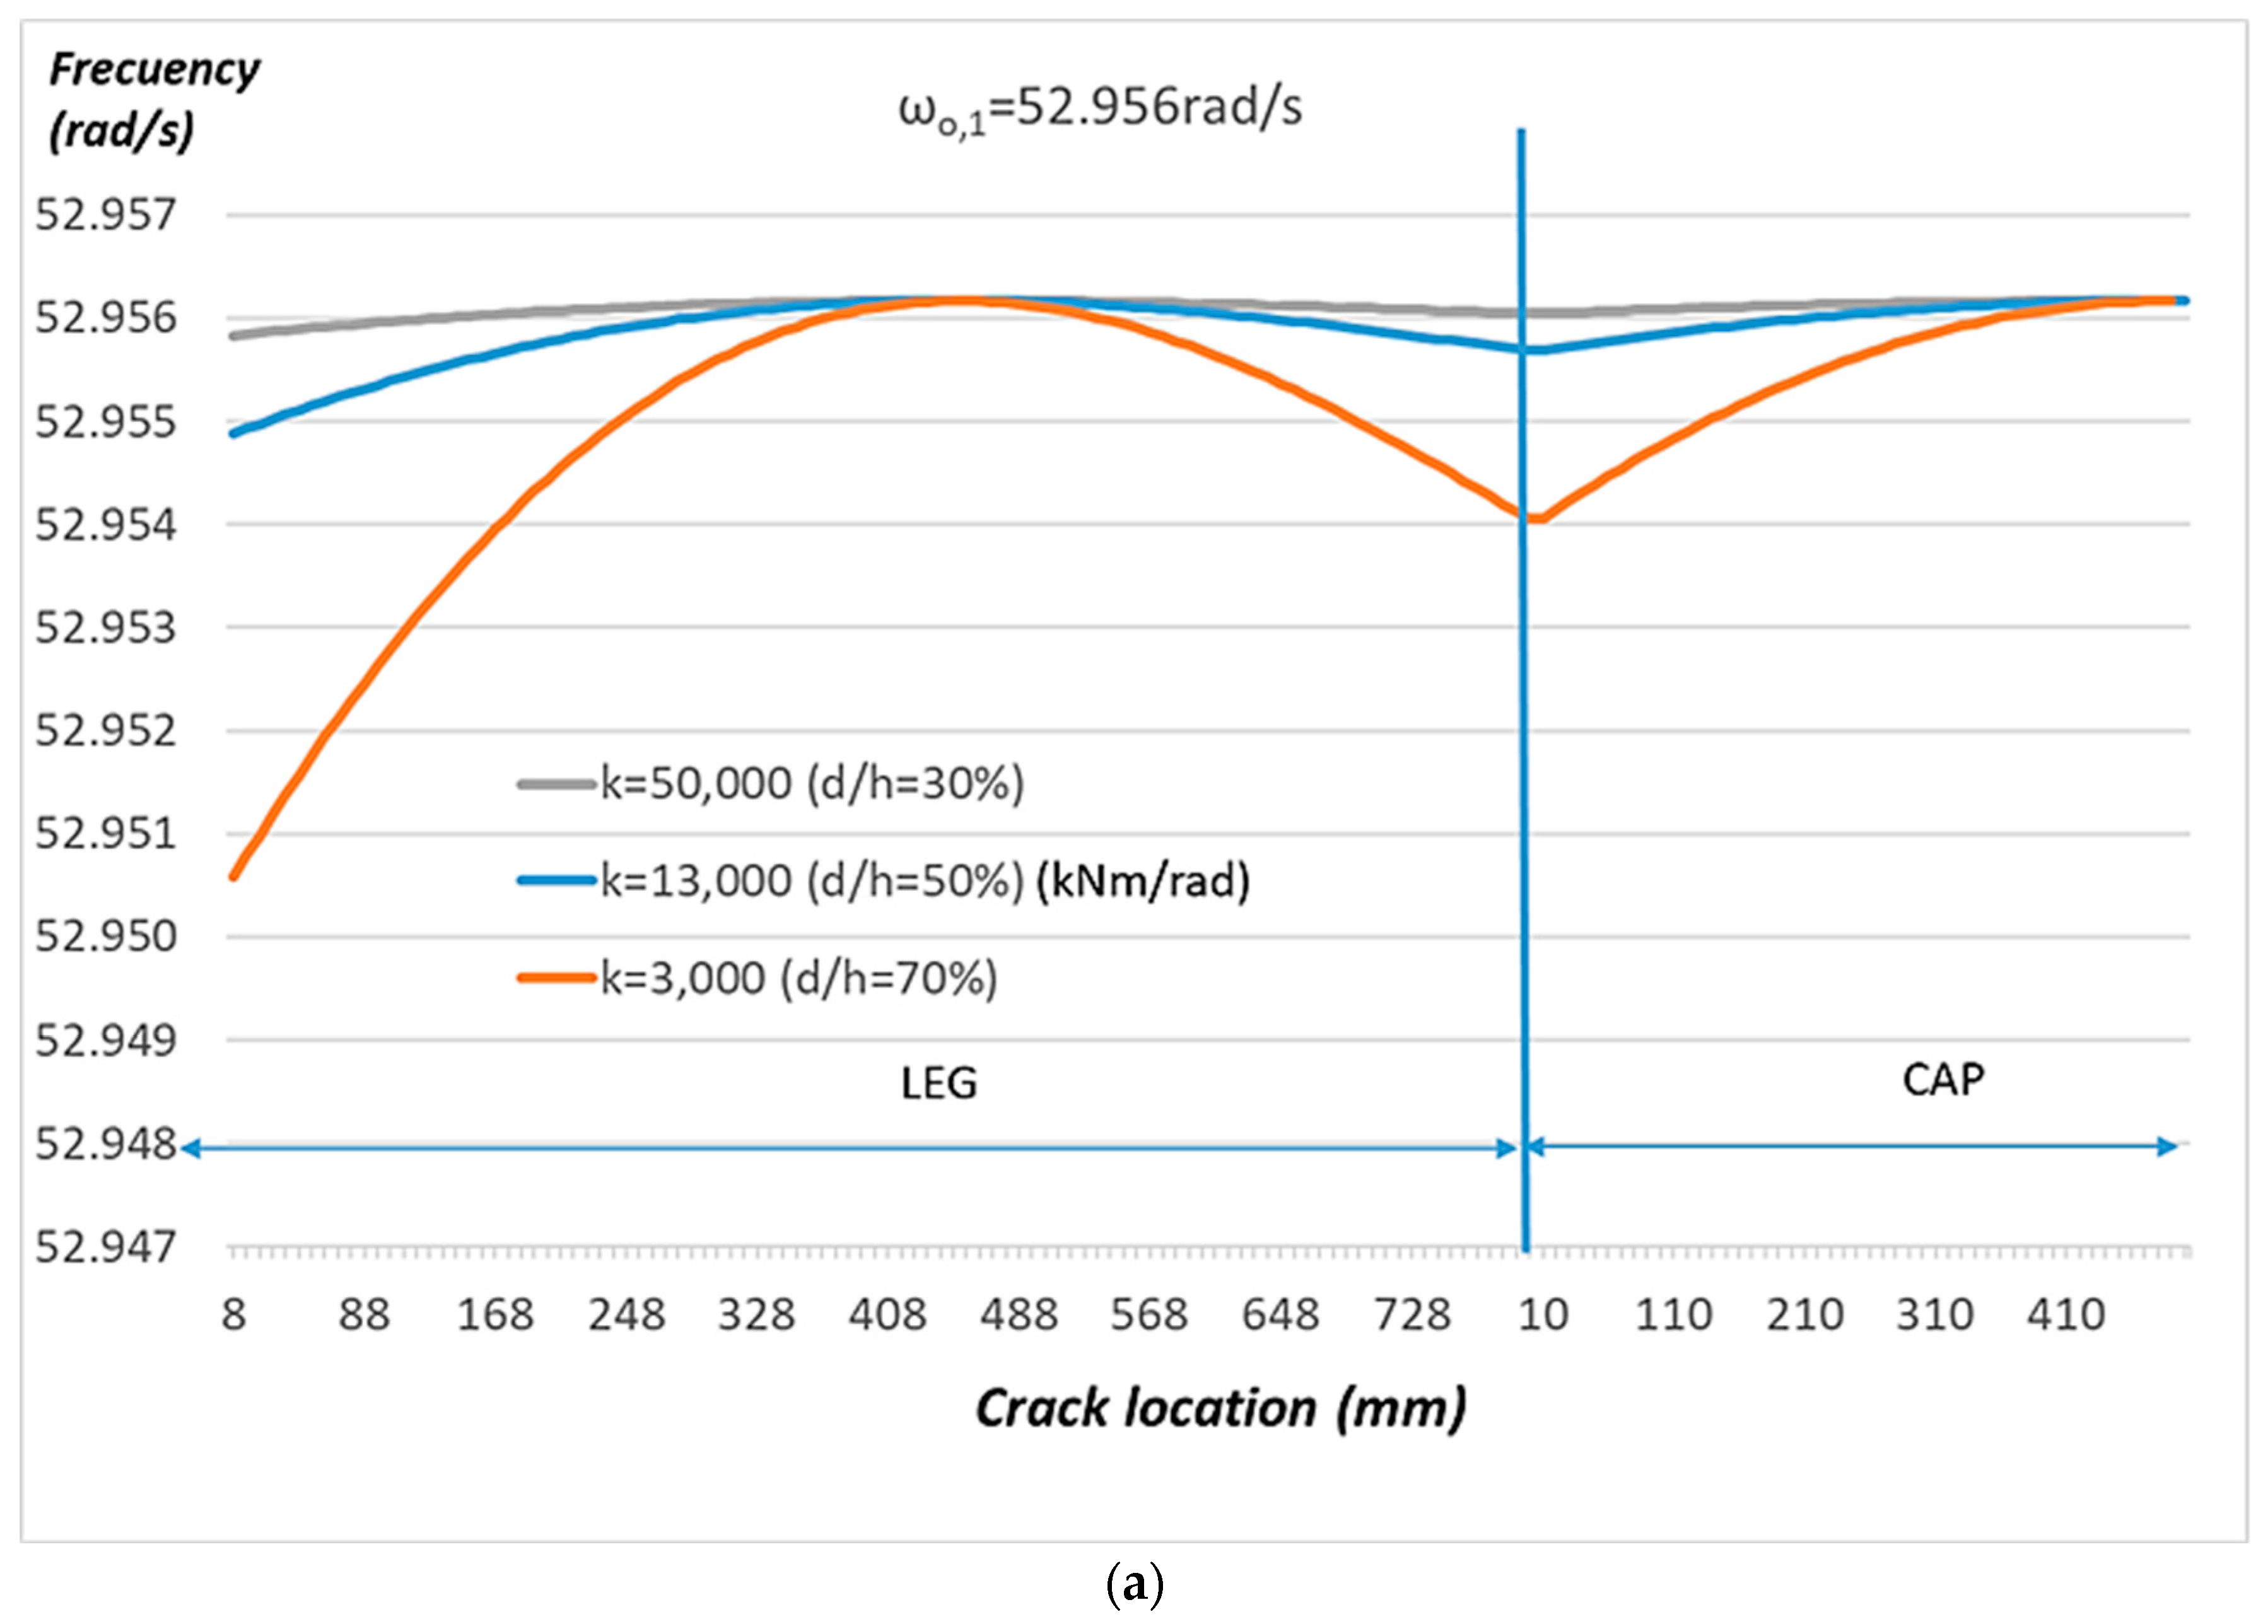
are plotted against the location of the crack in the frame in
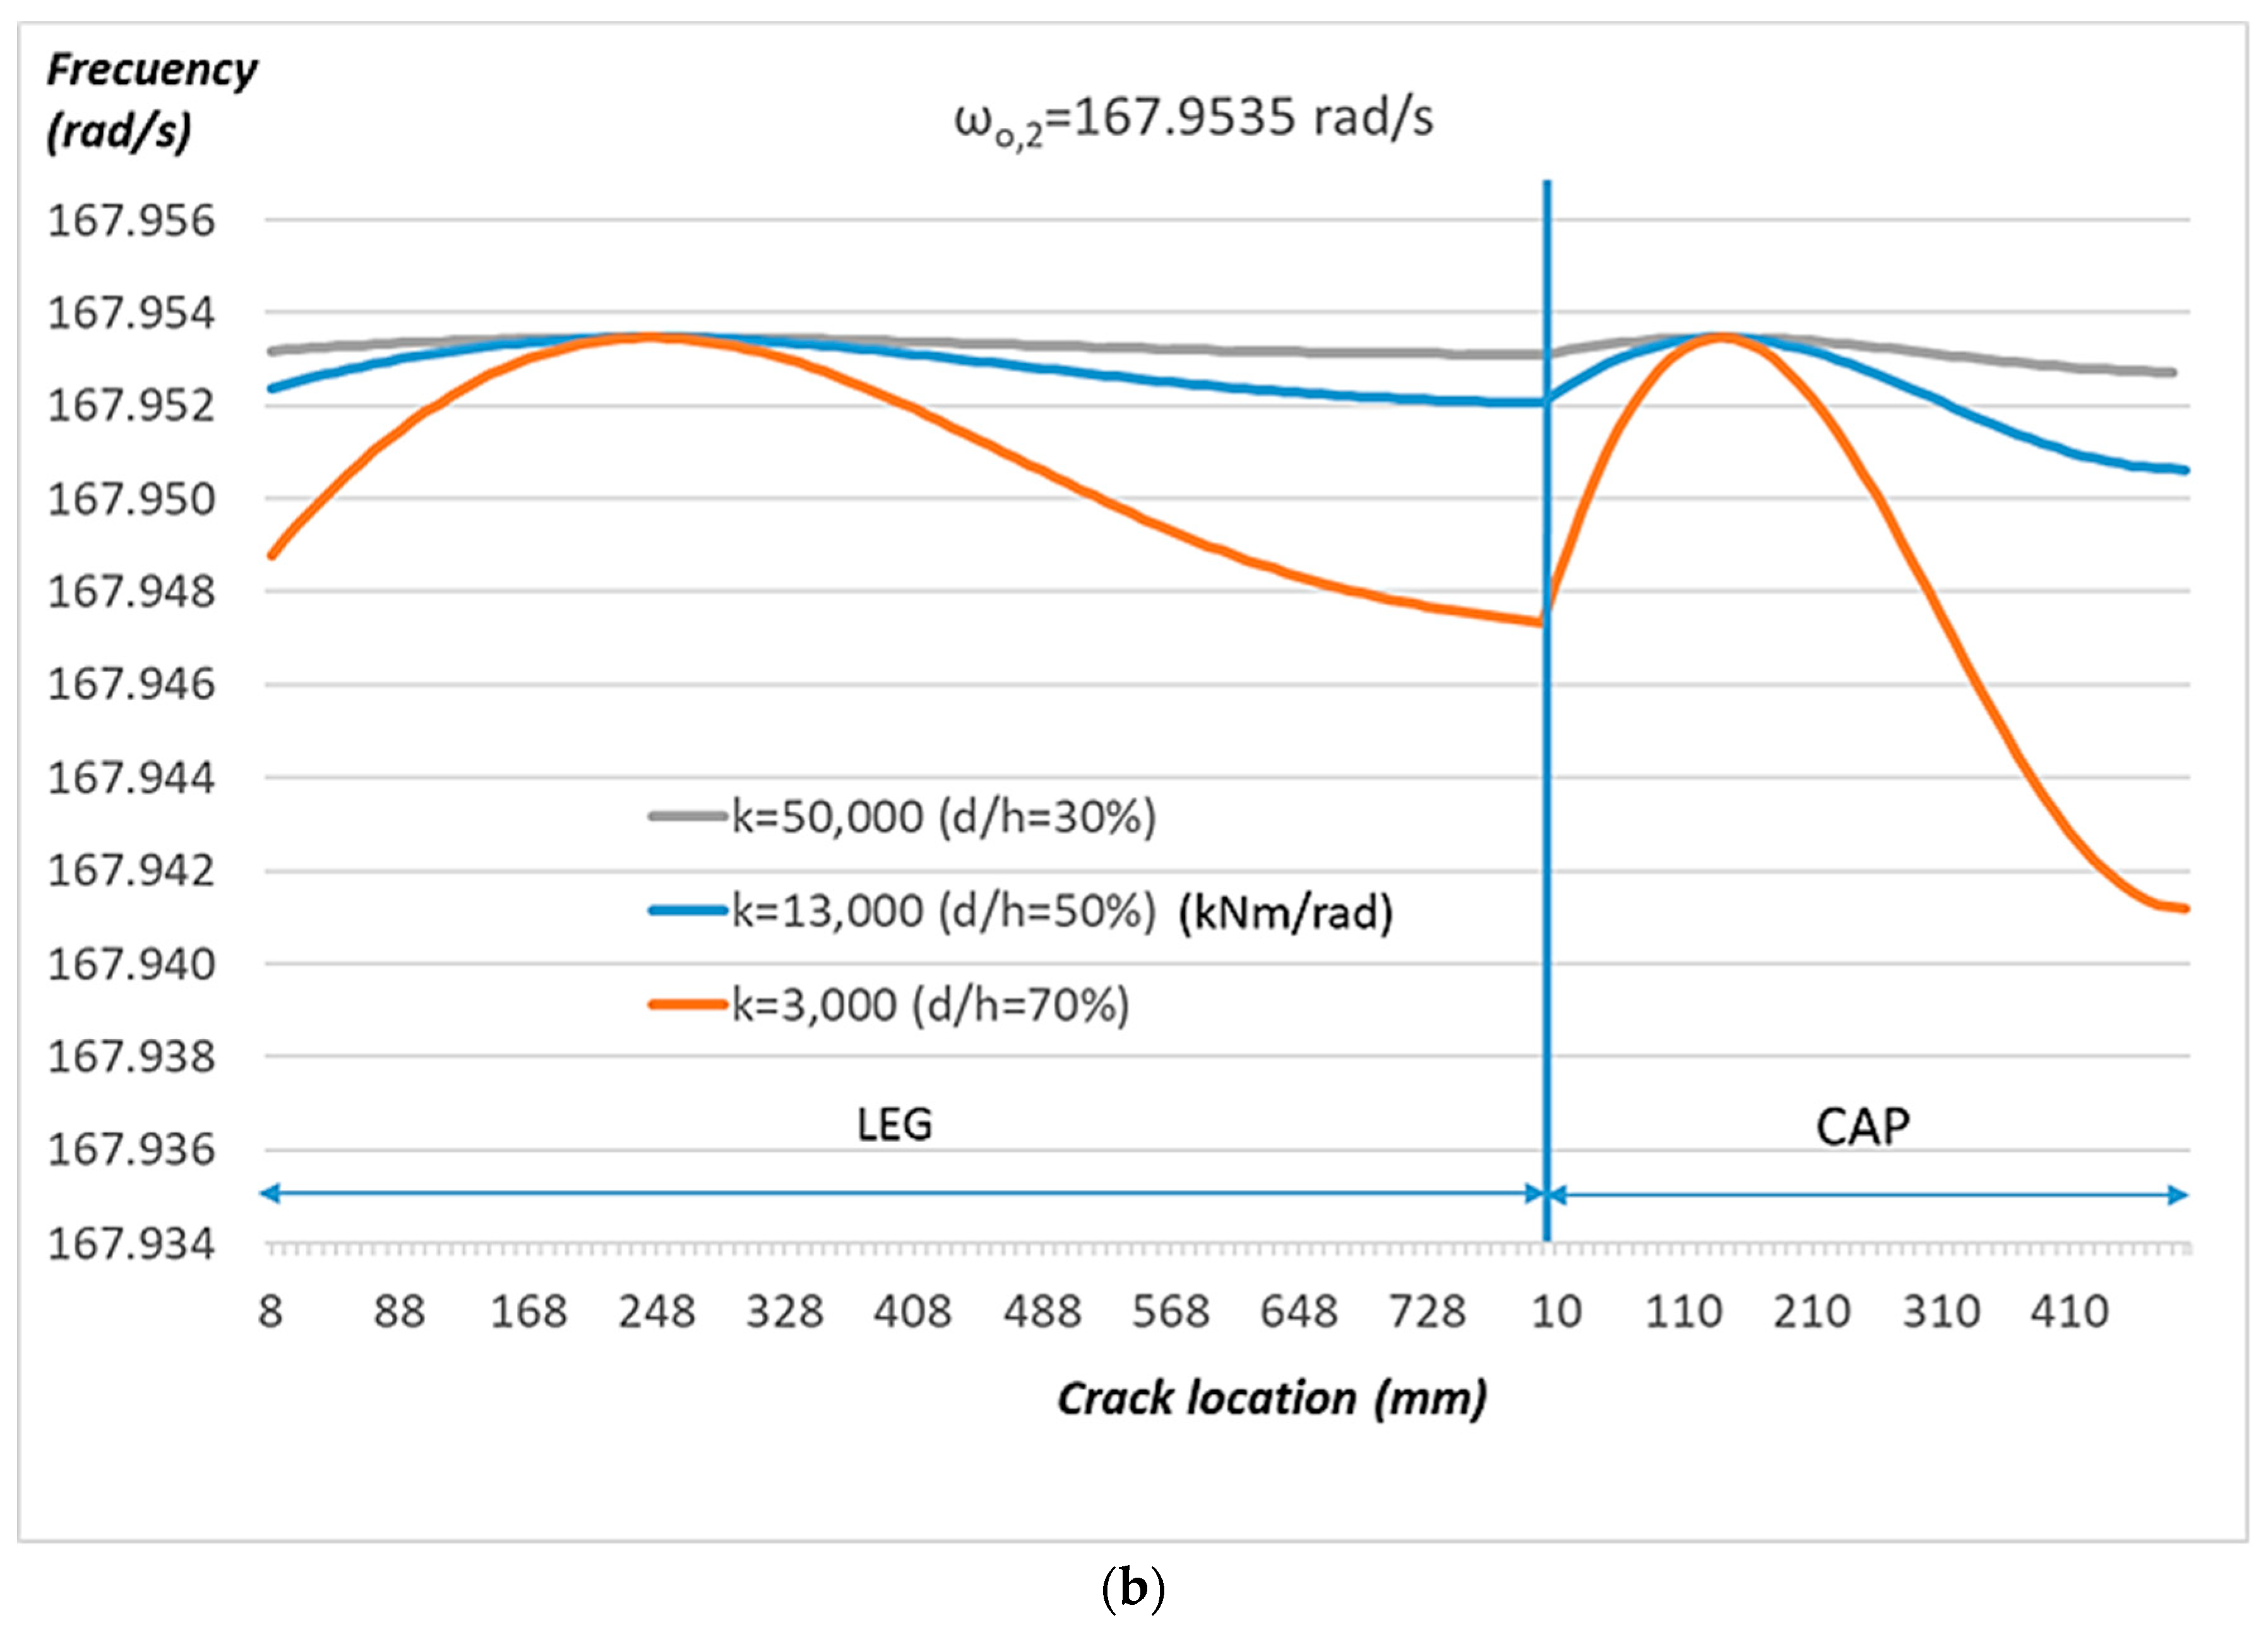
Figure 3a,b, respectively, for three different rotational stiffness values (in kNm/rad). Due to symmetry, cracks located only in the left-hand half of the frame are considered. The location is measured vertically from the base of the left-hand leg, then horizontally along the cap to the centre. The crack in [
16] is a rotational spring with stiffness values obtained from [
20] using the indicated ratios of crack depth to beam thickness (
).
The graphs in
Figure 3a for the first natural frequency
, show a point
, 448 mm above the base of the left-hand leg, where there are no noticeable frequency shifts, irrespective of the value of
. This is a point of contraflexure in the first natural mode where the bending moment
is zero. Now,
is zero, and from Equation (32),
is also zero. So, from Equation (11),
, i.e., the natural frequency of the cracked structure is identical to that of the original structure. The same phenomenon can be seen in
Figure 3b at points 248 mm above the base of the left-hand leg and 130 mm from the left of the cap, which are points of contraflexure of the second natural mode.
3.1. Point of Contraflexure
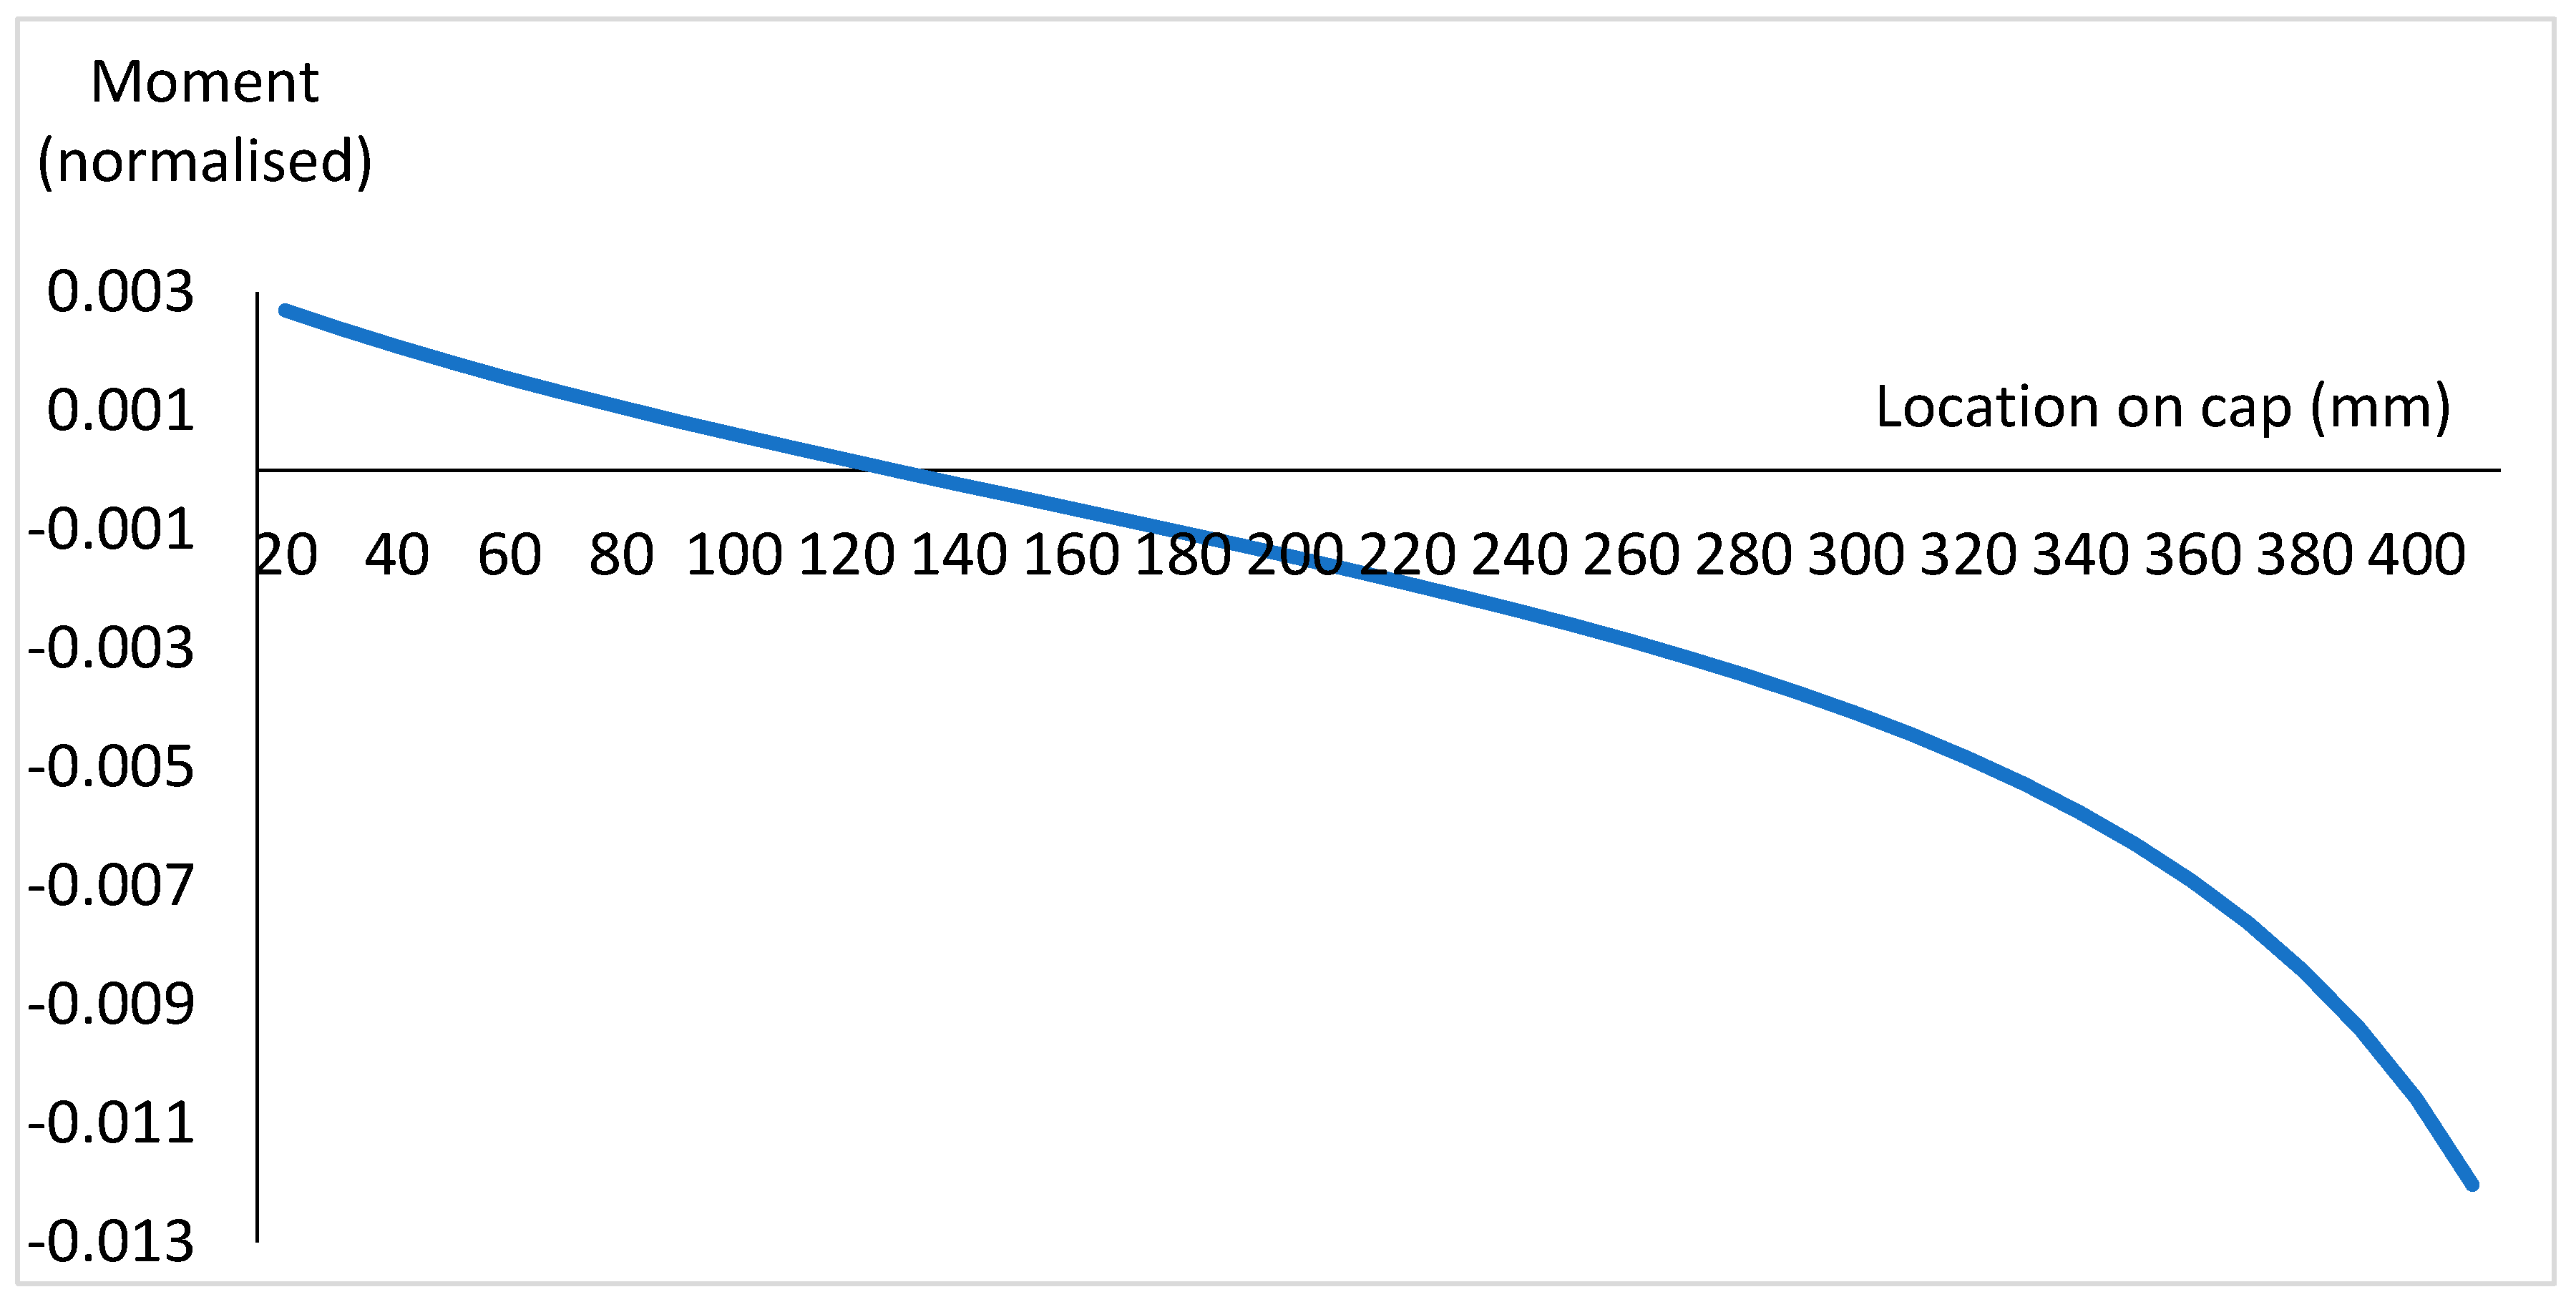
The implication of Equation (32) can be observed in
Figure 4, which shows the variation in the bending moment along the cap when the intact structure vibrates in the second natural mode. The regions where the presence of a crack causes only small changes in the second natural frequency (
Figure 3b) can be seen to match the regions where the bending moment in the original structure for the second natural mode is close to zero (
Figure 4). At a location 130 mm from the left of the cap, the bending moment is zero, and this corresponds to the location in
Figure 3b where the frequency does not change as a result of a crack. This is a point of insensitivity for this mode, corresponding to a point of contraflexure. Similar observations can be made for this mode at a point 248 mm above the base of the left-hand leg, and for the first mode (
Figure 3a) at the mid-span of the cap and 448 mm above the base of the left-hand leg.
3.2. Identifying a Single Crack
Now consider how the crack identification procedure can be applied using Equation (14) and the pseudo-experimental set of cracked natural frequencies used by Greco and Pau [
16], namely
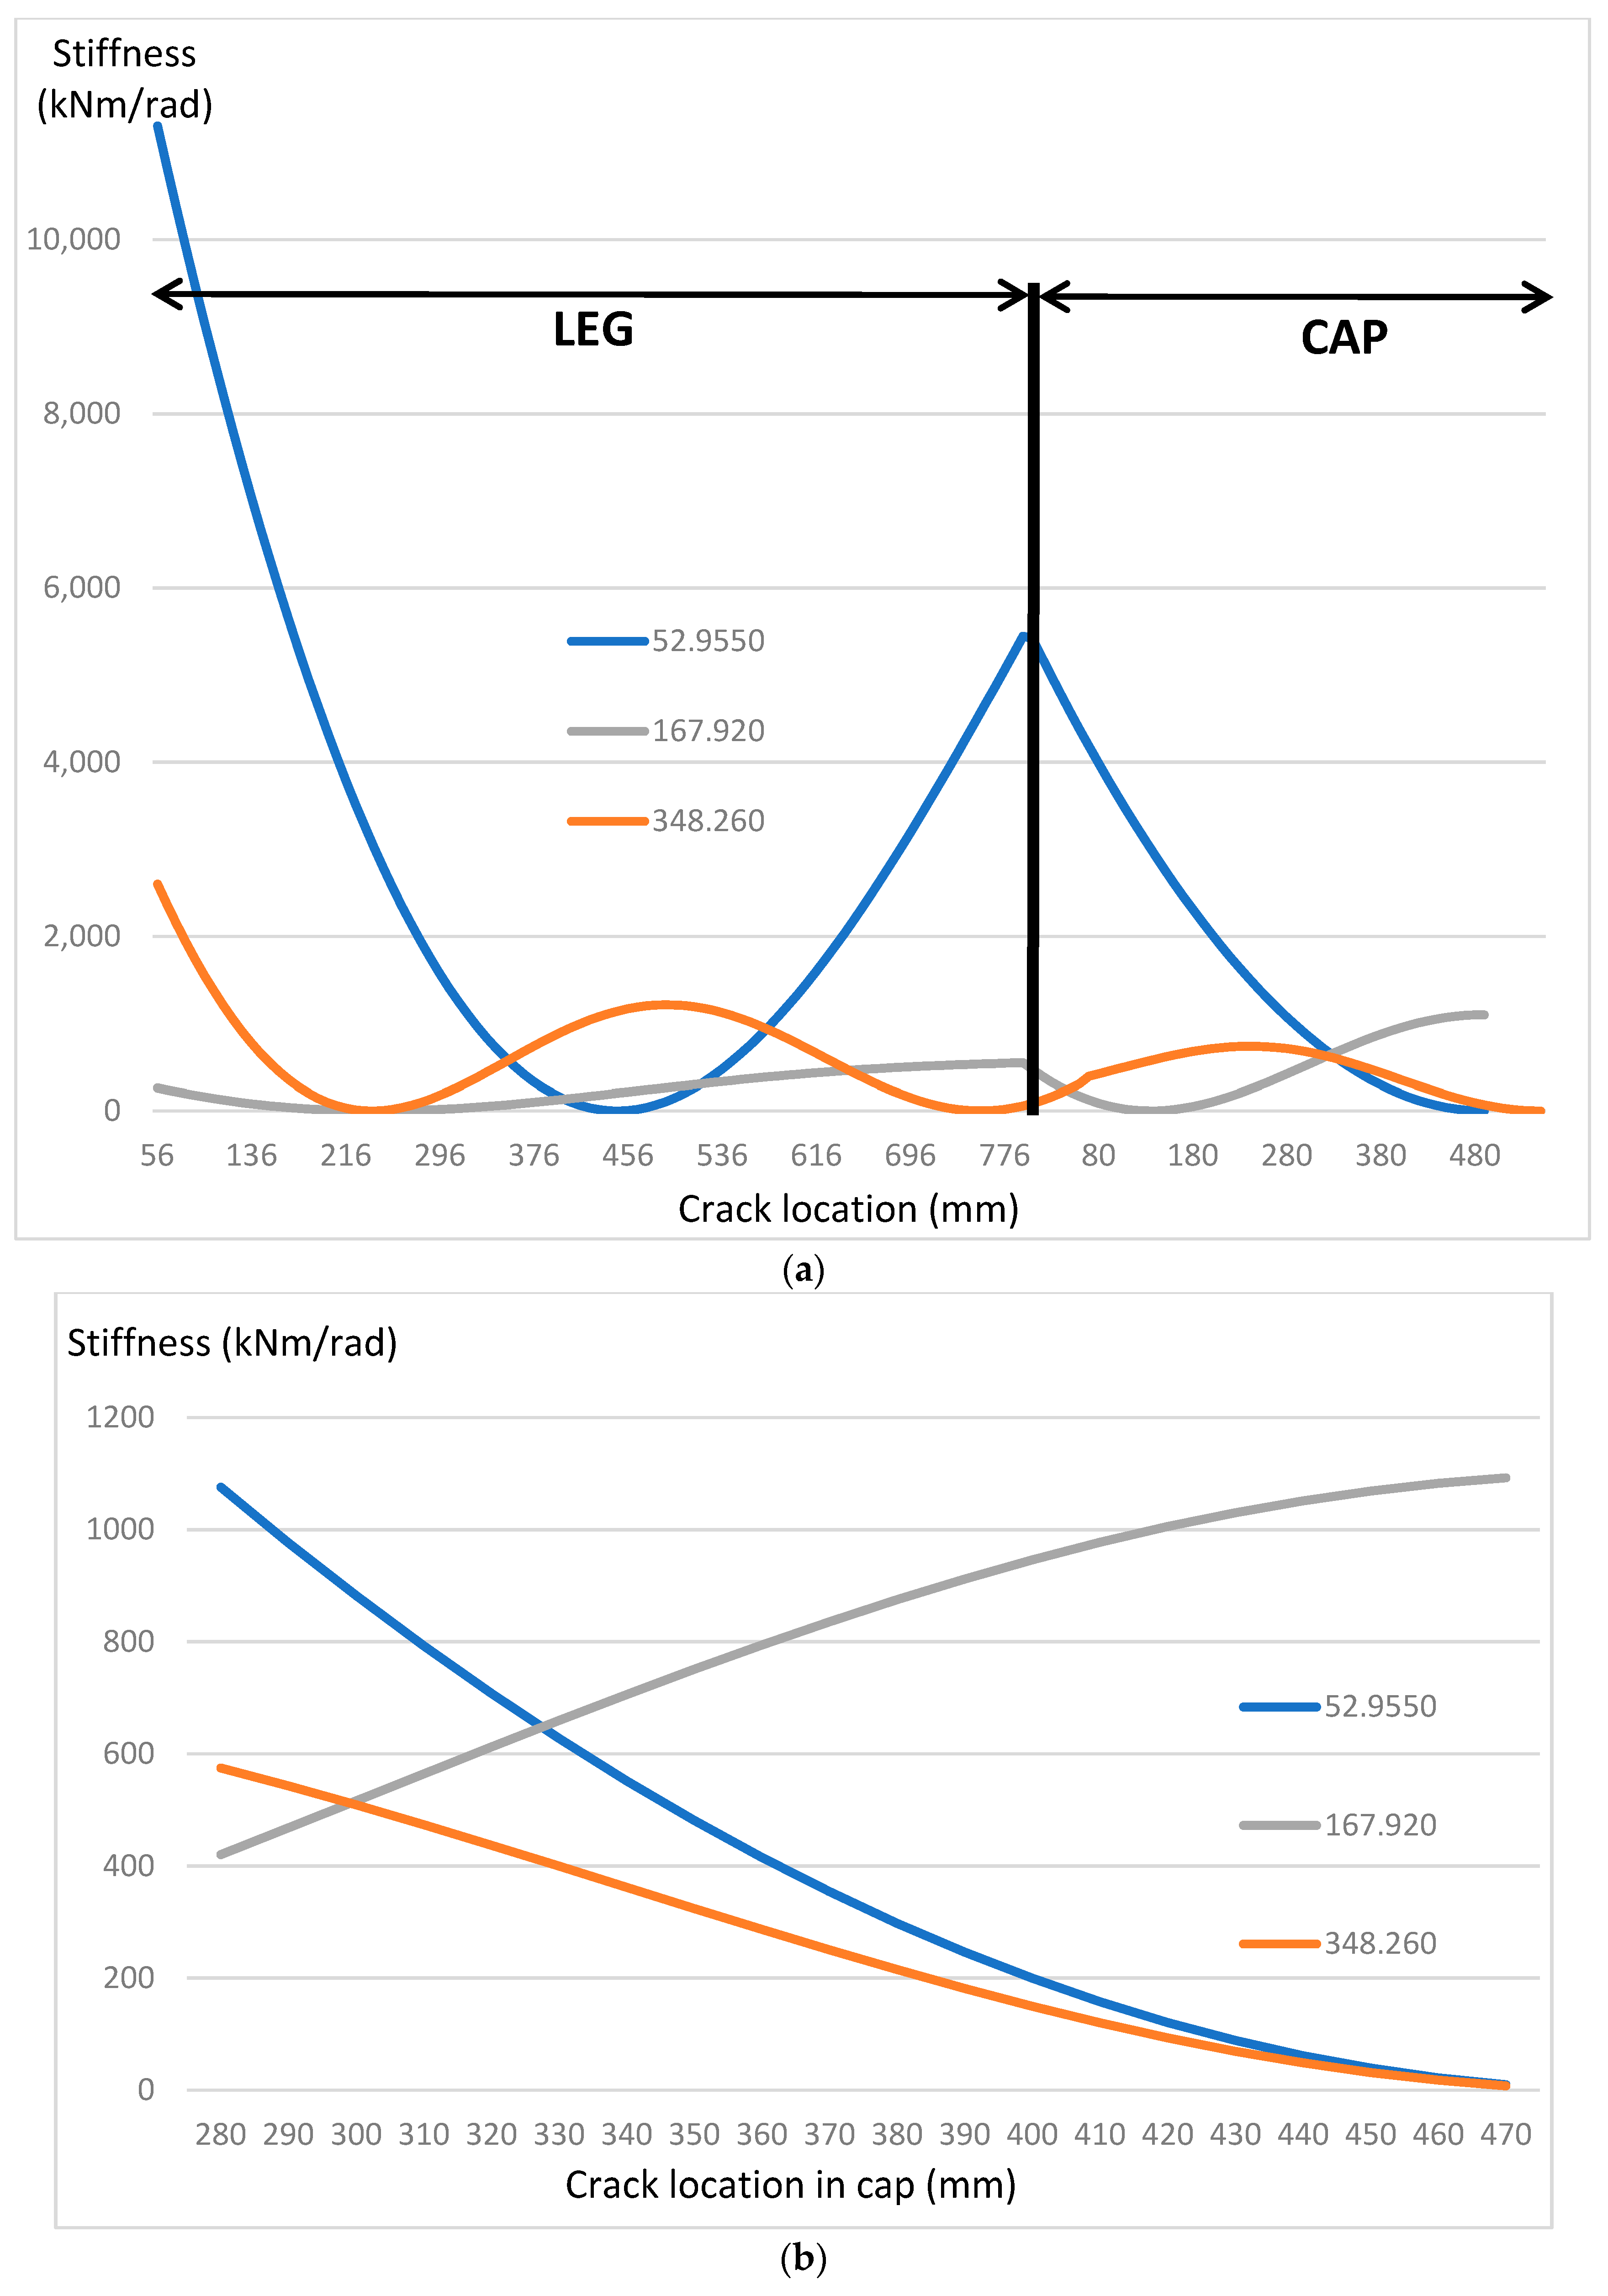
rad/s. For each of these natural frequencies, the rotational stiffness associated with the crack is determined using Equation (14) and plotted against the potential crack location in
Figure 5. It may be seen from
Figure 5a that all three curves appear to meet at approximately 300 to 330 mm from the left of the cap, with a stiffness of approximately 600 kNm/rad (corresponding [
20] to
). The magnified view of this region in
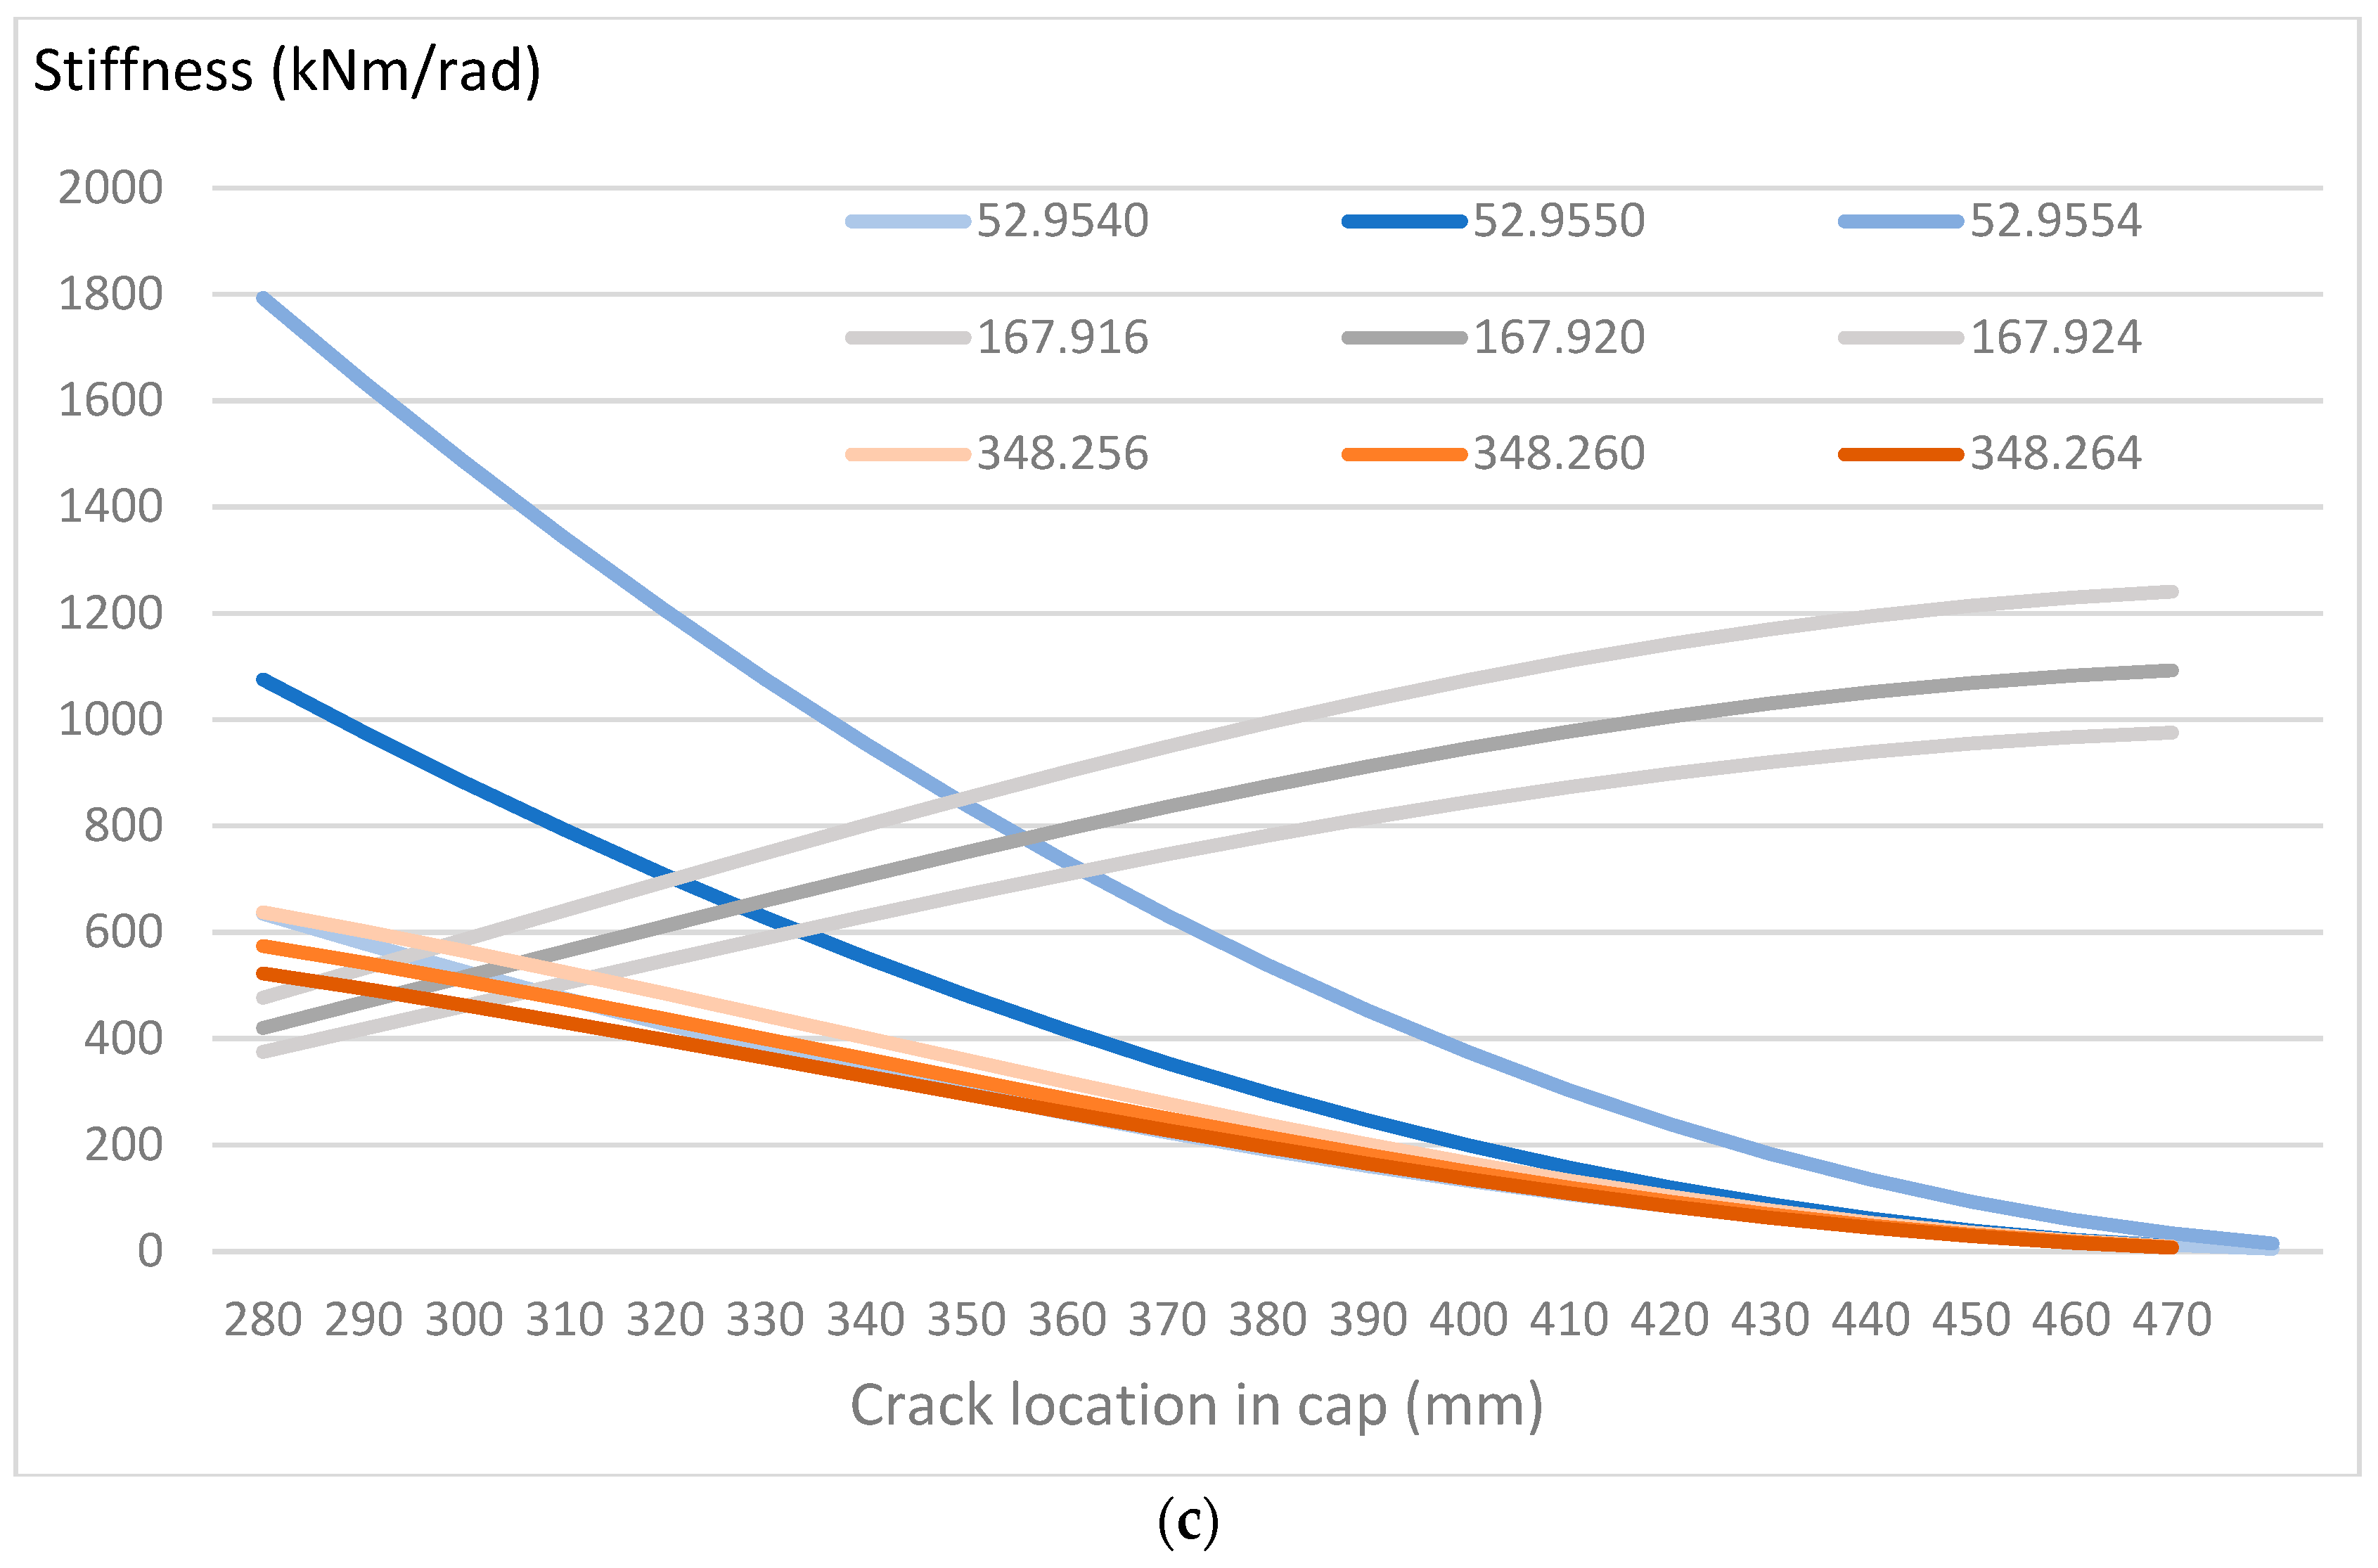
Figure 5b shows that the three curves do not cross at exactly the same point. There are two points of intersection at 300 mm and 330 mm from the left end of the cap, and the crack location is therefore expected to lie in this range. In this particular example, the low value of stiffness gives rise to relatively large changes in the second and third natural frequencies from the intact case. It is also worth noting that the stiffness values are very sensitive to the accuracy of the pseudo-experimental natural frequency data. For example, by simply making small changes to the frequency values used to generate the curves, substantial shifts in the calculated spring stiffness are observed, as shown in
Figure 5c. The range of potential crack location now expands to between 290 mm and 360 mm from the left end of the cap, and the predicted spring stiffness lies between 450 kNm/rad and 850 kNm/rad. Thus, while Equation (14) facilitates the determination of the location and severity of a single crack without the need to solve any eigenvalue problem, it must be noted that the calculated severity is susceptible to large errors due to any experimental noise, but the location of the crack can be confined to a small region, within which the crack might be accurately located by a visual search or other means.
In order to validate this approach, a finite element (FE) model of the portal frame was created with line elements in ANSYS
® Workbench 17.2 [
21] where the stiffness and mass matrices are created separately. The crack was modelled as a reduction in the thickness of the beam, while the breadth remained at 40mm and the height-reduced segment of the beam was located such that the centroidal axis was continuous. A reduction of 75% in the thickness leading to a final thickness of 2 mm was located at a distance of 560 mm from the bottom of the left leg. After a convergence test, it was found that a mesh of 141 Beam188 elements [
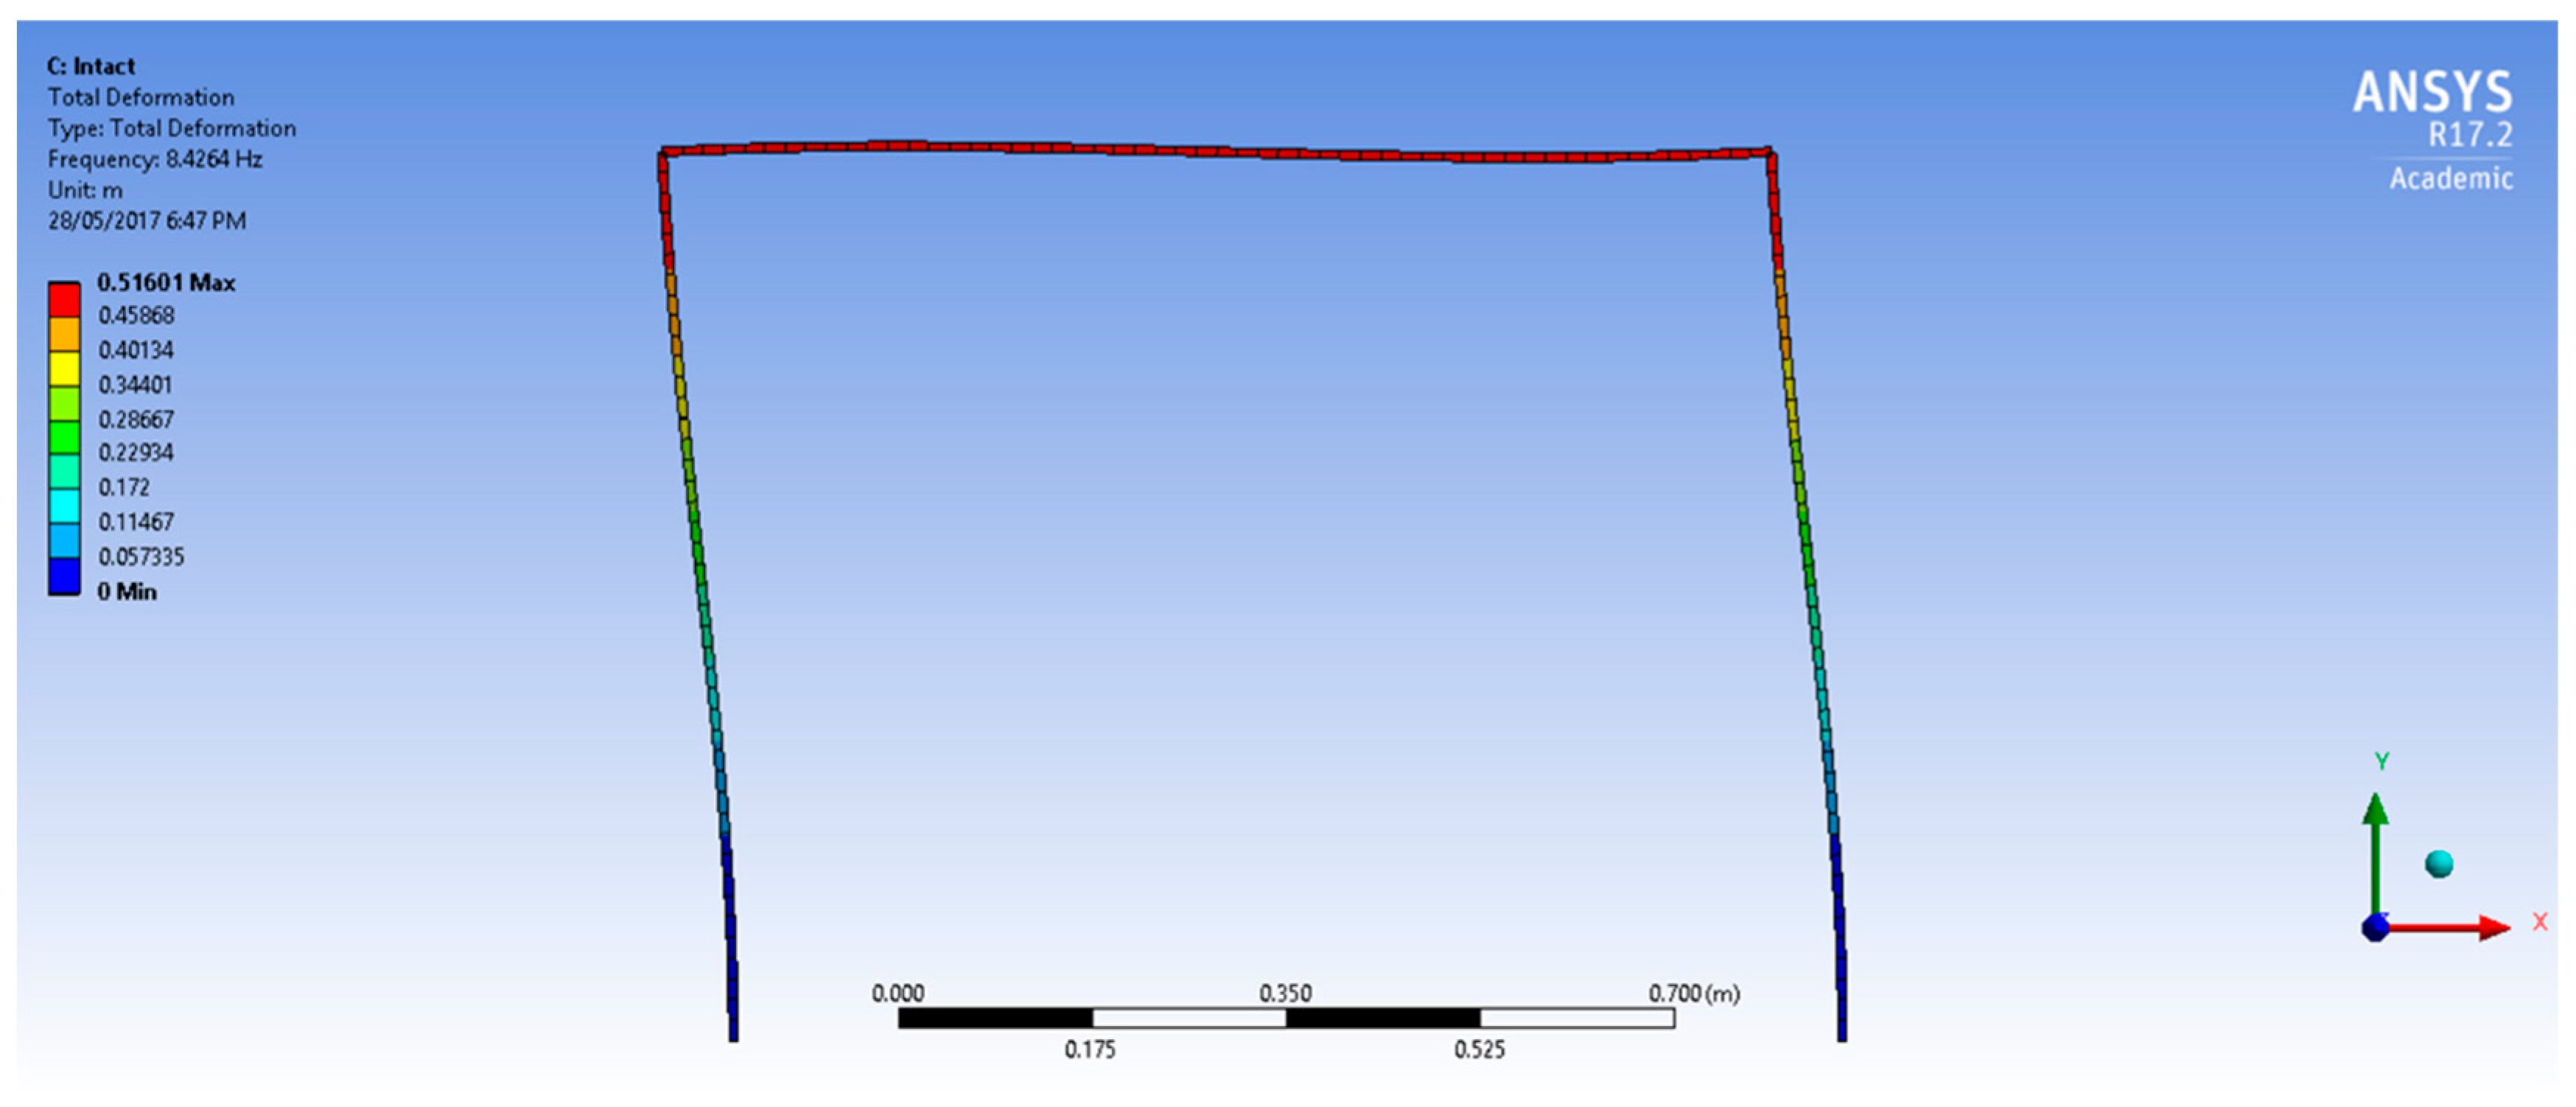
21] would give enough reliability. The first mode shape for the undamaged frame is shown in
Figure 6.
Table 1 shows the first three natural frequencies of the intact and cracked frames obtained using FE and DSM. It can be noted that the values obtained for the intact frame using the two methods agree very closely. However, there are greater differences when the crack is introduced, which can be attributed to the assumptions made in the calculation of the rotational stiffness used in the DSM model. Despite these differences, a comparison between the two results reveals similar trends in the reduction in each of the frequencies due to the crack.
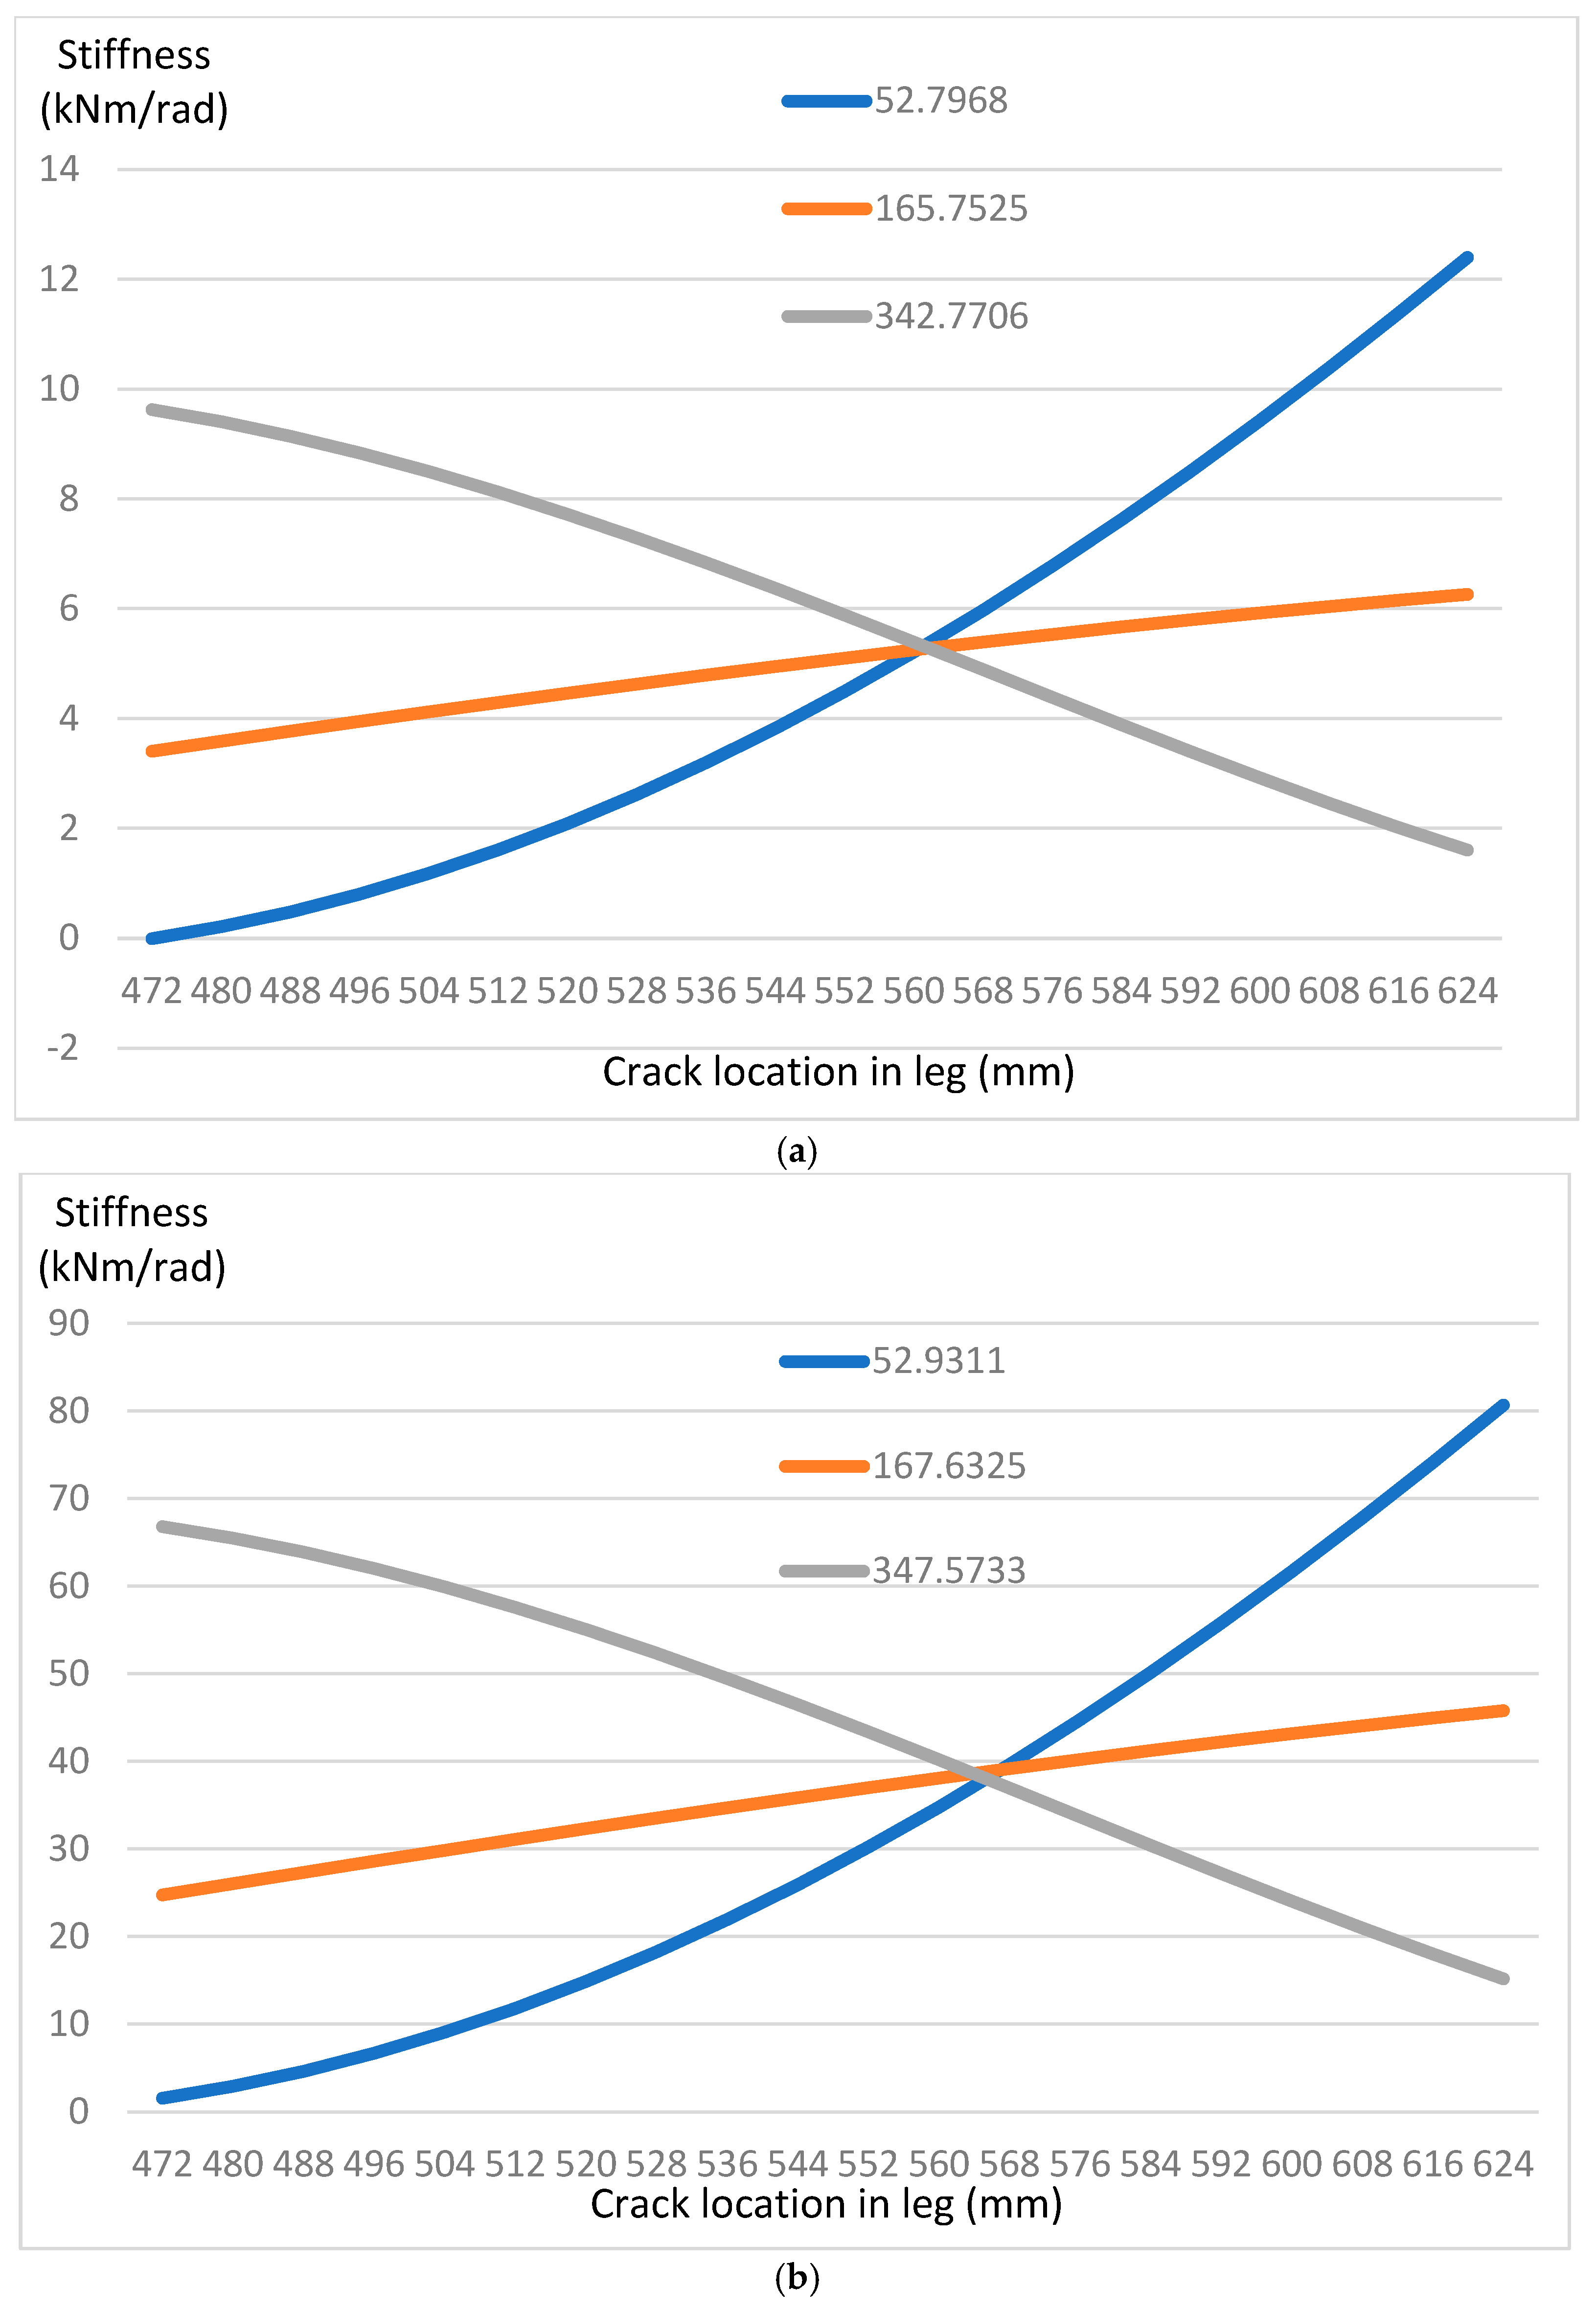
Figure 7a plots the crack stiffness against location in the leg for the first three modes, found by applying Equation (14) at the cracked natural frequencies found by FE. All three curves appear to merge at approximately 560 mm from the bottom of the leg, which is where the damage was introduced in the FE model. This shows that while the estimate of the crack stiffness based on experimental measurements may be very sensitive to frequency values (this is understandable from the fact that the reduction in stiffness due to cracks causes only very small changes in the frequencies), the identification of the crack location is less sensitive and is likely to be less affected by experimental noise. The main difference between the work by Greco and Pau [
16] and what is presented here is that Equation (14) enables direct calculation of the crack stiffness without the need to find the natural frequencies by solving the transcendental eigenvalue equations. This greatly speeds up the solution to the inverse problem.
The calculations are repeated in
Figure 7b for a lower crack severity to take account of the limitation of 50% on crack depth to thickness ratio proposed by Chondros et al. [
20]. The results again show that the crack location used in the FE simulation is close to the zone where the three curves for the stiffness based on Equation (14) meet. Two important points are mentioned. Firstly, Equation (14) can be used to directly calculate the stiffness at potential crack locations. By plotting these curves for various modes, the location of the crack can be identified independently of the crack severity. Secondly, the ability to perform damage location even with cracks of high severity is demonstrated above with the 75% crack. However, the determination of crack severity from measured frequencies is not likely to be as reliable as the location of the crack because of the high sensitivity of the predicted stiffness to the frequency measurements. Nevertheless, finding the crack location is practically very useful, and once the crack is located, other methods may be used to assess the extent of the crack if needed before taking measures to repair or replace the affected part.
The above example shows how the stiffness vs. possible crack location plots based on multiple frequency measurements can be examined to locate a crack and estimate its severity. A similar method is employed in [
22,
23] based on energy shifts between cracked and uncracked structures and the notion that the cracked beam can be considered as an uncracked beam having and equivalent reduced flexural rigidity based on the changes in tip displacement due to self-weight and that this equivalent value would also give the correct frequencies. This seems to be an approximation as the deflection ratios calculated based on reduced flexibility rely on the strain energy associated with the shape of static deformation due to self-weight. Nevertheless, the method seems to work well. The frequency shift calculated in this way leads to a numerical procedure to locate the cracks.
It is also worth noting that there are also papers that show how a roving body could be used to first identify the location of the crack in beams and plates [
24,
25]. However, these methods suffer from the limitation that they cannot be used in structures where placement of a roving body is difficult.
The feasibility of the presented method for practical applications remains to be verified through experimental work. In general, the feasibility of frequency shift measurements for structural health monitoring depends on many factors, including the ductility of the material [
26].
3.3. Use of Approximate Linear Relationships to Find Frequencies of Cracked Structures
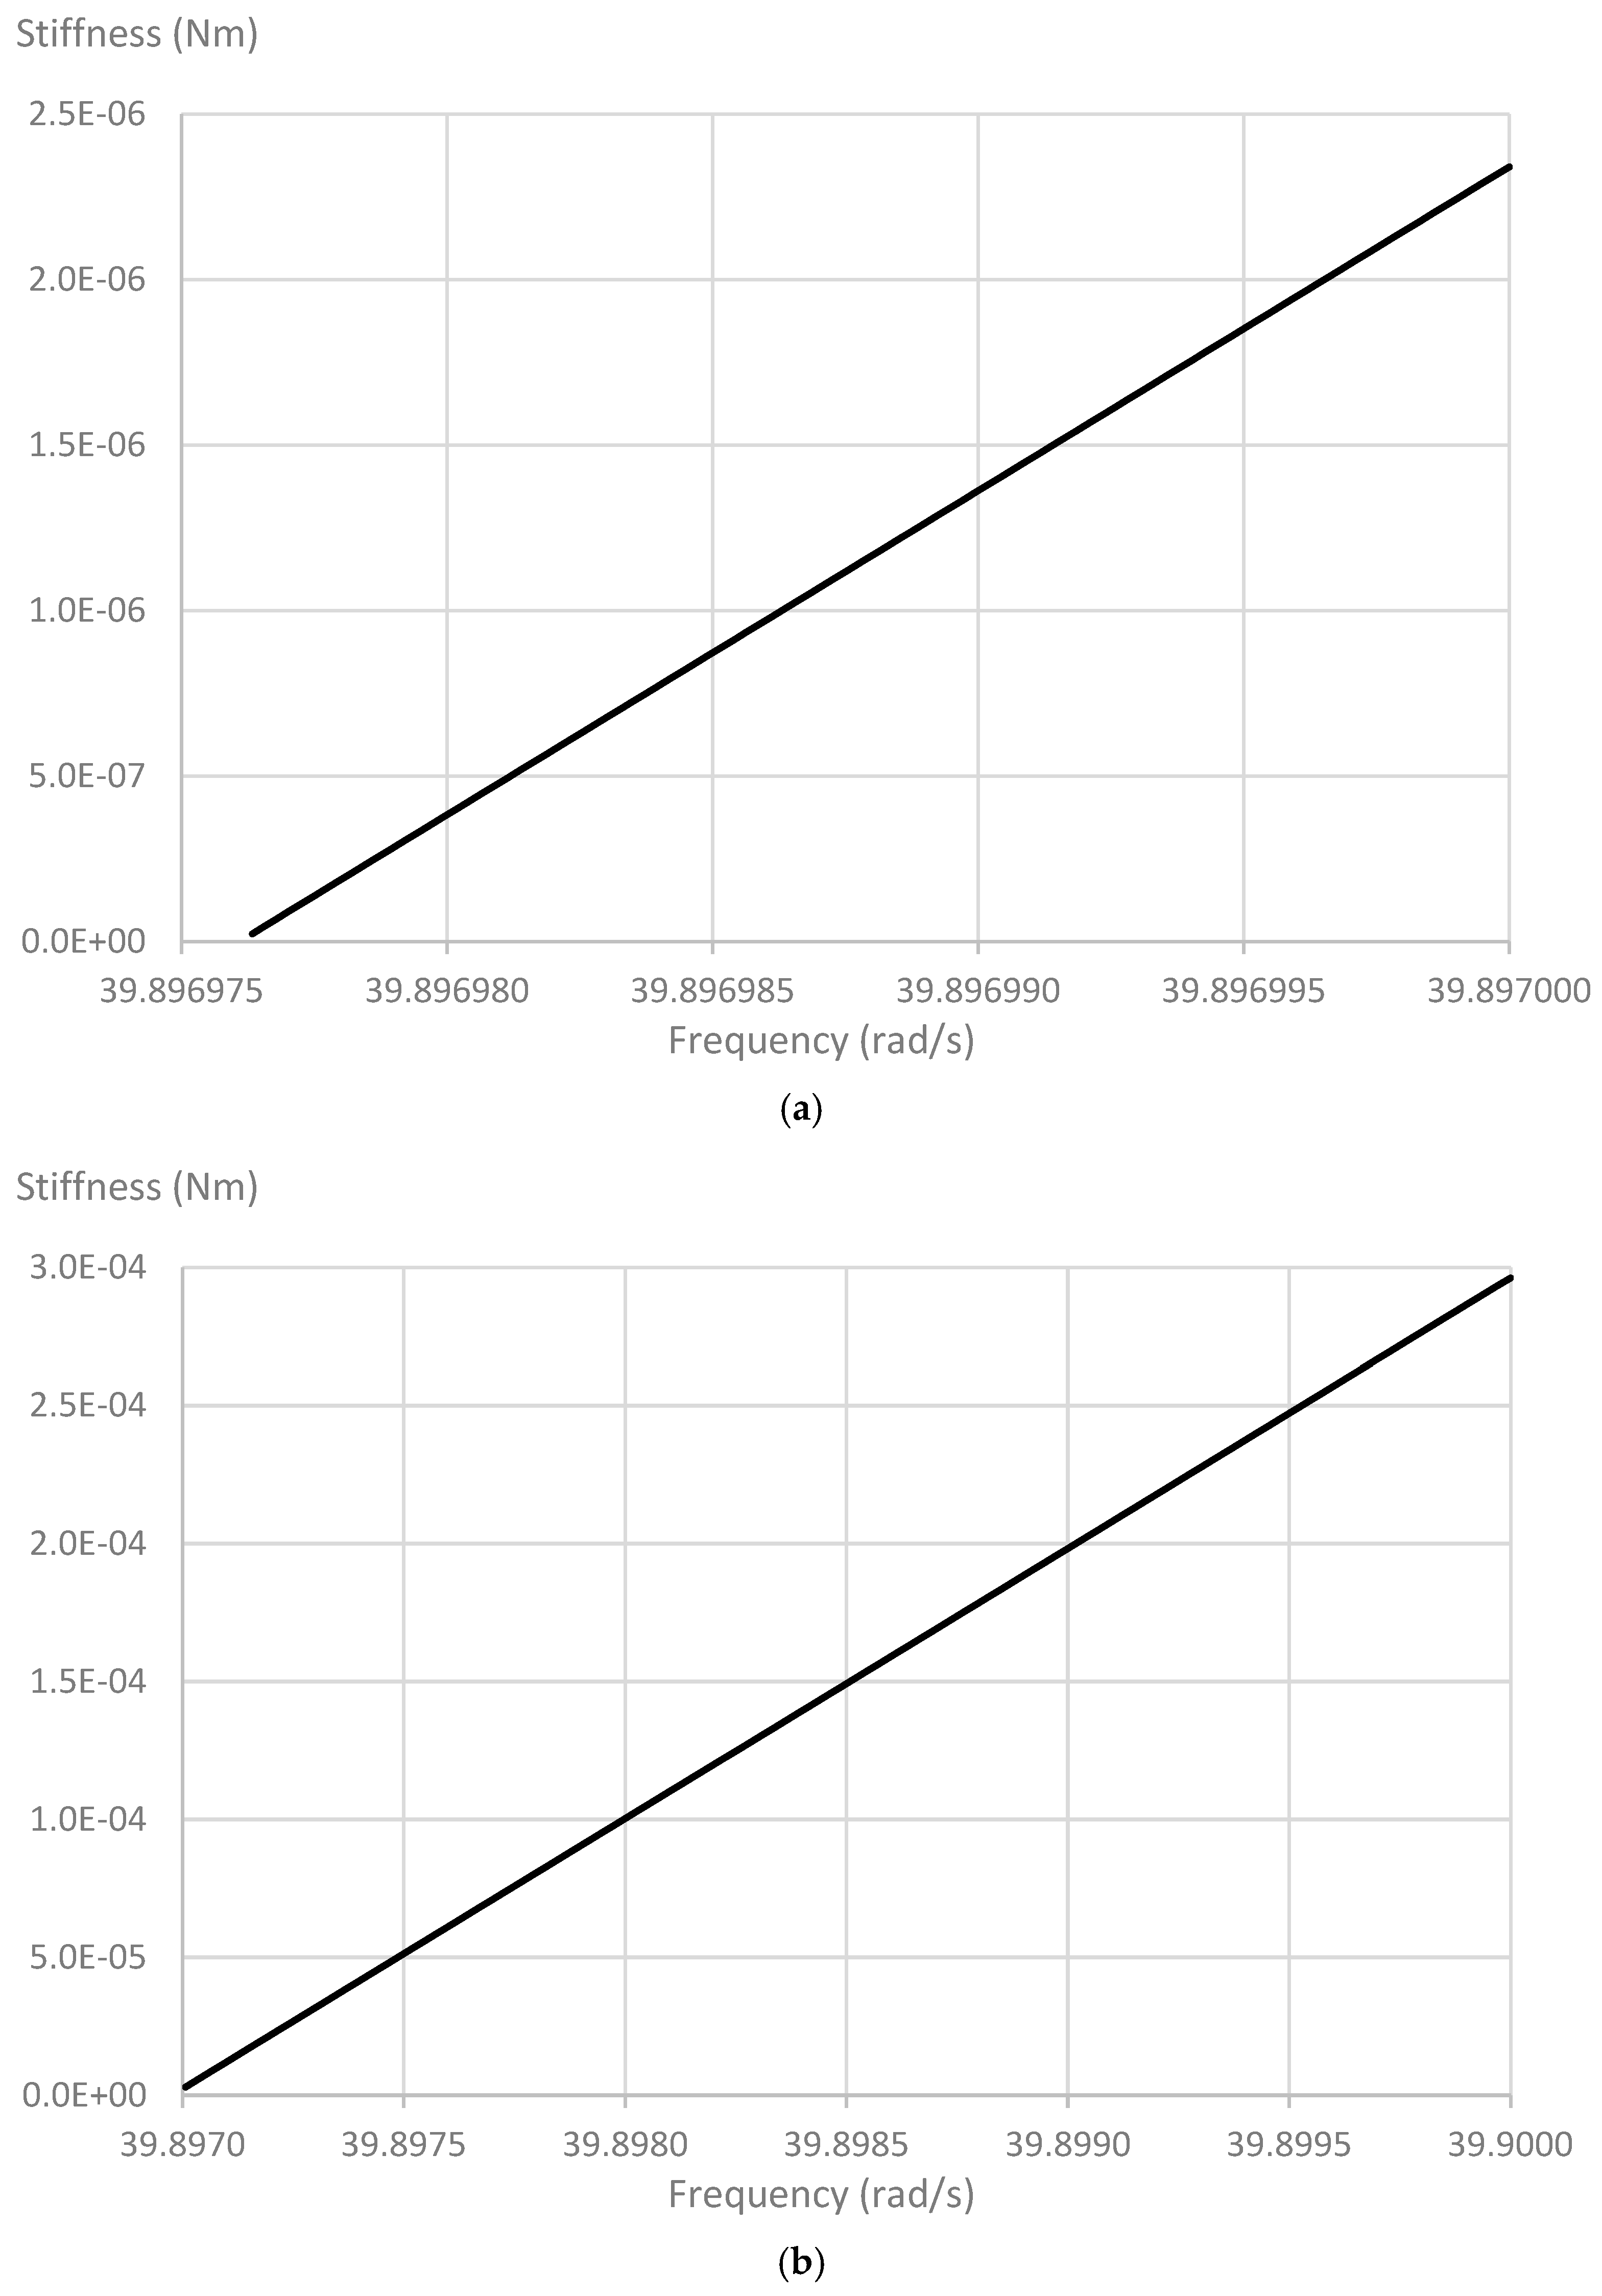
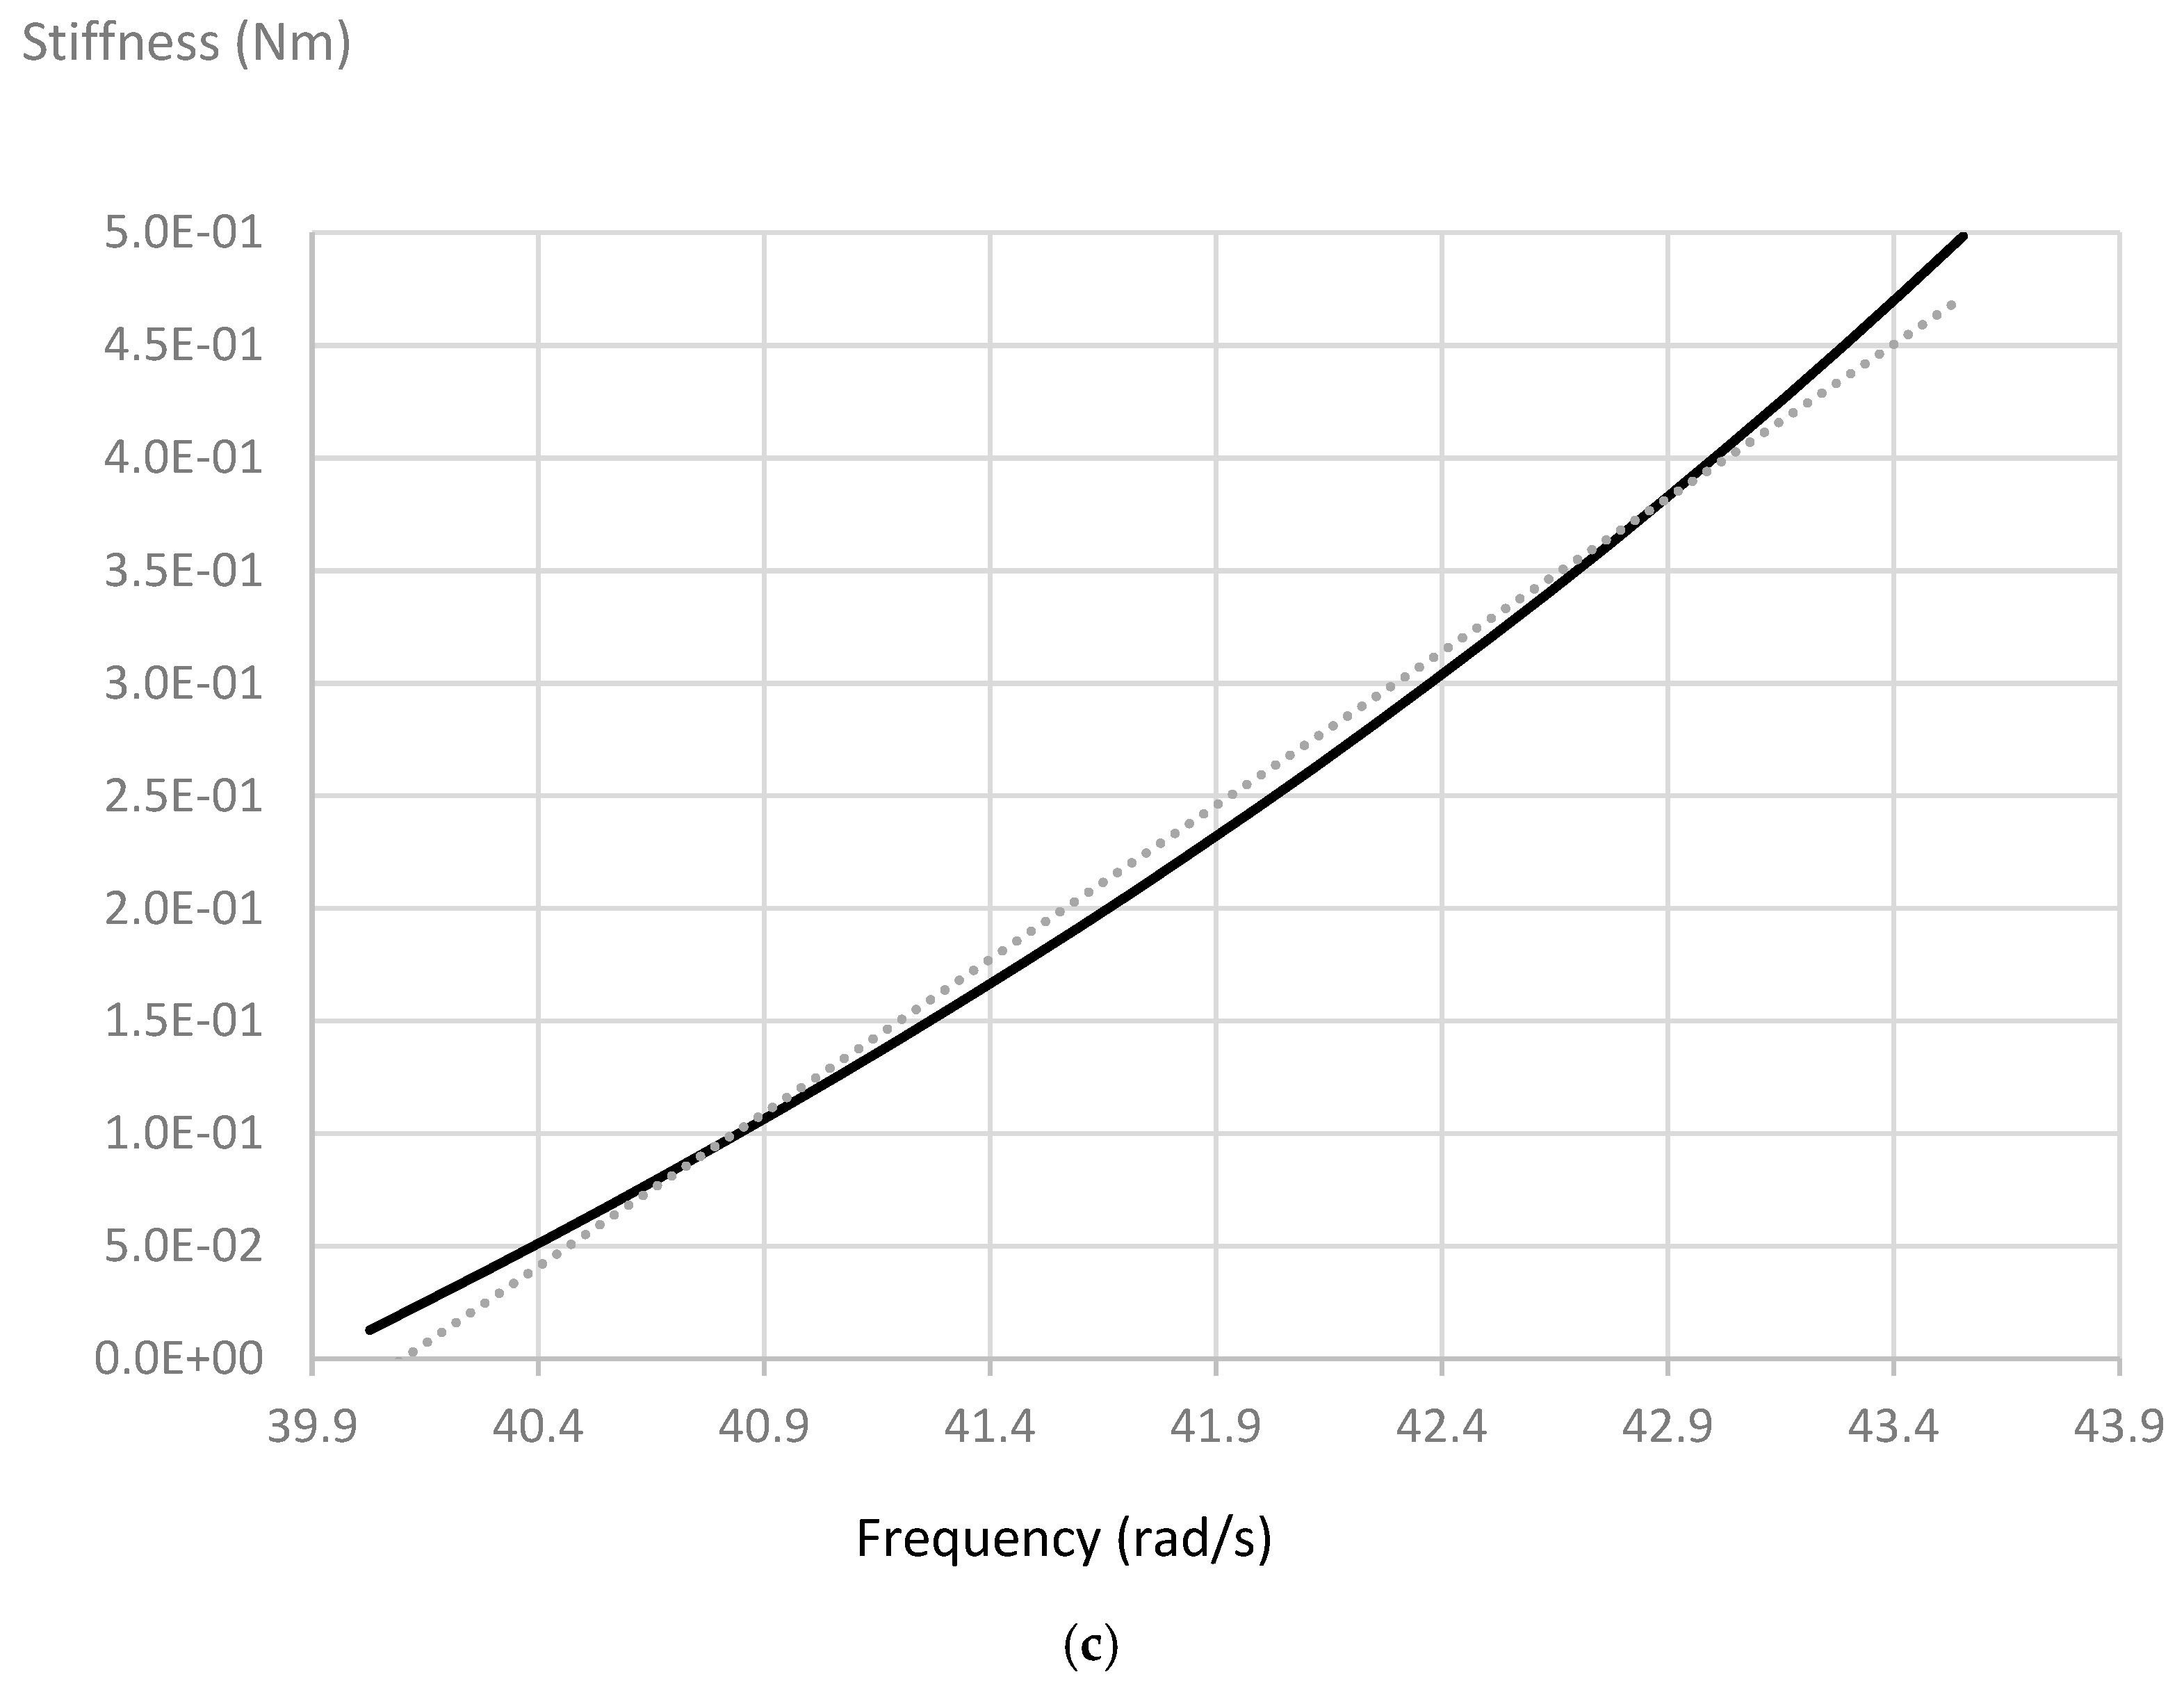
The exact stiffness–frequency relationship in Equation (14) was used to test the validity of the approximate linear relationships for cracks of low and high severity given in Equations (23) and (29), respectively. The results for the first natural frequency of the above frame, with a crack located 8mm above the base of the left leg, are presented in
Figure 8 and
Figure 9.
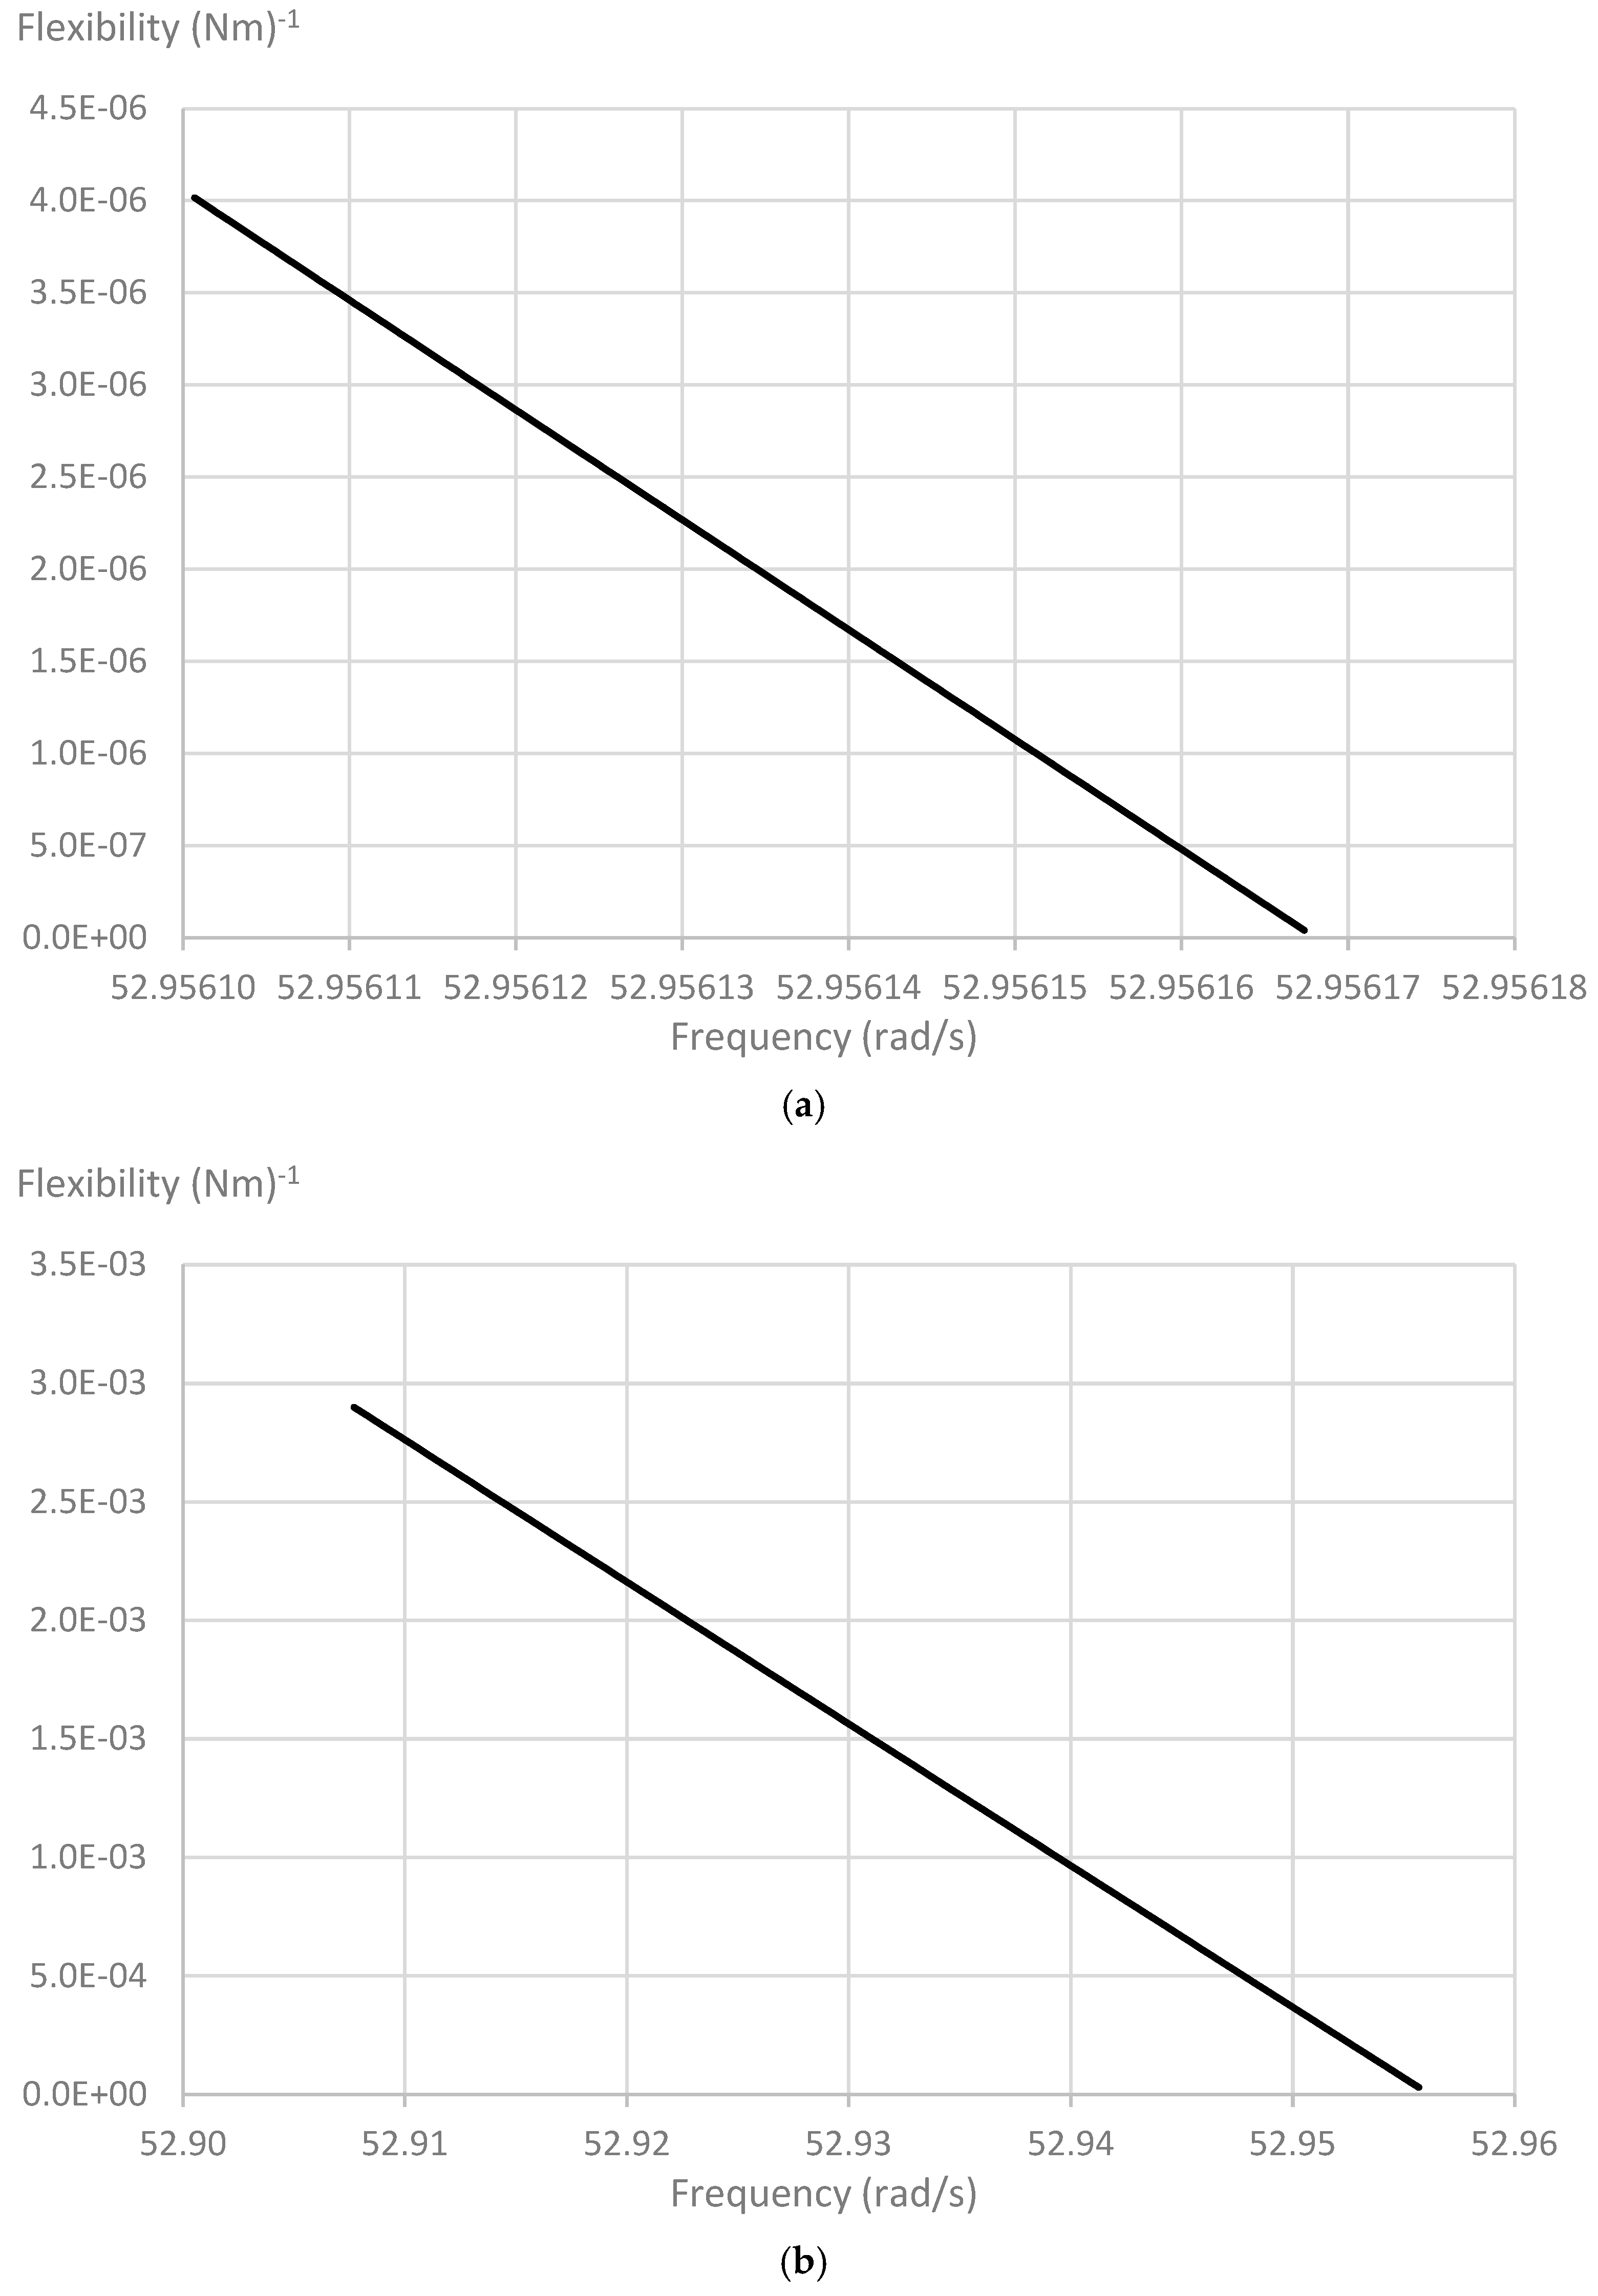
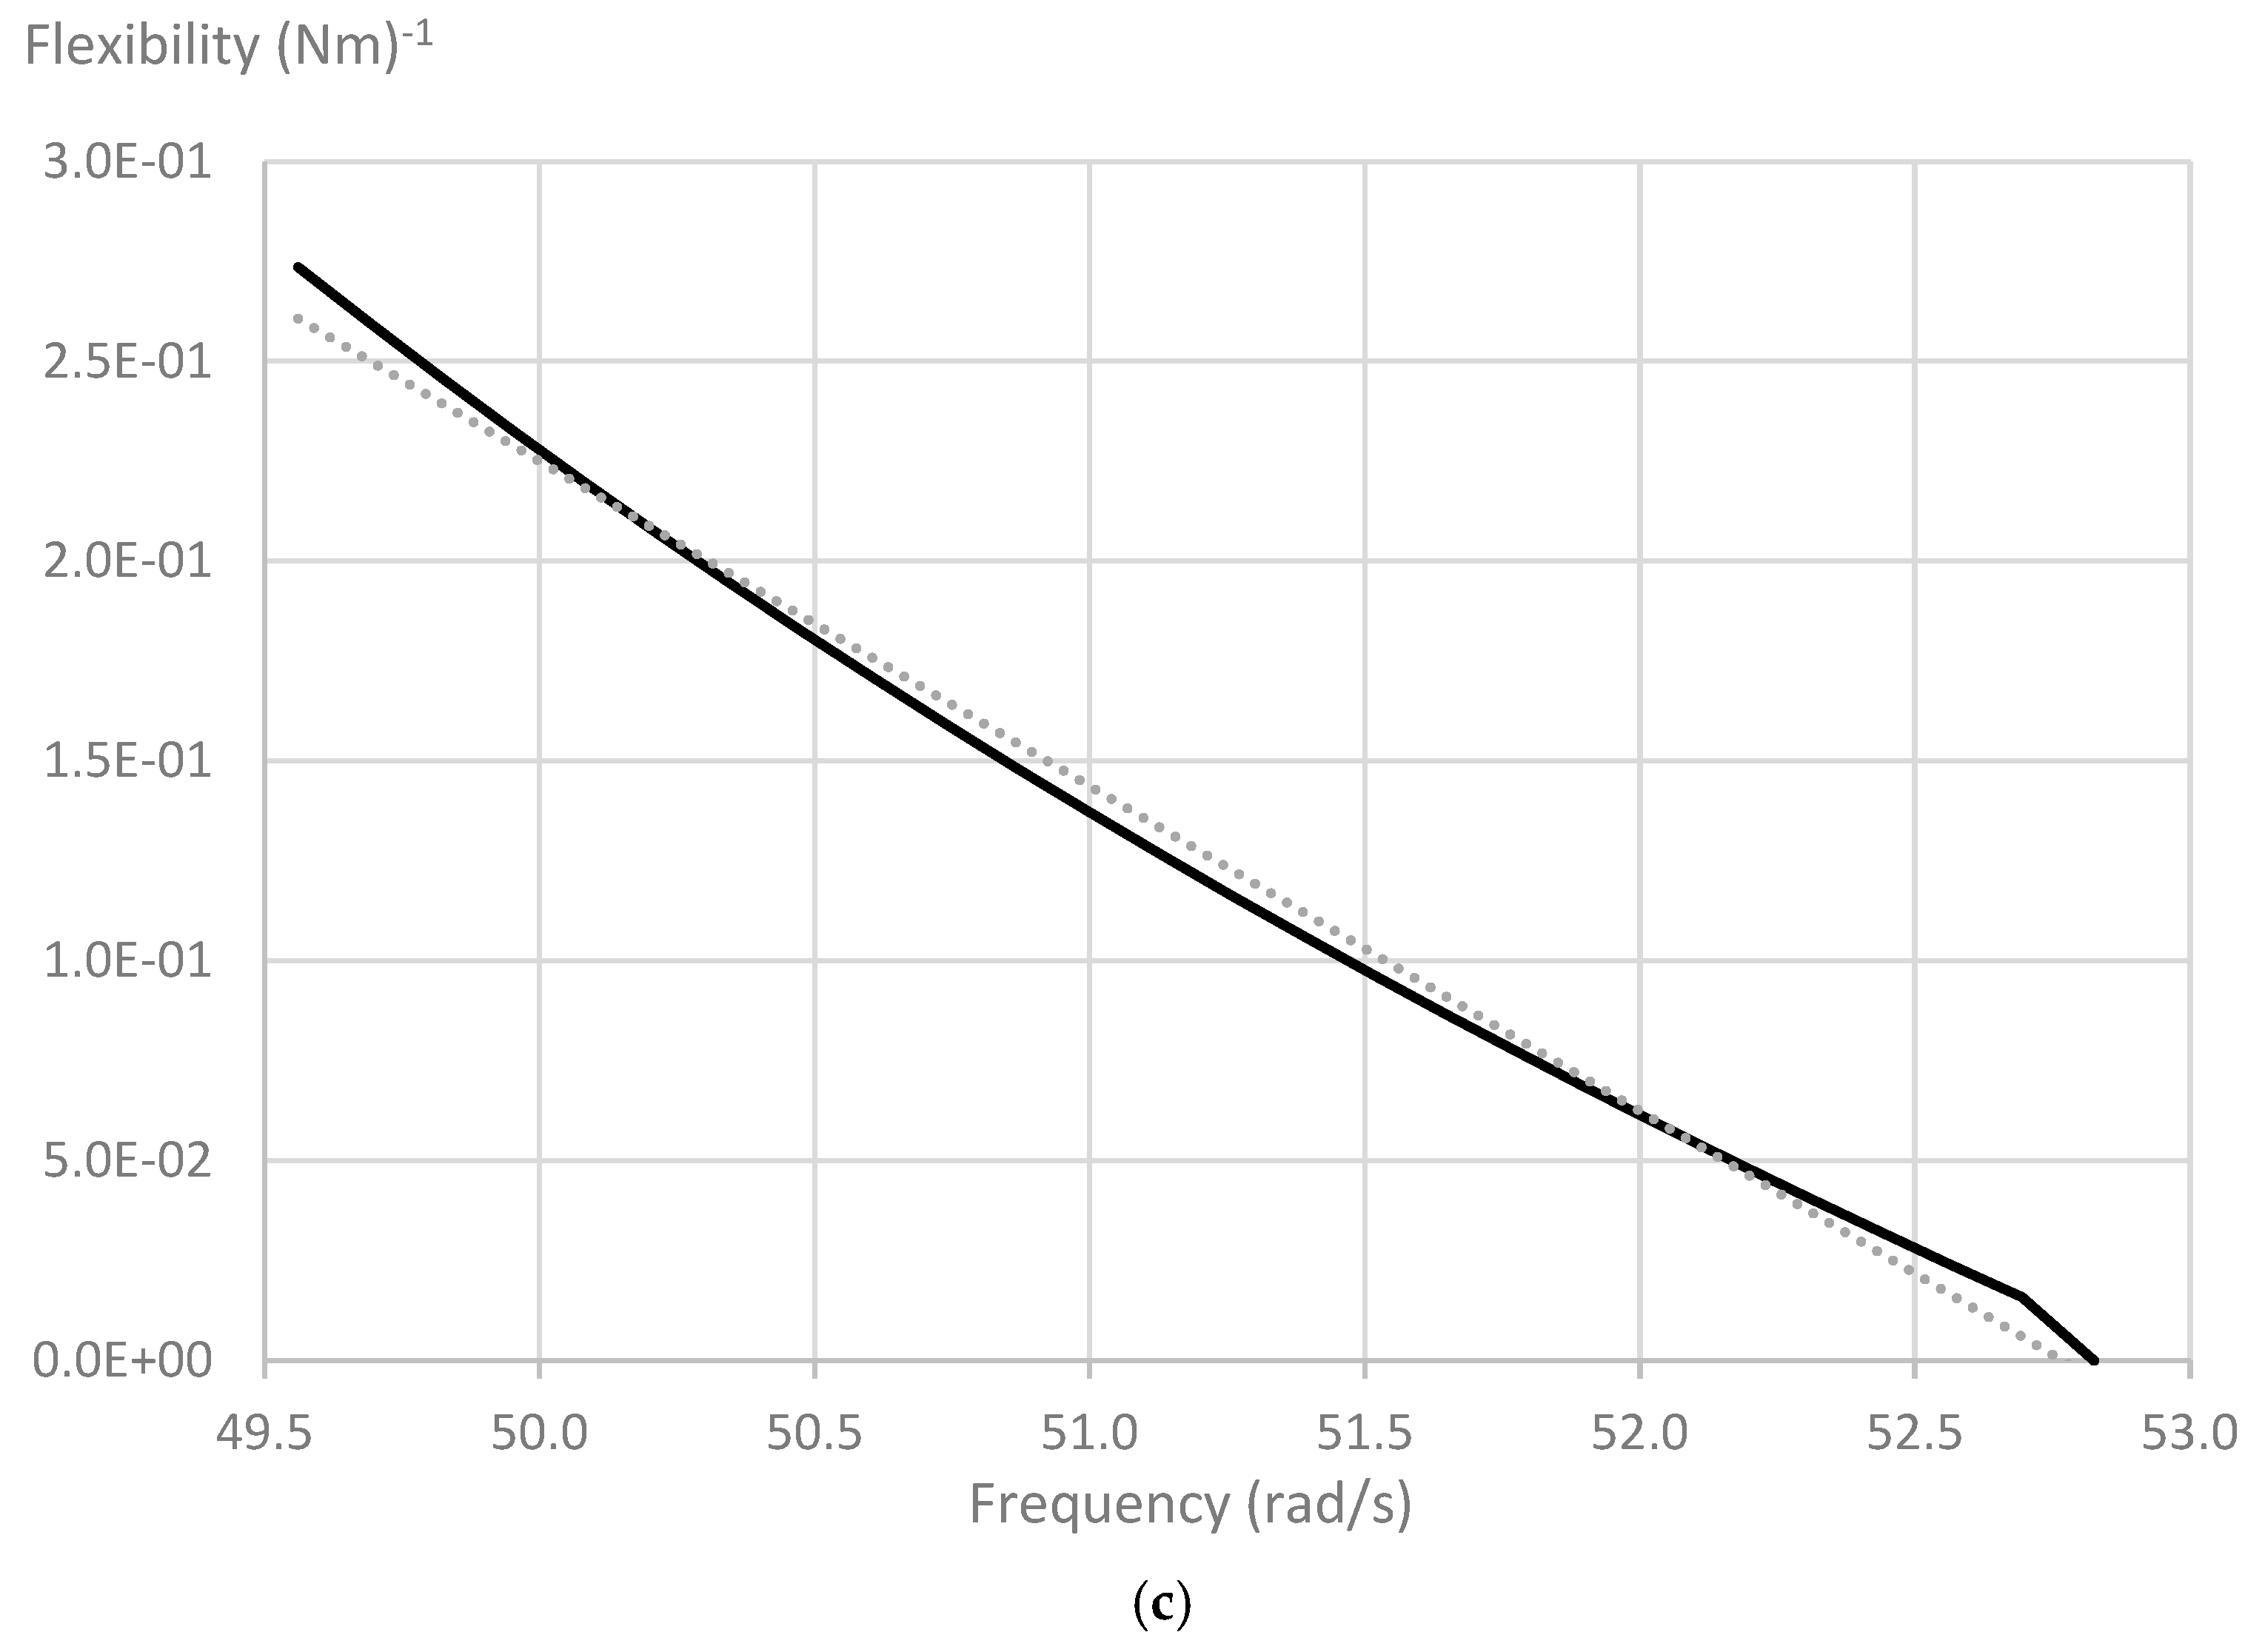
Figure 8 shows plots of the calculated crack flexibility
against frequency, calculated using Equation (14), for a slightly cracked structure where the simulated measured frequencies are close to the first natural frequency of the intact structure
. In
Figure 8a, the plot covers an extremely small frequency range, implying a crack with almost negligible flexibility. Larger ranges are considered in
Figure 8b,c. Each plot reaches the horizontal axis
at the frequency
. It is seen that the plots closely approximate the straight lines predicted by Equation (23), with a slight discrepancy in
Figure 8c where the crack has the largest flexibility.
Similarly,
Figure 9 shows plots of the calculated crack stiffness
against frequency, calculated using Equation (14), for a severely cracked structure where the simulated measured frequencies are close to the first natural frequency of the structure with a hinge at the crack location,
. Each plot reaches the horizontal axis
at the frequency
, and the plots closely approximate the straight lines predicted by Equation (29), with a slight discrepancy in
Figure 9c where the crack has the largest stiffness.
Thus, Equations (23) and (29) provide an easy-to-use approximate tool to evaluate the frequencies of a cracked structure for any given crack location either for a very small crack or for a very severe crack.
4. Practical Application with FE Analysis
While the above derivations and results establish the theoretical foundation for the proposed approach to locate cracks, its potential application to practical problems remains to be tested. There are some challenges in achieving this leading to two questions. One is whether in the presence of uncertainties in experimental measurements this method would be of any practical use. Secondly, while the DSM approach is elegant, it is not widely used and then the question arises whether this approach can be used with more commonly available computational tools. To answer the above questions, this section presents results from a numerical experiment for the location and severity of a crack based on FE results, allowing for some experimental uncertainties. The FE scheme was applied to an Euler–Bernoulli beam, for which the stiffness and mass matrices were obtained for various combinations of boundary conditions, crack location, and rotational stiffness at the crack.
In the exact DSM approach, the Dynamic Stiffness Matrices are obtained analytically. The Dynamic Stiffness Matrix of the cracked beam
from the FE analysis is obtained using the formula
where
is the static stiffness matrix of the cracked beam and
is the mass matrix.
Similarly, the Dynamic Stiffness Matrices for the original beam and the hinged beam are given by
with subscripts
D, o, and
h referring to dynamic, original, and hinged, respectively:
A schematic of the beam is shown in
Figure 10. The beam of length
L, flexural rigidity
EI, and mass per unit length
ρA is subdivided into
N identical elements. The crack is located at the right end of the
N1th element where
N1 < N. The non-dimensional location of the crack from the left end of the beam is then given by
The expected linear relationship is given by Equation (14), which may be written in terms of the location coordinate
β (instead of the position vector
p) as follows:
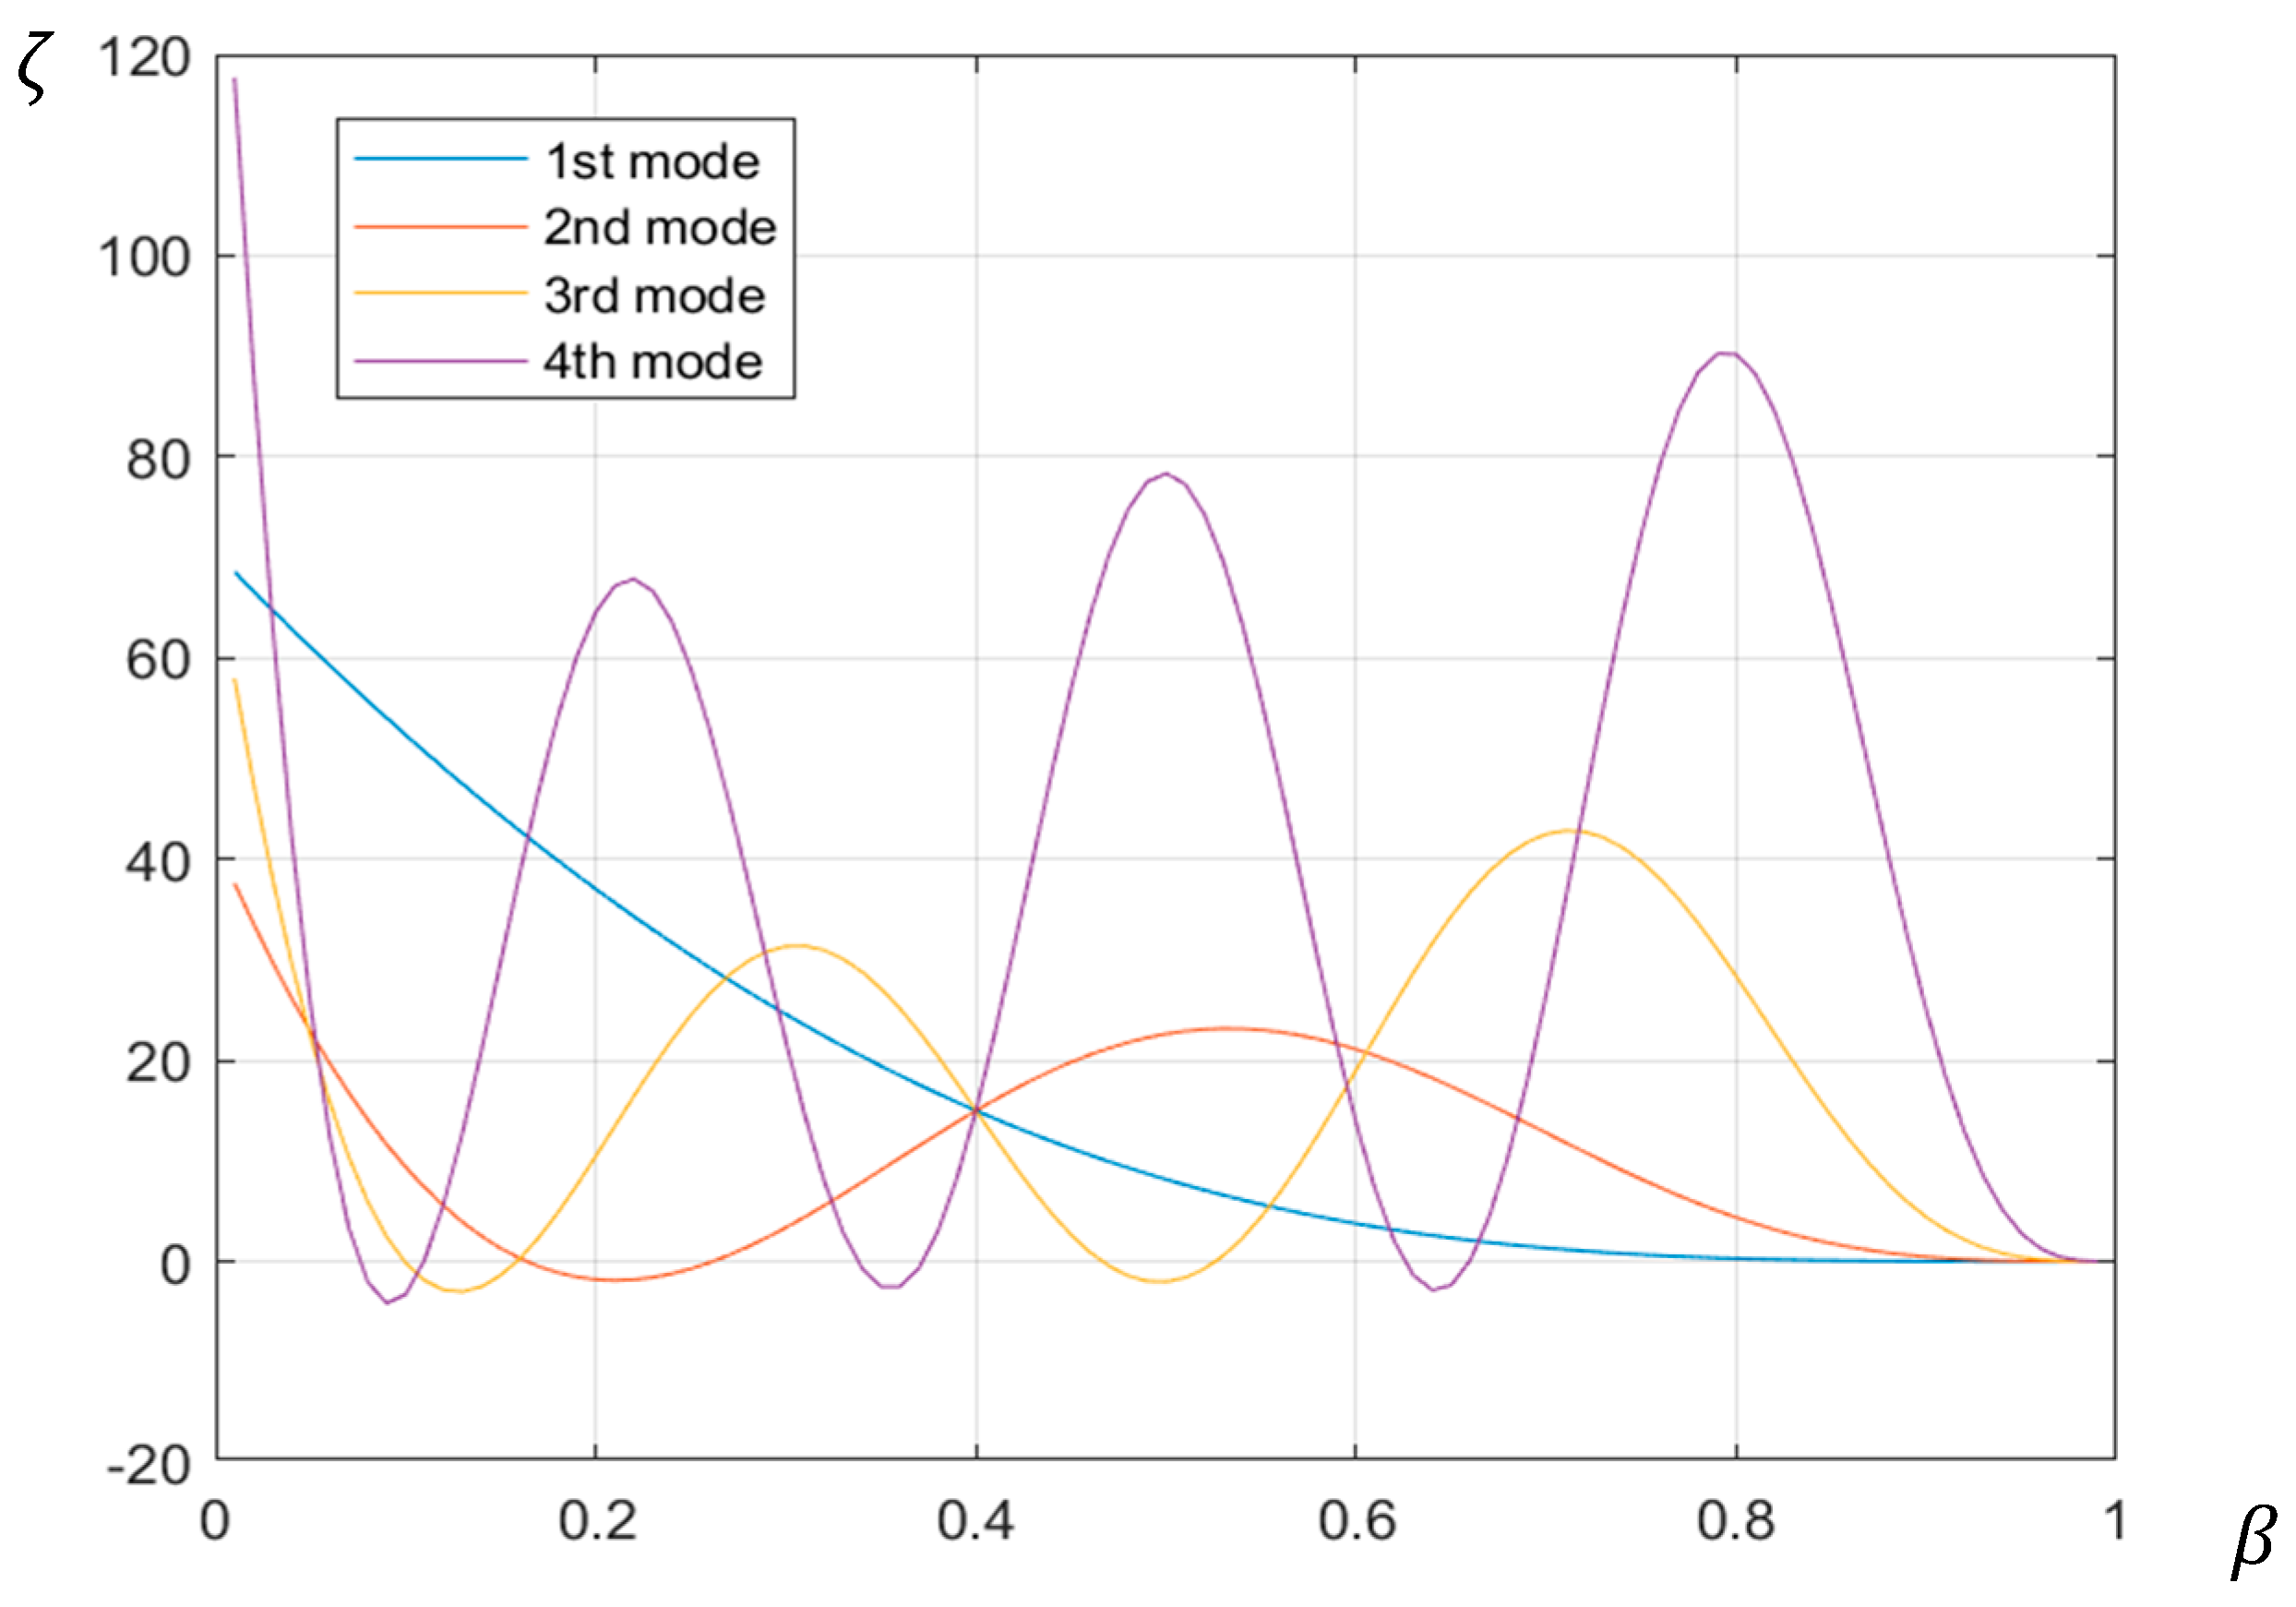
A typical set of results is presented in this section, showing the variation in the calculated stiffness parameter against the trial values for crack location β. The test results were for a crack located at β = 0.4 and various values of .
For this numerical experiment, a cantilever (clamped-free) beam with EI = 521 Nm2, ρA = 2.65 kg/m and L = 0.4 m, the first three natural frequencies in the undamaged state are given by {79.86, 500.4, 1401, 2746} Hz. For a simply supported (pinned-pinned) beam of the same properties and dimensions, the first three natural frequencies in the undamaged states are {224.2, 896.7, 2018, 3587} Hz. For each beam, a crack was introduced by replacing rotational continuity with partial elastic restraints, which resulted in approximately a 2 Hz drop in the fundamental natural frequency. Two hertz was selected as it is a measurable frequency change in the range of the fundamental frequencies concerned. The question then is as follows: if there were to be a crack that could result in such a frequency change, would the proposed approach help to locate the crack? The natural frequencies of the cracked beams were found to be {77.68, 479.7, 1366, 2713} Hz for the cantilever case and {222.2, 893.6, 2011, 3556} Hz for the simply supported case. It was decided to introduce an experimental noise with values ranging up to 2 Hz, which is of the order of the frequency drop for the first mode.
Figure 11 shows the stiffness–crack location plots for the first four natural frequencies of the cracked cantilever beam without introducing any experimental noise. As can be seen, the plots all intersect at the relative length of 0.4, which is the location of the crack. Thus, the results show that in the absence of any experimental noise, the determinantal results will predict the location of the crack exactly using the degradations in the first four natural frequencies.
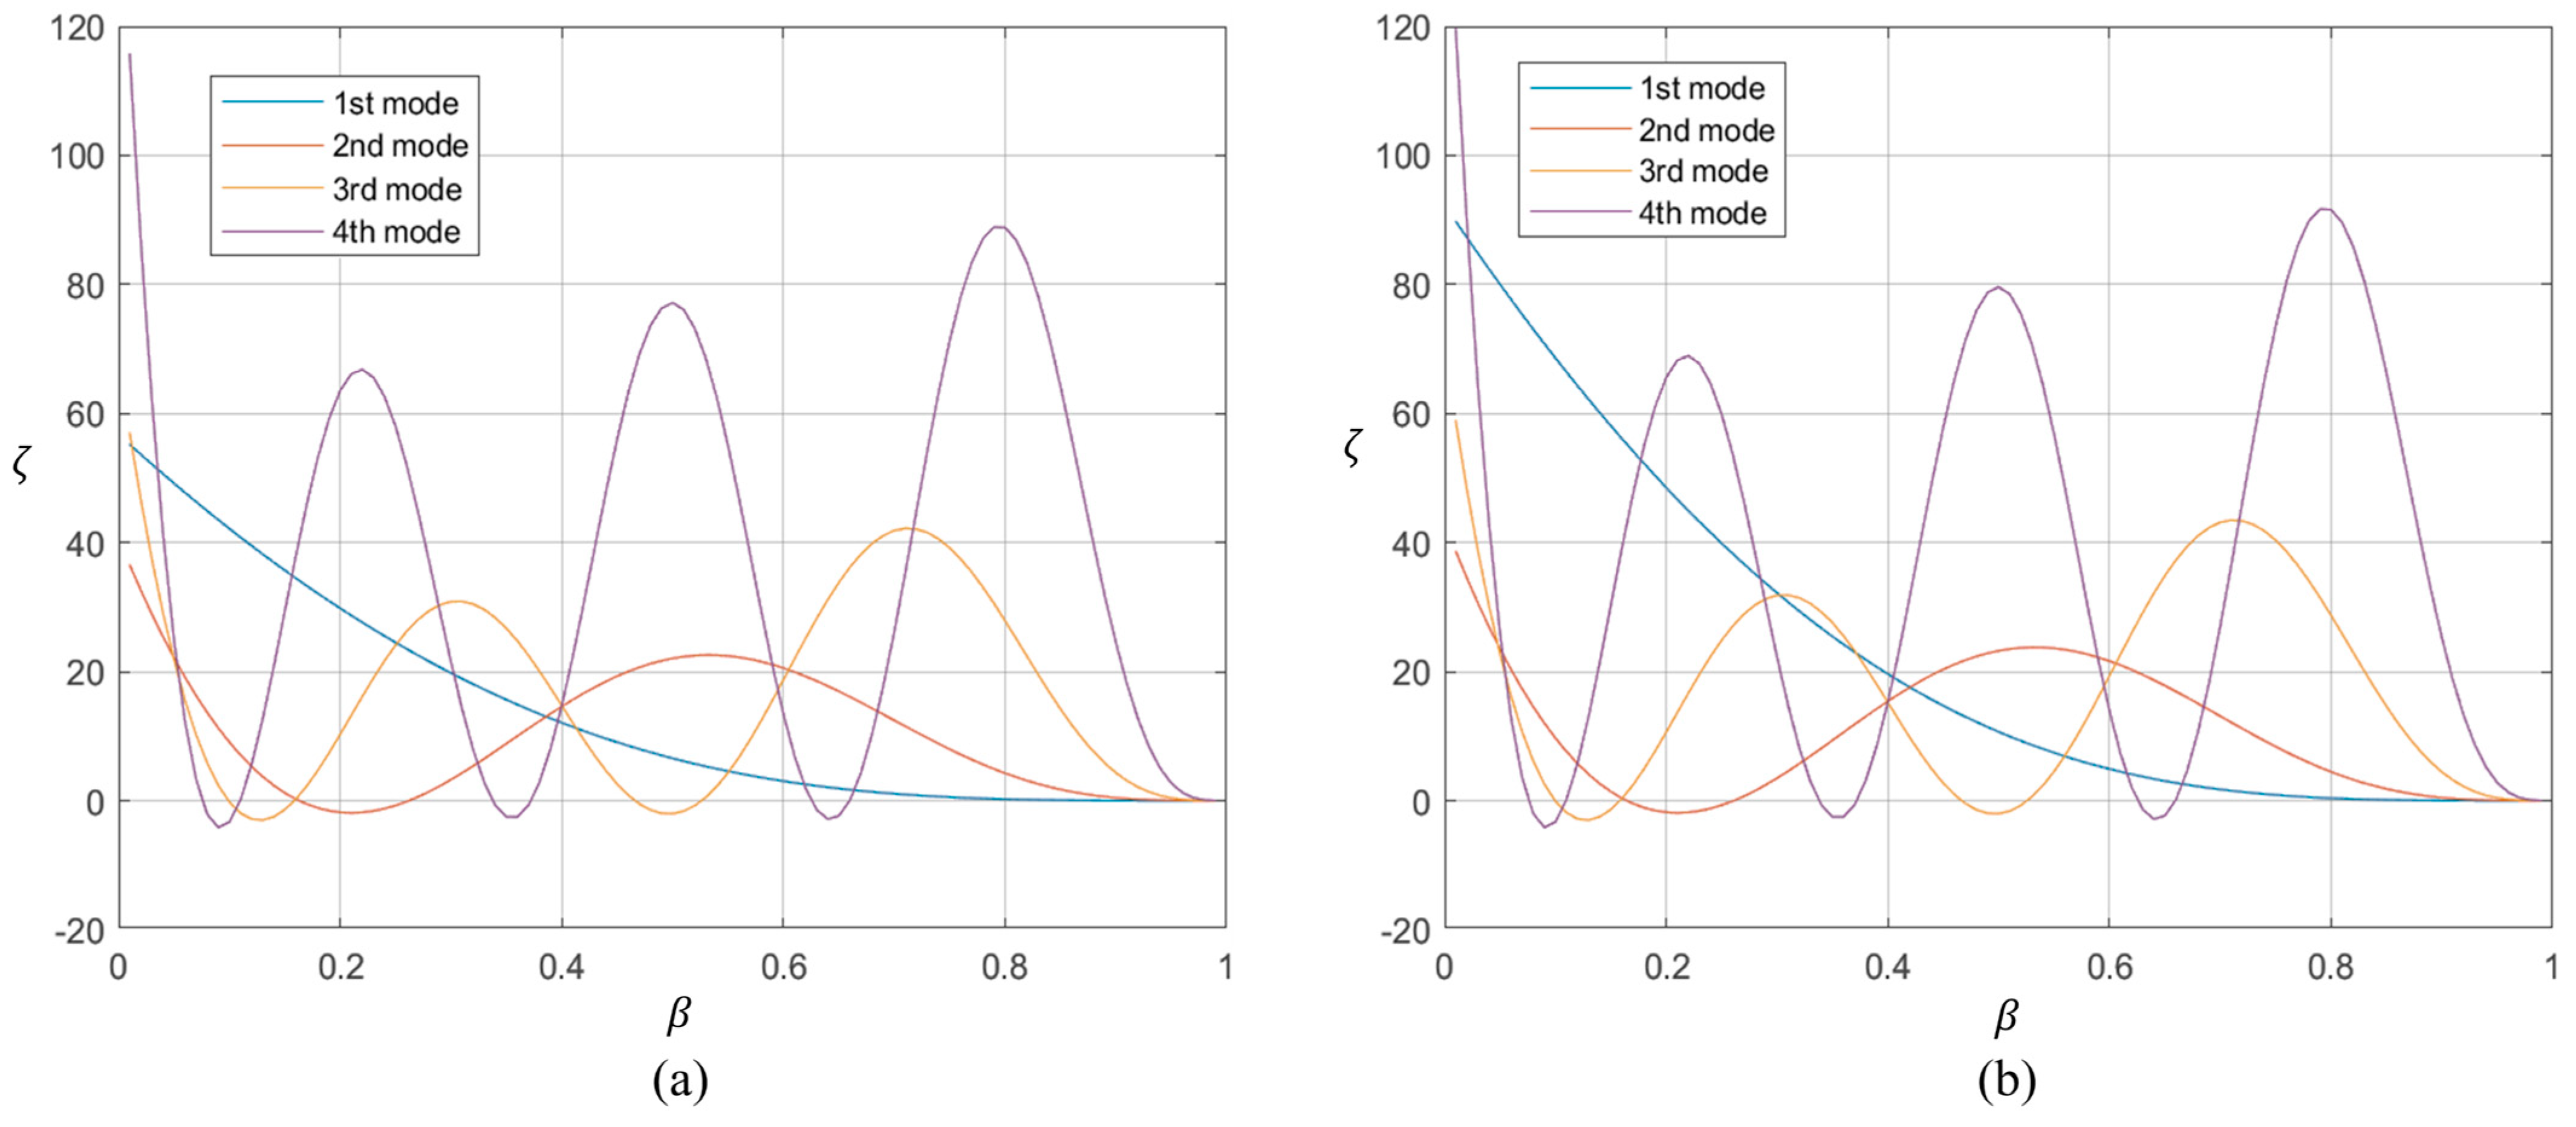
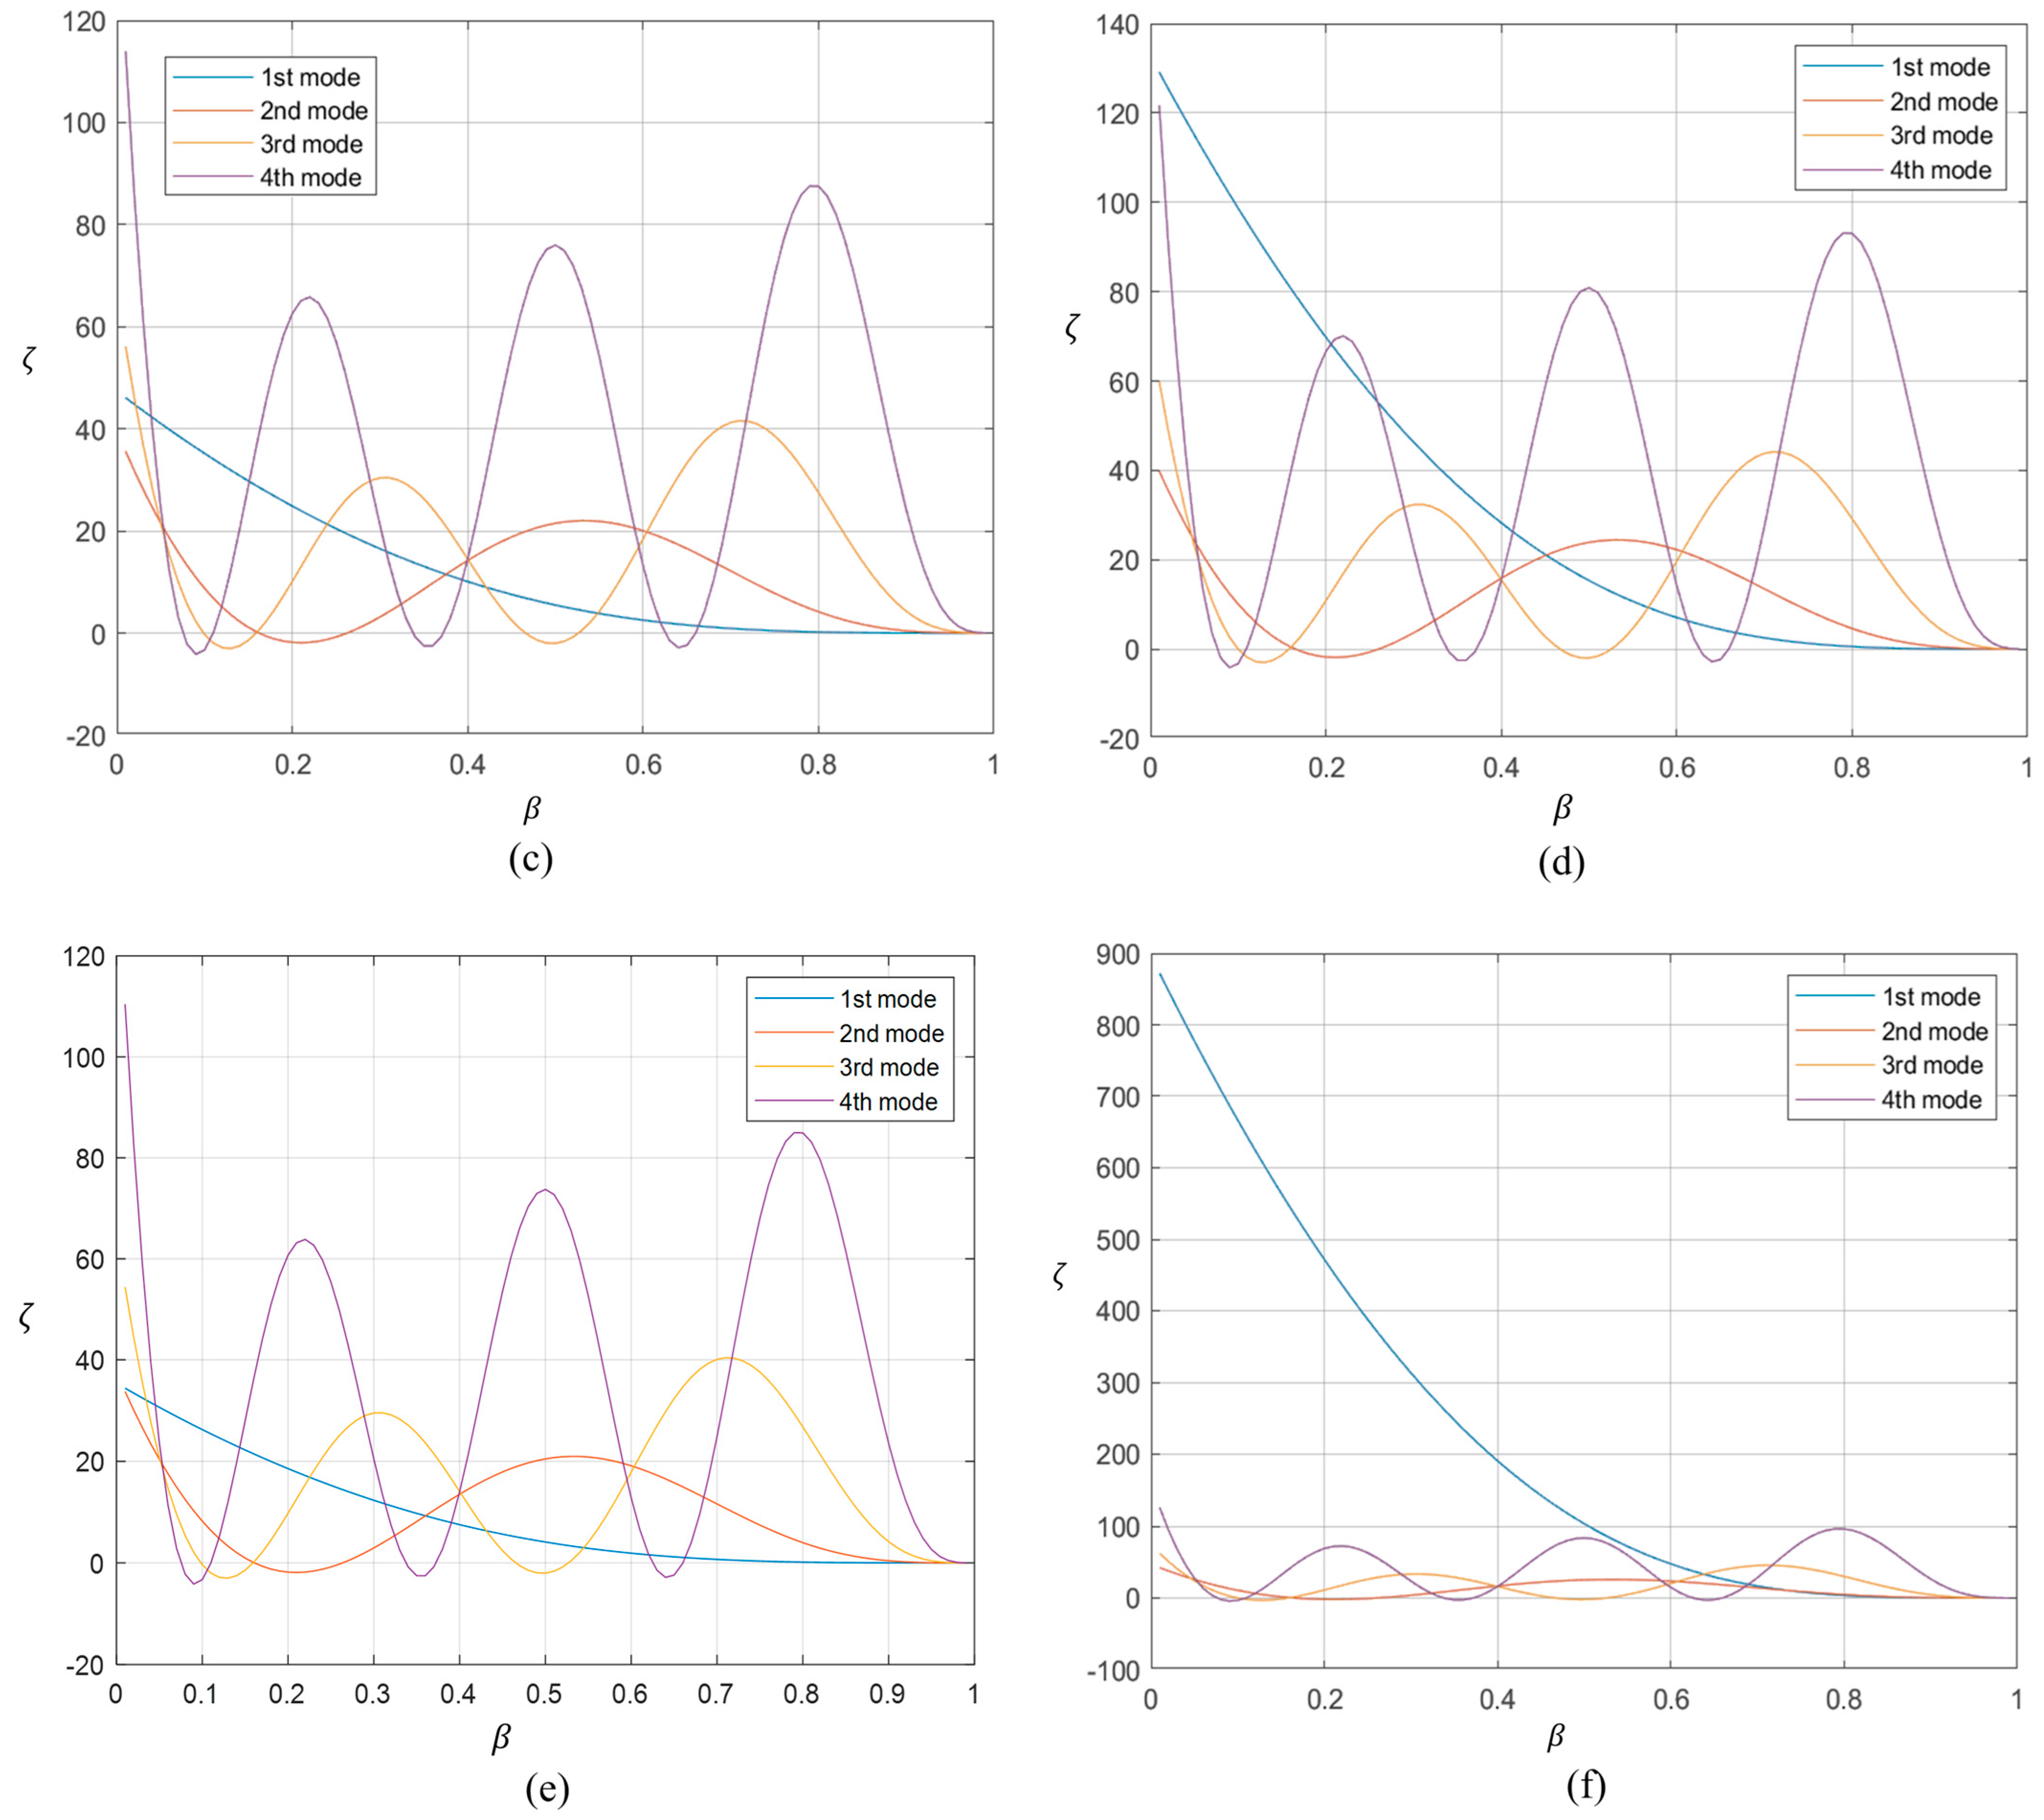
Figure 12 shows the stiffness–crack location plot for different assumed levels of experimental noise. It can be seen that the intersection of the stiffness–crack location curves are no longer exactly coincident at the crack location, but tend to deviate somewhat. Nevertheless, as long as the noise is lower than about half the frequency drop due to the crack (1 Hz), a small zone within which the crack is located can be identified. The results based on the fundamental natural frequency, which is the most sensitive one, may be unreliable if the noise level approaches the frequency drop due to the crack, e.g., see
Figure 12f. However, the higher natural frequencies could still be useful in locating the crack.
A similar observation can be made by considering the results for the simply supported beam.
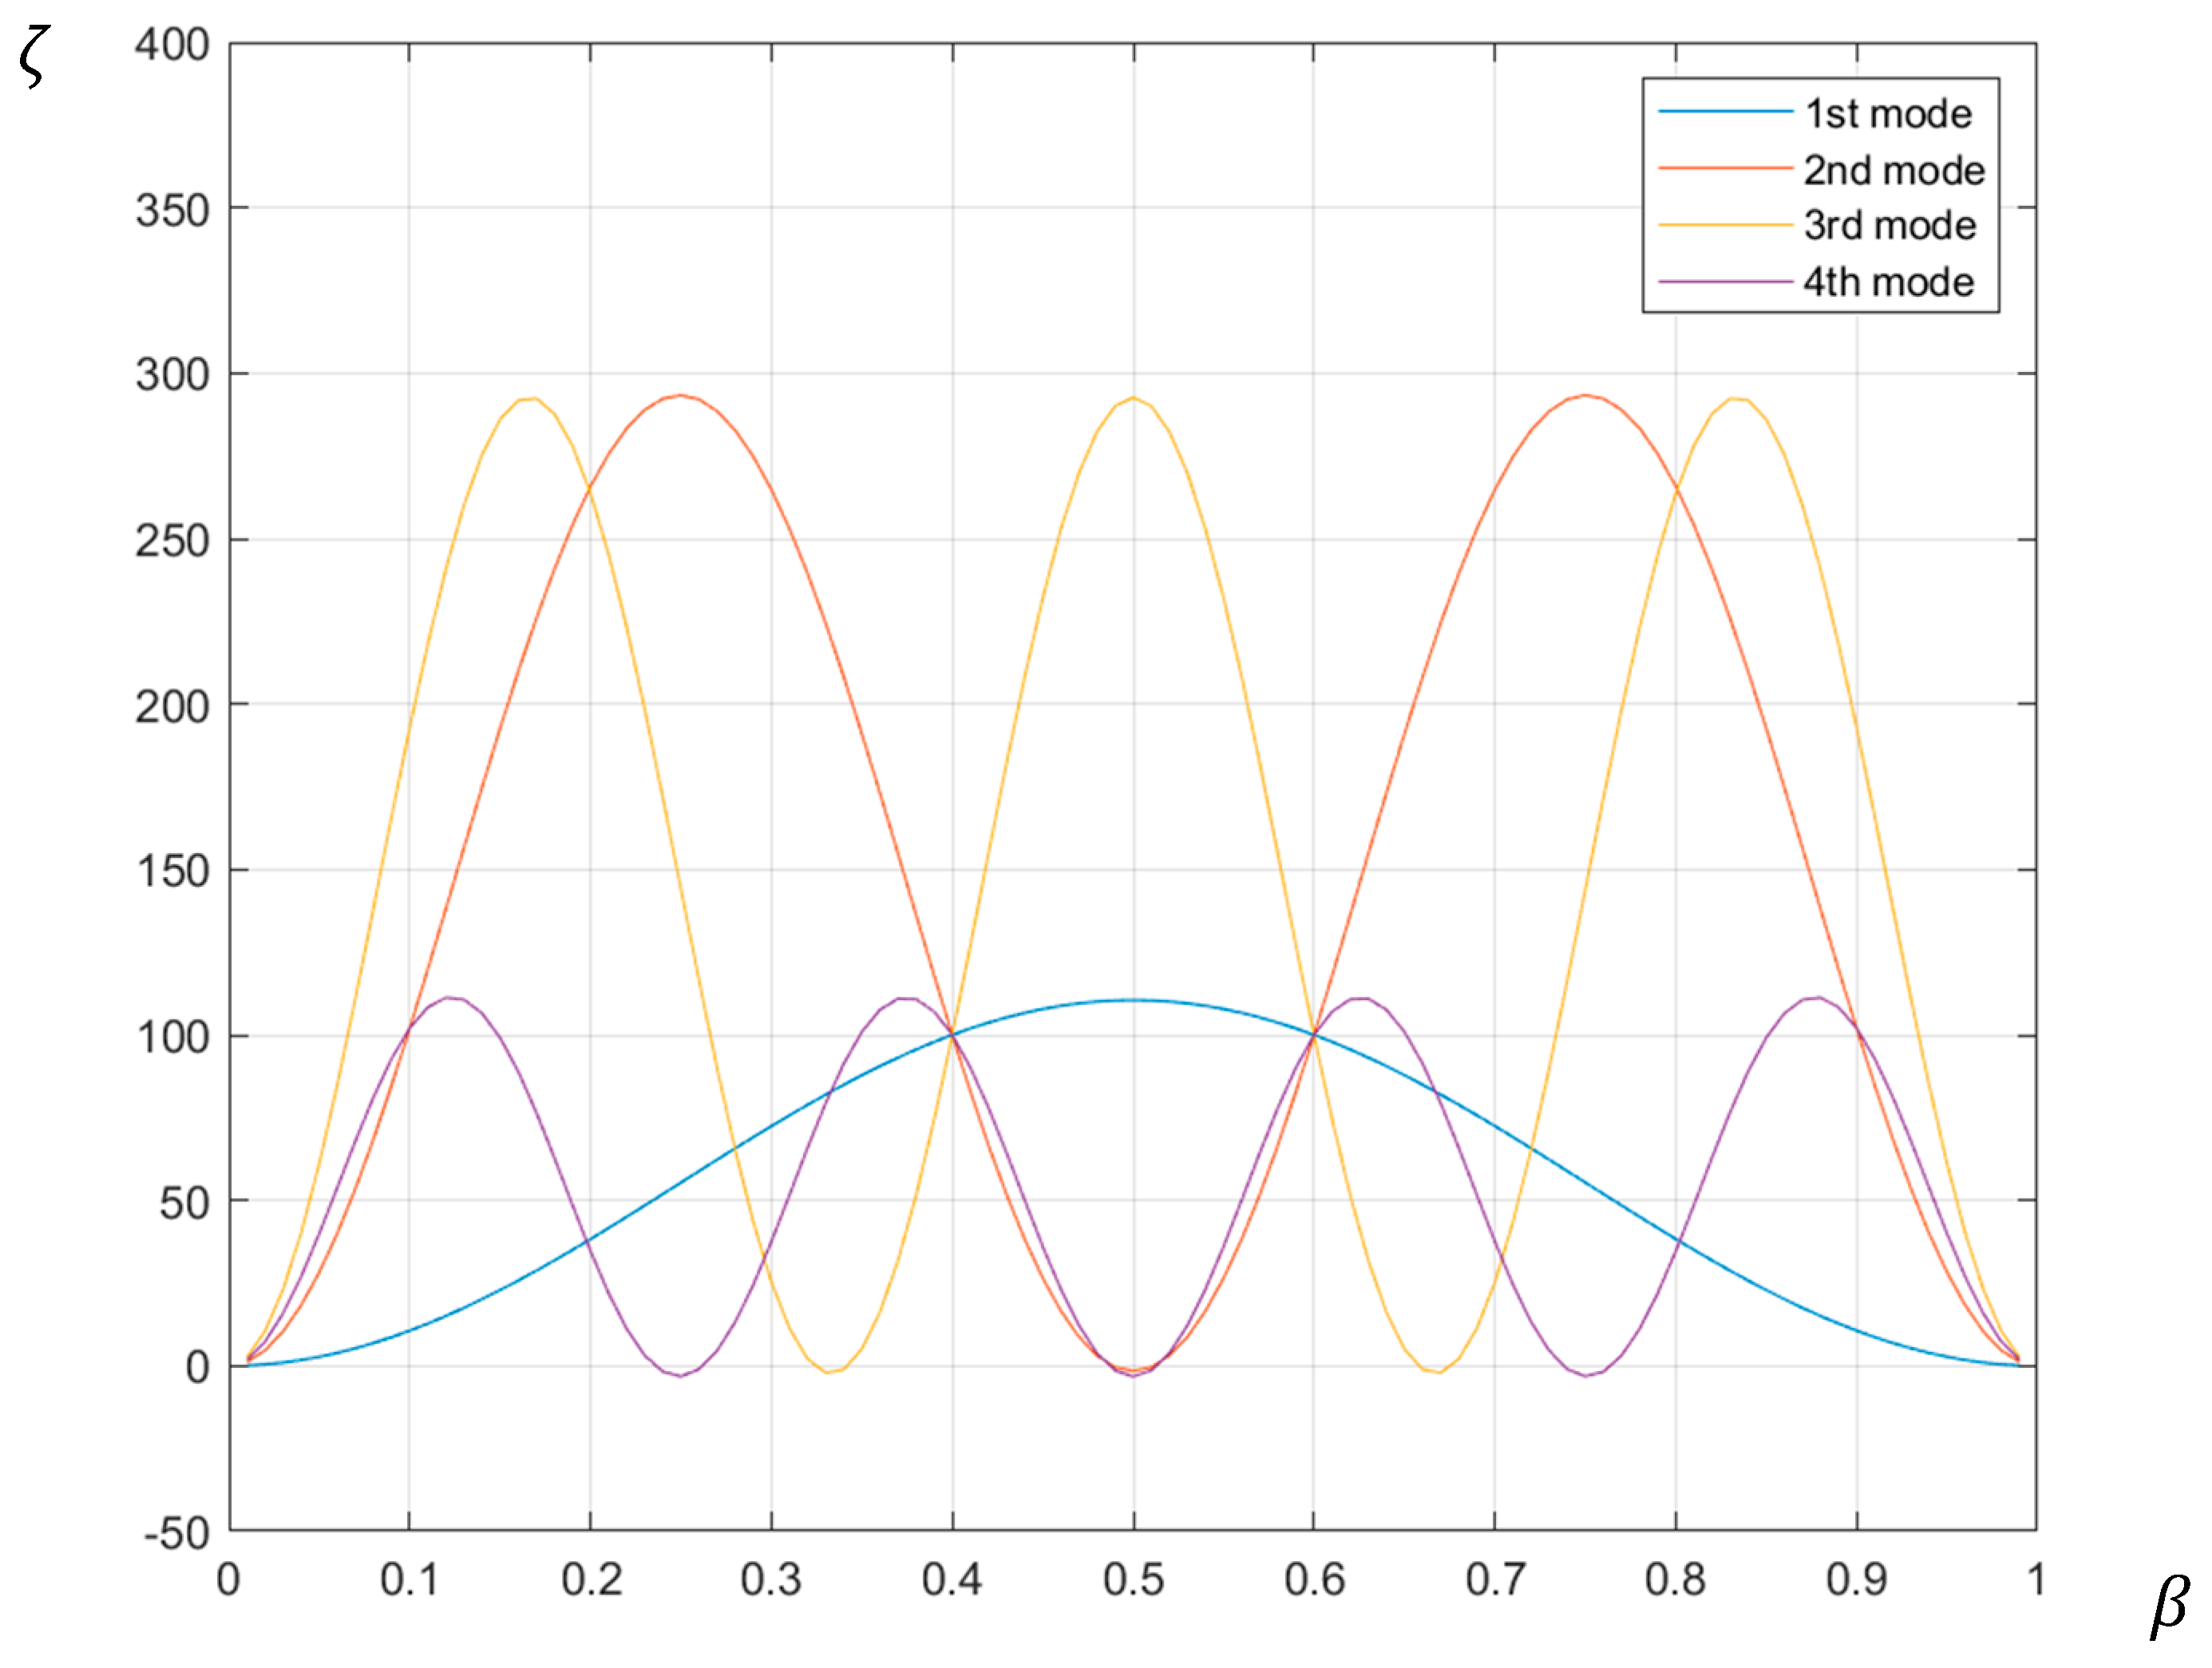
Figure 13 confirms that in the absence of experimental noise, the expected convergence of the stiffness–crack location plot converge at the crack location.
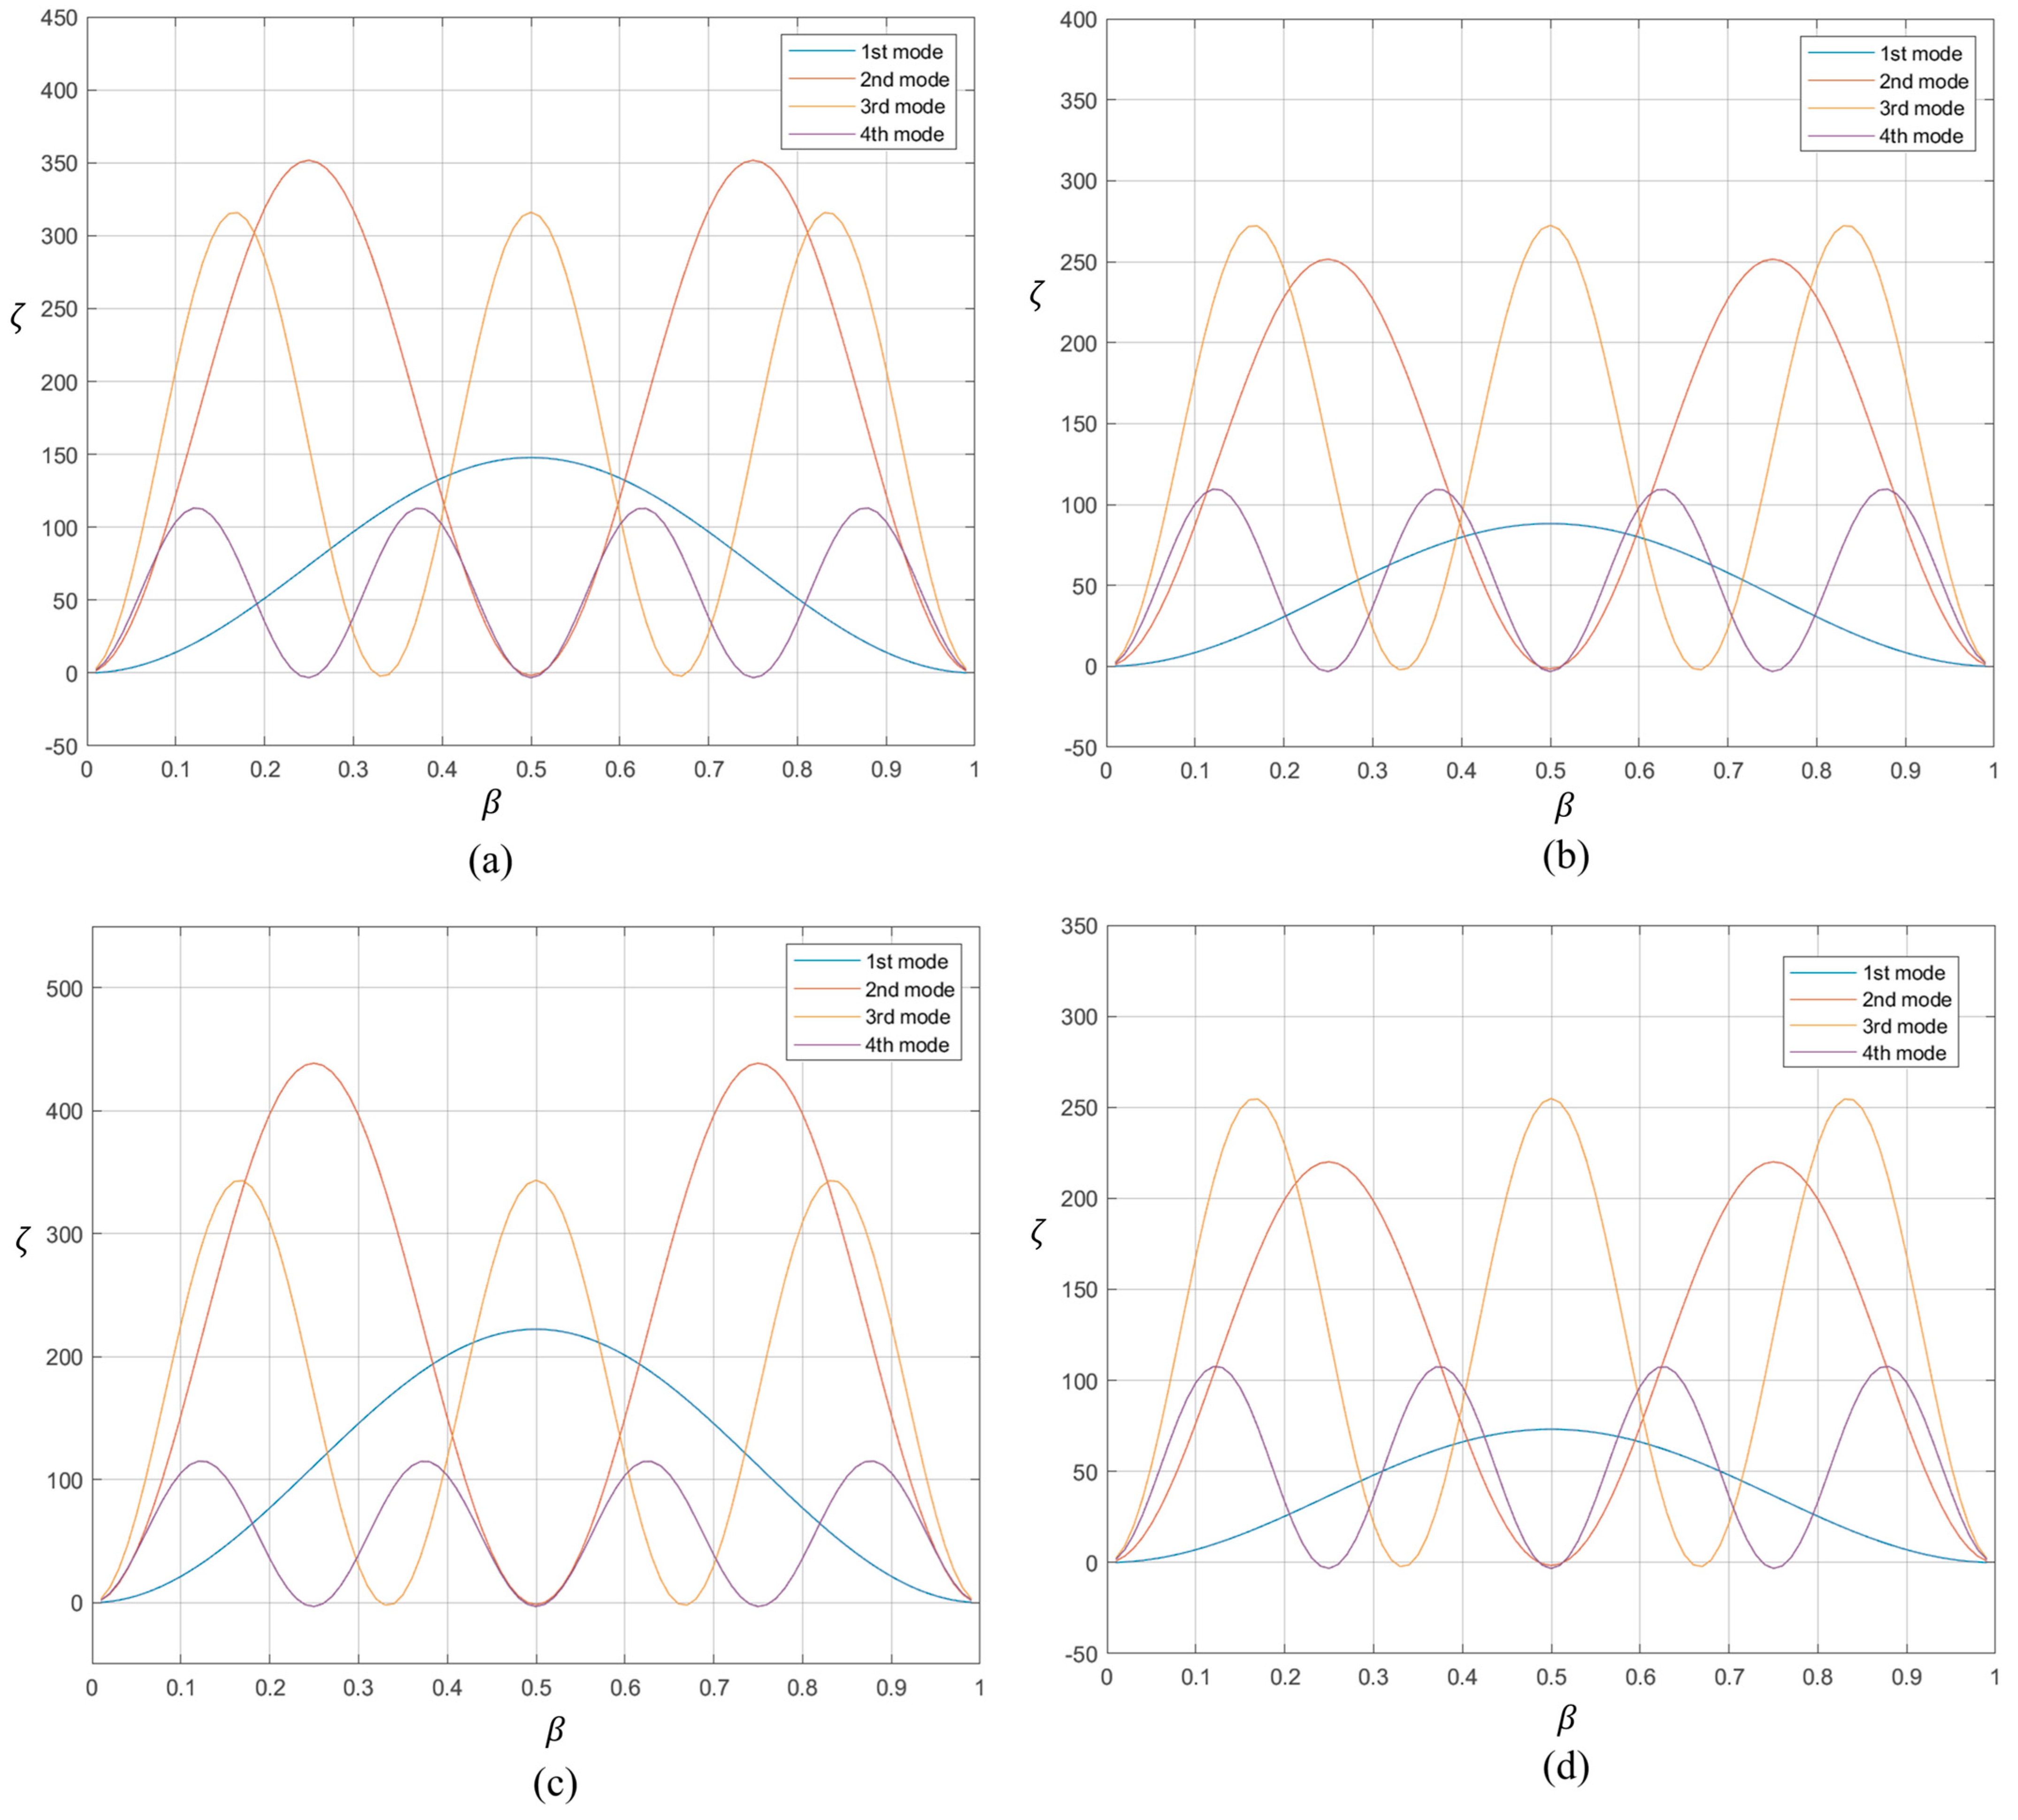
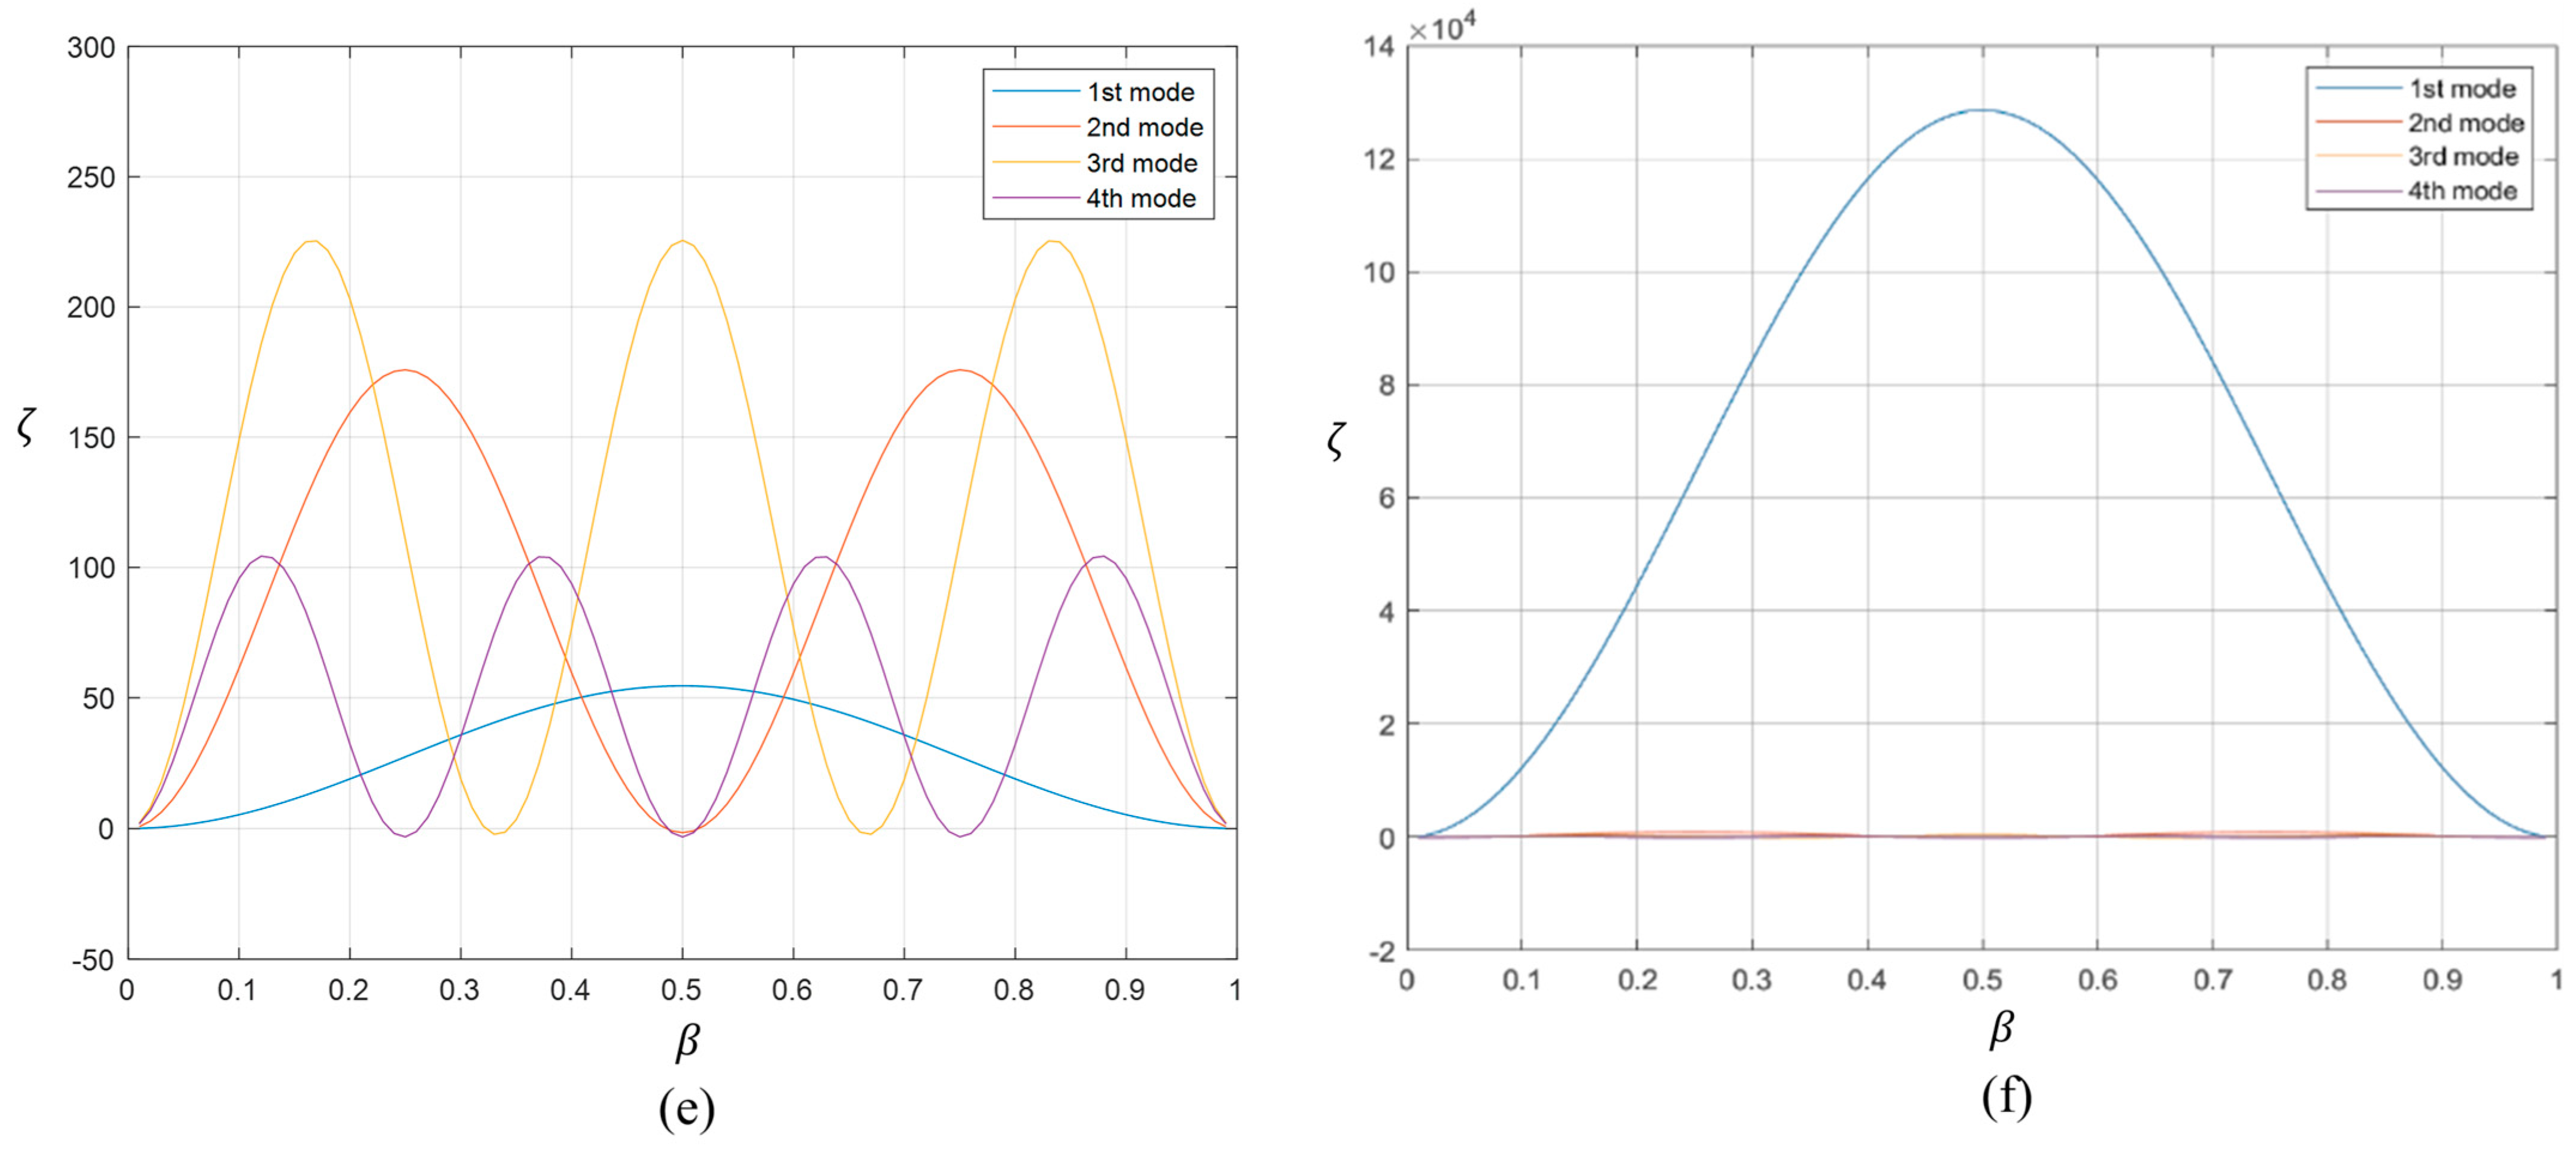
Figure 14 shows the effect of various degrees of experimental noise. There is one important difference between the cantilever beam and the simply supported beam. For the simply supported beam, due to its symmetry, there are two potential crack locations for any given set of measurements. That is, the method shows that the crack is in the vicinity of 0.4 L from either the left support or the right support. Thus, to identify the actual location of the crack, areas around both these points need to be inspected.
The above results show that the use of an approximate method such as FE analysis will not be a hindrance in the application of the determinantal method proposed here for locating the crack. However, results based on the fundamental frequency may be too sensitive to experimental noise, and higher modes may give a better indication of the location. It should be noted that the measurement of higher frequencies may also involve higher experimental noise, and the feasibility of the method needs to be verified through physical experiments.
