1. Allopurinol Use and Risk of Acute Coronary Syndrome in Patients with Incident Gout: A Population-Based Study in Sweden
Panagiota Drivelegka *, Lennart Jacobsson, Karin Bengtsson and Mats Dehlin
Department of Rheumatology and Inflammation Research, Institute of Medicine, The Sahlgrenska Academy at University of Gothenburg, 41345 Gothenburg, Sweden
Abstract: Background: Gout is associated with an increased risk of cardiovascular disease, with accumulated evidence that gout is an independent risk factor. Whether allopurinol use alters this risk is not clear. The aim of this study was to investigate the effect of allopurinol use on the risk of first-ever acute coronary syndrome (ACS) in patients with incident gout. Methods: Using data from population-based registers, we identified all patients in Western Sweden with a first ICD-coded diagnosis for gout in the period 2007–2017 and without any previous allopurinol exposure (
n = 19,054; 67% males). Patients with a prior history of coronary heart disease were excluded. The outcome of interest was the occurrence of a first-ever ACS event in the compulsory health care registers. The follow-up began from the first ICD-coded diagnosis for gout, and ended at the earliest of the following: the outcome, death, emigration, or the end of the study, on 31 December 2017. Exposure to allopurinol at the end of follow-up was defined as: none (reference group), 100 mg, or >100 mg, according to the last dispensed prescription within 125 days from the end of follow-up. Odds ratios (ORs) and 95% confidence intervals (CIs) for a first-ever ACS event were calculated using logistic regression with adjustments for age, sex, education, comorbidity index (based on the number of ever-diagnosed comorbidities, see included comorbidities in footnote of
Table 1), dispensed prescriptions for cardiovascular drugs, anticoagulants/ platelet aggregation inhibitors, and/or cortisone within six months from the end of follow-up, and follow-up time. Results: Women were older than men in all exposure categories (
Table 1). Exposure to allopurinol was associated with older age, a longer follow-up time and more comorbidities (
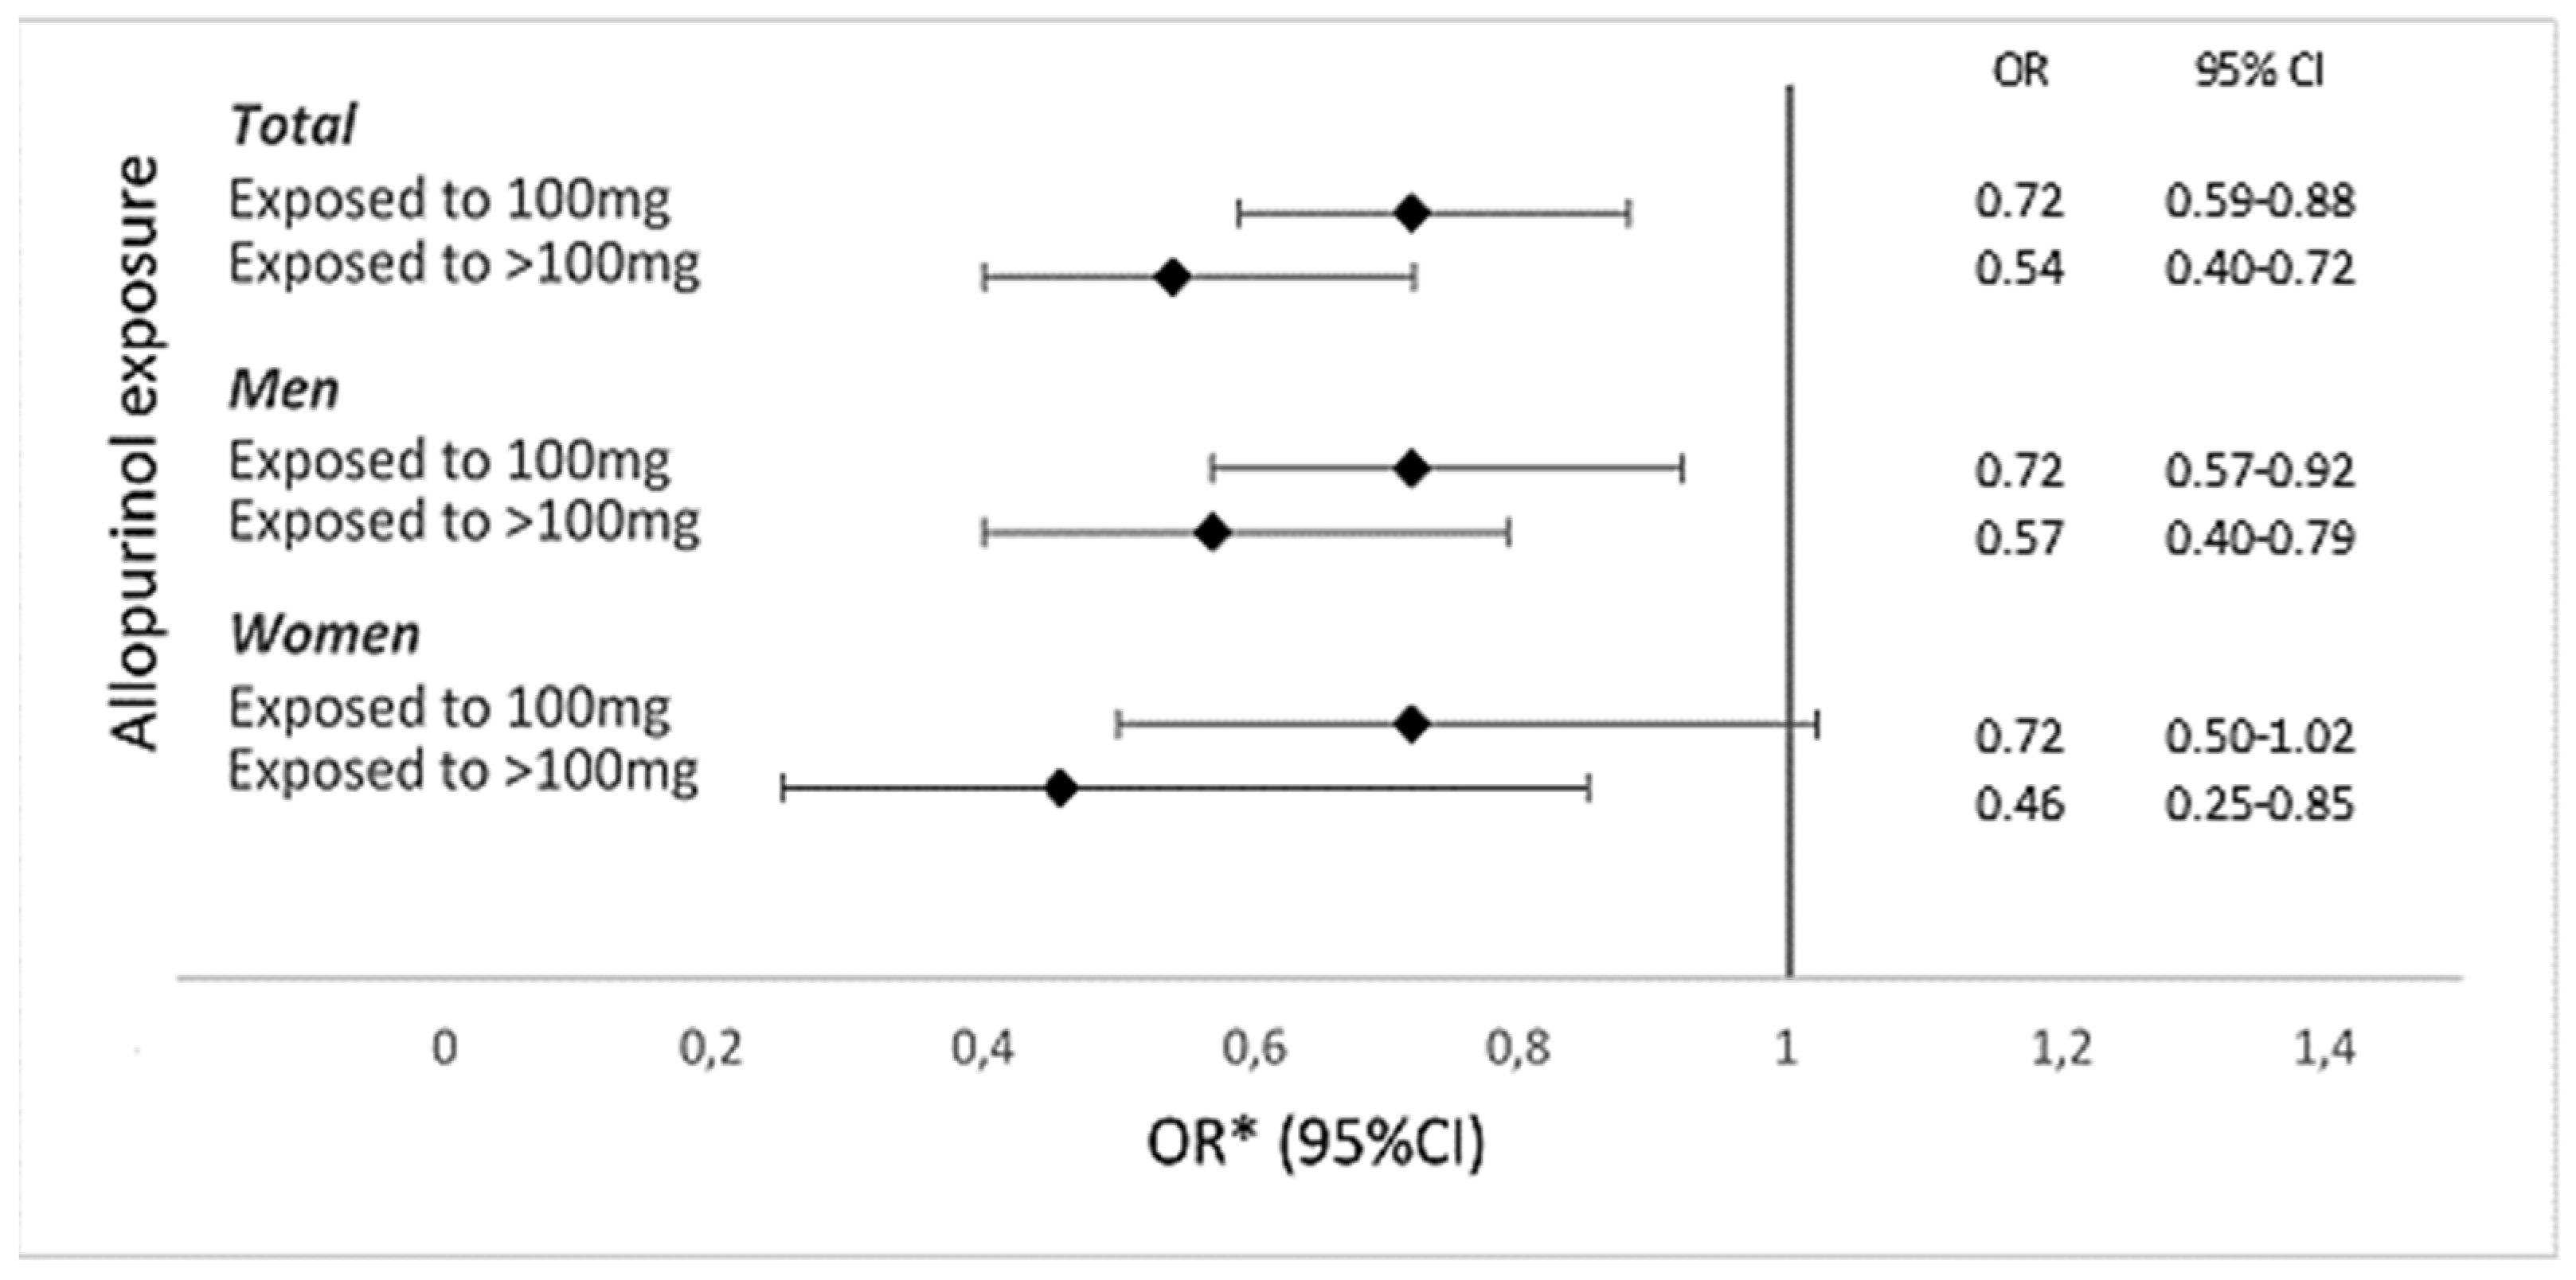
Table 1). Exposure to 100 mg and >100 mg allopurinol had a significantly lower OR for a first-ever ACS event, as compared to those not exposed, overall (OR, 0.72; 95% CI, 0.59–0.88; and OR, 0.54; 95% CI, 0.40–0.72, respectively), and in men (OR, 0.72; 95% CI, 0.57–0.92; and OR, 0.57; 95% CI, 0.40–0.79, respectively). In women, exposure to >100 mg was associated with a significantly lower OR for a first-ever ACS event (OR, 0.46; 95% CI, 0.25–0.85), whereas exposure to 100 mg was not (OR, 0.72; 95% CI, 0.50–1.02). Exposure to >100 mg allopurinol was associated with a lower OR for a first-ever ACS event than exposure to 100 mg in both men and women (
Figure 1). The ORs for a first-ever ACS event were similar in men and women. Conclusion: Current allopurinol use was associated with a significantly lower risk of a first-ever ACS event in patients with incident gout in a dose-dependent fashion, suggesting a protective effect for allopurinol. The effect of allopurinol was similar in men and women.
2. Sonoanatomy of CPPD: Correlation of Ultrasonographic and Anatomical Findings in CPP Deposition. A Study of the EULAR “Anatomy for Imaging” Study Group
Giovanni Pacini 1,*, Georgios Filippou 2, Maribel Miguel-Pérez 3, Anna Scanu 4, David Bong 5, Luis Coronel 6, Fabio Becce 7, Silvia Sirotti 2 and Ingrid Möller 5
- 1
Department Experimental and Clinical Medicine & Division of Rheumatology, Azienda Ospedaliero Universitaria Careggi, University of Florence, 50141 Florence, Italy
- 2
Department of Rheumatology, IRCCS Istituto Ortopedico Galeazzi, 20157 Milan, Italy
- 3
Unit of Human Anatomy and Embryology Department of Pathology and Experimental Therapeutics Faculty of Medicine and Health Sciences, University of Barcelona Bellvitge Campus, 08907 Barcelona, Spain
- 4
Department of Women’s and Children’s Health, University of Padova, 35128 Padova, Italy
- 5
Faculty of Medicine and Health Sciences, University of Barcelona Bellvitge Campus and Instituto Poal de Reumatologia University of Barcelona, 08907 Barcelona, Spain
- 6
Instituto Poal de Reumatologia, University of Barcelona and Vall d’Hebron Hospital, 08907 Barcelona, Spain
- 7
Department of Diagnostic and Interventional Radiology, Lausanne University Hospital and University of Lausanne, CH-1011 Lausanne, Switzerland
- *
Abstract: Background: Ultrasound (US) has gained an important role in assessment in microcrystalline arthropathies. Nonetheless, scanning for crystal identification can be challenging, and the exact localization and aspect of specific findings may be misinterpreted. The aim of this work, carried out on behalf of the EULAR group “Anatomy for imaging”, is to provide an anatomical explanation of some US findings encountered in CPPD. Methods: Cadavers arriving at the Unit of Human Anatomy and Embryology, Barcelona University, underwent US scanning of joints until a cadaver with diffuse CPP deposition was identified. All joints of the upper and lower limb were then carefully scanned, focusing on the identification of CPPD according to OMERACT definitions and any other US findings that could suggest a specificity of CPPD. Involved joints were stratigraphically dissected to evaluate CPP localization and diffusion in the joint and periarticular tissues. A histological examination was performed for CPP identification. Results: At the wrist, we found many hyperechoic aggregates suggestive of crystal deposition around the distal tract of the flexor carpi radialis tendon. At dissection, the tendon was surrounded by several deposits of calcium crystals, located in a dedicated fibrocartilaginous tunnel and over the superficial fibers of the tendon, confirmed as CPP crystals on microscopic examination. Much CPP deposition was also found in the volar side of the capsule of the radiocarpal joint, which was also clearly seen on US. At the elbow, a double contour that satisfied the OMERACT definition was found on the surface of the radial head (
Figure 2a), mimicking gout. On dynamic scanning, the pseudo double contour seen in this case of CPPD, appears “mobile”, sliding on and dissociated with the motion of the hyaline cartilage (HC), whereas in the gout double contour, the MSU crystals “stick” to the cartilage and follow the motion of the HC. At dissection, the HC of the radial head lacked calcifications on its surface (
Figure 2c), with evident deposition of calcium crystals (confirmed as CPP crystals on the microscopic examination) imbedded within the annular ligament of the proximal radioulnar joint (
Figure 2d). At the knee, we reported many hyperechoic aggregates suggestive of crystal deposition around the insertional tract of the popliteus tendon. Similarly to the flexor carpi radialis, at dissection the popliteus tendon was surrounded by calcium crystals deposits, which were lying also on the surface of the tendon, confirmed as CPP crystals on microscopic examination. At the hip, we encountered many aggregates inside the acetabulum that could not be detected with US because of their anatomical position. This is also a site that can be missed in conventional radiography, as the overlap of bones will make CPP identification challenging. Conclusions: These preliminary findings highlight the usefulness of an anatomical approach in order to optimize the scanning and interpretation of US findings in CPPD. Further analysis and comparison with other advanced imaging techniques will allow us to better understand the exact role of each technique in the assessment of these pathologies.
3. Assessing Relevant Joints for Monitoring CPPD Diseases by Imaging: A Systematic Literature Review and a Meta-Analysis by the OMERACT Ultrasound—CPPD Subgroup
Antonella Adinolfi 1,*, Silvia Sirotti 2, Garifallia Sakellariou 3, Edoardo Cipolletta 4, Emilio Filippucci 4, Francesco Porta 5, Anna Zanetti 6, Nicola Ughi 1,6, Piercarlo Sarzi-Puttini 2, Carlo Alberto Scirè 6, Helen Keen 7, Carlos Pineda 8, Lene Terslev 9, Annamaria Iagnocco 10, Maria Antonietta D’Agostino 11 and Georgios Filippou 2
- 1
Rheumatology Unit, ASST Grande Ospedale Metropolitano Niguarda, 20162 Milano, Italy
- 2
Rheumatology Department, Luigi Sacco University Hospital, 20157 Milano, Italy
- 3
Division of Rheumatology, IRCCS Policlinico San Matteo Foundation, University of Pavia, 27100 Pavia, Italy
- 4
Rheumatology Unit, Department of Clinical and Molecular Sciences, Università Politecnica delle Marche, 60126 Ancona, Italy
- 5
Interdisciplinary Pain Medicine Unit, Rheumatology Section, Santa Maria Maddalena Hospital, 45030 Rovigo, Italy
- 6
Italian Society of Rheumatology Epidemiology Research Unit, University of Milano-Bicocca, 20126 Milano, Italy
- 7
Medicine and Pharmacology Department, The University of Western Australia, Murdoch, Perth 6210, Australia
- 8
Rheumatology Department, Instituto Nacional de Rehabilitacion, C.P., Mexico 14389, Mexico
- 9
Center for Rheumatology and Spine Diseases, Rigshospitalet, Copenhagen University, 2100 Copenhagen, Denmark
- 10
Rheumatology Unit, Department of Clinical and Biological Sciences, Università degli Studi di Torino, 10100 Torino, Italy
- 11
Rheumatology Department, Fondazione Policlinico Universitario “Gemelli”, IRCCS, 00196 Rome, Italy
- *
Abstract: Objectives: Imaging has been extensively used for the diagnosis of calcium pyrophosphate deposition disease (CPPD), but the exact prevalence of joint calcifications at imaging in CPPD patients has not been thoroughly assessed. This systematic literature review (SLR) and meta-analysis aimed to estimate the prevalence of calcium crystal deposits, detected by imaging, at peripheral joints in suspected or definite CPPD patients to identify the most relevant joints for CPPD diagnosis and monitoring. Methods: After defining PICOs, Pubmed and Embase were searched from inception to October 2020 for identifying studies that evaluated conventional radiography (CR) and ultrasound (US) application in detecting calcifications at peripheral joints in patients with defined (Research Question 1-[RQ1]) or probable CPPD diagnosis (Research Question 2 [RQ2]). Search strategies based on MeSH terms and free text were applied. The SLR was divided into two phases and independently performed by six reviewers, following prespecified criteria for inclusion. The studies were firstly screened according to titles and abstracts, and then the eligible articles were evaluated in full text for inclusion and data extraction. To reduce the methodological heterogeneity, the data were divided into three subgroup analyses, according to the index joint used for CPPD diagnosis or the reference standard applied. The first subanalysis included the studies with the knee as index joint, and the second the articles that considered the knee or the wrist as index joint, both without restrictions with respect to a reference standard. Finally, the third subanalysis included studies that used synovial fluid analysis (SFA) or histology as the reference standard without restrictions concerning the index joint. Results: The SLR identified 1826 manuscripts. A total of 543 papers were entered into the full text evaluation and 107 articles were finally included. In the first phase, 1009 abstracts and 381 articles at full-text evaluation were excluded. Among the included papers, 23 considered definite CPPD patients and 74 papers referred to suspected CPPD patients. In the first subanalysis, 82 articles were entered (12 RQ1/70 RQ2), in the second 95 (18 RQ1/77 RQ2), while the third included 25 papers (3 RQ1/22 RQ2). The results are summarized in
Table 2. The knee is the joint with the highest prevalence in confirmed and suspected CPPD patients at both CR and US, with no difference between the first and the second subanalysis, followed by the wrist, which obtained higher prevalence in patients with confirmed CPPD, also showing differences according to the imaging technique applied. Considering other joints, decreasing prevalence values were observed at the shoulder in both groups and at the hip only in suspected CPPD. The hand joints had the lowest prevalence of CPPD at imaging. Considering the third subanalysis, the data were available only for the knee, showing a higher prevalence when US was applied. Conclusion: According to the results of this study, knees and wrists could be the sentinel joints for CPPD detection by imaging. Furthermore, US seems to detect a higher number of CPP deposits than CR when a more restrictive reference standard is used.
4. The Association of Intra-Articular Mineralization on CT and Radiographic Chondrocalcinosis with Location-Specific Cartilage Loss on MRI in Knee OA: The Multicenter Osteoarthritis Study
Jean Liew *, Ali Guermazi, Mohamed Jarraya, Na Wang, David Felson, Cora E. Lewis, John Lynch, Michael Nevitt, James Torner and Tuhina Neogi
Section of Rheumatology, Boston University School of Medicine, 650 Albany St, X200, Boston, MA 02118, USA
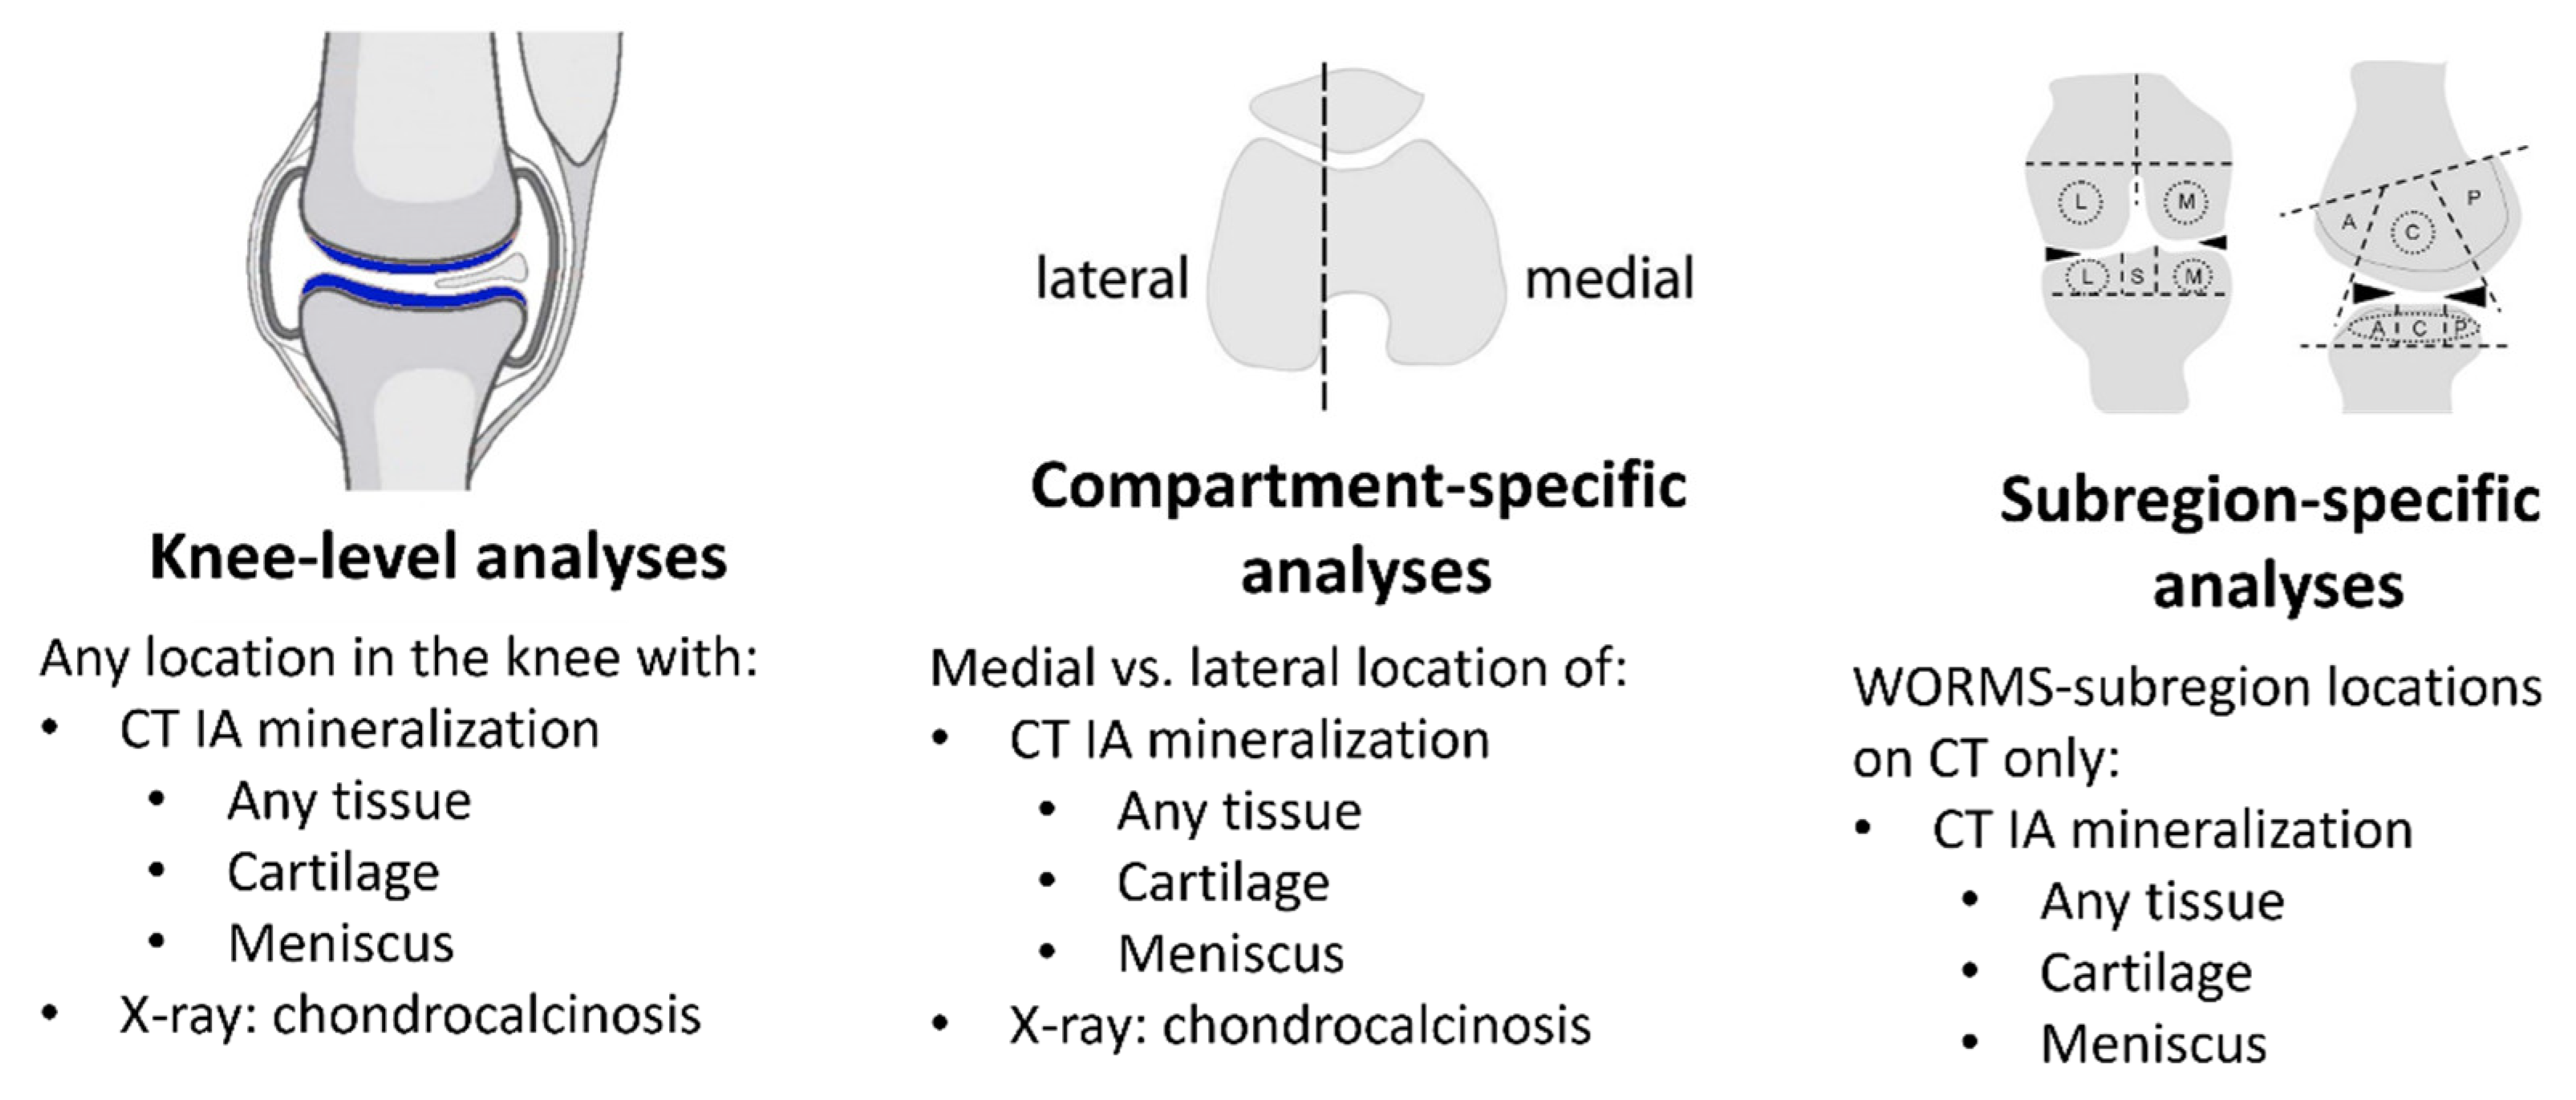
Abstract: Background: The effect of chondrocalcinosis on knee OA progression remains controversial, possibly due to the insensitivity of radiographs for potential location-specific intra-articular (IA) effects of crystal deposition. We studied the relation of IA mineralization on CT and chondrocalcinosis on radiographs to cartilage loss on MRI, with a focus on location-specific effects. Methods: We included participants from the Multicenter Osteoarthritis (MOST) Study who had knee radiographs, CTs and MRIs. IA mineralization was assessed at baseline on CT using the semi-quantitative (0–3) Boston University Calcium Knee Score (BUCKS) in WORMS subregions. We categorized CT mineralization as occurring: (1) anywhere in the knee; (2) in cartilage; (3) on the meniscus; and (4) in the medial or lateral tibiofemoral (TF) compartment. Chondrocalcinosis was assessed at baseline on knee radiographs and categorized as being present in the medial or lateral TF compartments. Cartilage worsening on MRI was defined as any increase in the semi-quantitative MOAKS score between the baseline and a two-year follow-up. We evaluated the relation of IA mineralization on CT and on radiograph anywhere in the knee to the presence of any MRI cartilage worsening using binomial regression with generalized estimating equations. We also analyzed cartilage and meniscal mineralization in a compartment-specific manner (e.g., relation of medial mineralization to risk of medial cartilage loss), as well as WORMS subregion-specific (e.g., central femur mineralization with central femur cartilage loss) (
Figure 3). Radiographic chondrocalcinosis was also assessed in a compartment-specific manner. Results: We included 1673 participants (mean age 60 ± 9, 56% female, mean BMI 28.6 ± 5.0 kg/m
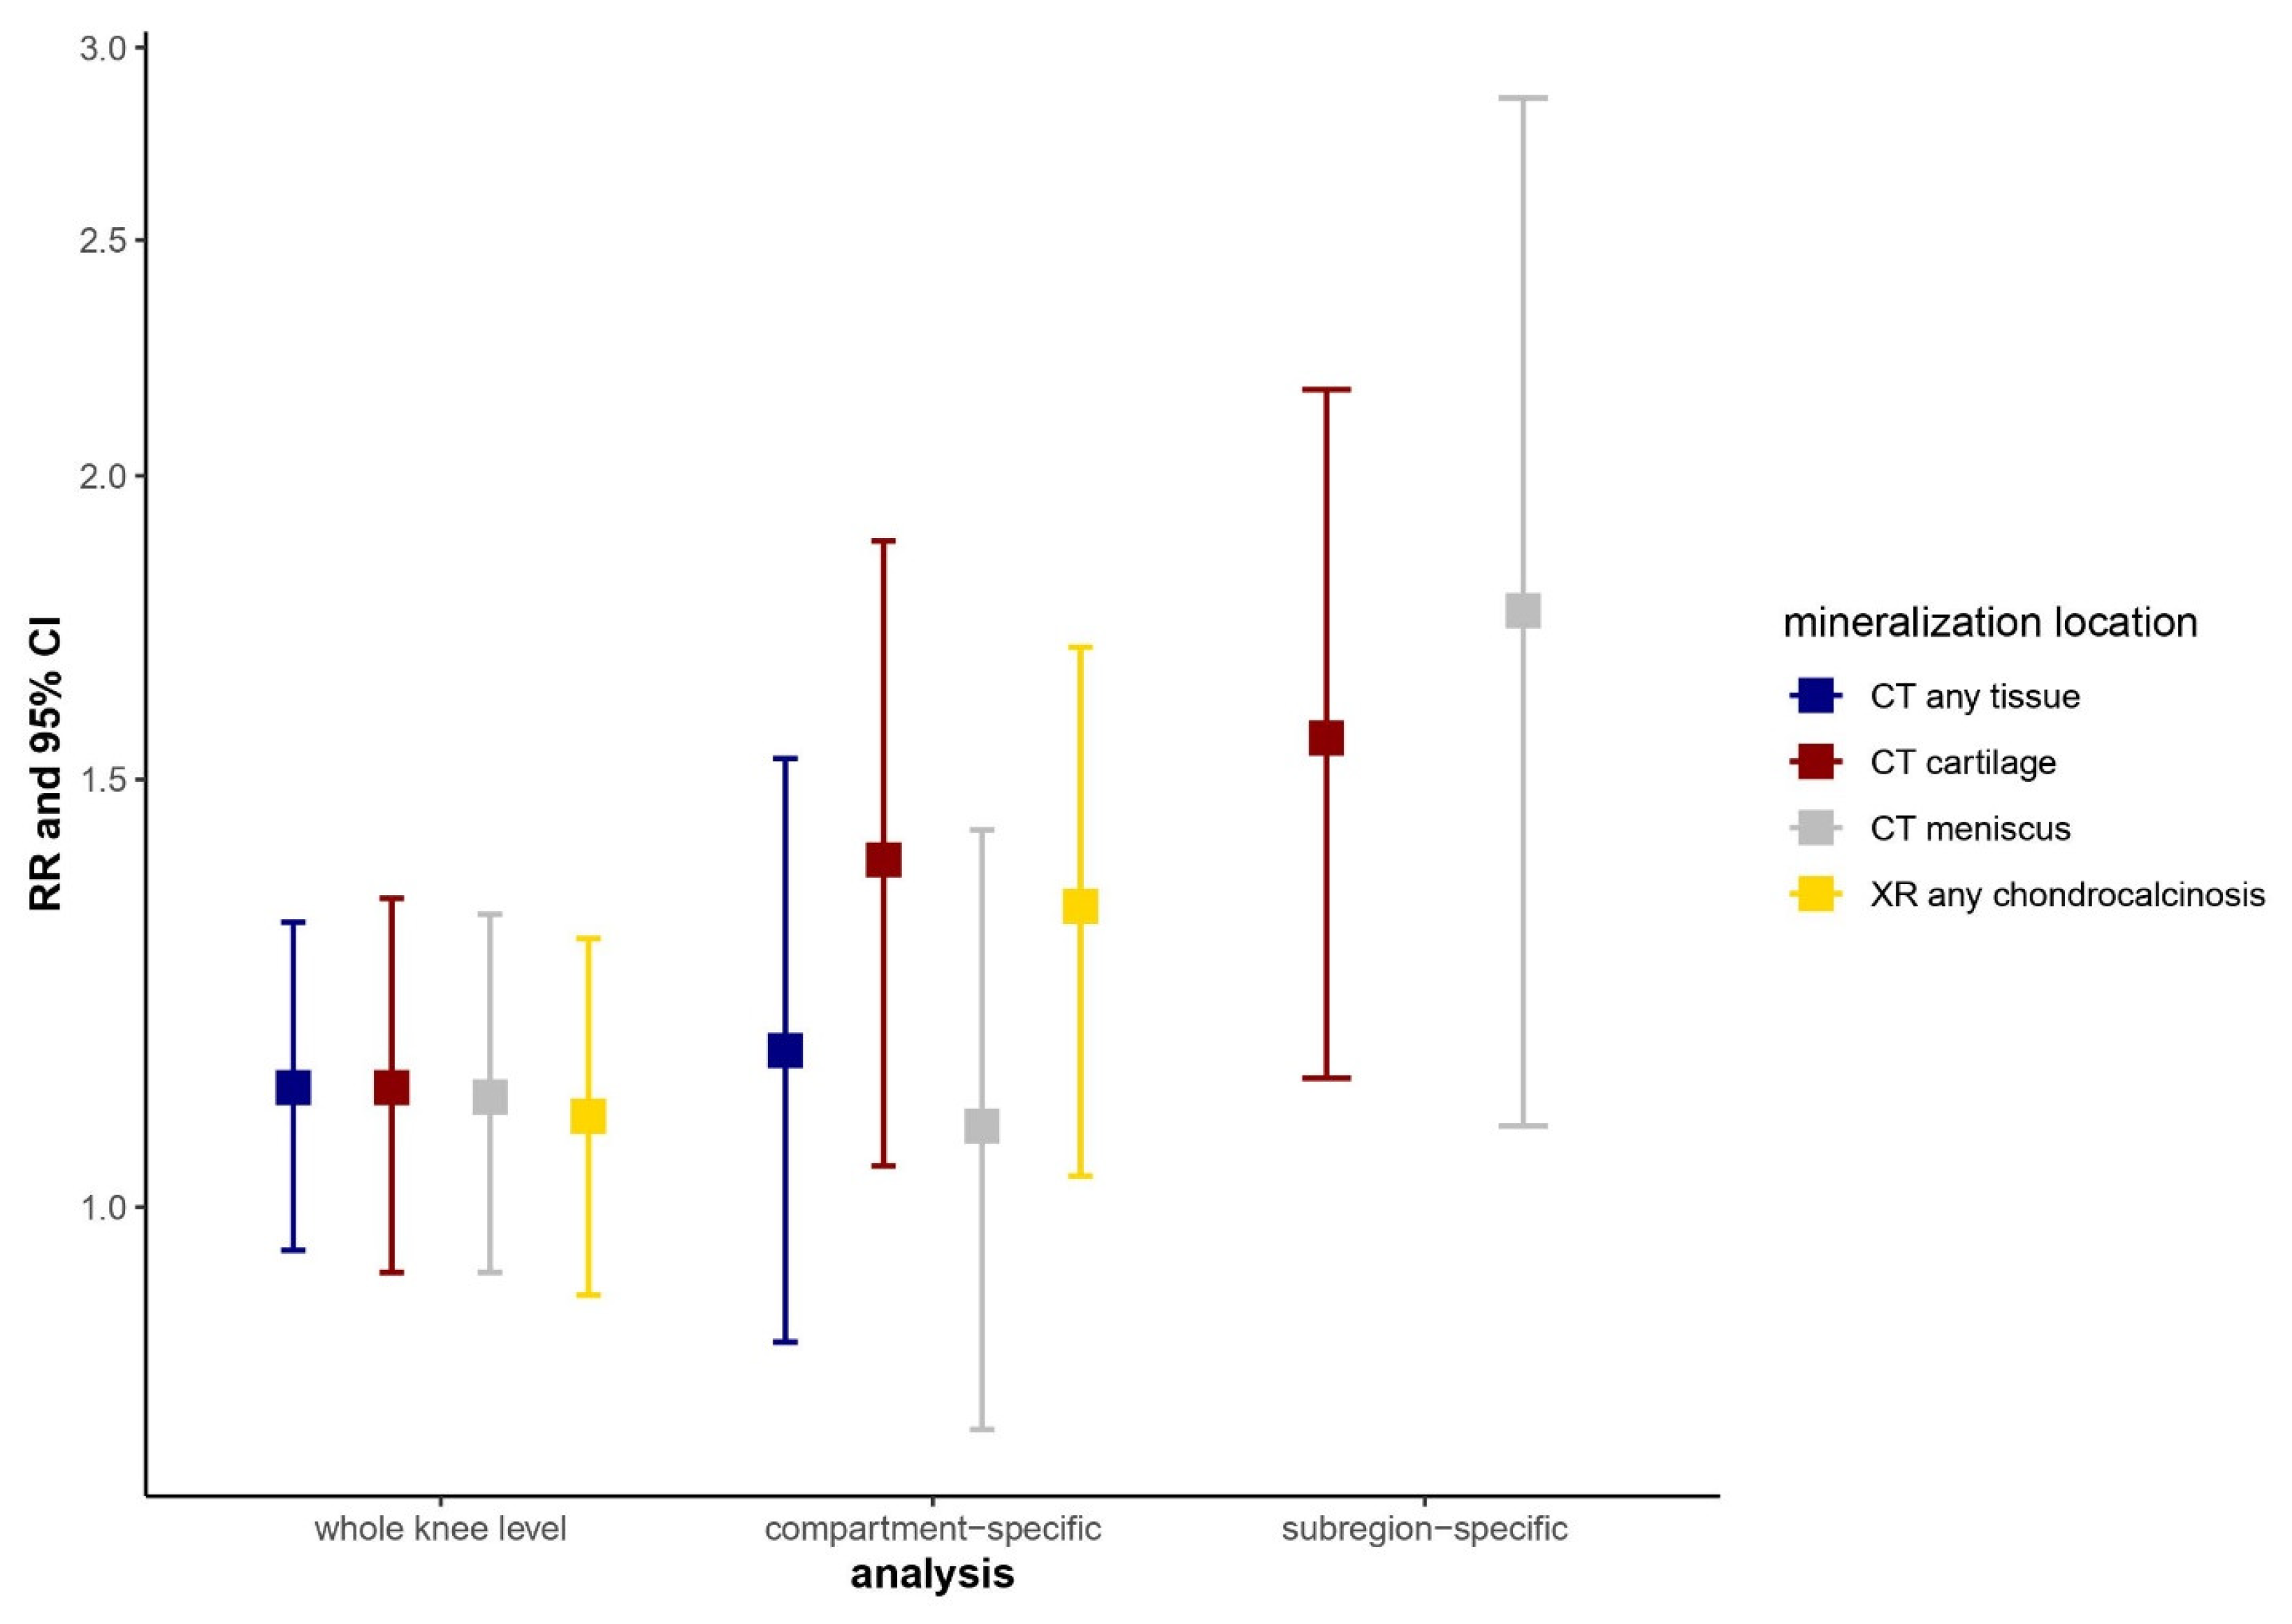
2). Overall, 46.5% had cartilage loss on MRI at 2 years, and 9.0% had IA mineralization in the knee on CT; mineralization in the cartilage and meniscus was present in 6.3% and 7.1%, respectively. Radiographic chondrocalcinosis was present in 6.7%. Mineralization of any tissue on CT, regardless of location, was not associated with MRI cartilage loss (
Figure 4). In contrast, subregion-specific cartilage and meniscal mineralization on CT were associated with a 1.6 (95% CI 1.1–2.2)- and 1.8 (95% CI 1.1–2.9)-times higher risk of cartilage loss in the same compartment, respectively; slightly attenuated associations were noted for compartment-specific analyses. Similarly, we found no association of radiographic chondrocalcinosis with MRI cartilage loss when assessed without regard to location (RR 1.09, 95% CI 0.91–1.30), while there was a compartment-specific association with a higher risk of MRI cartilage loss (RR 1.33, 95% CI 1.03–1.70). Conclusions: IA mineralization in the cartilage and meniscus on knee CT was associated with higher risk of cartilage loss in the same subregion over two years, but was not associated with cartilage loss in the knee as a whole without regard to location. A similar, but less strong, pattern of association was noted for radiographic chondrocalcinosis. These findings suggest tissue-specific and localized effects of IA mineralization on cartilage pathology in knee OA.
5. Serum Proteome Profiles of Gout and Asymptomatic Hyperuricemia Reveal Common and Persistent Inflammatory Alterations
Georgiana Cabău 1,*, Orsolya Gaal 1,2, Medeea Badii 1,2, Valentin Nica 1, Andreea-Manuela Mirea 3, Ioana Hotea 4, Cristina Pamfil 4, Simona Rednic 4, Radu A. Popp 1, Mihai G. Netea 2, Tania O. Crișan 1,2, Leo A.B. Joosten 1,2 and HINT Consortium
- 1
Department of Medical Genetics, “Iuliu Haţieganu” University of Medicine and Pharmacy, 400012 Cluj-Napoca, Romania
- 2
Department of Internal Medicine, Radboudumc, 6525 GA Nijmegen, The Netherlands
- 3
Emergency Clinical Hospital for Children, 400394 Cluj-Napoca, Romania
- 4
Department of Rheumatology, “Iuliu Haţieganu” University of Medicine and Pharmacy, Cluj-Napoca 400012, Romania
- *
Abstract: Background: Gout is a common arthritis caused by the deposition of monosodium urate crystals. Hyperuricemia is the most important risk factor, with urate-lowering therapy efficacy in gout being supported by clinical trials. Although a large body of research supports an association of hyperuricemia with the development of cardio-metabolic disorders, it is additionally treated only in nephrolithiasis. This study aimed to investigate the inflammatory proteomic profiles in gout and asymptomatic hyperuricemia and monitor alterations in the gout signature following urate-lowering therapy. Methods: The serum proteome of 213 patients with gout, 173 with asymptomatic hyperuricemia and 196 normouricemic controls was assessed using the Olink® Target 96 Inflammation panel. Another group of 25 gout patients were included in a treat-to-target study and assessed before, and at one and three months following urate-lowering therapy. For protein functional validation, peripheral blood mononuclear cells were stimulated with microbial or sterile ligands in the presence or absence of FGF-21. Cytokine production was assessed by ELISA. Results: 35 proteins were elevated in patients with gout and 53 in hyperuricemic individuals compared to the normouricemic controls. Among these, 32 inflammatory markers were shared by the gout and hyperuricemia groups. The treat-to-target study group showed a persistent inflammatory signature under treatment. The hepatokine FGF-21 was strongly expressed in both groups. In vitro, FGF-21 increased cytokine production in human PBMCs stimulated with E. coli and LPS, while decreasing IL-1β, IL-6 and IL-1Ra in response to C16 and MSU co-stimulation. This differential dual effect on cytokine production correlated with the co-receptor Klotho-beta gene expression. Conclusions: The serum proteome analysis of gout and hyperuricemia shows elevated levels of multiple inflammatory proteins and marked a similarity between the two signatures, pointing towards common mechanisms of inflammation. We bring evidence for the association of hyperuricemia with long-term inflammatory alterations, which could explain the higher prevalence of comorbidities seen in gout and hyperuricemic patients, ultimately raising the question of treatment of asymptomatic hyperuricemia. We describe a stimulus-dependent role of FGF-21 and Klotho-beta on cytokine production, which may play a role in limiting gouty inflammation induced by C16 and MSU. Lastly, we show that urate-lowering therapy fails to promptly restore the alteration of the serum proteome in gout, with further studies being needed to assess whether long-term treatment can reverse these changes.
6. Gout-Associated SNP at the IL1RN-IL1F10 Region is Functionally Linked to Altered Cytokine Production in PBMCs of Patients with Gout and Controls
Orsolya I. Gaal 1,2,*, Medeea Badii 1,2, Megan Leask 3,4, Valentin Nica 1, Tania O. Crișan 1, Tony R. Merriman 3,4, Leo A.B. Joosten 1,2 and HINT Consortium
- 1
Department of Medical Genetics, Iuliu Hațieganu University of Medicine and Pharmacy, Cluj-Napoca 400012, Romania
- 2
Department of Internal Medicine, Radboud Institute for Molecular Life Sciences (RIMLS), Radboud University Medical Center, 6525 GA Nijmegen, The Netherlands
- 3
Department of Biochemistry, University of Otago, Dunedin 9012, New Zealand
- 4
Division of Clinical Immunology and Rheumatology, University of Alabama at Birmingham, Birmingham, AL 35294, USA
- *
Abstract: Introduction: Gout is an important inflammatory disease, with a high prevalence in developed countries. The precondition for developing gout is the deposition of monosodium urate (MSU) crystals in the joint and other tissues as a result of elevated serum urate levels. Interleukin (IL)-1β is the central inflammatory cytokine in gout, which is antagonized by IL1- Receptor antagonist (IL-1Ra). IL1F10 (known as IL38) has a significant role in the immune responses, suppressing inflammatory conditions. In the present study, we test for possible functional implications of genetic variation at the IL1RN-IL1F10 region in gout. Materials and methods: Global gout data were used to assess the genetic association of IL1RN and IL1F10 loci with gout. A colocalization analysis of the identified gout signal with genetic control of gene expression was performed using Genotype-Tissue Expression (GTEx) eQTL data. Functional validation was performed using the HINT study groups (gout and controls, Romania) and 500FG (healthy controls, the Netherlands). The transcription level of IL1RN-IL1F10 was investigated in freshly isolated PBMCs from gout patients and healthy controls by RNA sequencing. Genomic DNA was isolated from whole blood, and genotyping was performed using the Illumina Infinium Global Screening Array. Circulating IL1Ra and IL38 levels were measured. Ex vivo functional assays were performed, consisting of PBMC stimulations with C16+MSU crystal (gout relevant stimulus, TLR2/NLRP3 activator) or LPS (TLR4 ligand), for 24 h. Cytokines were assessed by ELISA. Results: The IL1F10-IL1RN region was identified as being associated with gout. The maximally associated variant was rs9973741, with allele G as the gout risk allele. The genetic association signal colocalized with expression for IL1RN or IL1F10 in several tissues. In unstimulated PBMCs, no association of the SNP with IL1RN expression was observed. Variation in IL1F10 expression could not be assessed, due to low expression levels. Nevertheless, G allele carriers showed lower IL1RN expression in PBMCs stimulated with C16+MSU. The G risk allele was associated with significantly lower levels of circulating IL1RA in both controls and patients with gout. Serum IL38 protein levels also tended to be lower in G risk allele carriers, albeit at very low detectable levels. PBMCs depicted less spontaneous IL1RA release in GG homozygous controls and significantly lower IL1Ra production in response to C16+MSU co-stimulation in patients with gout. In addition, the SNP was associated with significantly elevated IL-1β cytokine production in response to C16+MSU in 500FG healthy controls. Conclusions: A gout association signal at IL1RN-IL1F10 co-localized with the expression of IL1RN and IL1F10. Using two independent study cohorts and the lead gout variant SNP, we show that this variant associates with lower IL1Ra circulating levels, lower IL1Ra production in PBMC assays and elevated IL-1β production in cells challenged with C16+MSU crystal. Our data indicate that the genetic signal that associates with gout at IL1RN-IL1F10 functions to alter the expression of IL1RN/IL1F10, resulting in altered cytokine profiles; however, the causal genetic variant is yet to be identified.
7. Comparison of IL1 Receptor Antagonist and Interferon Inducible Gene Signatures of Urate-Treated PBMCs and Primary Cells from Patients with Hyperuricemia and Gout
Medeea Badii 1,2,*, Orsolya Gaal 1,2, Viola Klück 2, Georgiana Cabău 1, Valentin Nica 1, Ioana Hotea 1, Mihai G. Netea 2,3, Radu A. Popp 1, Tania O. Crișan 1,2, Leo A. B. Joosten 1,2 and HINT Consortium
- 1
Department of Medical Genetics, Iuliu Hatieganu University of Medicine and Pharmacy, Cluj-Napoca 400012, Romania
- 2
Department of Internal Medicine and Radboud Institute for Molecular Life Sciences (RIMLS), Radboud University Medical Center, 6525 GA Nijmegen, The Netherlands
- 3
Department of Immunology and Metabolism, LIMES-Institute, University of Bonn, 53115 Bonn, Germany
- *
Abstract: Introduction: Previous transcriptomic assessment in PBMCs treated with urate highlighted relevant pathways for inflammatory cytokine production and IL1 receptor antagonist (IL-1Ra) downregulation, as well as inhibited type I interferon inducible gene expression. Type I interferons (IFNs) are involved in innate responses to a broad range of stimuli, and have been documented to regulate IL-1 responses in human cells (the induction of IL-1Ra and dampening of IL-1β bioactivity). In this study we evaluate changes and potential functional consequences of interferon-stimulated genes (ISGs) and IL-1Ra changes in the transcriptome of human primary cells in response to urate in vitro and in correlation with serum urate levels in patients. Material and methods: Primary human monocytes (n = 4) and PBMCs of gout patients (n = 50) were pre-treated in vitro with urate solubilized in RPMI followed by stimulation with LPS. In addition, PBMCs (n = 48) were treated in vitro for 24 h with various TLR ligands (e.g., C. albicans, S. aureus, E. coli, M. tuberculosis, PHA, LPS+MSU, Poly:IC and CpG). IL-1Ra cytokine production and RNA sequencing were performed in cells exposed to urate and TLR ligands. STAT1 phosphorylation was assessed by flow cytometry in monocytes treated with urate 10 or 50 mg/dL. Cytokine response to IFN-β 100 IU/mL was assessed by ELISA in the supernatants of PBMCs cultured for 24 h in the presence or absence of soluble urate (50, 25, 12.5 mg/dL) and restimulated for 24 h with LPS 10 ng/mL + MSU 300 µg/mL. Results: Transcriptome sequencing and ontological analysis of differentially expressed genes identified type 1 interferon-related signaling pathways to be inhibited in human monocytes upon in vitro urate exposure. This downregulation of type 1 interferon pathways was replicated in PBMCs treated in vitro with urate 50 and 12.5 mg/dL. Urate treatment resulted in lower levels of phosphorylated STAT1 and decreased expression of STAT1 and STAT2. The stimulation of PBMCs with IFN-β in the presence of urate did not modify the pro-inflammatory effects of the urate pre-treatment. Importantly, the expression of ISGs in PBMCs of gout patients stimulated with C. albicans, Poly:IC or CpG showed a negative correlation with circulating serum urate levels. Moreover, Il-1Ra production in 24 h stimulated PBMCs was inversely correlated with the circulating serum urate levels of the subjects. Conclusions: In vitro, urate pretreatment of monocytes reduces the expression of ISGs and downregulates IL1Ra production. In this study, high levels of serum urate in vivo are inversely correlated with ISGs in response to C. albicans, Poly I:C and CpG stimulations, supporting a deficient type I IFN signaling that is not restricted to viral stimulations. As inducing type 1 IFN with IFN-β did not reverse the proinflammatory effect of urate, this is unlikely to play a role in the inflammatory priming due to urate. However, together with poor IL-1Ra responses in stimulated PBMCs of hyperuricemic individuals, this might propose a detrimental effect of soluble urate pre-exposure that is independent of stimulus and may broadly impact innate immune pathways.
8. The OMERACT Validation Process of Ultrasound for Assessment of CPPD: What’s Next? A Scoring for CPPD Extent!
Silvia Sirotti 1,*, Emilio Filippucci 2, Annamaria Iagnocco 3, Ingrid Moller 4, Esperanza Naredo 5, Florentin A. Vreju 6, Antonella Adinolfi 7, Anna Zanetti 8, Arianna Damiani 9, Fabio Becce 10, Tomas Cazenave 11, Edoardo Cipolletta 2, Sara-Nysom Christiansen 12, Andrea Delle Sedie 13, Mario Diaz 14, Fabiana Figus 15, Hilde Berner Hammer 16, Peter Mandl 17, Daryl MacCarter 18, Mihaela Micu 19, Mohamed Mortada 20, Gael Mouterde 21, Francesco Porta 22, Antony M. Reginato 23, Garifallia Sakellariou 24, Wolfgang A Schmidt 25, Carlo-Alberto Scirè 8, Teodora Serban 26, Violeta Vlad 27, Richard J Wakefield 28, Pascal Zufferey 29, Piercarlo Sarzi-Puttini 1, Carlos Pineda 30, Helen Keen 31, Maria-Antonietta D’Agostino 32, Lene Terslev 12 and Georgios Filippou 1
- 1
Rheumatology Department, IRCCS Ospedale Galeazzi–Sant’Ambrogio, 20157, Milan, Italy
- 2
Rheumatology Unit, Department of Clinical and Molecular Sciences, Polytechnic University of Marche, 60126 Ancona, Italy
- 3
Department of Clinical and Biological Sciences, Università degli Studi di Torino, 10024 Turin, Italy
- 4
Instituto Poal de Reumatologia, University of Barcelona, 08022 Barcelona, Spain
- 5
Rheumatology Department, Joint and Bone Research Unit, Hospital Universitario Fundación Jiménez Díaz and IIS-FJD, Universidad Autónoma of Madrid, 28040 Madrid, Spain
- 6
Rheumatology Department, University of Medicine and Pharmacy of Craiova, 200349 Craiova, Romania
- 7
Rheumatology Division, ASST Grande Ospedale Metropolitano Niguarda, 20162 Milan, Italy
- 8
Società Italiana di Reumatologia, Epidemiology Research Unit, 20100 Milan, Italy
- 9
Department of Experimental and Clinical Medicine, University of Florence, 50134 Florence, Italy
- 10
Department of Diagnostic and Interventional Radiology, Lausanne University Hospital, University of Lausanne, 1011 Lausanne, Switzerland
- 11
Instituto de Rehabilitación Psicofísica, Buenos Aires C1429, Argentina
- 12
Center for Rheumatology and Spine Diseases, Rigshospitalet, 2600 Copenhagen, Denmark
- 13
Azienda Ospedaliero-Universitaria Pisana, 56126 Pisa, Italy
- 14
University Hospital Fundación Santa Fe de Bogota, 110311 Bogota, Colombia
- 15
Rheumatology Service, ASL Torino 3, Collegno Pinerolo, 10093 Turin, Italy
- 16
Faculty of Medicine, University of Oslo, 0318 Oslo, Norway
- 17
Division of Rheumatology, Department of Internal Medicine III, Medical University Vienna, 1090 Vienna, Austria
- 18
Department of Rheumatology, North Valley Hospital, Whitefish, MN 59937, USA
- 19
Rheumatology Division, 2nd Rehabilitation Department, Rehabilitation Clinical Hospital, 400066 Cluj-Napoca, Romania
- 20
Rheumatology Department, Faculty of Medicine, Zagazig University, 44519 Zagazig, Egypt
- 21
Rheumatology Department & IDESP, CHU Montpellier, Montpellier University, 34090 Montpellier, France
- 22
Interdisciplinary Pain Medicine Unit, Rheumatology Section, Santa Maria Maddalena Hospital, 45030 Occhiobello, Italy
- 23
Division of Rheumatology, The Warren Alpert Medical School of Brown University, Providence, RI 02912, USA
- 24
Department of Internal Medicine and Therapeutics, Università di Pavia, and Istituti Clinici Scientifici Maugeri IRCCS, 27100 Pavia, Italy
- 25
Immanuel Krankenhaus Berlin, Medical Centre for Rheumatology Berlin-Buch, 13125 Berlin, Germany
- 26
Rheumatology Department, Ospedale La Colletta, ASL3 Genovese, 16011 Genoa, Italy
- 27
Sf. Maria Hospital, Rheumatology Department, 011172 Bucharest, Romania
- 28
Leeds Institute of Rheumatic and Musculoskeletal Medicine, University of Leeds, Leeds LS2 9JT, UK
- 29
Rheumatology Department, University of Lausanne, CHUV, 1011 Lausanne, Switzerland
- 30
Division of Rheumatology, Instituto Nacional de Rehabilitacion Luis Guillermo Ibarra Ibarra, Mexico City 14389, Mexico
- 31
School of Medicine, The University of Western Australia, Murdoch, Perth 6150, Australia
- 32
Rheumatology Department, Università Cattolica del Sacro Cuore, Fondazione Policlinico Universitario Agostino Gemelli IRCSS, 00168 Rome, Italy
- *
Abstract: Background: Ultrasound (US) has proven to be a reliable imaging technique for detecting calcium pyrophosphate (CPP) deposition (CPPD) disease. However, no validated grading systems have yet been developed allowing for a quantification of the extent of crystal deposition in CPPD. The aims of this study were to develop a scoring system for the quantification of CPP deposition at a patient level according to the OMERACT framework, and to test its reliability. Methods: A Delphi survey was prepared and circulated among the members of the OMERACT US—CPPD working group, including 32 statements on the sites to be included in the scoring, the scanning technique, and the scoring for single structures. Participants were asked to reply on a 5-point Likert scale, and agreement was achieved when four and five grades reached ≥75% of concordance. Subsequently, two rounds of a web-based exercise were conducted on 120 static images representing equally all sites under investigation and all degrees of crystal deposition, to assess the intra- and inter-reader reliability of the new scoring system. In the second step of the validation process, the experts met for a patient-based exercise in a workshop held in Milan, Italy. Bilateral evaluation of the triangular fibrocartilage complex (TFCC) of the wrist, knee menisci and knee femoral hyaline cartilage (HC) of eight patients was carried out twice in the same day by seven experts, using the novel scoring system. Eight Samsung high-end US machines equipped with high-resolution linear probes were used for the workshop. A short calibration briefing preceded the exercise. Intra- and inter-reader reliability of the new scoring systems was assessed using weighted kappa statistics. Results: Three Delphi rounds were needed to reach agreement on all items. A total of 32/41 members replied in the first round, 26/32 in the second, and 25/26 in the third; 20 statements were approved in the first round, 3 in the second, and 3 in the third round. Only the knees (menisci and HC) and the TFCC were included in the final score, using a four-grade scoring system (0–3). The final scoring, the representative images and the relative technical notes are shown in
Figure 5. A total of 33/41 members participated in the web-based reliability exercise. The inter- and intra-reader reliability ranged from substantial to almost perfect in all the sites and in the overall evaluation (
Table 3). The results of the patient-based exercise are presented in
Table 4. On live scanning, the overall inter- and intra-reader reliability of the scoring was substantial, with HC of the knee demonstrated to be the most reliable site, while the TFCC showed the lowest kappa values. Conclusions: This is the first attempt to create a scoring system for the extent of CPP crystal deposition. The scoring showed a substantial inter-reader reliability and an almost perfect intra-reader reliability on static images, and a substantial intra- and inter reader reliability on patients, demonstrating that it was clear and easily applicable. This study represents a fundamental step in the OMERACT process of validating US as an outcome measure instrument, and the above proposed scoring system will hopefully provide a useful tool for clinical practice and research.
9. Increased Sensitivity and Specificity of Crystal Detection in Novel Photon-Counting-Detector Computed Tomography Compared to Energy-Integrating-Detector Computed Tomography
Florian A. Huber 1,2,*, David Rotzinger 3, Mathias Zadory 4, John M. Froehlich 4, Hatem Alkadhi 1 and Fabio Becce 3
- 1
Institute of Diagnostic and Interventional Radiology, University Hospital Zurich and University of Zurich, 8091 Zurich, Switzerland
- 2
Division of Musculoskeletal Imaging & Intervention, Department of Radiology, Massachusetts General Hospital, Harvard Medical School, Boston, MA 02114, USA
- 3
Department of Diagnostic and Interventional Radiology, Lausanne University Hospital and University of Lausanne, CH-1011 Lausanne, Switzerland
- 4
KlusLab Research, 8032 Zurich, Switzerland
- *
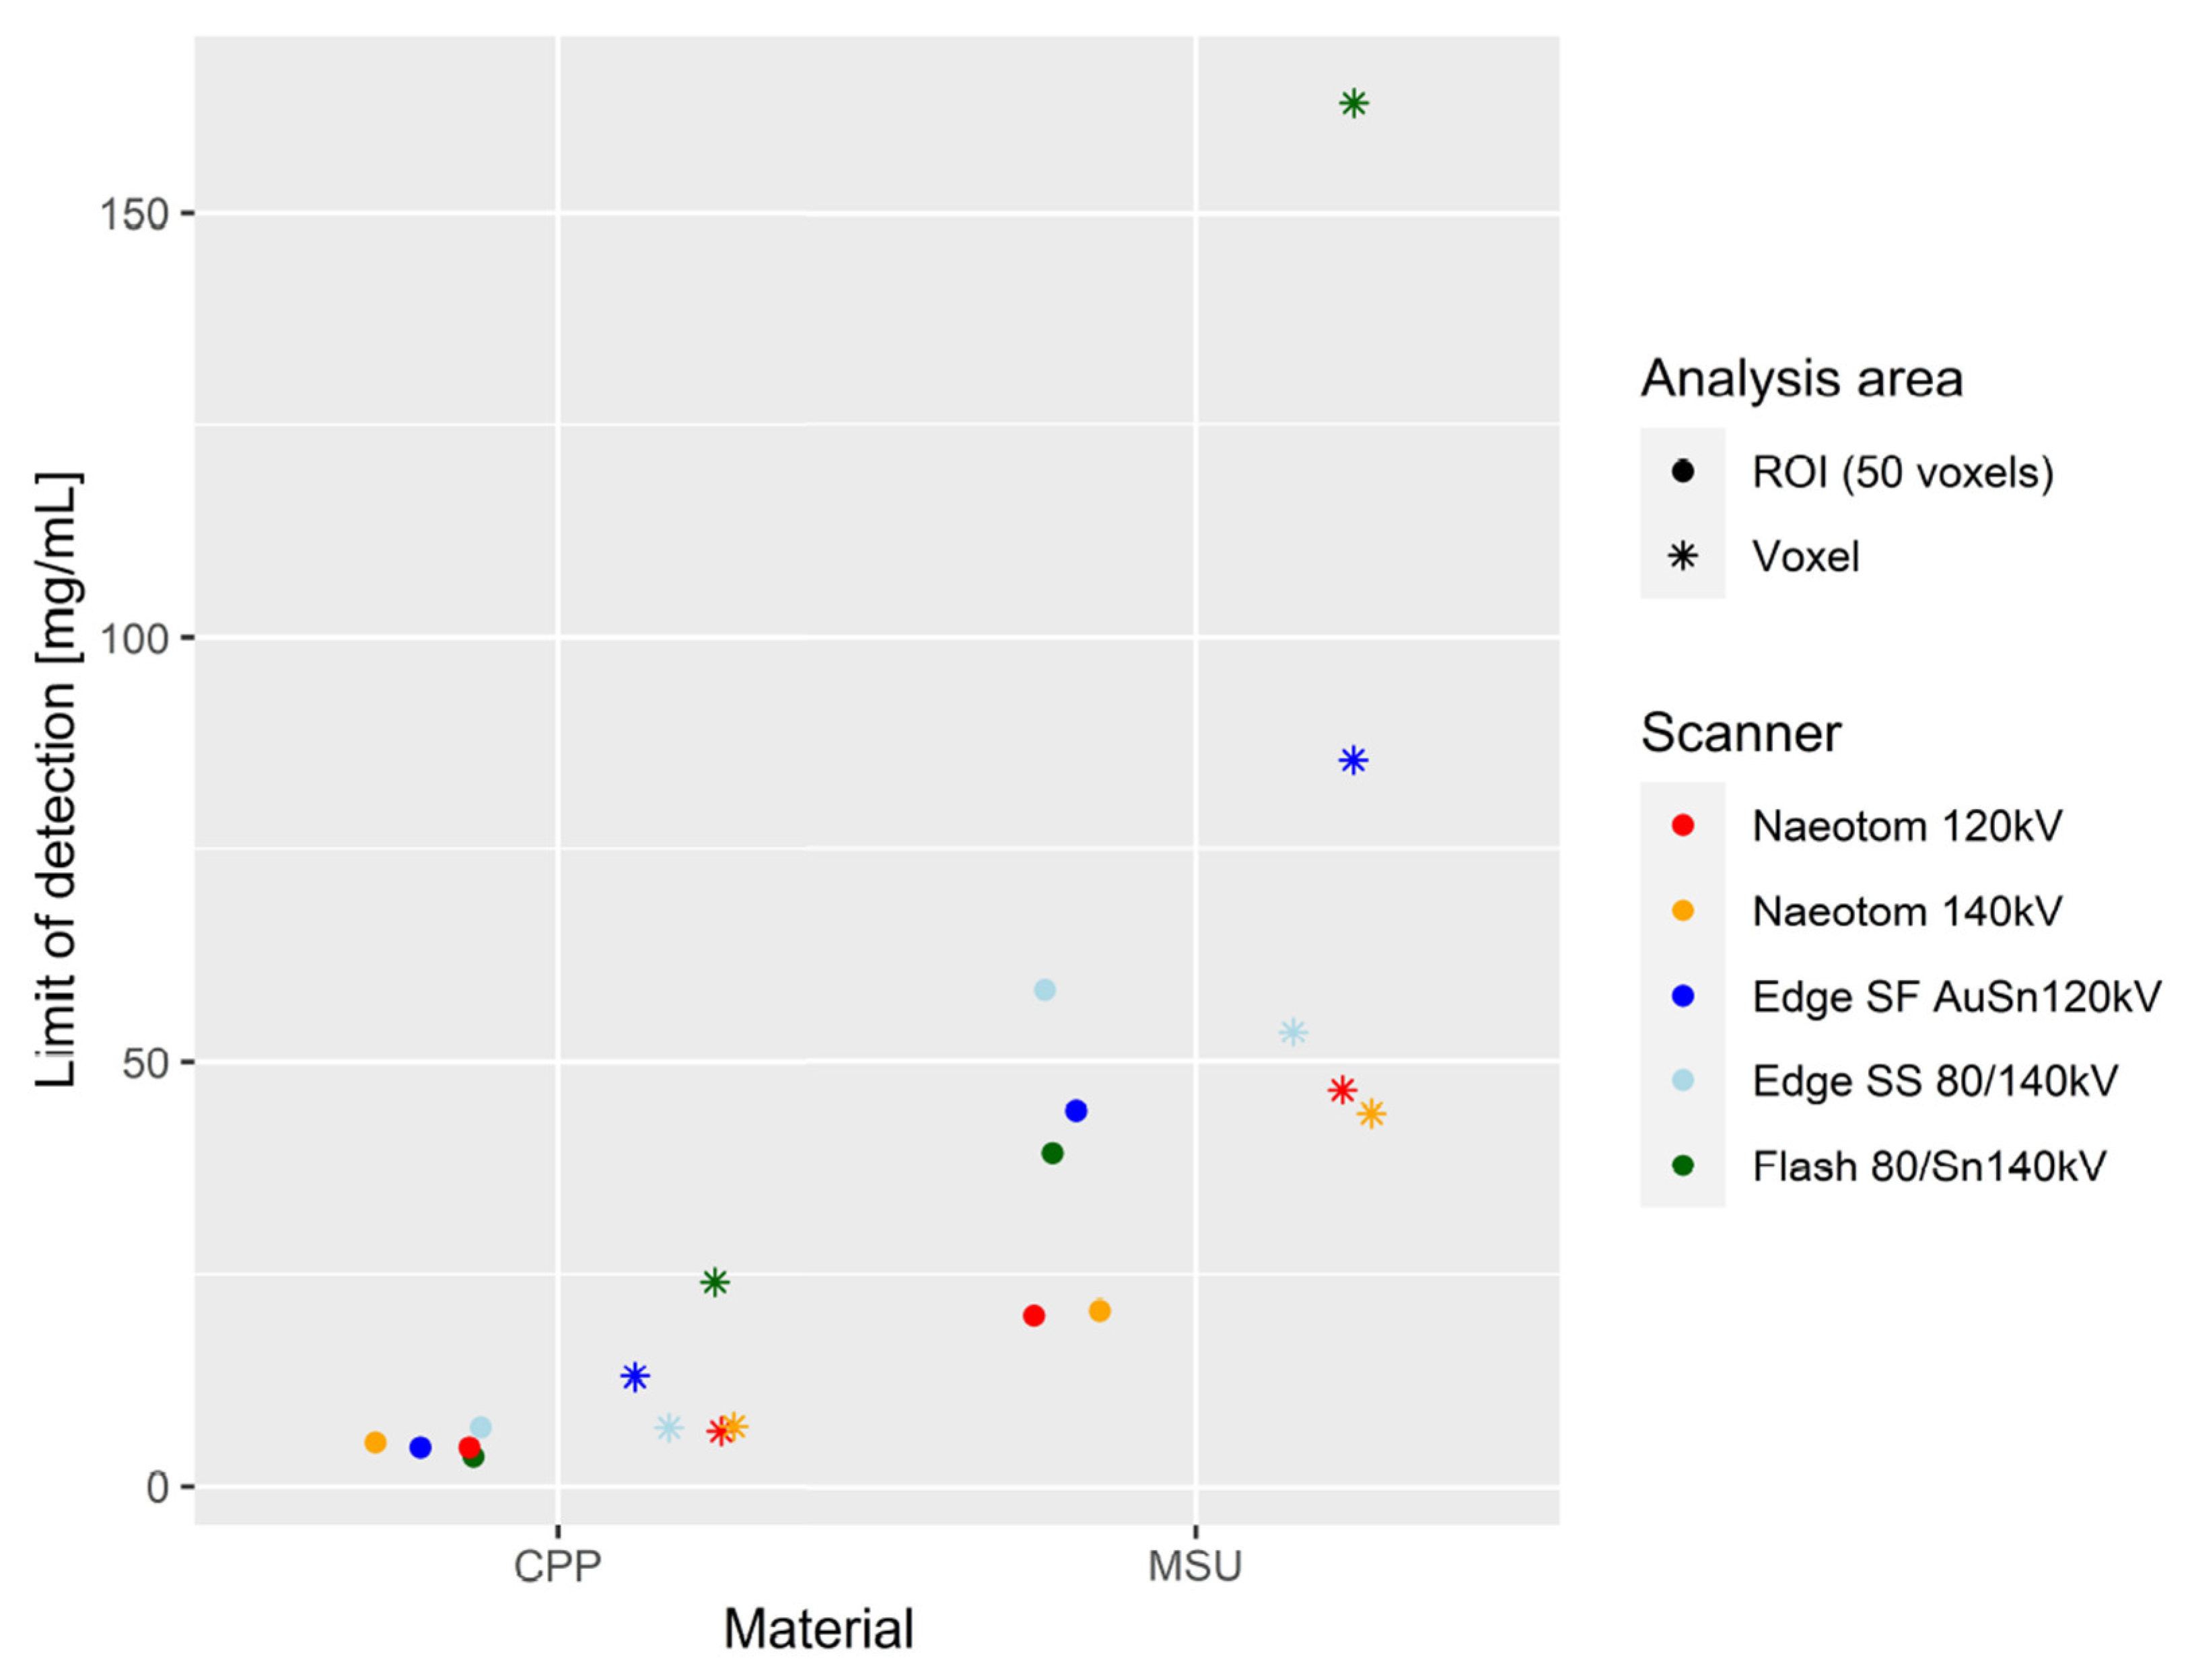
Abstract: Objective: To investigate the diagnostic performance of a novel photon-counting-detector CT (PCD-CT) in the detection and characterization of gout tophi (monosodium urate, MSU) and to compare it with the current clinical generation of energy-integrating-detector CT (EID-CT) scanners. Methods: We used a phantom filled with custom-made industry-standard cylindric rods of MSU (200, 400, 600 mg/mL) and calcium pyrophosphate (CPP, 50, 100, 200 mg/mL). The phantom was scanned with PCD-CT (NAEOTOM Alpha, Siemens, at 120 kV and 140 kV) and with several EID-CT machines (SOMATOM Edge Plus, Siemens, Splitfilter mode at AuSn-filtered 120 kV and sequential spiral mode at 80/140 kV; SOMATOM Flash, Siemens, dual-source mode at 80/Sn-filtered 140 kV). All scans were performed at an identical radiation dose of 8 mGy CTDI
vol. Fixed-size ROI measurements (50 pixel) were performed on axial reconstructions (low and high kV series) on every second continuous slice for ten measurements per rod and series, and mean and standard deviation of Hounsfield units were recorded. Dual-energy (DE) CT ratios were calculated. We used ROC curves and the respective AUC values to assess the differentiability of MSU vs. CPP for each scanner. The limit of detection (LOD, in mg/mL) was assessed for each material (per 50-pixel-ROI-equivalent and per voxel, separately), using linear regression coefficients of attenuation as a function of concentration. A
p-value < 0.05 was considered statistically significant. Results: DECT ratios were significantly different between materials throughout all scans (
p < 0.001). AUC values for differentiation between MSU and CPP were excellent, and comparable between all scans (0.9503 [CI:0.9201–0.9804]-1). LOD per ROI was comparable between scanners for CPP (3.64–7.07) (
Figure 6). LOD per voxel for CPP was lowest in PCD-CT (7.04–7.19), compared to a broad range of values among EID-CT scans (7.07–24.07) (
Figure 6). For MSU, LOD were markedly lower per ROI (20.04–20.58 vs. 39.26–58.45) and per voxel (43.88–46.57 vs. 53.45–162.94) in PCD-CT compared to all EID-CT approaches (
Figure 6). Conclusion: PCD-CT enables the detection of MSU crystalline depositions at lower concentrations than is possible with EID-CT of the newest generation, without a trading-off in accuracy in terms of differentiating MSU from calcium-based crystals related to arthropathies such as CPP. Clinical perspective: The routine use of PCD-CT in the imaging workup of gout patients should be preferred over EID-CT, due to its superior sensitivity of detecting tophi at a lower concentration. Subsequently, optimized image-based disease monitoring may be expected in the future. Alternatively, with respect to existing literature, significant dose reduction could be achieved by lowering the sensitivity limits of PCD-CT to current clinical standards.
10. Epigenetic Activation of the Lysosomal Biogenesis Program by Collaborative Binding with TFEB is Required for Appropriate Response of Macrophages to Monosodium Urate Crystals
Isidoro Cobo 1,*, Roxana Coras 2,3, Enchen Zhou 1, Christopher Nickl 1, Martina Pasillas 1, Bethany R. Fixsen 1, Nathan Spann 1, Anyan Cheng 2, Jessica Murillo-Saich 2, Addison J. Lana 1, Se-Jin Jeong 4,5, Robert Terkeltaub 6, Babak Razani 4,5, Monica Guma 2,3,6 and Christopher K. Glass 1
- 1
Department of Cellular and Molecular Medicine, University of California San Diego, San Diego, La Jolla, CA 92093, USA
- 2
Division of Rheumatology, Allergy, and Immunology. UCSD School of Medicine, 9500 Gilman Drive, La Jolla, CA 92037, USA
- 3
Department of Medicine, Autonomous University of Barcelona, Plaça Cívica, 08193 Bellaterra, Barcelona, Spain
- 4
Cardiovascular Division, Department of Medicine, Washington University School of Medicine, St. Louis, MO 63110, USA
- 5
Department of Pathology and Immunology, Washington University School of Medicine, St. Louis, MO 63110, USA
- 6
VA San Diego Healthcare System, 3350 La Jolla Village Drive, San Diego, CA 92161, USA
- *
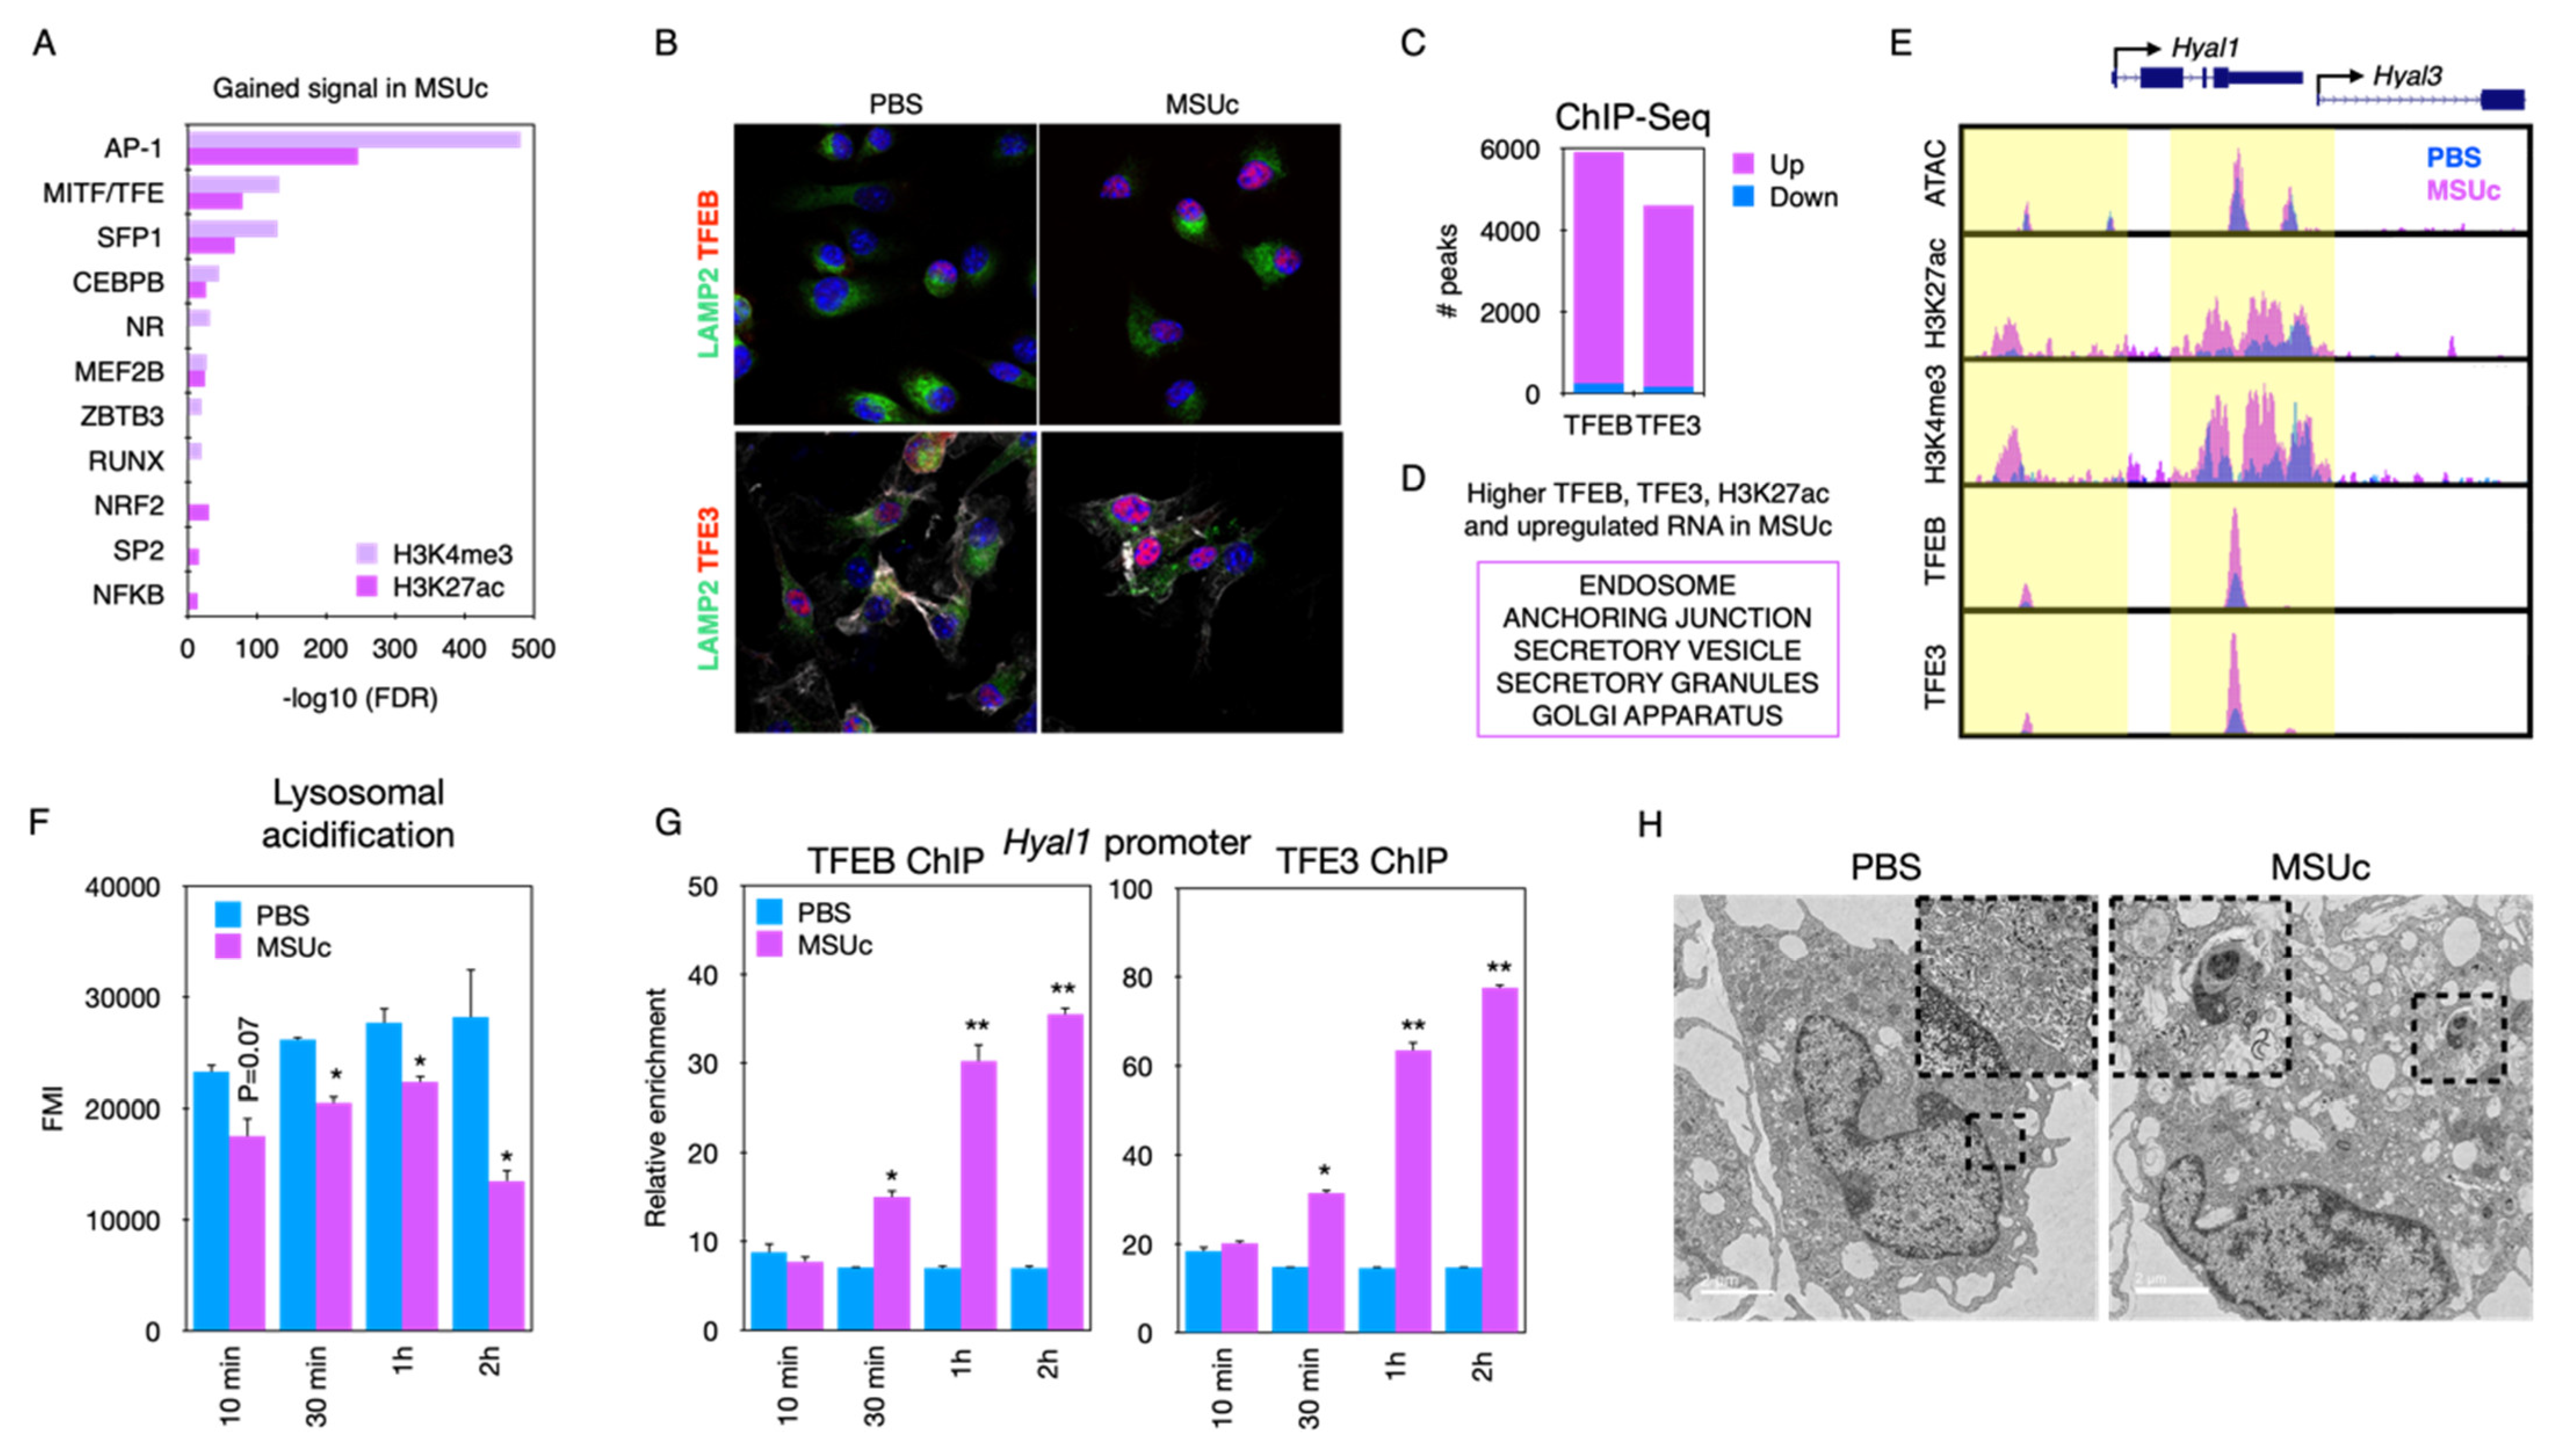
Abstract: Background: We have a poor understanding of the epigenetic programs required to mount an appropriate inflammatory response in macrophages upon stimulation with monosodium urate crystals (MSUc). Here, we unravel a collaborative network of transcription regulators that control a crucial lysosomal biogenesis program in macrophages stimulated with MSUc. Methods: RNA-Seq and ATAC-Seq after activation of BMDM by MSUc (0.25 mg/mL) or LPS (100 ng/mL). Pre-treatment with chloroquine (1–10 µM). Myeloid-specific TFEB overexpressing mice, Bhlhe40 KO mice and Bhlhe41 KO mice were utilized. Confocal and electron microscopy imaging (TEM), the quantification of lysosomal activity and cell viability assays were used. Results: The analysis of regions with gained H3K27ac or H3K4me3 signal from MSUc contain motifs for the MITF/TFE transcription factor family (
Figure 7A). Stimulation with MSUc leads to increased nuclear localization and the ChIP-Seq signal of TFEB and TFE3 in lysosomal genes, including
Hyal1 and
Hyal3 (
Figure 7B–E). Lysosomal acidification is reduced after MSUc (
Figure 7F) and precedes TFEB-TFE3 binding to the
Hyal1 promoter (
Figure 7G), and this precedes the induction of lysosomal damage (
Figure 7H). Genetic or chloroquine-induced chemical induction of TFEB ameliorates the changes made by MSUc (
Figure 8A,B) by increasing the expression of lysosomal genes, including
Atp6v1c1 (
Figure 8C), which improves lysosomal acidification and cell survival at 12 h (
Figure 8D,E). DOT1L, BHLHE40 and BHLHE41 are among the most upregulated nuclear proteins, and cooperate with TFEB in the induction of lysosomal and secretory genes, including
Cd9 in macrophages stimulated with MSUc (
Figure 9A–C). Surprisingly, Bhlhe40 and Bhlhe41 are dispensable for inducing the lysosomal program such as
Atp6v1c1 (
Figure 9D), and have no effect on the cell survival of macrophages caused by MSUc (
Figure 9E,F) Conclusion: The activation of the lysosomal program by TFEB and TFE3 is required to mount an appropriate response of the macrophages to MSUc, and suggests the lysosomal program as a novel target for blunting the inflammatory response to MSUc during gout flares.
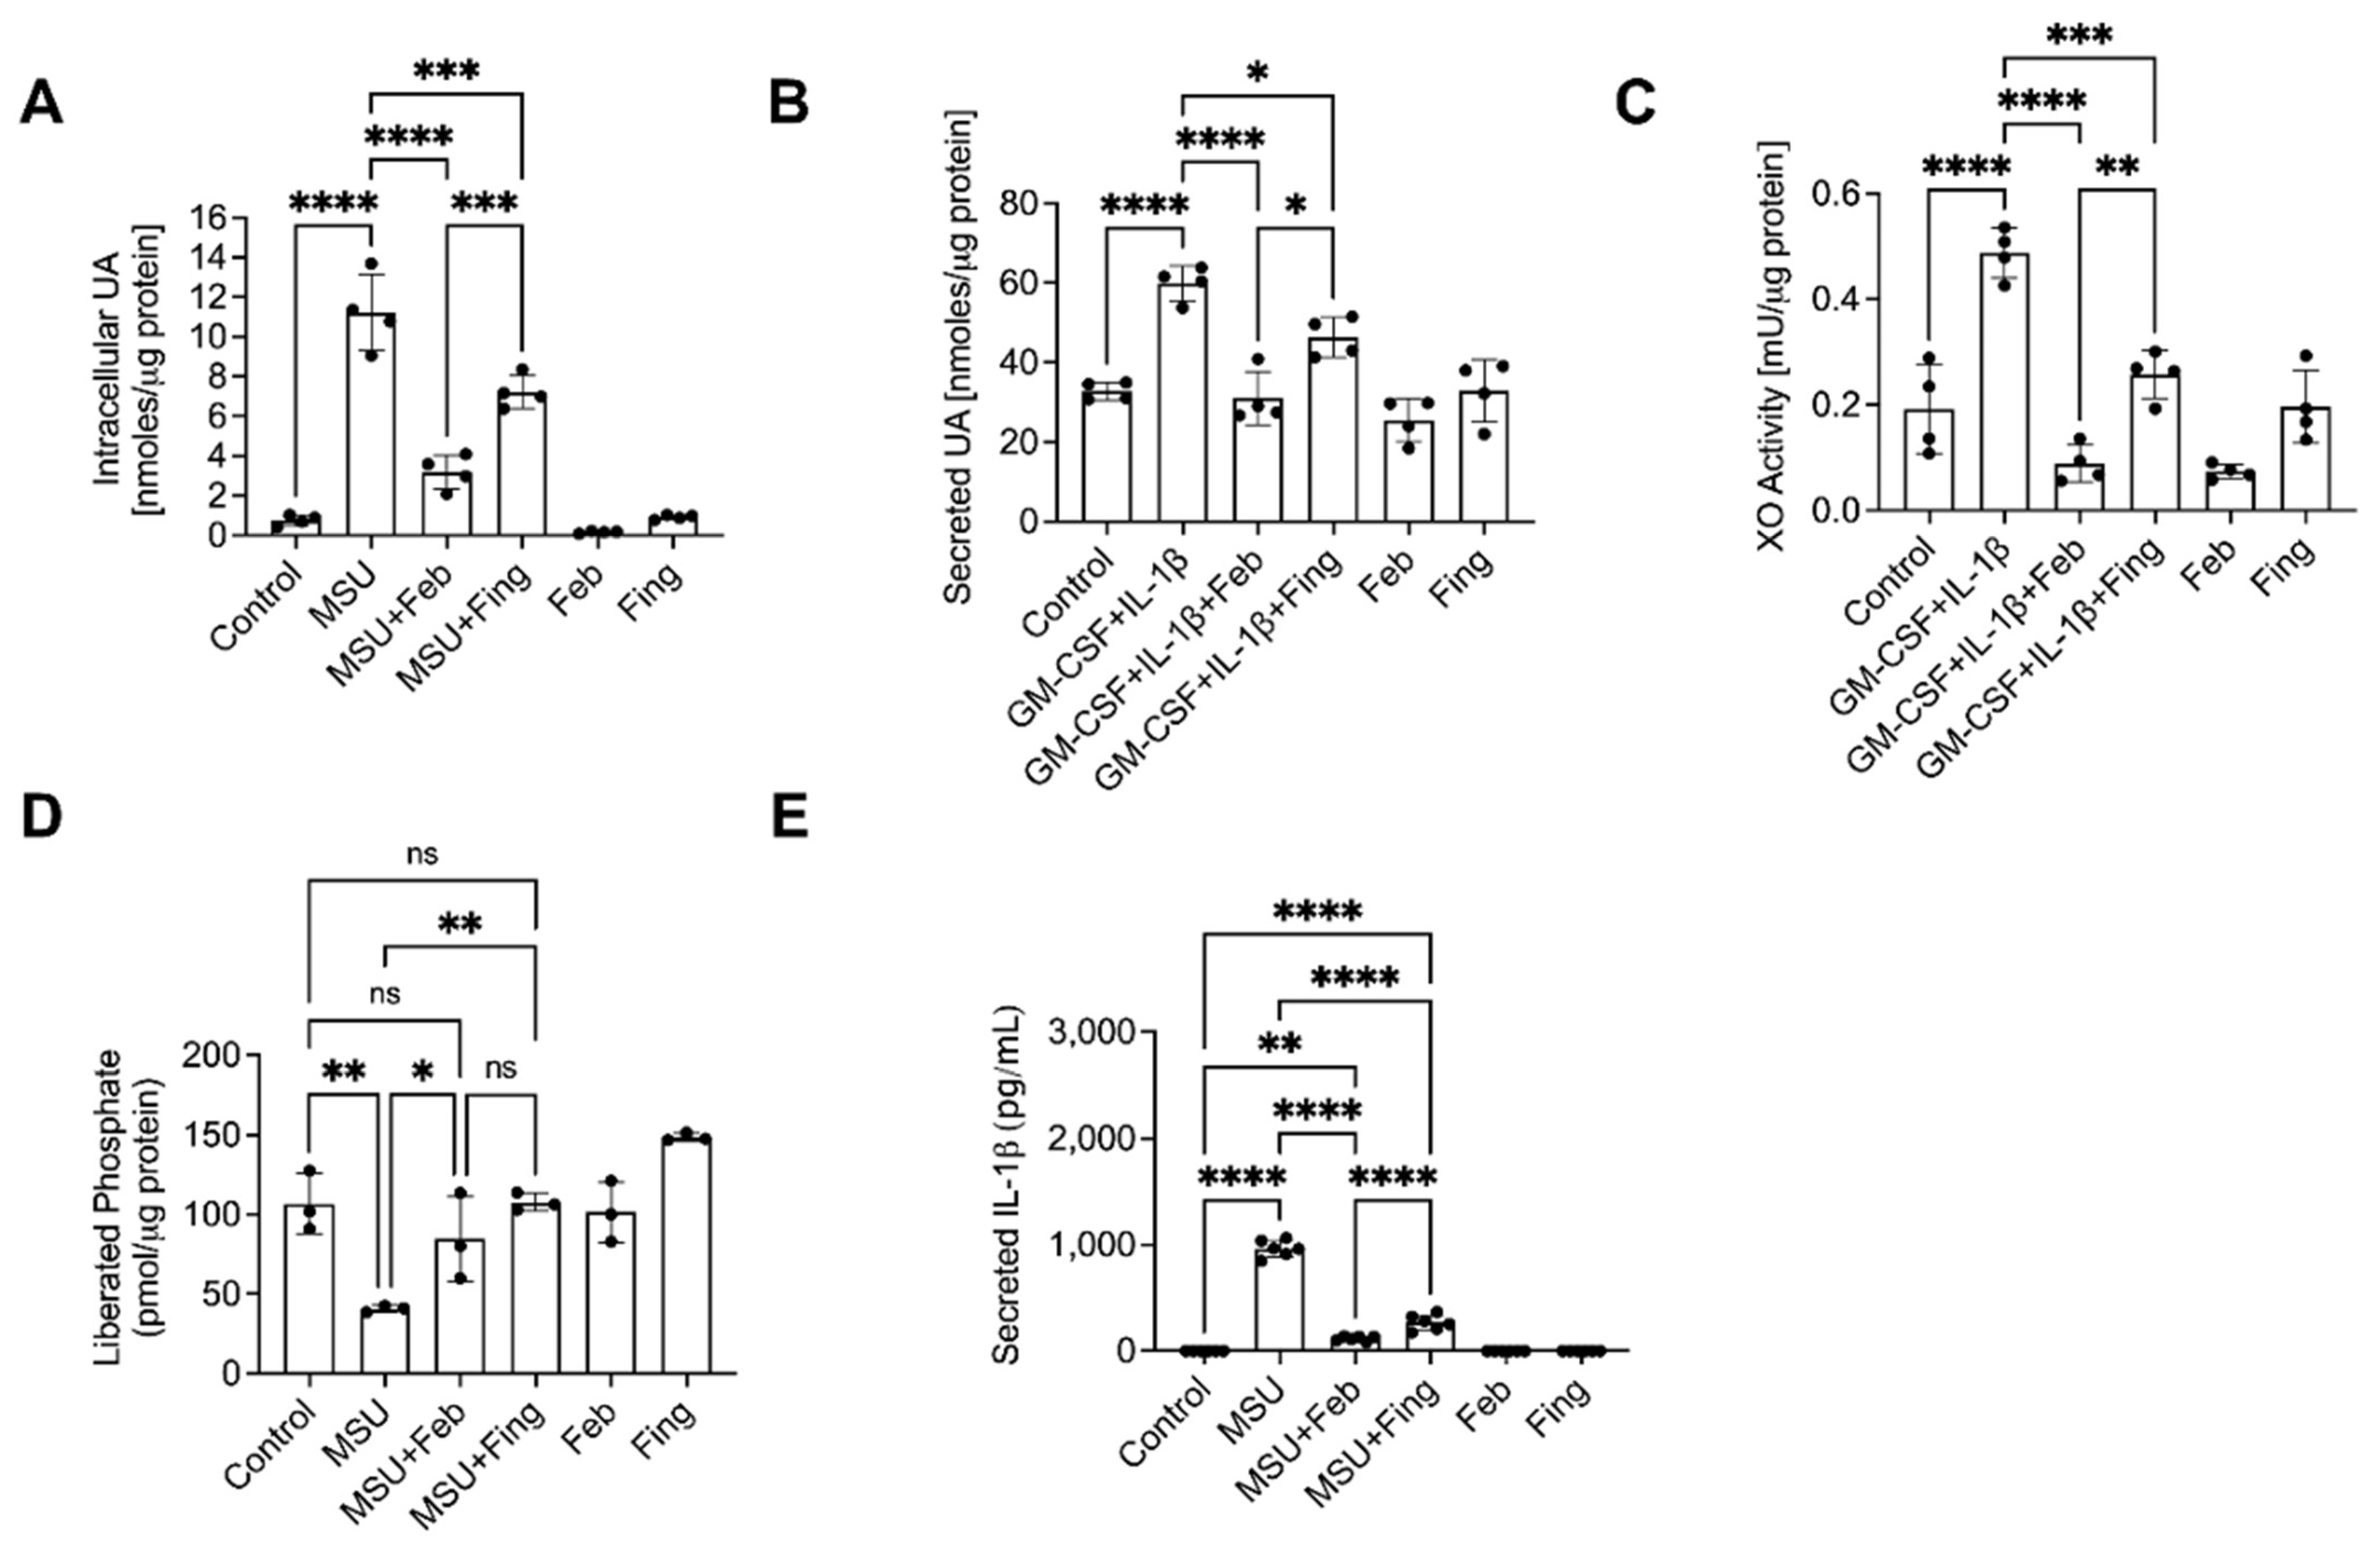
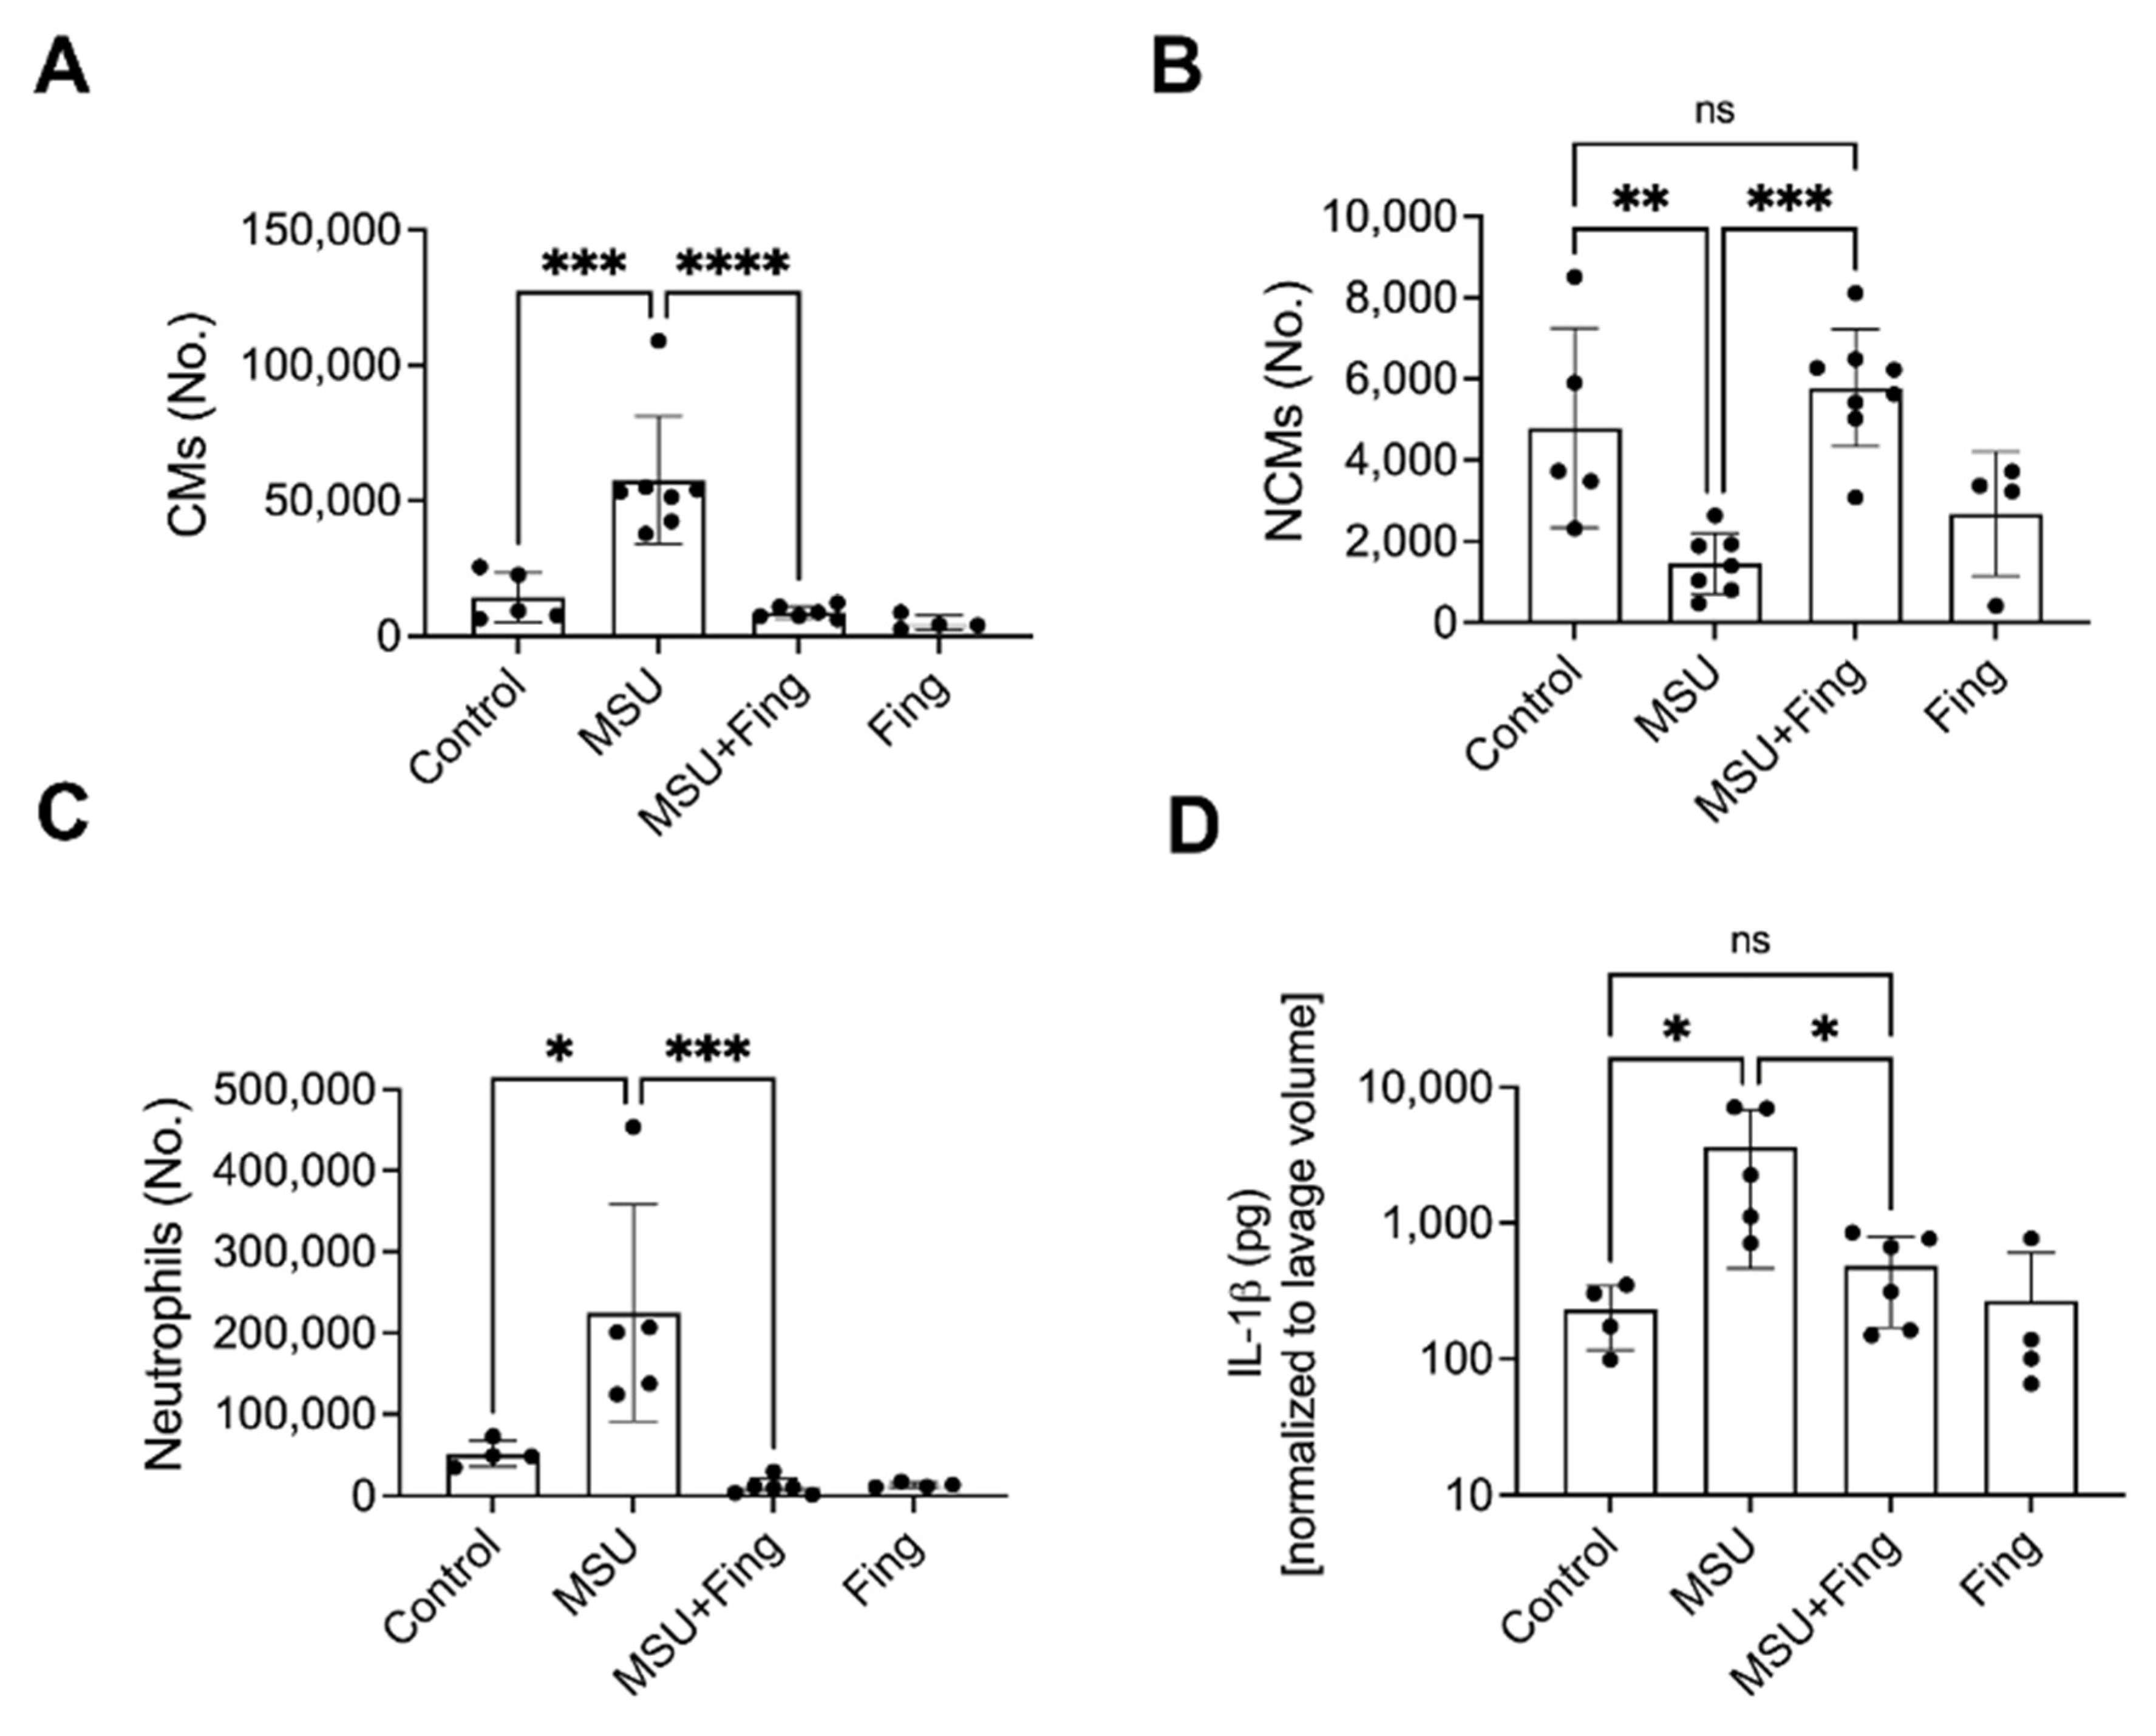
11. Protein Phosphatase-2A Regulates Xanthine Oxidase Activity in Macrophages and Influx of Inflammatory Monocytes in A Murine Gout Model
Sandy ElSayed * and Khaled A. Elsaid
Biomedical and Pharmaceutical Sciences, Chapman University School of Pharmacy, 9501 Jeronimo Rd., Irvine, CA 92618, USA
Abstract: Introduction: Current treatments for acute gout flares are inadequate, with serious side effects. We have shown that protein phosphatase-2A (PP2A) plays a significant role in regulating the inflammatory response of monocytes to urate crystals. Xanthine oxidase (XO) is a key regulator of uric acid (UA) and reactive oxygen species (ROS) generation in gout. We investigated how PP2A regulates XO, specifically suppressing its activity in macrophages leading to decreased ROS and IL-1β production. We utilized fingolimod (Fing) as a PP2A activator and febuxostat (Feb) as a XO inhibitor. We also studied classical (CM) and non-classical (NCM) monocytes’ influx in a urate crystal-induced murine peritoneal model of acute gout. Methods: Murine bone marrows were harvested, and bone-marrow-derived macrophages (BMDMs) were generated. Priming was performed with Pam3CSK4 (100 ng/mL) for 24 h, followed by urate crystals (250 μg/mL) for 3 h ± pretreatment with Fing (2.5 μM) or Feb (200 μM) for 3 h. Intracellular UA, XO and PP2A activities were determined. GM-CSF (20 ng/mL) and IL-1β (1 ng/mL) were used to simulate an acute flare. Inhibition of PP2A activity was performed using okadaic acid (OKA; 5 nM). ROS was measured using the DCFDA/H2DCFDA cellular ROS assay. N-acetylcysteine (NAC; 10 mM) was used as a positive control. Mice were intraperitoneally injected with UA crystals ± fingolimod (5 mg/kg). CMs (Cd11b
+Ly6
hiCCR2
+), NCMs (Cd11b
+Ly6
loCXCR3
+) and neutrophils (Ly6G
+ and Ly6C
+) in peritoneal lavages were identified by flow cytometry. IL-1b levels in peritoneal lavages were measured by ELISA. Statistical analyses included one-way ANOVA followed by a post hoc Tukey’s test. *
p < 0.05; **
p < 0.01; ***
p < 0.001; ****
p < 0.0001. Results: Fing and Feb reduced intracellular (
Figure 10A) and secreted (
Figure 10B) UA and XO activity (
Figure 10C) and secreted IL-1β (
Figure 10E), and increased PP2A activity (
Figure 10D). Fing reduced ROS in BMDMs (
Figure 11A) and ROS neutralization recovered PP2A activity (
Figure 11B). Inhibition of PP2A activity partially reversed NAC’s efficacy (
Figure 11C). Fing reduced CMs (
Figure 12A), neutrophils (
Figure 12C) and IL-1β (
Figure 12D) and increased NCMs (
Figure 12B). Conclusion: Fing enhanced PP2A and suppressed XO activities, UA production, ROS generation and IL-1β secretion in UA crystal-stimulated BMDMs and demonstrated a comparable anti-inflammatory efficacy to Feb. Fing reduced the influx of pro-inflammatory CMs and neutrophils in the murine peritoneal acute gout model and increased anti-inflammatory NCMs. PP2A activation is a promising novel treatment for acute gout.
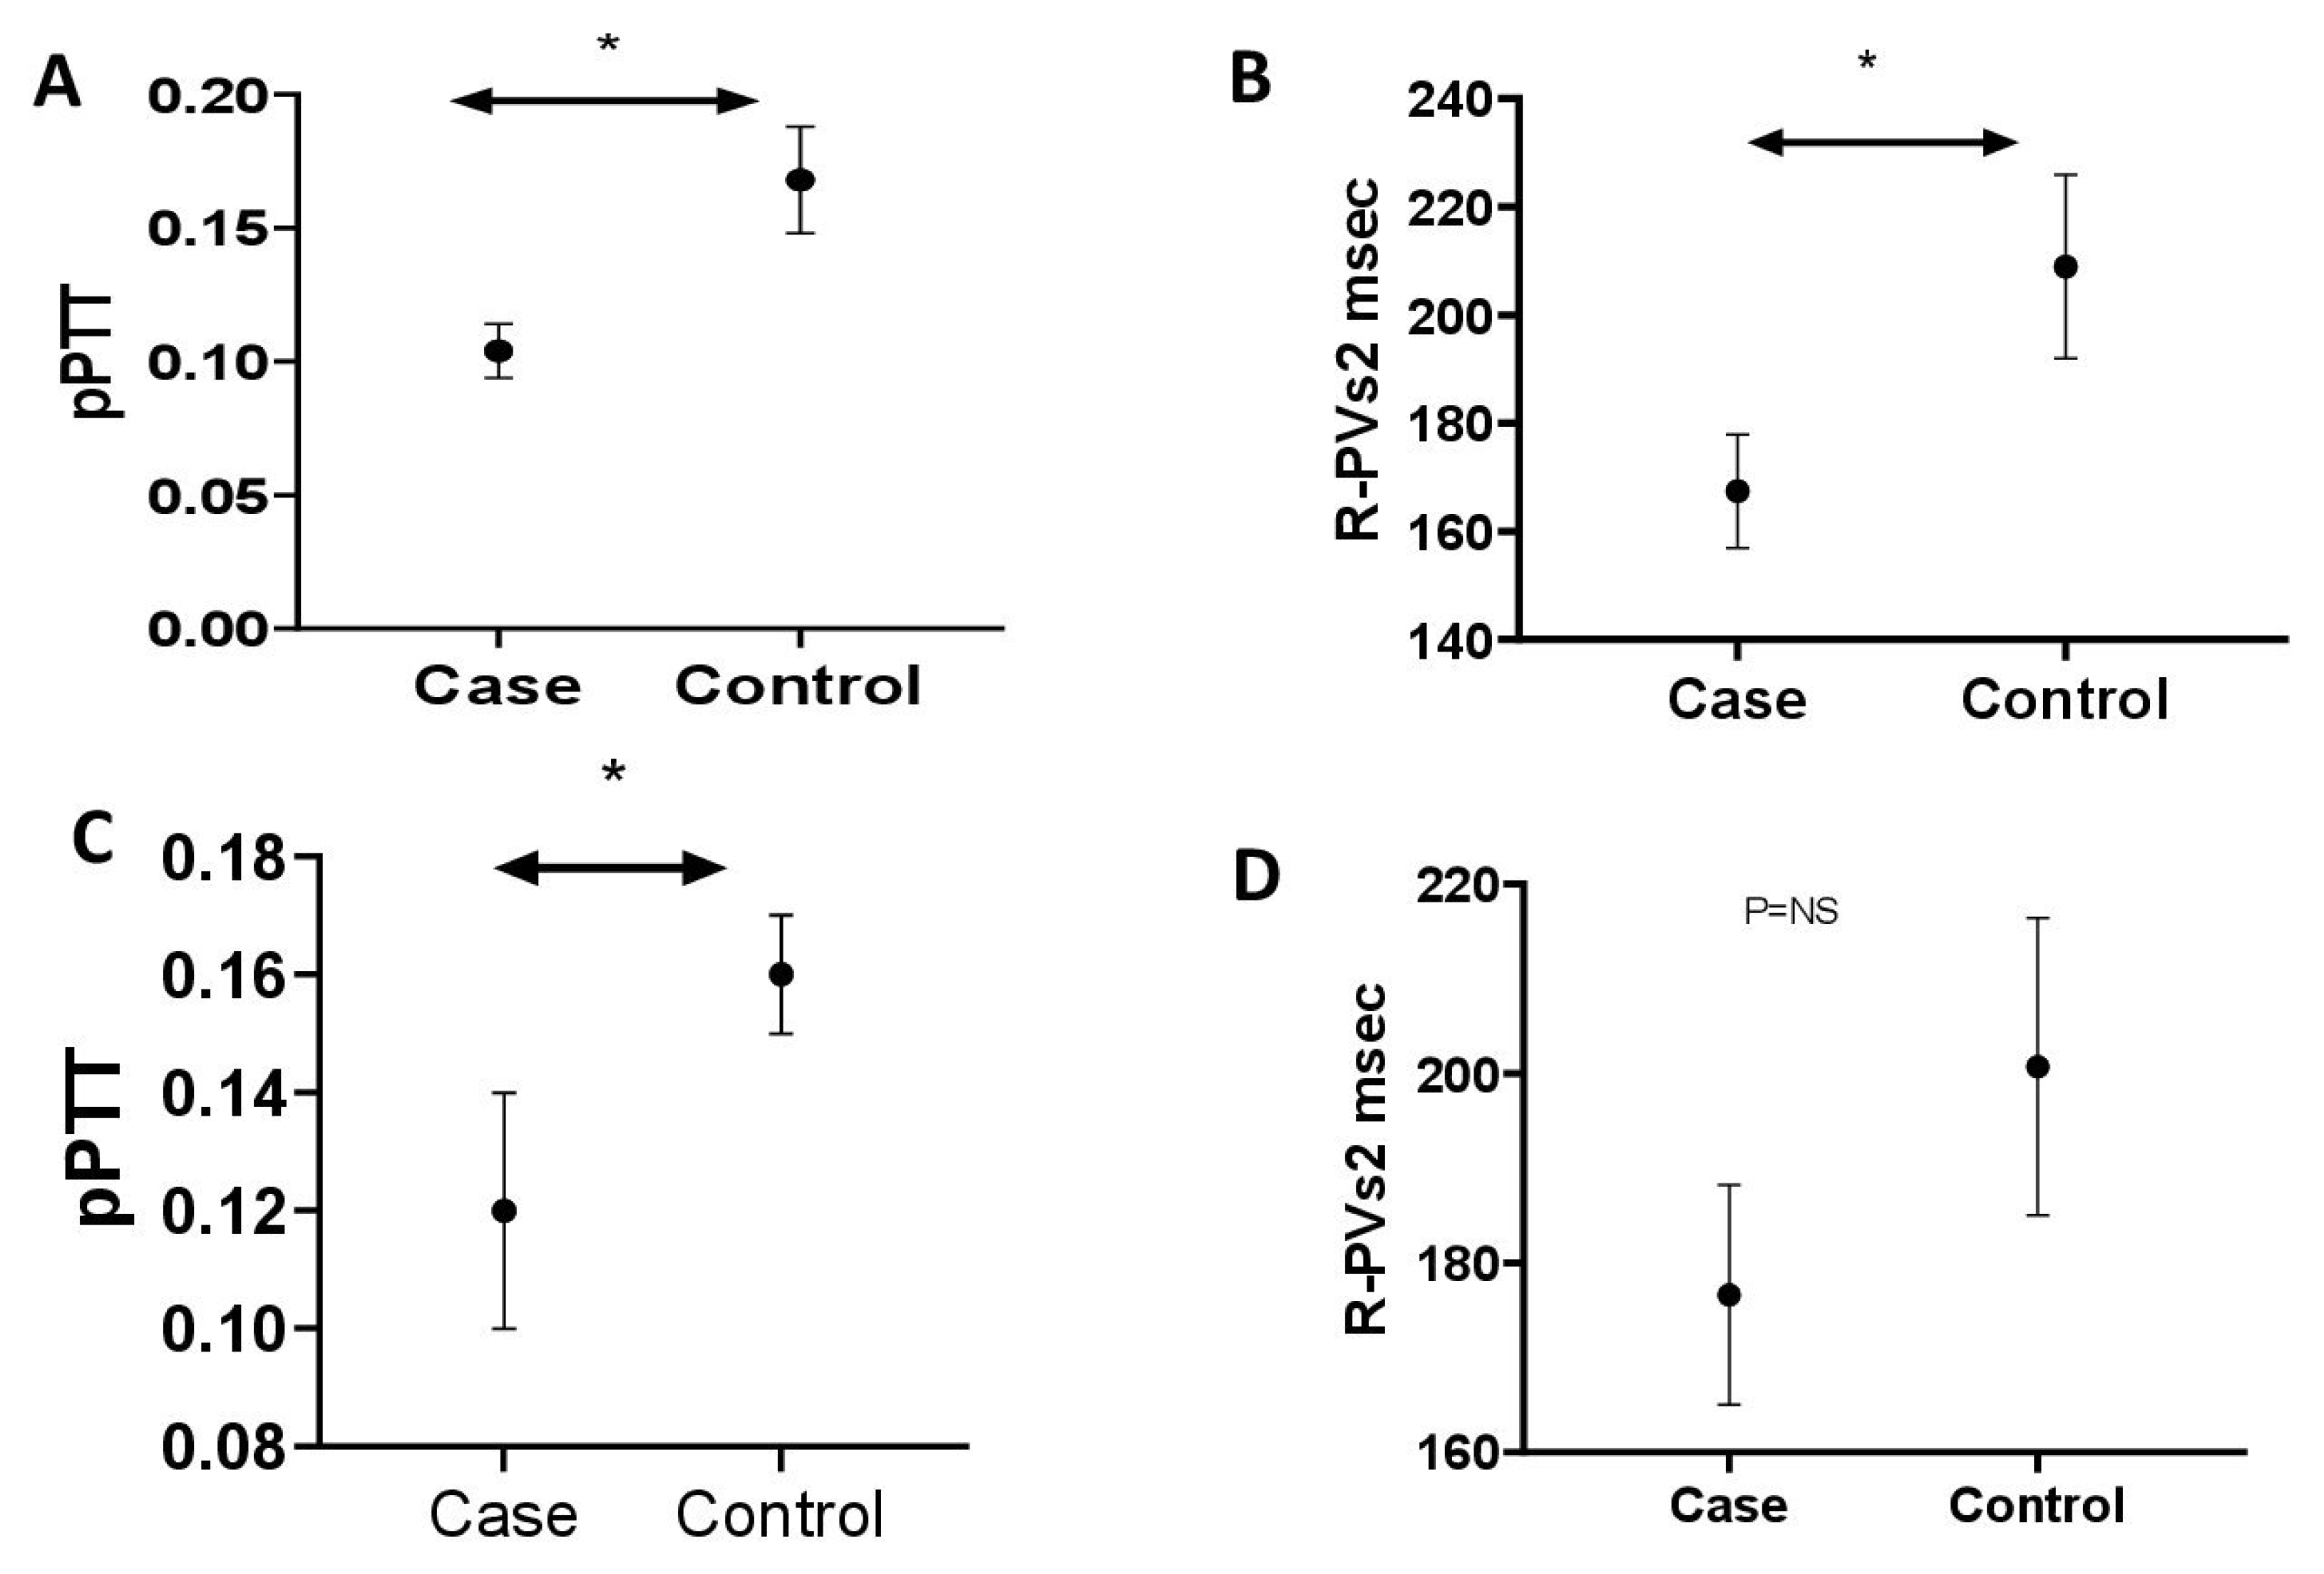
12. Pulmonary Vascular Dysfunction Occurs in Association with Hyperuricaemia: Assessment by a Novel Non-Invasive Measurement of Pulmonary Pulse Wave Transit Time
Rachael Flood *, Diarmuid O’Brien, Khalid Muhammad, David Kane and Ronan Mullan
Rheumatology Department, Tallaght University Hospital, Trinity College Dublin, Dublin D24 NR04, Ireland
Abstract: Background: Hyperuricaemia is common in pulmonary hypertension (PH), occurring in up to 80% of patients, with serum uric acid levels (sUA) correlating with poor PH outcomes. sUA, through its role in nitric oxide inhibition and endothelial dysfunction, has been suggested as a potential mediator of PH. Right heart catheterization (RHC) is the diagnostic gold standard in PH; however, by virtue of its invasive nature, other methods are required. Pulmonary pulse wave transit time (pPTT) is a novel, validated echocardiographic measurement of increased pulmonary vascular tone in PH, defined as the delay between onset of ventricular electrical activity and the arrival of the pulse wave in the pulmonary vein using Doppler echocardiography. pPTT is shortened in PH. Following validation of pPTT in patients with confirmed PH, we assessed pPTT in a gout cohort before and after urate-lowering therapy. Methods: Patients with PH confirmed at right heart catheterisation versus matched controls were recruited, and consented to baseline anthropomorphic assessment and focused echocardiograms (
Table 5). pPTT was calculated as the time interval between the R-wave on the ECG and the corresponding onset of RVOT pulse Doppler flow velocity (R-RVOT) minus the time between the R-wave on the ECG and the corresponding peak late-systolic pulmonary vein flow velocity (R- PVs2), normalized to cardiac cycle length. Treatment naïve hyperuricaemic (>420 µmol/L men, >360 µmol/L women) gout cases vs. normouricaemic controls were recruited (
Table 6), with repeat assessments after a 3-month period of sUA within the target range, following treatment with urate-lowering therapy for gout. Results: R-PVs2 was reduced in PH cases (mean ± SE; N = 10. 167.40 ms ± 10.5) versus controls (N = 13. 208.95 ms ± 17.01,
p < 0.05) (
Figure 13). pPTT was reduced in PH cases (0.104 ± 0.01) versus controls (0.168 ± 0.02,
p < 0.01) (
Figure 13). R-PVs2 was reduced in hyperuricaemic gout cases (N = 22 176.63 ms ± 11.6) versus controls (N = 15 200.75 ms ± 15.73
p = 0.20) (
Figure 13). There was a significant reduction in pPTT in hyperuricaemic gout cases (0.12 ± 0.02) versus controls (0.16 ± 0.01,
p < 0.05) (
Figure 13). pPTT was reassessed in 13 cases following a period of 3 months of normal sUA levels. sUA level was reduced (µmol/L) between baseline (487.15 ± 24.15) and 3 months (309.38 ± 2 0.78
p = <0.01). There was a non-significant increase in mean R-PVs2 from baseline (159.42 ms ± 14.37) and three months (168.84 ms ± 10.94), and a non-significant increase in mean pPTT from baseline (0.09 ± 0.02) after 3 months (0.12 ± 0.02). Conclusion: pPTT is a novel noninvasive method of accessing pulmonary haemodynamics. Patients with hyperuricaemia have shortened pPTT, indicative of pulmonary vascular dysfunction.
13. Poor Serum Urate Control is a Driver of Excess Cardiovascular Risk in Patients with Gout
Tate M. Johnson *, Lindsay N. Helget, Harlan Sayles, Punyasha Roul, James R. O’Dell, Ted R. Mikuls and Bryant R. England
University of Nebraska Medical Center, 986270 Nebraska Medical Center, Omaha, NE 68198-6270, USA
Abstract: Background/Objective: Gout patients suffer from an increased burden of cardiovascular disease (CVD). It remains unclear whether this risk is related to an excess of CVD risk factors, unique pathophysiologic mechanisms underlying gout, and/or inadequate gout management. Furthermore, while the atherothrombotic CVD event risk has been extensively studied, there is a relative paucity of information on risk of incident heart failure (HF) in gout. Thus, we evaluated the associations of gout and gout treatment status with major adverse cardiovascular events (MACE), HF hospitalization, and CVD-related death in a national cohort of US veterans. Methods: We performed a retrospective, matched cohort study in the Veterans Health Administration (VHA) from 1/1999 to 9/2015. Patients with gout (≥2 ICD-9 codes) were matched up to 1:10 on age, sex, and year of VHA enrollment to patients without a gout ICD-9 code or urate-lowering therapy (ULT) dispensing. CVD events (overall, fatal and non-fatal MACE, HF hospitalization, and HF death) were identified using validated diagnostic and procedure codes in VHA and linked National Death Index data. Among gout patients, gout treatment status was defined in a time-varying manner over 12-month intervals (including a lag to prevent reverse causation), based on adequate serum urate (SU) control (<6 mg/dL) and ≥2 dispensings of ULT (Mikuls, JAMA Netw Open, 2022). Multivariable Cox regression models adjusting for CVD risk factors were used to examine the associations of gout and gout treatment status with CVD events. Results: We matched 559,243 gout patients to 5,407,379 non-gout controls (99% male, mean age 67 years). Over 43,331,604 person-years, we observed 137,162 CVD events in gout (IR 33.96 per 1000 PY) vs. 879,903 in non-gout patients (IR 22.37 per 1000 PY). Crude incidence rates of individual CVD events were also higher in gout vs. non-gout (
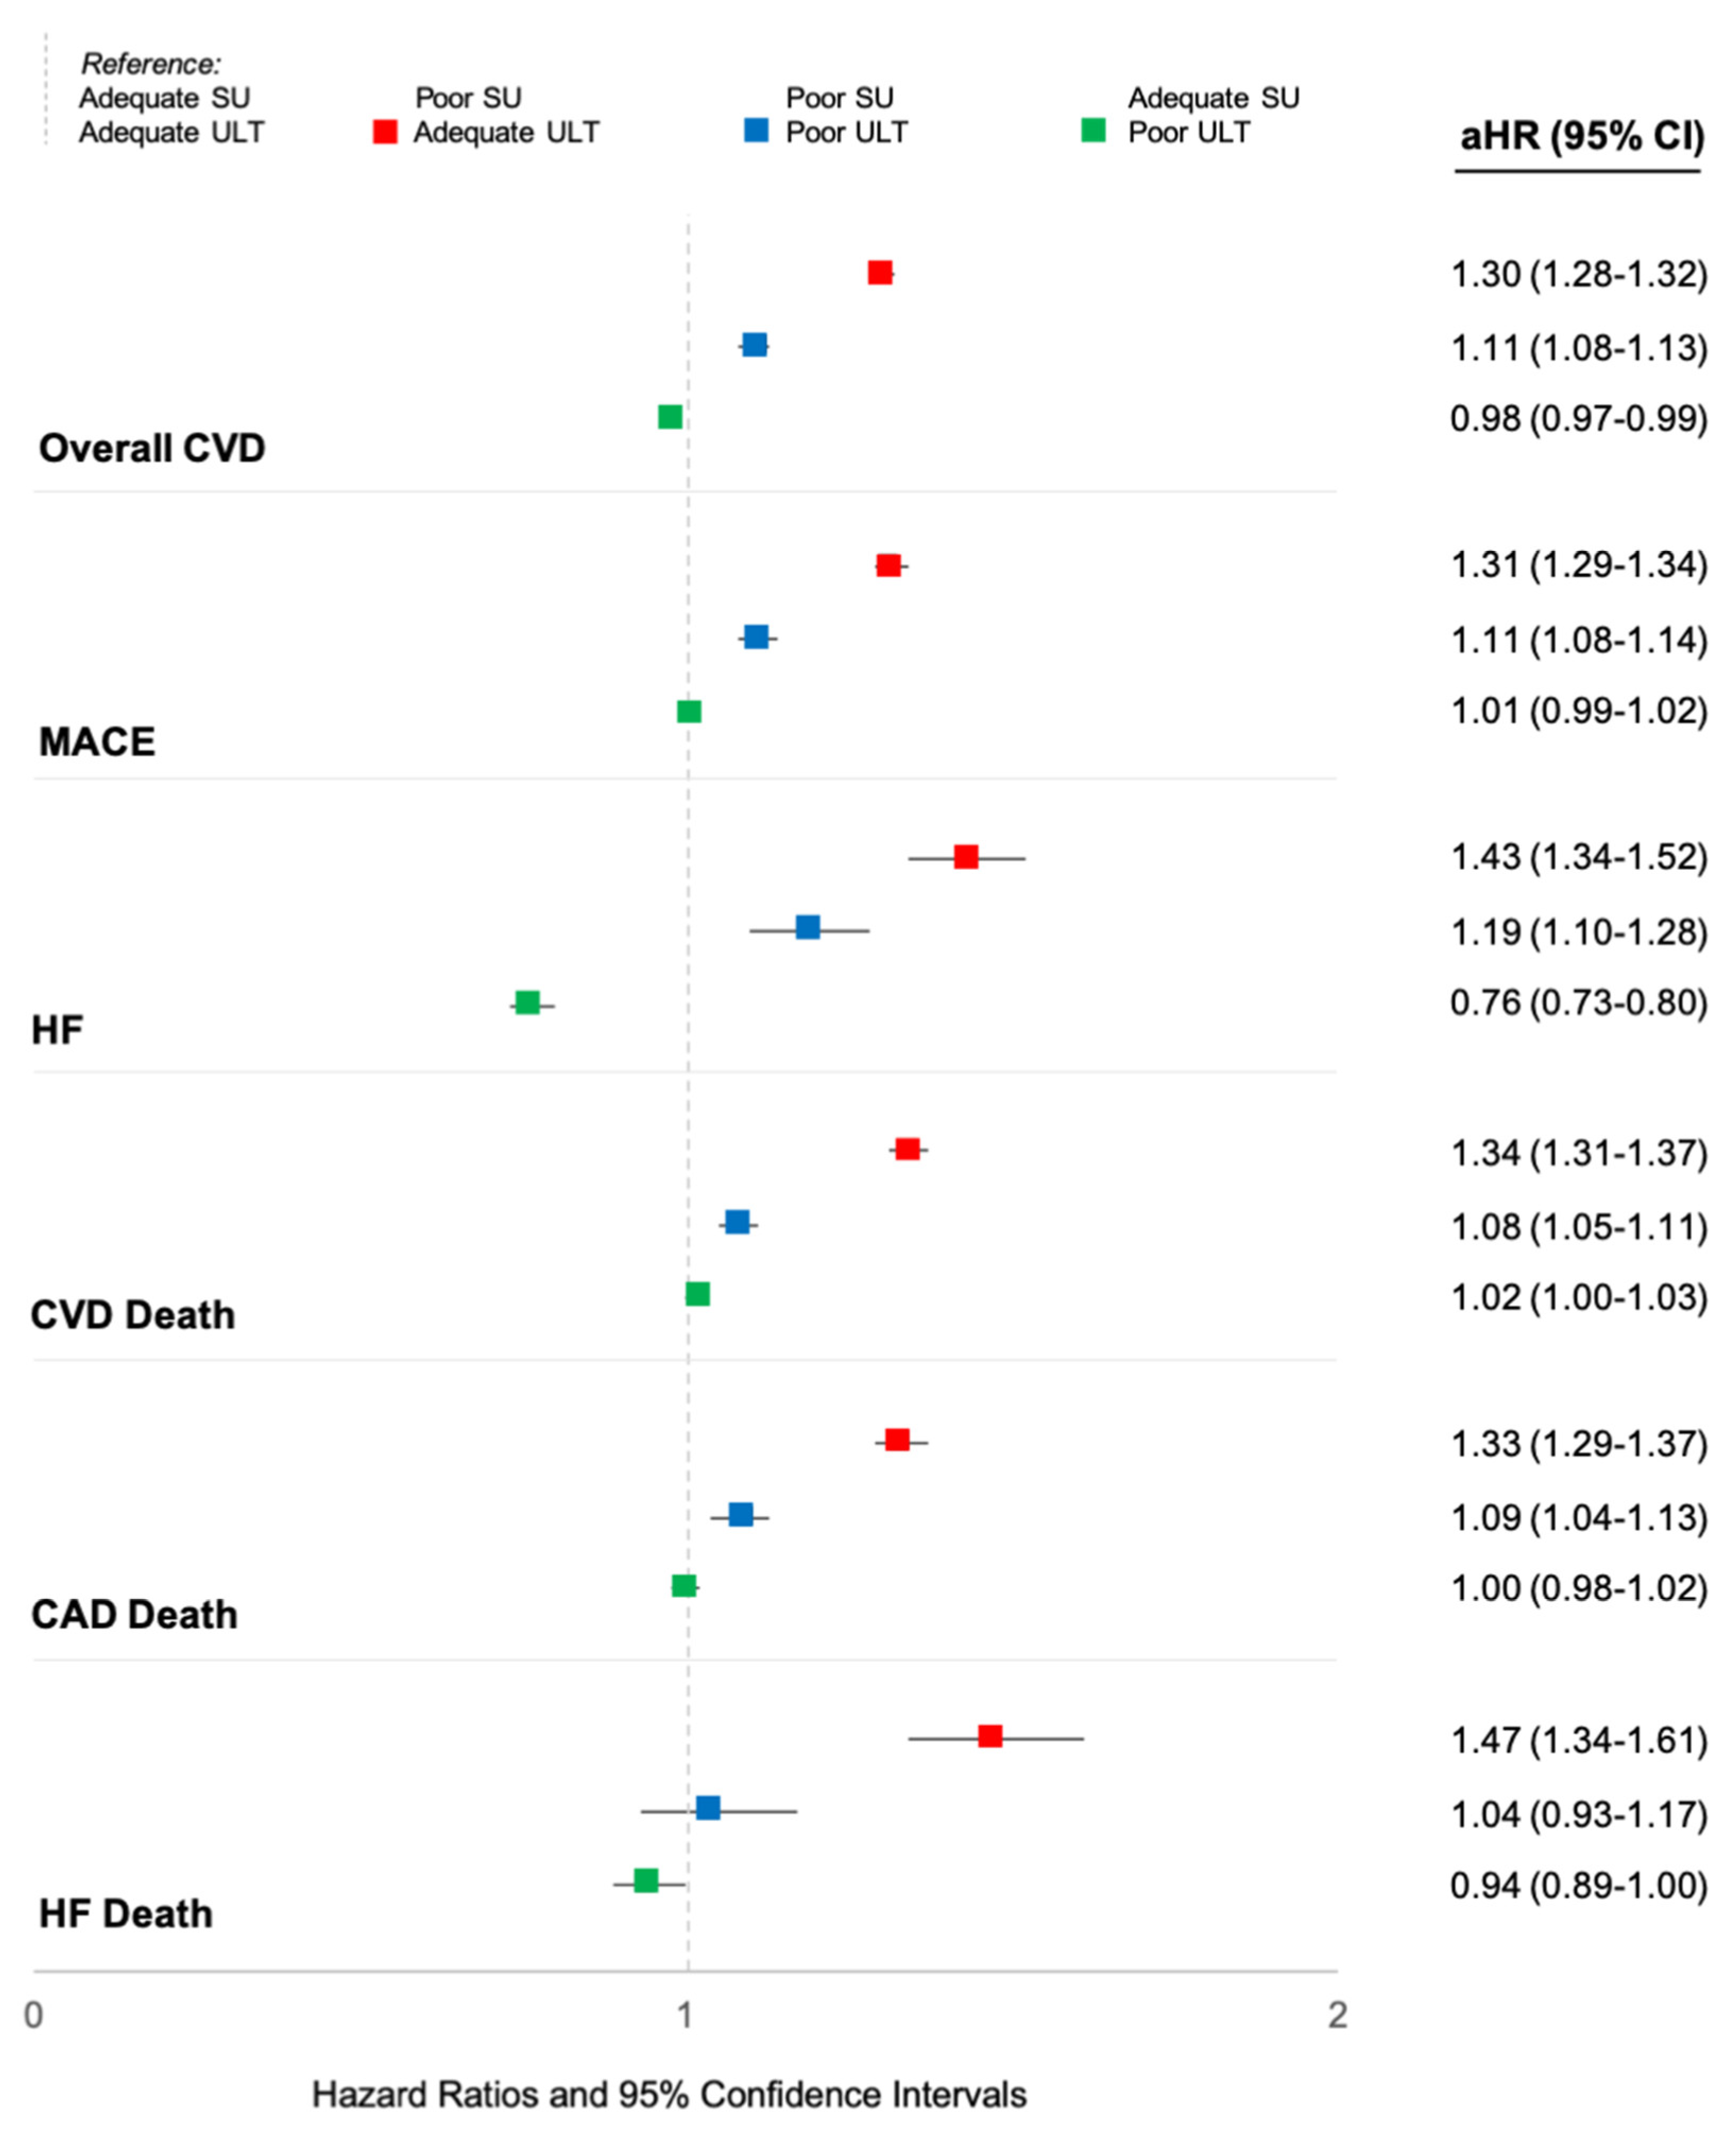
Table 7). Gout was most strongly associated with HF hospitalization, with a nearly 3-fold higher risk (HR 2.78 [2.73–2.83]) that was attenuated but persisted after adjusting for additional CVD risk factors (aHR 1.68 [1.65–1.70]) and excluding patients with prevalent HF (aHR 1.60 [1.57–1.64]). Gout patients were also at higher risk of HF-related death (aHR 1.25 [1.21–1.29]), MACE (aHR 1.22 [1.21–1.23]), and coronary artery disease-related death (aHR 1.21 [1.20–1.22]). Among gout patients, poor SU control was associated with a higher risk of all CVD events, with the highest CVD risk occurring despite receipt of ULT, and related to HF hospitalization (aHR 1.43 [1.34–1.52]) and HF-related death (aHR 1.47 [1.34–1.61]) (
Figure 14). A 24% lower risk of HF hospitalization was seen in those with controlled SU and poor ULT administration. Conclusions: In this large, matched cohort study, despite accounting for CVD risk factors, gout was associated with a 68% increased risk of HF hospitalization, a 25% increased risk of HF-related death, and a 22% increased risk of MACE. Among gout patients, poorly controlled SU conferred a higher risk of CVD events independent of ULT use, which may represent a surrogate of more severe disease. Continued research investigating a causal link between gout, hyperuricemia, or its treatment, and CVD risk is needed.
14. Integrating Raman Spectroscopy with Polarized Light Microscopy Leads to a Higher Certainty of DIAGNOSIS IN CRYSTAllopathies
Tom Niessink 1,2,*, Matthijs Janssen 2, Cees Otto 1 and Tim Jansen 1,2
- 1
Medical Cell Biophysics Group, Technical Medical Centre, University of Twente, 7522 NB Enschede, The Netherlands
- 2
Department of Rheumatology, VieCuri Medical Centre, 5912 BL Venlo, The Netherlands
- *
Abstract: Introduction: The current golden standard in diagnosing gout is polarized light microscopy (PLM). However, small crystal sizes, the presence of other crystal types or microparticles, glass artefacts and cellular uptake of MSU can pose uncertainties in the clinical analysis of synovial fluids. There are multiple methods to improve synovial fluid analysis, of which Raman spectroscopy is one of the most promising. In our approach, we have integrated an ordinary polarized light microscope with a Raman spectroscope (iRPolM, Hybriscan B.V., the Netherlands), allowing for simultaneous use of both techniques. In this abstract, we demonstrate the added value of this technique for 50 patients, including 23 diagnosed with gout. Method: 50 patients with swollen joints were punctured for diagnostic reasons. Patient characteristics can be found in
Table 8. Samples were analyzed by an experienced rheumatologist with polarization microscopy, who also gave an indication of certainty in diagnosis. Then iRPolM analysis was carried out. Retrieved Raman spectra were analyzed by a trained Raman spectroscopist for the presence of MSU, calcium pyrophosphate dihydrate (CPPD) or other microparticles. Results: A summary of the results from this experiment can be found in
Table 9. We demonstrate a high correspondence (95%) between a certain identification with PLM and iRPolM. While the rheumatologist is only able to identify MSU/CPPD, Raman can also discriminate other microparticles and combinations of crystals. Hydroxyapatite crystals were found in one patient with rheumatoid arthritis (RA) and one patient with a degenerative shoulder syndrome. Calcite (calcium carbonate) could be identified in seventeen patients, four of whom were diagnosed with gout, four with CPPD, three with RA, two with osteoarthritis and four undefined. Titanium dioxide crystals were found in seven patients. We observed a relationship with the presence of orthopedic implants, as only one of seven patients with titanium crystals had an implant. Carotenoids, a precursor molecule for vitamin A, were found in four patients, one of whom was diagnosed with gout and three with an undefined joint disease. All thenardite (sodium sulphate) crystals were found in patients with osteoarthritis. Microplastics were found in 19 patients, but environmental pollution must be excluded. Conclusion: Raman spectroscopy has a significant added value for PLM: it identifies MSU and CPPD via an objective method, and can identify a whole range of other microcrystals reflecting potentially novel crystallopathies. Soon, innovative and highly specific crystal identification via Raman-based spectroscopy may open new ways for diagnostics and pathogenetic pathways in rheumatology, for well-known crystallopathies, so-far undiagnosed arthritic patients, and prosthetic failure issues.


