1. Introduction
Hospital layouts have a major effect on the efficiency of care processes [
1]. As described in a literature review by Jia et al. [
2], poor alignment between spatial design and care processes can lead to operational inefficiencies, decreased staff satisfaction, and compromised patient outcomes. Given that hospital buildings in Western Europe are expected to last up to 40 years [
3], the consequences of suboptimal design can persist for decades. It is therefore important that hospital layouts are not only aligned with care processes at the time of construction but also retain their relevance as care processes evolve.
However, this presents a fundamental challenge: while care processes are dynamic and continuously need to adapt to changing patient populations and technologies, hospital layouts tend to remain fixed once constructed. As stated by Pilosof [
4] (p. 2): “. . . hospitals need to be designed to optimally fit a specific function and still be designed as loosely as possible to accommodate future functional changes”. The open building approach offers a way to operationalize this flexibility, by conceptualizing hospitals as layered systems composed of building elements with different lifespans [
5,
6]. These can be classified as the primary system (base building), secondary system (fit-out), and tertiary system (furnishing, fixtures, and equipment [FF&E]). The base building forms the permanent structure, the fit-out includes all components and spaces that support specific functions, and the furnishings, fixtures, and equipment represent short-term investments. By decoupling these systems, the lower levels are free to change without needing to adapt the higher levels. This enables spatial or functional changes at lower levels—such as layout adjustments or changes in use—without requiring structural modifications. It enables buildings to be prepared for change, both during the design and implementation phases as well as throughout the life cycle of the hospital building. The adaptability of layouts should primarily be realized in the tertiary system, and possibly in the secondary system.
Understanding how spatial layout supports (or constrains) evolving care processes requires more than architectural logic; it demands insight into how care professionals experience and navigate their environment. Care processes are often described as sequences of patient-related actions. However, they in fact consist of interdependent tasks carried out by multiple roles across time and space. The efficiency of these processes depends on how well these tasks are supported and coordinated by the surrounding environment. These processes are constantly evolving in response to changes in case mix, care models, medical technologies, and staff expertise. Meanwhile, the spatial needs of care professionals—such as visibility, proximity, and access to critical zones—are expected to remain more stable. For example, a coordinating nurse may always require an overview of the department, regardless of how triage protocols evolve. These spatial needs reflect not only the physical requirements to carry out tasks but also the underlying coordination system: the role-based interactions required to manage care effectively. The physical network—the spatial layout—can either enable or constrain this coordination through its configuration [
7].
Different spatial layouts can serve these spatial needs in different ways, depending on the specific functions that the layout should fulfill. Space syntax analysis (SSA) provides a structured way to analyze—or even predict—how a designed environment works socially [
8]. This makes it particularly suited to assess how the spatial layout enables or constrains the efficiency of care professionals [
2,
9]. Most previous studies using SSA are focused on specific attributes or functions like the position of nursing stations [
10], staff satisfaction [
11], or the impact of visibility [
11]. Morgareidge et al. [
12] combined space syntax with simulation modeling to optimize the care process and spatial design. This study emphasizes the importance of incorporating care professionals’ spatial experience to assess how layouts support the execution of care tasks over time.
This study proposes an evaluation framework to assess how well hospital layouts support the spatial needs of care professionals over time. The framework integrates two complementary approaches. First, cognitive mapping is used to capture how professionals experience and navigate their work environment, linking their spatial needs to the care process. Second, space syntax analysis (SSA) evaluates whether the layout facilitates these needs. Drawing upon the open building approach, the hospital is conceptualized as a layered system, where elements of the layouts are not seen as fixed blueprints but as adaptable infrastructures capable of supporting evolving care processes. By linking staff experience and spatial analysis, this framework offers an evidence-based way to evaluate and improve hospital layouts in both current and future contexts.
To demonstrate this approach, we apply the framework to a real-world emergency department (ED) with two distinct spatial layouts. This case study serves as proof of concept and addresses the following research questions:
What spatial needs are related to efficient care processes?
To what extent does the current layout support these spatial needs?
How does this relate to the adaptability of the hospital’s primary and secondary system designs?
2. Methods
2.1. Setting
We propose a framework to evaluate the coherence between hospital layout and care process using existing models and techniques. To demonstrate our proposed evaluation framework, we conduct a case study on the ED of Elisabeth-Tweesteden Hospital. The ED is a suitable setting because it is a high-intensity, multidisciplinary environment where spatial layout directly affects workflow, communication, and patient outcomes. Its dynamic nature makes it ideal for examining how well layouts support evolving care processes.
The ED in the studied hospital comprises two areas with distinct layouts, each featuring different primary and secondary system designs. The fast-track area follows a linear design, while the high-care area adopts a rectangular design. Each year, the ED treats approximately 60,000 patients. It encompasses three departments: trauma, high-care, and fast-track.
2.2. Study Design
We adopted a mixed-methods approach that included both qualitative and quantitative analyses to answer the research questions. The methodology was structured in three parts.
First, we used interviews, documents, and observations to explore care processes in the ED. By characterizing the ED care process as a combined network of patient flow, staff involvement, and related tasks, we illustrated how the main tasks of ED staff were connected to the patient process.
Second, we applied cognitive mapping techniques to define the spatial needs of ED employees in relation to this care process. Through cognitive maps and the combined network, we identified what roles need to interact, with whom, and in which zones to support care delivery. We used network graph representations to describe these coordination networks.
Third, we used space syntax techniques to quantitatively assess how the current ED layout supports the identified spatial needs. In interpreting these results, we drew upon the open building approach to evaluate how well the layout’s layered design (such as the primary, secondary, and tertiary systems) enables adaptability to evolving care processes.
2.3. Data Collection
We collected data from three sources: observations, semi-structured interviews, and documents. Prior to data collection, all participants provided informed consent, and the study adhered to institutional ethical guidelines throughout.
The first author performed observations in the first phase to obtain a basic understanding of healthcare processes and prepare for the semi-structured interviews. The goal of the semi-structured interviews was to develop an understanding of how employees experienced the current layout in relation to their daily work. Because ED doctors, nurses, and desk employees were responsible for care processes and patient flow management in the ED, we limited respondents to these roles. Participants were selected based on their experience in the ED and availability, with support from the ED manager. In total, we conducted 12 interviews with 5 ED doctors, 5 ED nurses, and 2 desk employees. The interviews were semi-structured and followed interview protocols. All participants received information about the research and, upon request, the interview protocol. All interviews were recorded and transcribed verbatim with the consent of the interviewees.
To support the space syntax analysis, we used the DXF files of the ED floor plans to gather information about the spatial layout design of the ED. Additionally, patient process flows from Microsoft Visio 2021 were used to construct a combined network of patient pathways.
2.4. Data Analysis
The data analysis was divided into three parts. First, the ED process was described using a combined network. Second, spatial needs related to the ED care process were defined using cognitive mapping techniques and described using network graph representations. Finally, space syntax techniques were used to quantitatively assess the ED layout based on spatial needs. Finally, we interpreted the differences between layouts using the open building approach to evaluate design flexibility and adaptability.
2.4.1. Modeling the ED Care Process: Combined Network
We used interview data and process flows to describe the ED care process. We analyzed and grouped the interview data based on different employee roles and their main responsibilities during the care process. Using an approach based on Alhaider et al. [
13], the ED care process is described as a combined network comprising patient flow, employees involved, and related tasks. We used the patient process in the ED as the basic structure of the combined network, representing the sequence and location of activities from the patient’s perspective. Based on the analysis of the interview data, ED roles and tasks were connected to these activities. We focused on the roles of the ED employees included in the interview selection. The combined network uses different notations to distinguish between patient processes, ED roles, and main responsibilities, as shown in
Table 1.
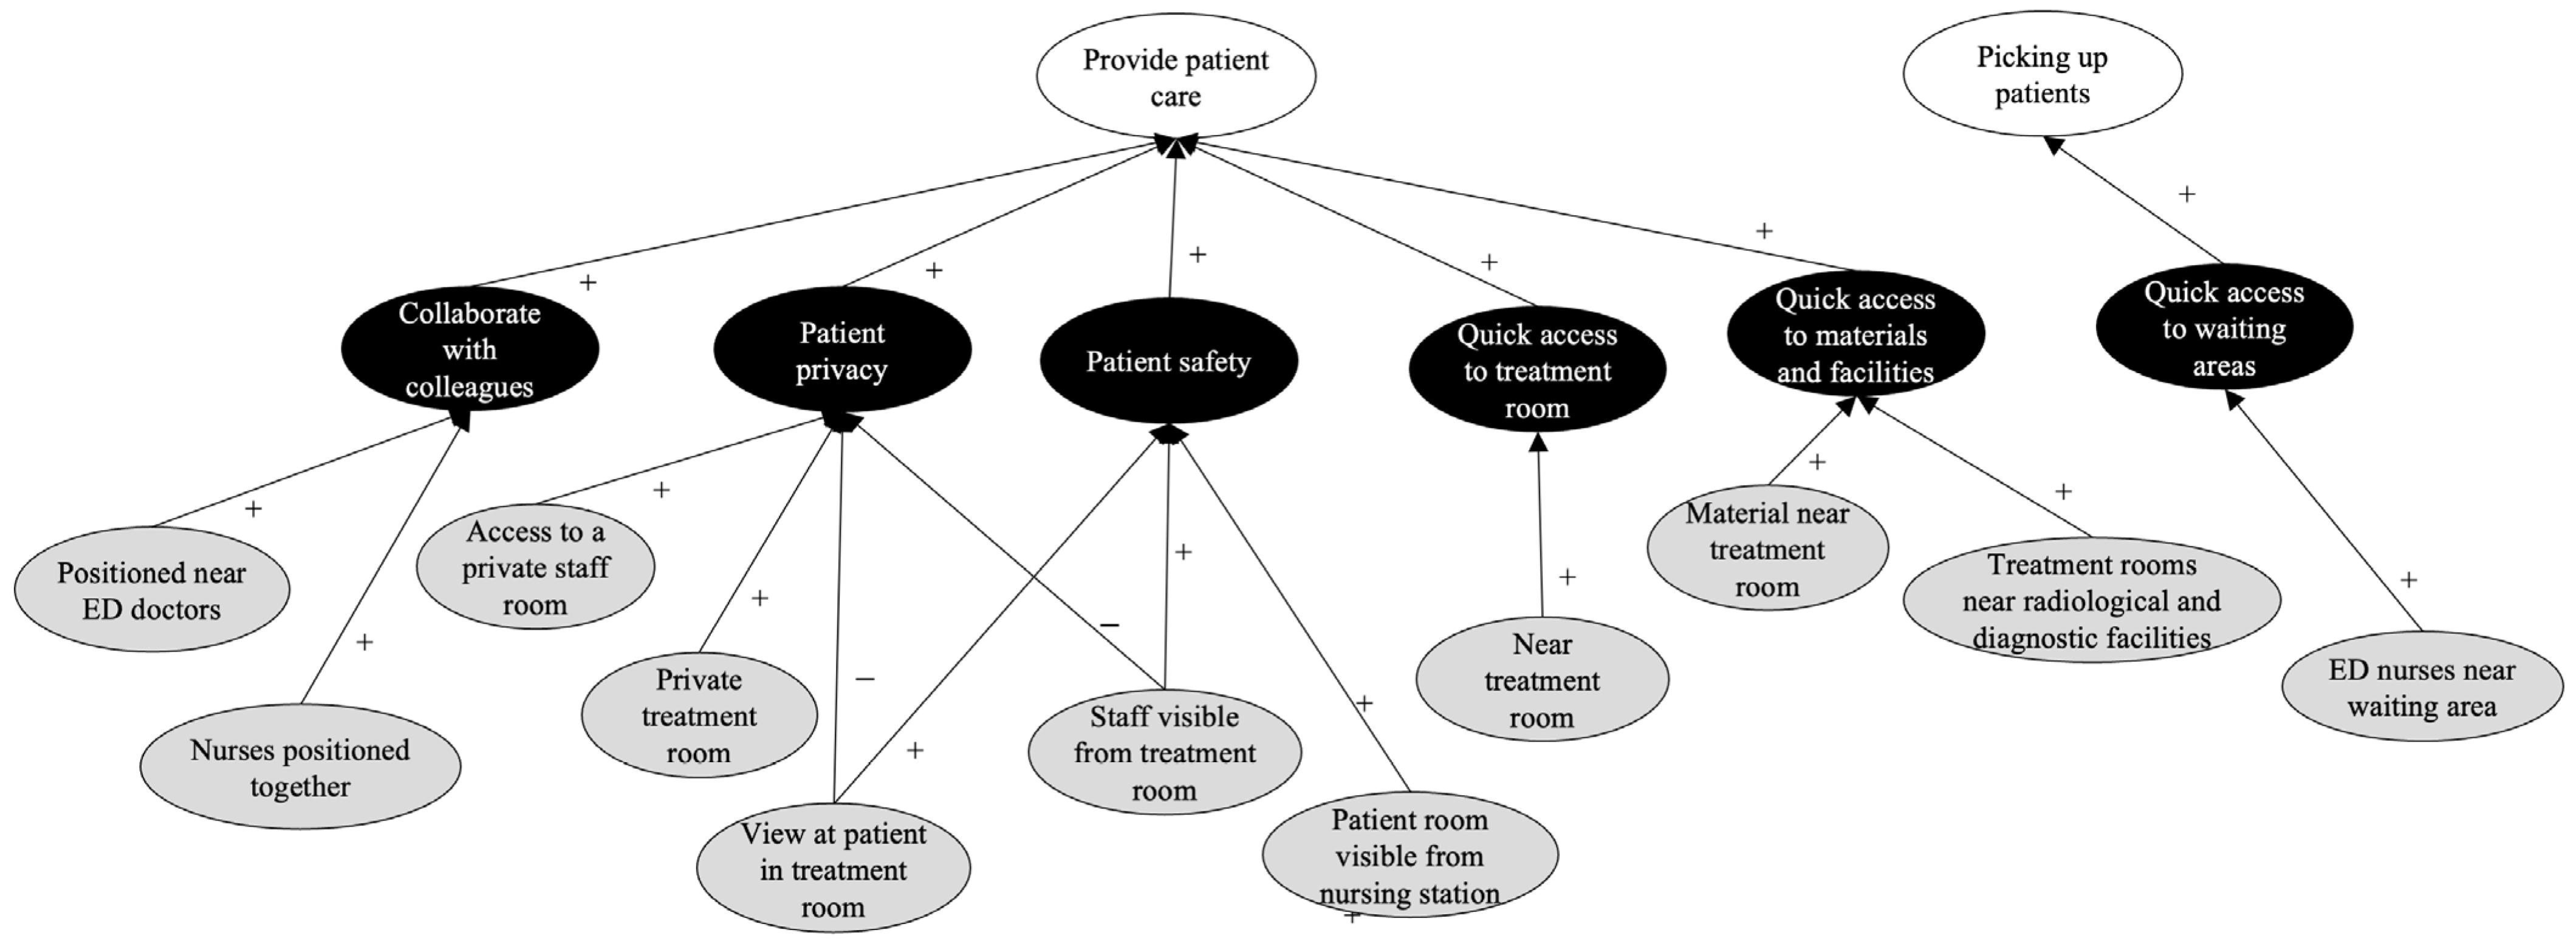
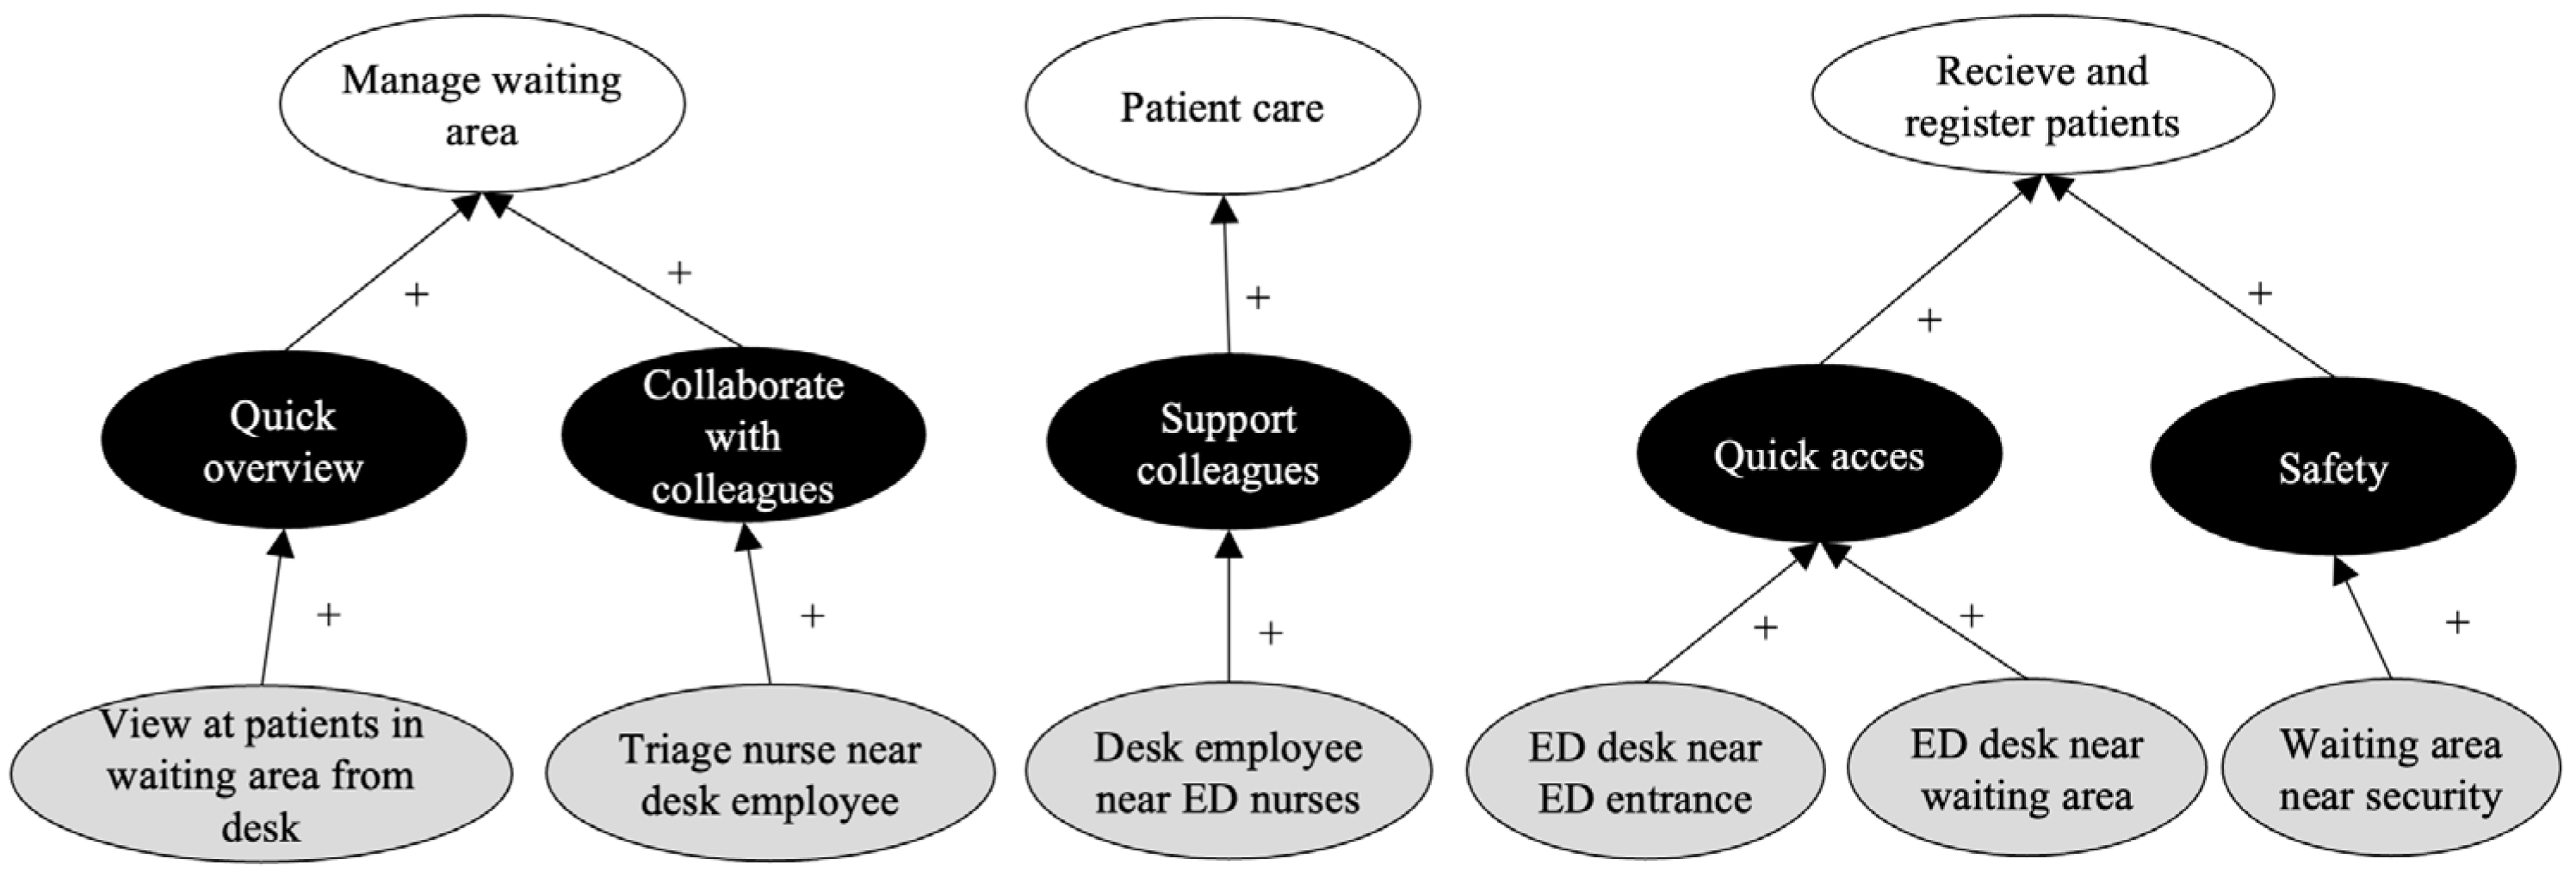
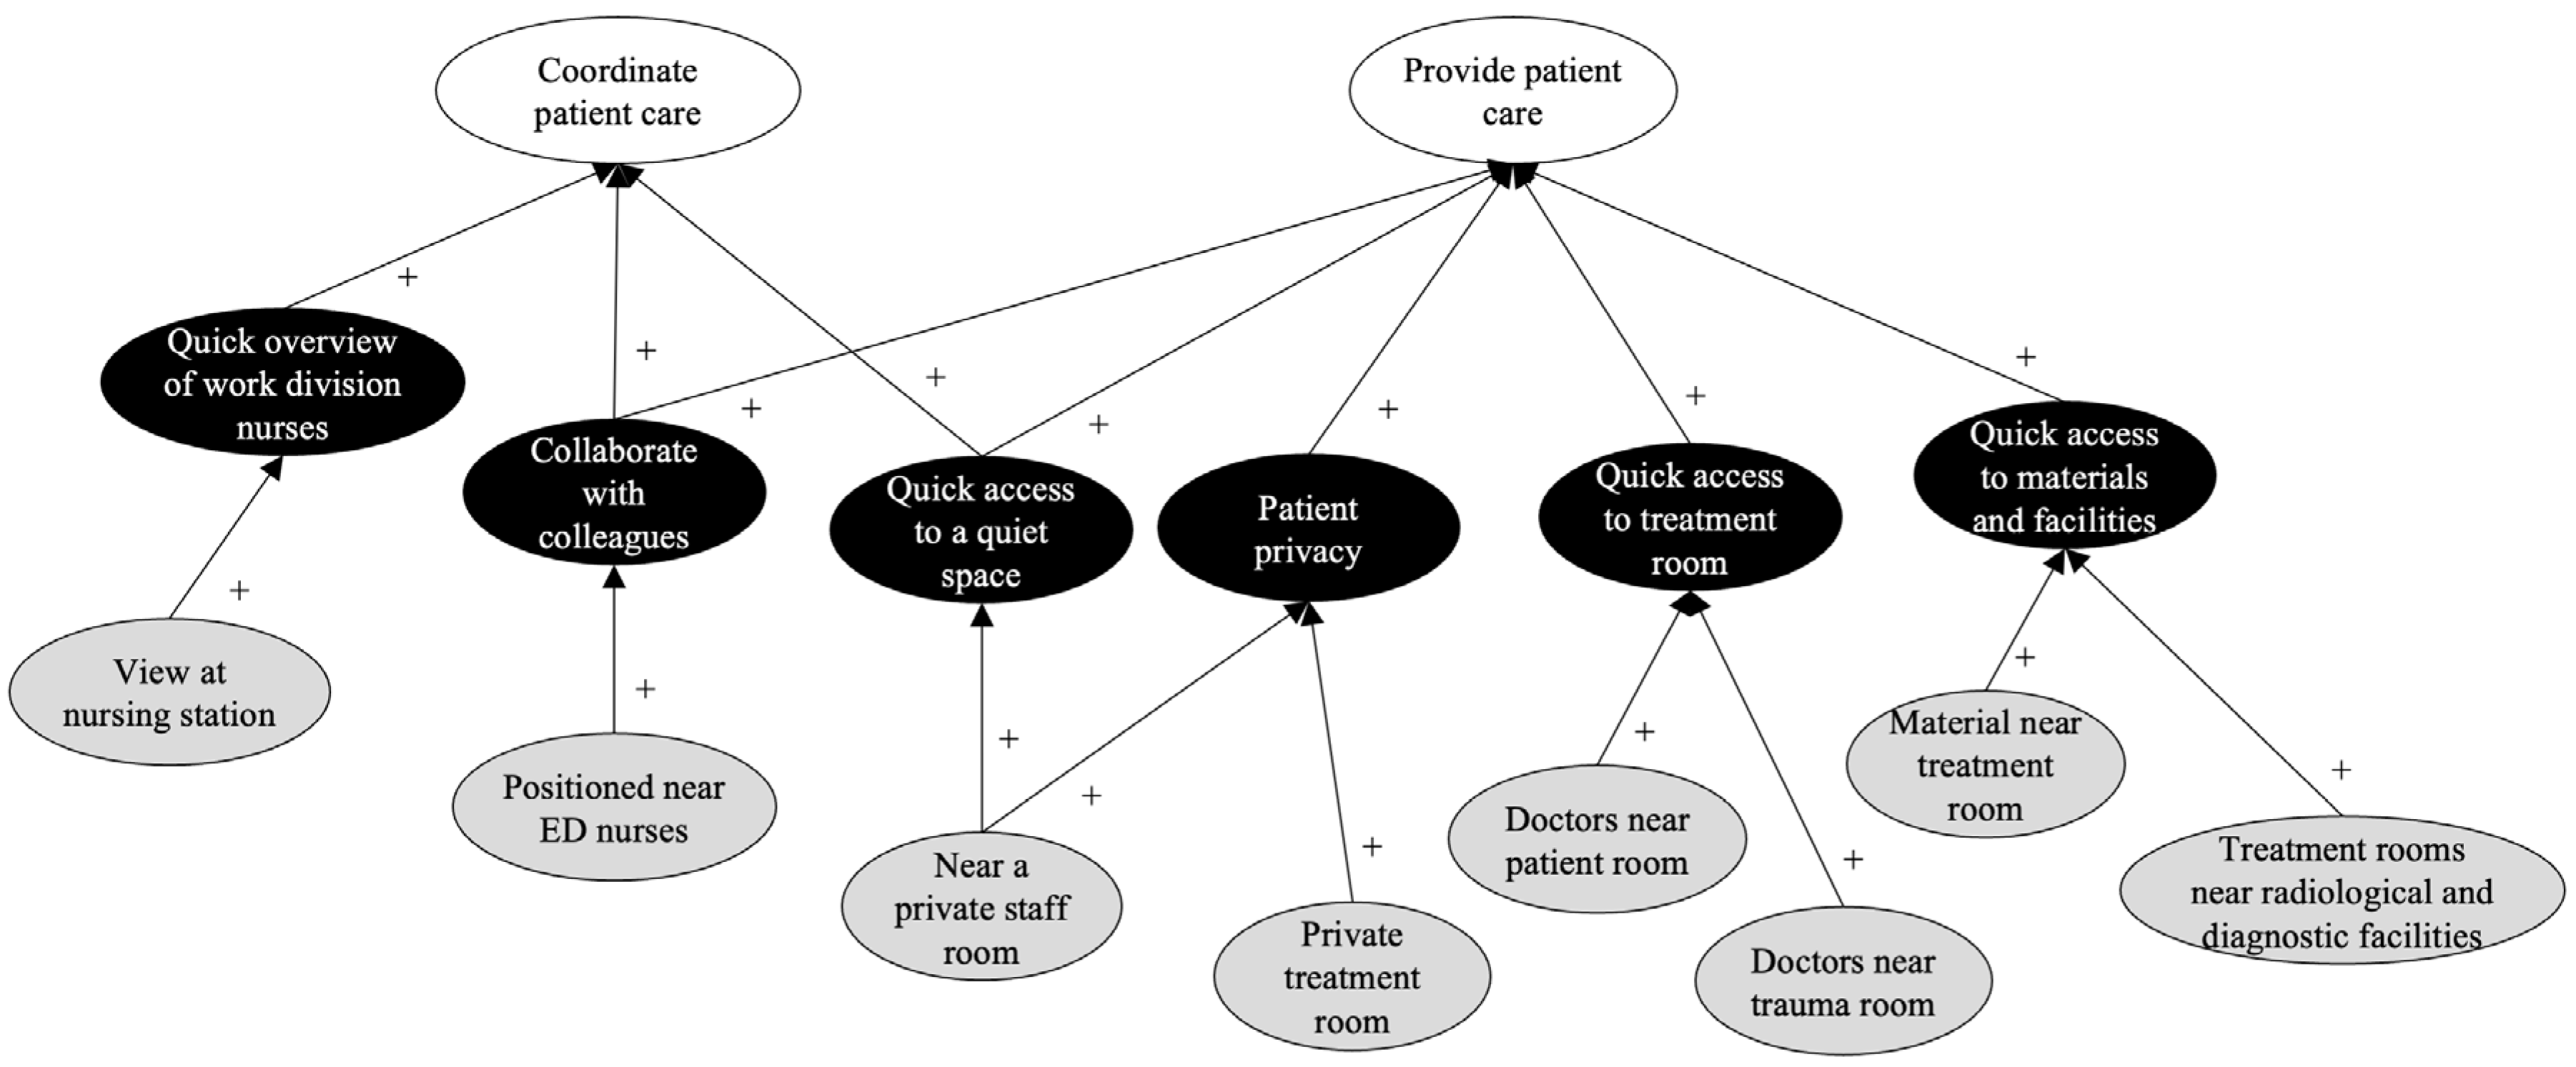
2.4.2. Spatial Needs: Cognitive Mapping
We used cognitive mapping techniques to define the spatial needs of ED employees and understand how these spatial needs related to the care process. Cognitive maps were constructed by the researcher after interview transcription, using the interview data to identify key concepts related to professional responsibilities, task requirements, and spatial needs. To manage subjectivity, the mapping process followed a consistent coding structure, and concepts were only included when they were clearly supported by the interview data. The maps were refined iteratively, comparing emerging patterns across participants to identify recurring spatial needs. The links between concepts in cognitive maps indicate how one concept can affect another, based on interviewees’ perceptions [
14,
15]. From the analysis of the interview data, we distinguished three different concept types in the cognitive maps:
White ovals: main responsibilities;
Black ovals: task-related requirements;
Gray ovals: spatial needs (e.g., visibility or proximity).
Connections between these elements reflected staff perceptions of whether spatial features supported (+) or hindered (−) task performance (see
Table 2).
We described the coordination network by combining insights from the cognitive maps and the description of the ED care process (i.e., the combined network). The spatial needs were grouped into two core spatial design factors: proximity (physical nearness) and visibility (line-of-sight access).
To visualize how these spatial needs relate to care processes and spatial configurations, we constructed two types of coordination network graphs: First, we defined the nodes based on role or facility and the edges based on spatial needs to show the spatial needs related to an efficient care process. Second, we defined (and plotted) the edges based on the locations in the layout (e.g., nursing stations or treatment rooms) to show how the current layout related to these spatial needs. Here, we used degree centrality to describe how visible or accessible a location should be.
2.4.3. Space Syntax Techniques
We used space syntax techniques to study the spatial configuration of the current layout using depthmapX 0.8.0.
Table 3 provides an overview of the space syntax analysis and metrics used in the data analysis.
We used visual step depth analysis to analyze the visual distance from one location to all other locations and to assess visibility. Visual step depth shows how many “steps” it takes to visually cover an area, with these steps being measured by how far one can see. Because persons are modeled as locations (e.g., nurses as nursing stations) and can walk around their assigned locations, it makes sense to not only assess visibility from a fixed point (i.e., isovists) but also appraise their visibility as they move around. The visual step depth from location U to V is the least number of “visual steps” from location U to V, where a visual step is taken when a path crosses the threshold of all space visible from the start of the previous visible step. We used metric step-depth analysis to analyze the distance from one location to all other locations and assess proximity. The shortest path distance was used as a metric to quantify the nearness from one location to another. We compared the network graphs of the spatial needs with the outcomes of the space syntax analyses to answer our second research question.
To answer our last research question, we evaluated spatial performance across the high-care and fast-track areas of the ED, which differ in their primary and secondary system designs. If there were multiple locations with the same function (e.g., treatment rooms), the average step depth (visual or metric) to or from different locations was calculated. We interpreted these differences through the lens of the open building approach, evaluating how decoupling between the primary (structure), and secondary (layout) systems influenced care efficiency. Efficiency was assessed in terms of spatial support for the main tasks and coordination needs of the ED staff using visibility and proximity measures. This allowed us to assess not only current layout performance but also the potential for spatial adaptation over time.
3. Results
3.1. ED Care Process
Figure 1 illustrates the ED care process as a combined network, illustrating how the main tasks of ED staff align with the sequence and location of patient-related activities.
The ED doctors, nurses, and desk employees are responsible for managing care processes and patient flow in the ED. Notably, ED doctors play two roles in the care process: managing and general. Managing doctors supervise the entire department from a central location and are responsible for managing patient flow. Additionally, they gather the trauma team when necessary. The trauma team consists of medical professionals who convene when a trauma patient arrives. General doctors have a more hands-on role in patient care and are responsible for coordinating patient care and supervising students. They also consider patient privacy and safety as important responsibilities.
As with doctors, ensuring the safety and privacy of patients is considered an important responsibility among nurses. ED nurses fulfill three roles: managing, general, and triage. Managing nurses, together with managing doctors, manage patient logistics in the ED by allocating patient care to general nurses. General nurses’ main task is to provide patient care. They are responsible for nursing up to five patient rooms and supervising students assigned to them. Although each nurse is assigned specific rooms in a zone, they do not necessarily work there only. Because of patients’ uncertain care needs, these nurses provide support or are supported by other colleagues. In addition, they are responsible for selecting patients from the waiting area. As for ED triage nurses, the primary responsibilities are managing the waiting area and triaging patients. Notably, ED triage nurses prioritize patients in the waiting area by conducting initial consultations in the triage room. If necessary, diagnostic tests are also initiated. When the waiting room is not busy, triage nurses support their colleagues by caring for patients in other parts of the ED.
The main responsibilities of ED desk employees include supervising the waiting area, receiving and registering patients, answering incoming phone calls, and providing support to triage nurses. When necessary and if work permits, they also support colleagues in the ED.
Figure 2 shows the locations and workplaces in the current ED layout. The ED at the studied hospital is divided into multiple areas based on three main patient types: fast-track (green area), high-care (blue area), and acutely threatened (yellow area). Fast-track patients typically have one clear problem, such as a bone fracture, and are expected to be treated quickly. High-care patients are more complex and are expected to require multiple examinations or tests before a treatment plan can be established. Both patient groups follow the same general patient process. However, high-care patients are treated in high-care areas and fast-track patients are mainly treated in fast-track areas. As they require immediate treatment, acutely threatened patients are first observed in trauma rooms. After stabilization, they are moved to a treatment room or, depending on the severity of their injuries, to the operating room or intensive care unit. The acute short-stay department is adjacent to the ED and used for patients who are waiting for test results before they can return home.
3.2. Spatial Needs in Relation to the Care Process and Layout
3.2.1. Spatial Needs and the Care Process
Figure 3 and
Figure 4 present the coordination network graphs, which show spatial needs related to an efficient care process in terms of visibility and proximity. In these graphs, the nodes are roles or facilities, and the edges are based on the spatial needs for visibility and proximity. The cognitive maps (
Figure 5,
Figure 6,
Figure 7,
Figure 8,
Figure 9 and
Figure 10) illustrate how these spatial needs relate to the main tasks outlined in the care process, as shown in
Figure 1.
Figure 3 shows that the ED managing doctor and ED nurse are the most central nodes, indicating that their locations should be the most visible in the layout. For the ED managing doctor, this is related to the tasks of “manage patient flow” and “supervision ED” (
Figure 5). The central position of the ED nurse in the visibility graph is related to the provision of patient care (
Figure 6). In contrast, the desk employee and waiting area form an isolated pair with low centrality. Direct visibility in the waiting area supports the desk employee’s task of managing the waiting area (
Figure 7). However, their main tasks do not require any other visibility spatial needs. The treatment rooms are only connected to the ED nurses; this connection negatively (positively) impacts patient privacy (safety), both of which are needed to provide efficient patient care (
Figure 6). The ED managing nurse has a similar visibility profile to the ED managing doctor; the only difference is that they are not connected to the ED doctor.
Figure 5 and
Figure 8 show that their similar profiles are because they both have the task of managing patient flow.
Figure 4 shows that the roles of the ED nurse and desk employee, as well as the facilities’ treatment room and waiting area, are the most central. This suggests that they should be quickly accessible. For the ED nurses, this is related to the efficient provision of patient care and picking up of patients (
Figure 6). For the desk employees, it is related to receiving and registering patients, supporting patient care, and managing the waiting area (
Figure 7). The treatment room is central in the proximity graph, mainly because of its connection with other facilities (waiting area, radiology, etc.), owing to the patient process (
Figure 1). The waiting area has connections with the most different roles, that is, with the ED nurse, triage nurse, and desk employee. They want quick access to the waiting area to support picking up patients (
Figure 5), receiving and registering patients (
Figure 7), and triaging patients (
Figure 9).
Overall, we see more edges and nodes in the proximity graph than in the visibility graph. In the proximity graph, more nodes refer to facilities, indicating that it is important to have quick access to certain facilities; however, spatial visibility is not required. For example, ED nurses need quick access to the patient room and radiological facilities to provide efficient patient care (
Figure 6). The connection between facilities also emerges from the combined network, where we see that patients move back and forth toward radiology, both from the waiting area and patient rooms (
Figure 1). There is also an overlap between both graphs; for example, the connection between ED doctors and ED nurses. To coordinate patient care, the ED doctor wants to provide a quick overview of the nurses’ work divisions. In addition, nurses and doctors prefer to be positioned near each other because it makes it easier for them to collaborate with regard to providing and coordinating patient care (
Figure 6 and
Figure 10).
3.2.2. Spatial Needs and Layout
Figure 11 and
Figure 12 illustrate how the previously described spatial needs relate to the ED layout. Based on the ED layout (see
Figure 2), various roles (i.e., triage nurse) and facilities (i.e., patient room) are mapped to specific locations. In these graphs, nodes represent the locations and edges indicate the corresponding visibility or proximity of spatial needs between them.
Figure 11 shows that both nursing stations (NS1 and NS2) are the most central in the graph, suggesting that these locations should be the most visible. As shown in
Figure 12, the waiting area, radiological facilities, and ambulance hall have the highest degrees and are the most central, indicating that they should be quickly accessible. Their high centrality is partly because these facilities are shared between both the fast-track and high-care areas as opposed to, for example, the doctor’s room. The treatment, triage, and trauma rooms all have comparable degrees and are less central. While overlaying the network graphs on the layout configuration provides insights into how spatial needs correspond to the layout, it does not yet demonstrate how effectively the layout supports these spatial needs.
3.3. Assessing Spatial Needs Using Space Syntax
3.3.1. Visibility
Figure 13 presents the step depth spatial analyses of the layout. The red nodes, yellow squares and edges indicate the spatial needs related to the focal point of analysis (a subset of
Figure 11). The color-coded step depth analysis shows how well these spatial needs are supported by the layout. Blue areas indicate locations that are more directly visible from the focal point, and warmer colors (yellow and orange) represent areas that are less visible (see legend in
Figure 13a). The analysis allows for assessing how well the current layout supports the visibility spatial needs of various roles, such as doctors or nurses.
Figure 13a,b shows that only 9 of the 22 treatment rooms are directly visible from the nursing stations. Being able to see a treatment room supports patient safety, which in turn supports the ED nurses’ tasks in providing patient care.
The managing location (i.e., the managing doctor and nurse) is not visible from either the nursing stations (
Figure 13a,b) or the doctor’s room (
Figure 13c,d). One to five step depths are required to observe the managing location from these points. There is also no direct view of the ambulance hall (
Figure 13e). This can negatively affect doctors’ ability to supervise the ED (
Figure 5).
Figure 13e shows that one of the three doctor rooms is visible from the managing location, and neither the nursing stations nor the ambulance hall are directly visible, making it difficult to obtain a quick overview of the ED. As managing nurses and doctors are positioned together, they are directly visible to each other, thus enhancing their collaboration. Both requirements, “quick overview of the ED” and “collaboration between the managing function,” affect the task of patient flow management (
Figure 5 and
Figure 6).
Figure 13f shows that the waiting area is clearly visible from the registration desk, which supports the ED desk employees’ task of managing the waiting area.
3.3.2. Proximity
We performed multiple metric shortest-path analyses to analyze all the spatial needs related to proximity.
Figure 14 shows the results of these metric step depth analyses in a manner similar to that shown in
Figure 13. Here, the red nodes, yellow squares and edges indicate the spatial needs related to the point of analysis (note that this is a subset of
Figure 12). The color-coded metric step depth analysis shows how well these spatial needs are supported by the layout. Blue areas indicate locations that are in closer proximity to the focal point, and warmer colors (orange and red) represent areas that are less close (see legend in
Figure 14a).
Figure 14a–d show that most treatment rooms are within 20 m of the nursing stations and doctor rooms, and only five treatment rooms are at a longer distance. In both the high-care and fast-track areas, the doctor’s room and nursing station are positioned within 10 m of each other. We know from the cognitive map results (
Figure 7 and
Figure 8) that having quick access to patients in the treatment rooms and collaborating with colleagues helps doctors and nurses to efficiently provide patient care.
Figure 14e shows that the managing nurse and doctor are positioned together and, hence, near each other. This supports collaboration in managing patient flow (
Figure 5 and
Figure 6). Being positioned near the trauma room supports the ED managing doctor when collecting the trauma team (
Figure 5).
Figure 14f,h show that both the triage rooms and registration desk are located near the waiting area. This supports patient flow and management of the waiting area (
Figure 1,
Figure 9, and
Figure 10). The triage nurses are positioned in the triage rooms but not together. This supports them in efficiently triaging patients but not in managing waiting areas (
Figure 10).
Figure 14h shows that the waiting area is near the ED desk and radiological facilities, supporting patient flow (
Figure 1) and efficient patient triaging (
Figure 10). The distance from the waiting area to the different treatment rooms ranges from 10 to 60 m, affecting both patient flow and the tasks of ED nurses in picking up patients from the waiting area.
Figure 14i shows that the ambulance hall is the nearest to the trauma rooms and the ED desk. Subsequently, the treatment rooms are more remote. The proximity of these locations is related to efficient patient flow (
Figure 1).
Figure 14j shows that different treatment rooms (triage, trauma, high-care, and fast-track) are at different distances from the radiology department. Hence, depending on the treatment room a patient comes from, the radiology unit is nearby or further away. This affects patient flow and ED doctors’ and nurses’ ability to provide efficient patient care (
Figure 1).
3.3.3. Comparative Analysis
The high-care area scores are equal or better (i.e., the visual step depth scores are equal or lower) for all visibility spatial needs (
Table 4). Based on the cognitive maps, it is expected that managing patient flow, as well as supervising the ED and patient care, will be better supported in the high-care area than in the fast-track area. This is partly because the managing function is shared between both areas but located in the high-care area, causing a lack of coordination and making the care process less efficient. Another reason is that there is better visibility of patient rooms in the high-care area.
The high-care area scores are equal or better (i.e., the shortest path distances are equal or lower) for all proximity spatial needs (
Table 5). Notably, ED desk employees are positioned closer to ED nurses in the high-care area, and treatment rooms in the high-care area are closer to the radiological facilities, ambulance hall, and waiting area. From
Figure 12, we see that these spatial needs are all related to functions that are shared between both areas but are in the high-care area. As a result, patient flow, pick-up, and care are expected to be less supported in the fast-track area, impacting the efficiency of the care process.
3.3.4. Interpretation Through the Open Building Lens
Overall, the high-care area layout supports spatial needs (both in terms of visibility and proximity) more effectively than the fast-track area. This enhances coordination, safety, and flow within the ED.
From an open building perspective, the fast-track layout indicates a limited degree of decoupling between the system levels. The findings suggest that the structural components (primary system) and functional layout elements (secondary system) constrain the ability of the care process (tertiary system) to adapt to operational needs. This limited degree of system separation contributes to spatial inefficiencies.
In contrast, the high-care area shows stronger system separation, enabling greater alignment between spatial configuration and care delivery requirements. This also suggests a higher degree of adaptability towards changing care processes within that part of the ED.
4. Discussion
This study was based upon a framework evaluating the coherence between hospital layout and care processes by integrating cognitive mapping and space syntax analysis within the conceptual lens of open building theory.
The ED case study illustrated how the proposed framework operates in practice and revealed three important insights. Together, these insights directly address the study’s three research questions. First, the spatial needs most closely associated with efficient care processes were visibility and proximity, which are frequently highlighted in prior studies on healthcare design and operational efficiency [
2,
10,
16]. These are two factors that support everyday tasks like coordination, supervision, and patient flow. As shown in the cognitive maps, staff described how being able to see colleagues or move easily between rooms helped them respond quickly to patient needs. This confirms earlier findings that spatial needs (proximity and visibility) have a direct impact task execution and staff satisfaction [
12,
16].
Second, the degree to which the layout supported these spatial needs varied significantly across both areas in the ED. In the high-care area, staff were well-positioned to maintain visibility and proximity. In contrast, the fast-track area exhibited layout limitations: restricted sightlines and longer walking distances hindered effective staff coordination and task execution. This spatial misalignment demonstrates how the physical network (the spatial layout) may constrain the coordination network, limiting the effectiveness of care delivery.
Third, these differences pointed to a key challenge for future spatial planning: the adaptability of ED’s system design. From an open building perspective, the high-care zone demonstrated a greater degree of system decoupling, allowing the layout (secondary system) to support changes in care processes (tertiary system) without being overly constrained by the structural framework (primary system). The fast-track area, however, showed limited flexibility, where the structure and layout restricted the ability to make operational or functional changes. When system levels are insufficiently separated, the lower levels cannot easily adapt without changing the higher levels [
5]. This underscores the importance of hospital building flexibility in supporting evolving care delivery [
4].
Finally, this study highlights that spatial layout should support not only the execution of care tasks but also their coordination. While coordination between professionals and patients is always required, coordination among staff can vary significantly depending on roles and team configurations. Some settings may benefit from centralized coordination, while others operate more efficiently with decentralized, self-organized teams. Spatial features such as visibility and proximity can enable or constrain these coordination strategies. Depending on the situation, it may not only be necessary to adapt how care is delivered, but also how coordination is performed. This flexibility in coordination is a key consideration for future layout design, reinforcing the value of space syntax in understanding and supporting both care processes and their underlying coordination networks. The proposed framework helps bridge the gap between architectural design and care delivery by linking staff experiences to measurable spatial characteristics.
Limitations
This study has several limitations that should be considered. The first entails the generalizability of the findings. The study respondents were limited to ED doctors, nurses, and desk employees, excluding other types of ED staff, such as radiologists, security personnel, and administrative staff. In addition, the number of interviewees was limited, which may have constrained the range of perspectives captured through cognitive mapping and the research is based on a single case study. This restricts the ability to draw conclusions applicable to other emergency departments or hospital contexts. In line with Yin [
17], this exploratory case study has seized the opportunity “to shed empirical light on some theoretical concepts or principles.” Instead of generalizing the findings, this case study should be used for analytic generalization, such as by defining new research.
Second, this study focused on the patient care process within the ED. While this is a critical element in the layout design, it overlooks other operational factors, such as material and supply logistics, as well as the connections between the ED and other hospital departments. These factors are vital for supporting efficient workflows and ensuring the continuity of care.
Third, although space syntax techniques were used to assess spatial needs, this study did not objectively weigh these spatial needs in relation to their impact on care delivery. The spatial requirements of different roles (e.g., doctors and nurses) may vary in importance. Understanding and quantifying these role-specific priorities could enhance layout optimization and lead to more targeted design interventions. In addition, without empirical data on staff behavior, conclusions about how well the layout supports care processes are based on expected rather than observed use.
5. Conclusions
This study explored how the layout of an ED can support efficient care processes now and in the future via decoupling between system levels. Our results show that the choices in primary and secondary system designs can influence the functionality of the tertiary system. The lack of decoupling leads to inefficiencies and limits the flexibility to adapt the space to support future care needs.
To address this challenge, we proposed an evaluation framework that combines cognitive mapping and space syntax analysis. This approach supports informed decision-making by addressing multiple spatial needs simultaneously, offering insights into the coherence between spatial configuration and care delivery, and enabling quantitative comparison across different layout designs.
Future Research
There are several possible directions for future research. One is to further develop the proposed evaluation framework. The effect of spatial needs on the effectiveness and efficiency of operational processes can be compared more objectively by using simulation modeling. For example, by incorporating patient flow and staff movement data and incorporating a multi-criteria decision-making approach. This would enable a better prioritization of spatial needs.
Another direction is to apply the proposed method when designing hospitals to support multiple future scenarios. The evaluation framework should then be expanded to include external factors that impact on the changing functions that a layout must fulfill (e.g., patient demographics or care models).
Finally, to validate the approach and make the findings more applicable to real-world design, future research could apply this method in different settings. For example, by integrating other factors, such as material logistics and connections to other (hospital) departments.


 ,
, 


