


Construction of Hospital Diagnosis-Related Group Refinement Performance Evaluation Based on Delphi Method and Analytic Hierarchy Process

Abstract
1. Introduction
2. Method
2.1. Delphi Method
- (i)
- Response to round 1 Delphi ResultsIndicator Refinement Process:
- Response Rate: 100% questionnaire recovery (28/28 experts).
- Exclusion Criteria: Eliminated all indicators with coefficient of variation (CV) > 0.25 (statistical threshold for low consensus). Conducted structured brainstorming sessions to align indicators with national standards.
- Indicator Reduction: Initial pool of 125 indicators → 32 retained (74.4% reduction). The rationale was streamlining for operational feasibility while maintaining policy compliance.
- (ii)
- Round 2 Delphi Outcomes
- Expert Engagement: All 28 indicators scored ≥ 3.5/5 (mean ± SD: 4.2 ± 0.3), demonstrating strong consensus.
- Top-Performing Indicators: Case Mix Index (CMI), mean score: 4.5 ± 0.2, reflects clinical complexity. Rate of surgeries and interventions, mean score: 4.2 ± 0.3, significance measures procedural intensity. Proportion of Grade 3–4 surgeries, mean score: 4.3 ± 0.2, significance proxies technical capability.
2.2. Weight Determination for Public Hospital KPIs: Pairwise Mean Comparison and TTL Normalization Approach
2.3. Integrating Excel-Based Descriptive Analysis with SPSS Reliability Testing
3. Construction of a Fine-Grained Performance Assessment Indicator System for District-Level Hospitals Based on DRG
3.1. Enthusiasm, Authority, and Reliability of Experts
3.2. Modification of the Performance Assessment Indicator System
4. Result
4.1. Inclusion Criteria
- (1)
- Patient Scope: All discharged patients from the study hospital (2019–2020).
- (2)
- Data Completeness: Medical records with sufficient detail for CN-DRG grouping.
- (3)
- Hospitalization Duration: Length of stay (LOS) between 1 and 60 days.
4.2. Exclusion Criteria and Sample Characteristics
- (1)
- Exclusions: LOS > 60 days or costs > JPY 2,000,000.
- (2)
- Final Cohort: 92,807 cases (Table 4).
4.3. DRG Grouping Methodology
- (1)
- System: CN-DRG (2019 Edition, National Health Commission).
- (2)
- Grouping Logic: Based on primary diagnosis, procedures, complications, and comorbidities.
- (3)
- Output: 786 DRGs.
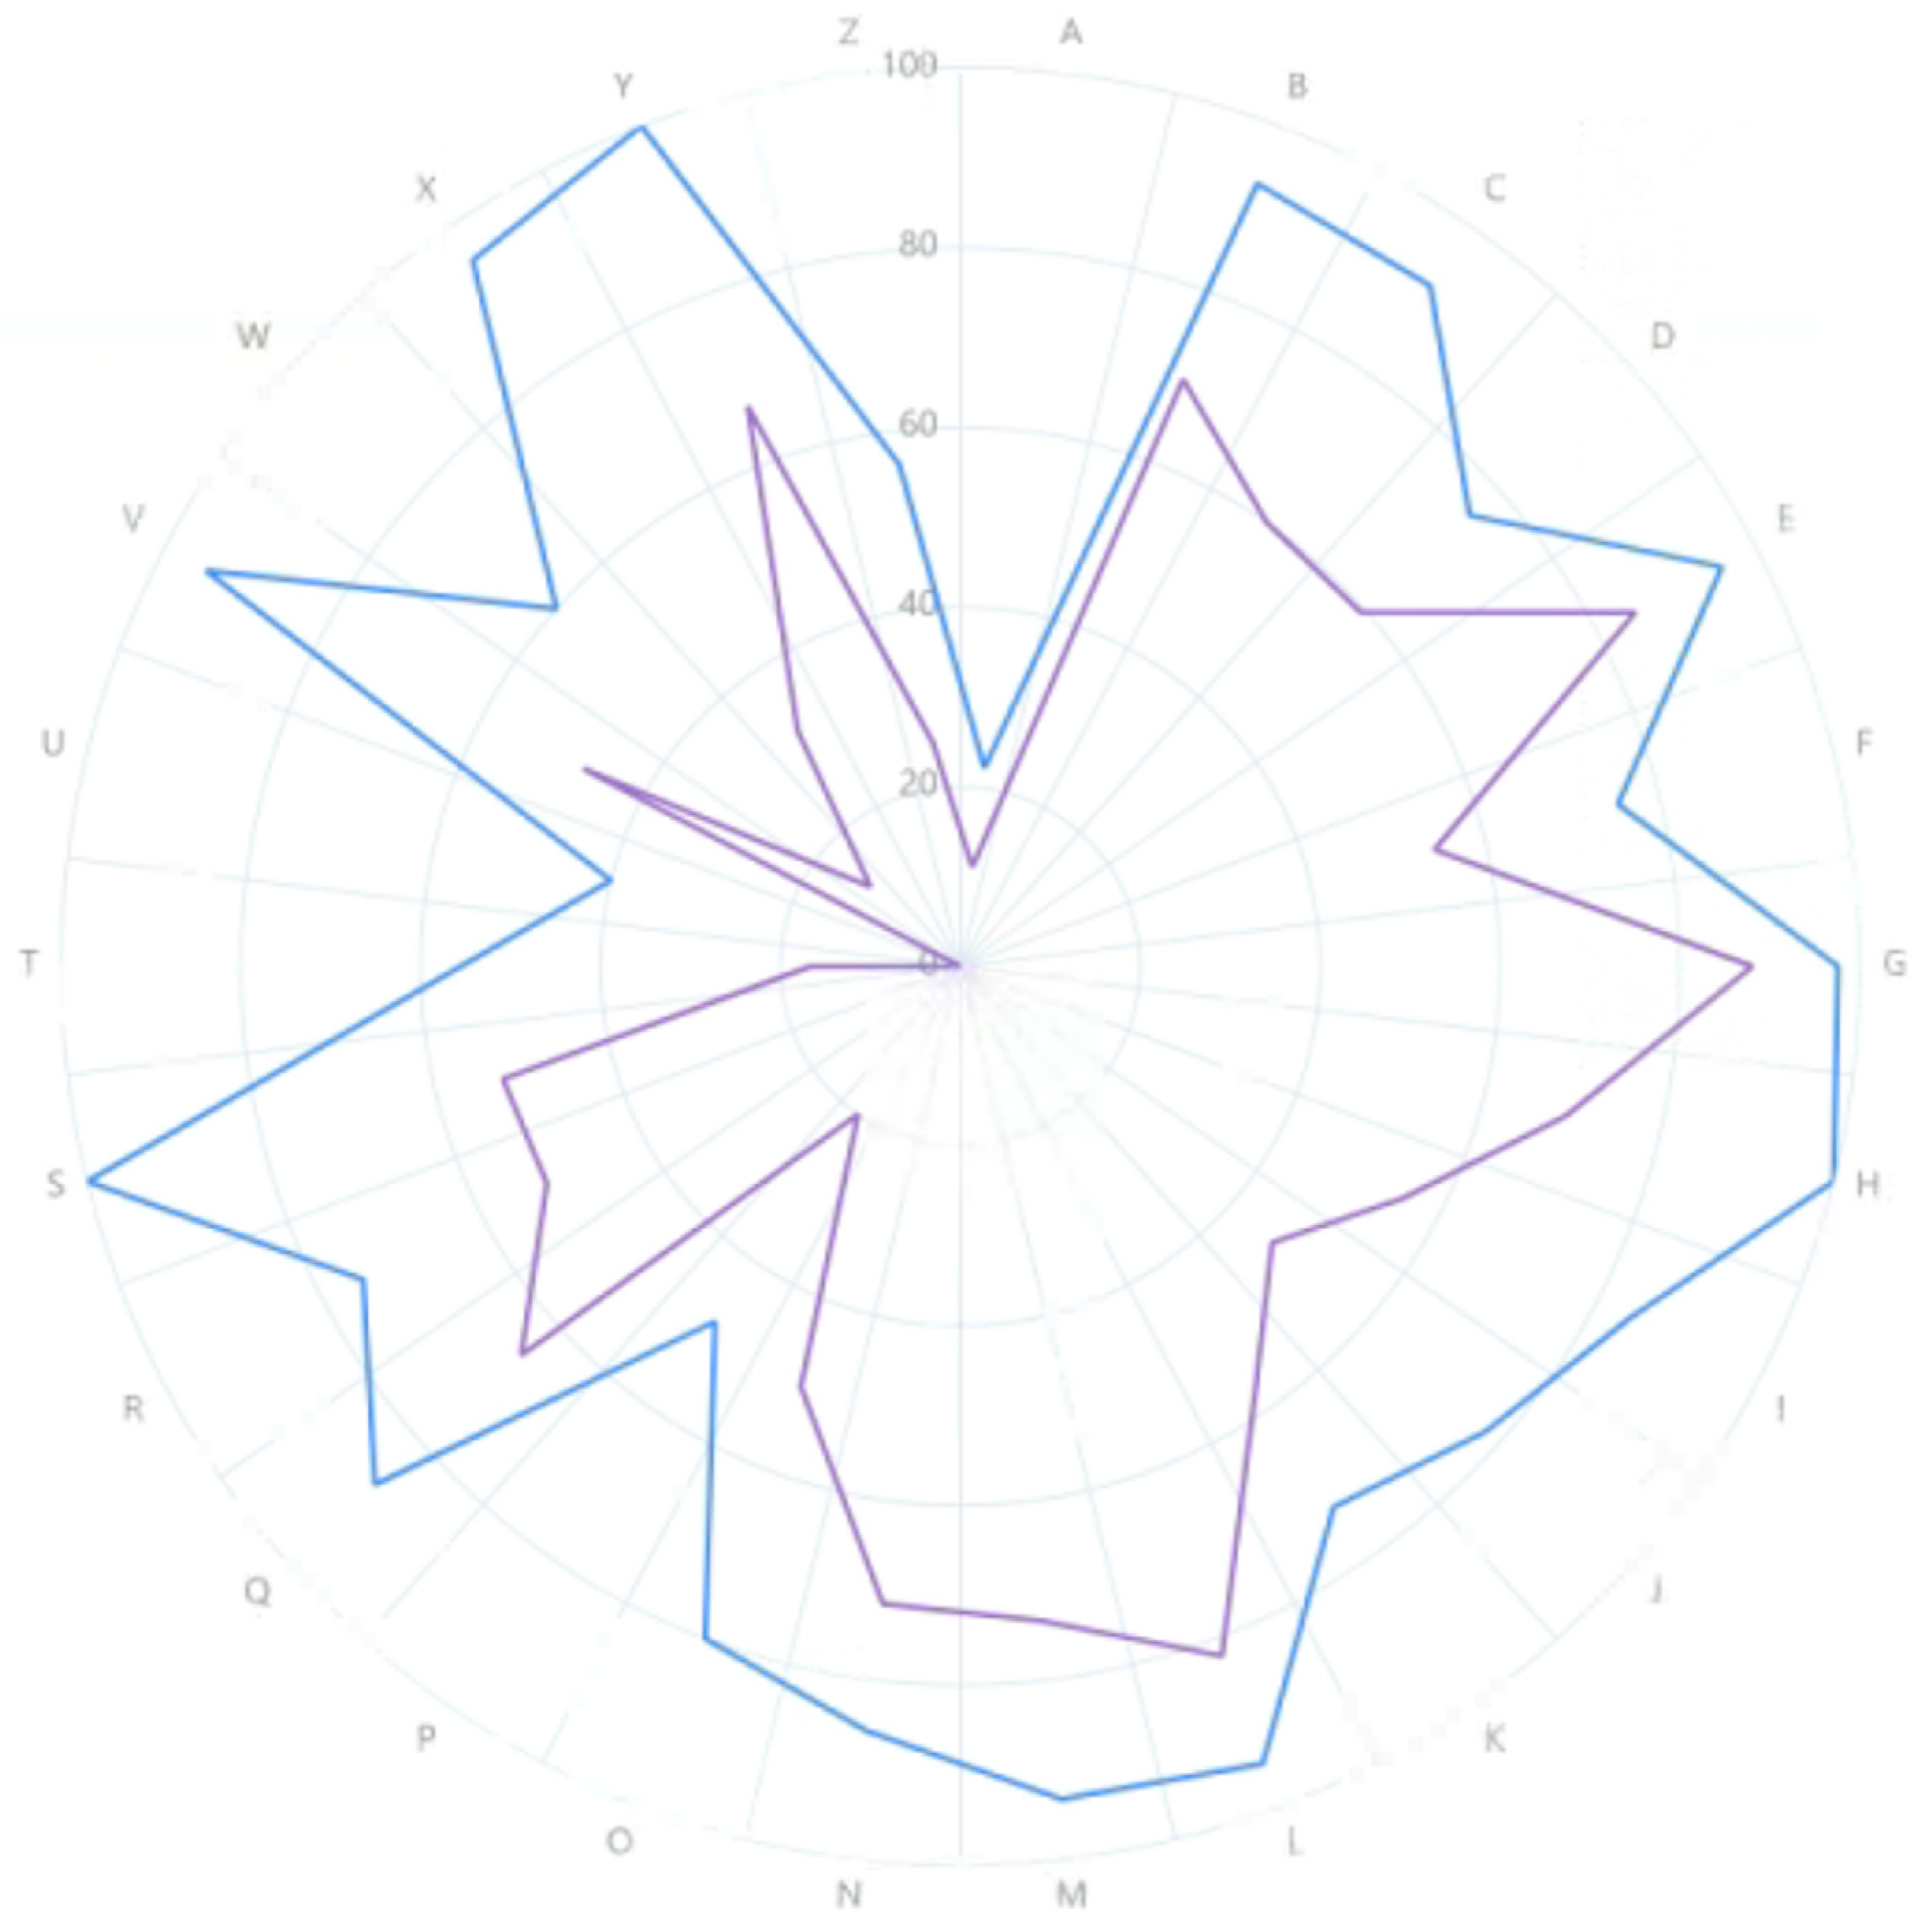
- (4)
- Coverage Gaps: Missing MDC groups P (psychiatry), A (multiple trauma), T (transplants) vs. region standards (Figure 1).
4.4. Significant Improvement in Healthcare Service Capacity
4.5. Progress in Healthcare Quality
4.6. Marked Enhancement in Service Efficiency
4.7. Improved Patient Satisfaction
5. Discussion
6. Conclusions
Author Contributions
Funding
Institutional Review Board Statement
Informed Consent Statement
Data Availability Statement
Conflicts of Interest
References
- Chen, F.; Zhang, L.; Yu, C.; Chen, X.; Chen, W. Study on Additional Payment Mechanism for Innovative Medical Technologies under DRG Payment: Based on International Experience and Enlightenment. Health Econ. Res. 2023, 40, 28–32. [Google Scholar]
- Zheng, L.; Chen, X.; Lin, Z. Study on the Adjustment Mechanism of DRG Core Elements Based on Medical Quality. Health Econ. Res. 2023, 40, 33–36. [Google Scholar]
- Qi, R.; Liu, L.; Yin, Y. Refined Management of Public Hospitals Based on DRG-Related Indicators. Chinese Med. Rec. 2023, 24, 35–39. [Google Scholar]
- Wang, Y.; Sun, Z.; Chen, Y. Review on Diagnosis-related Groups Research and Practices in Typical Countries and Its Enlightenment for China. Chin. Health Econ. 2021, 40, 91–96. [Google Scholar]
- Ran, S.; Zhu, J.; Zhang, H.; Xu, L. The Impact of Refined Management Measures Based on DRG on the Efficiency of NC19 Group Medical Services. China Med. Rec. 2023, 24, 45–46+98. [Google Scholar]
- Cui, Y.; Chen, H. Analysis of Inpatient Cost Structure of Pediatric Pneumonia in Beijing Municipal Hospitals Based on DRG. China Med. Rec. 2023, 24, 95–98. [Google Scholar]
- Gao, H.; Han, J.; Yan, J.; Feng, Q.; Chen, H. A knowledge mapping analysis of literature about application of DRGs to evaluating medical service performance in China. Guangxi Med. J. 2022, 11, 1270–1275. [Google Scholar]
- Lin, J. Exploration of Disease Cost Accounting Based on DRG Payment. Bus. Obs. 2023, 9, 24–26. [Google Scholar]
- Cao, J. Promoting Hospital DRG Performance Management through Data Analysis Systems. Netw. Secur. Technol. Appl. 2023, 7, 116–118. [Google Scholar]
- Yang, F.; Xie, A.; Ding, L.; Wang, J.; Chu, S. Countermeasure Research on Children’s Hospital Cost Management under DRG Payment Reform. China Hosp. Manag. 2023, 43, 64–67. [Google Scholar]
- Qin, X. Research on Cost Management of Traditional Chinese Hospitals under DRG Payment. Financ. Account. Learn. 2023, 19, 119–121. [Google Scholar]
- Tan, X. Discussion on the Transformation of Performance Management Model of Public Hospitals under the Background of DRG Payment. China Chief Account. 2023, 6, 141–143. [Google Scholar]
- Quan, Z. Research on Cost Accounting Method of Public Hospitals under DRG Payment. China Chief Account. 2023, 6, 99–101. [Google Scholar]
- Meng, J.; Liang, B.; Zhao, Y.; Li, Q.; Chen, F.; Bin, N. Management Strategies and Analysis of Medical Insurance Intelligent Monitoring System Feedback under DRG Payment. Jiangsu Health Care Manag. 2023, 34, 664–666. [Google Scholar]
- Pang, J. Exploration of Hospital Cost Management Pathway Under DRG Payment. China Chief Account. 2023, 5, 117–119. [Google Scholar]
- Yin, L.; Xia, Y. Impact of DRG Payment Reform on Hospital Management and Discussion of Solutions. China Health Stand. Manag. 2023, 14, 49–52. [Google Scholar]
- Jing, S. A Review of Performance Evaluation Models for Medical Institutions Based on DRG. Financ. Account. Learn. 2022, 36, 125–127. [Google Scholar]
- Niu, W. Construction of a Three-Level General Hospital Performance Evaluation Index System Based on DRG Guidance; Qingdao University: Qingdao, China, 2022. [Google Scholar]
- Luo, M.; Yang, G.; Liu, M.; Yu, Z. A Review of Patient Hospitalization Costs and Risk Management Under DRG Payment. Economist 2022, 2, 248–249+252. [Google Scholar]
- Di, J.; Liu, C.; Wu, N.; Gong, C.; Bo, Y.; Zhang, M. Research on Performance Allocation Model of Medical Institutions Using DRG: A Literature Review. Mod. Hosp. 2022, 22, 90–93. [Google Scholar]
- Feng, F.; Hu, X.; Ye, X.; Wu, Y. Policy Implications and Reform Practices of DRG and DIP in Promoting High-Quality Development of Public Hospitals: Summary of “DRG and High-Quality Development of Public Hospitals Seminar”. Health Econ. Res. 2021, 38, 35–38. [Google Scholar]


| Indicator | Number (n) | Composition (%) |
|---|---|---|
| Age | ||
| 30–49 years | 16 | 14 |
| Below 30 years | 1 | 57 |
| 50 years and above | 11 | 29 |
| Education | ||
| Bachelor’s degree | 22 | 57 |
| Doctorate or above | 2 | 14 |
| Master’s degree | 4 | 29 |
| Professional Title | ||
| Junior | 1 | 57 |
| Associate Senior | 5 | 86 |
| Full Senior | 13 | 43 |
| Intermediate | 9 | 14 |
| Work Experience | ||
| ≤10 years | 2 | 14 |
| ≥30 years | 8 | 57 |
| 10–19 years | 12 | 86 |
| 20–29 years | 6 | 43 |
| Judgment Basis | Familiarity with Questionnaire Content | Total (n = 28) |
|---|---|---|
| (1) Very Familiar (n = 9) | ||
| Theory Analysis | 4 | 17 |
| Practice Experience | 1 | 11 |
| Understanding of Domestic and Foreign Peers | 4 | 16 |
| Personal Intuition | 4 | 15 |
| (2) Familiar (n = 15) | ||
| Theory Analysis | 12 | 17 |
| Practice Experience | 8 | 11 |
| Understanding of Domestic and Foreign Peers | 11 | 16 |
| Personal Intuition | 9 | 15 |
| (3) Moderately Familiar (n = 4) | ||
| Theory Analysis | 1 | 17 |
| Practice Experience | 2 | 11 |
| Understanding of Domestic and Foreign Peers | 1 | 16 |
| Personal Intuition | 2 | 15 |
| Chi-Square Test: χ2 = 2.650, p = 0.851 | ||
| Primary Indicators | Secondary Indicator | Average Value | Total Score (TTL) | Weight Value |
|---|---|---|---|---|
| Quality | Discharge patients’ surgery proportion | 4.462 | 16.5 | 0.11419 |
| Proportion of level 3–4 surgeries | 4.308 | 14 | 0.09689 | |
| Surgery patient complication rate | 4.115 | 6.5 | 0.04498 | |
| Low-risk group case mortality rate | 4.269 | 12 | 0.08304 | |
| Number of DRGs | 4.308 | 14 | 0.09689 | |
| Class I incision infection rate | 4.115 | 6.5 | 0.04498 | |
| Elective surgery complication rate | 4.115 | 6.5 | 0.04498 | |
| 15-day readmission rate | 3.615 | 1.5 | 0.01038 | |
| Efficiency | Average cost per case | 4.115 | 6.5 | 0.04498 |
| Drug cost proportion of disease group (total drug expenditure/total medical revenue × 100%) | 3.962 | 2.5 | 0.0173 | |
| Consumables cost proportion of disease group | 4.231 | 10.5 | 0.07266 | |
| Proportion of medical service revenue (excluding drugs, consumables, and examination and test income) to medical income | 4.269 | 12 | 0.08304 | |
| Average length of stay | 4.077 | 3.5 | 0.02422 | |
| Time consumption index | 4.192 | 9.5 | 0.06574 | |
| Cost consumption index | 4.346 | 15.5 | 0.10727 | |
| Service attitude | Discharged patients’ satisfaction rate | 4.115 | 6.50 | 0.04498 |
| Number of effective complaints | 3.423 | 0.5 | 0.00346 |
| Year | Discharges | DRG-Grouped | Rate (%) | Male | Female | Low-Risk Cases | Low-Risk (%) | Deaths | Mortality (%) | Medical (%) | Surgical (%) |
|---|---|---|---|---|---|---|---|---|---|---|---|
| 2019 (Pre) | 52,164 | 51,995 | 99.68 | 27,274 | 24,721 | 16,341 | 31.43 | 213 | 0.41 | 59.25 | 40.75 |
| 2020 (Post) | 41,187 | 40,812 | 99.09 | 20,869 | 19,943 | 12,821 | 31.41 | 194 | 0.48 | 57.38 | 42.62 |
| Year | CMI | Proportion of Level 3–4 Surgeries (%) | Number of DRGs |
|---|---|---|---|
| 2019 (Pre) | 0.76 | 39.35 | 664 |
| 2020 (Post) | 0.86 | 49.11 | 661 |
| Year | Class I Incision Infection Rate (%) | Elective Surgery Complication Rate (%) | Low-Risk Group Mortality Rate (%) | 15-Day Readmissions (n) | Average Cost per Case (JPY) |
|---|---|---|---|---|---|
| 2019 (Pre) | 0.11 | 0.21 | 0.02 | 1488 | 7993.27 |
| 2020 (Post) | 0.03 | 0.25 | 0 | 939 | 9138.53 |
| Year | Drug Cost Proportion per DRG (%) | Consumable Cost Proportion per DRG (%) | Medical Service Income Proportion (%) | Average Length of Stay (Days) | Time Consumption Index | Cost Consumption Index |
|---|---|---|---|---|---|---|
| 2019 (Pre) | 28.59 | 12.83 | 31.8 | 7.78 | 0.98 | 0.78 |
| 2020 (Post) | 27.18 | 11.36 | 32.79 | 8.06 | 0.97 | 0.83 |
| Year | Discharged Patient Satisfaction (%) | Number of Valid Complaints |
|---|---|---|
| 2019 (Pre) | 97.55 | 36 |
| 2020 (Post) | 98.45 | 22 |
Disclaimer/Publisher’s Note: The statements, opinions and data contained in all publications are solely those of the individual author(s) and contributor(s) and not of MDPI and/or the editor(s). MDPI and/or the editor(s) disclaim responsibility for any injury to people or property resulting from any ideas, methods, instructions or products referred to in the content. |
© 2025 by the authors. Licensee MDPI, Basel, Switzerland. This article is an open access article distributed under the terms and conditions of the Creative Commons Attribution (CC BY) license (https://creativecommons.org/licenses/by/4.0/).
Share and Cite
Cai, M.; Yan, Z.; Wang, X.; Mao, B.; Pu, C. Construction of Hospital Diagnosis-Related Group Refinement Performance Evaluation Based on Delphi Method and Analytic Hierarchy Process. Hospitals 2025, 2, 20. https://doi.org/10.3390/hospitals2030020
Cai M, Yan Z, Wang X, Mao B, Pu C. Construction of Hospital Diagnosis-Related Group Refinement Performance Evaluation Based on Delphi Method and Analytic Hierarchy Process. Hospitals. 2025; 2(3):20. https://doi.org/10.3390/hospitals2030020
Chicago/Turabian StyleCai, Mingchun, Zhengbo Yan, Xiaoli Wang, Bing Mao, and Chuan Pu. 2025. "Construction of Hospital Diagnosis-Related Group Refinement Performance Evaluation Based on Delphi Method and Analytic Hierarchy Process" Hospitals 2, no. 3: 20. https://doi.org/10.3390/hospitals2030020
APA StyleCai, M., Yan, Z., Wang, X., Mao, B., & Pu, C. (2025). Construction of Hospital Diagnosis-Related Group Refinement Performance Evaluation Based on Delphi Method and Analytic Hierarchy Process. Hospitals, 2(3), 20. https://doi.org/10.3390/hospitals2030020