1. Introduction
Waiting lists for medical care exist in public health systems around the world. Canada [
1], England [
2,
3], Spain, Brazil [
4], Chile [
5], Colombia [
6], and Peru [
7] document efforts to reduce waiting times. Waiting lists are measured with two variables: the number of patients in the queue and the waiting time [
8]. The number in the queue is the number of patients waiting for a first-time consultation in a medical specialty, and the waiting time is the period between the identification of a care problem and the day of the consultation [
9]. When waiting times are very long, patients experience uncertainty and helplessness when anticipating the outcome of a disease. Waiting list management is complex, based on situations with subtle causes, and the effects of interventions are not noticeable. However, discrete event modeling and simulation have been shown to improve predictions [
10].
In Costa Rica, waiting lists for the public healthcare system represent a persistent problem that seriously affects patients. Over the past few decades, the Costa Rican Social Security Fund has implemented multiple strategies, such as evening surgeries, overtime, multimillion-dollar investments, and pilot plans based on socioeconomic criteria, without achieving sustainable changes [
11].
With the reform of the Caja Costarricense de Seguro Social initiated in the 1990s, the establishment of Equipos Básicos de Atención Integral en Salud (EBAIS) began to increase population coverage. This is one of the reform elements that has improved access and reduced inequalities. The proportion of the population with poor access to health services decreased from 30% to 22% in the pioneering areas that initiated the reform in 1995–1996. However, the localities with the greatest deficiencies in access to health services continue to be in rural areas, including the canton of Buenos Aires and the surrounding areas of Pérez Zeledón, as well as areas of Golfito, La Cruz, Barra de Colorado, and Carrantí de Matina. Also worthy of mention for their poor access to hospitals are the cantons of Garabito, Talamanca, and Tilarán–Cañas–Abangares [
12]. All the towns mentioned are within the attraction area of the hospitals under study.
Despite court rulings mandating structural solutions, waiting lists continue to grow. Lack of infrastructure, a shortage of specialists, and increased demand exacerbate the situation. In response, using technologies such as artificial intelligence, telemedicine, and discrete event simulation has been suggested to manage resources better and optimize waiting times.
In May 2023, there were 1,033,797 patients on the waiting list, with an average wait time of 358 days, while by October 2024, that number had increased to 1,175,383 patients with a wait of 346 days [
13].
In waiting lists, when the arrival rate is greater than the capacity of the service, the queue grows indefinitely, and desertion begins [
14]. In this case, arrival is a patient request consultation, and services are a specialty physician consultation. Then, the health status of patients worsens over time, and in the long term, it is more costly to bear the consequences. Systems typically increase capacity to deal with the condition, which means more operating costs. Some authors, such as Barros et al., analyzed the capacity management of emergency departments by combining demand analysis with stochastic simulations [
15]. On the other hand, Bittencourt et al. used queuing theory on hospital records to determine bed utilization, waiting time, and estimated capacity [
16]. An alternative solution that has been tested with better results is to reduce the number of arrivals to hospitals from primary care clinics. This proposal not only seeks to improve the efficiency of the system in the short term but also could contribute to improving the health of the population in the long term [
17].
There is sufficient evidence of the use of queuing theory in health systems. Yaduvanshi et al. applied queuing theory to optimize waiting time in hospital operations [
18]. Moreno et al. applied queuing theory to optimize the triage process in a tertiary emergency department (“ER”) [
19]. Santibanez et al. used a simulation to analyze the simultaneous impact of operations, scheduling, and resource allocation on patient waiting time, clinic overtime, and resource utilization [
20]. Sreelekshmi, Kumar, and Ushakumari studied outpatient discharge from a multi-specialty hospital in Kerala using a single-line multiple server queue [
21]. Bahadori et al. optimized the management of an outpatient pharmacy by developing queuing theory and simulation [
22]. Abubakar uses the discrete event simulation (DES) technique to examine patient flow in an urban healthcare facility, the General Hadejia Hospital (GHH), to analyze resource utilization, minimize waiting time, and improve efficiency and effectiveness [
23]. The results of this study are presented in the following pages.
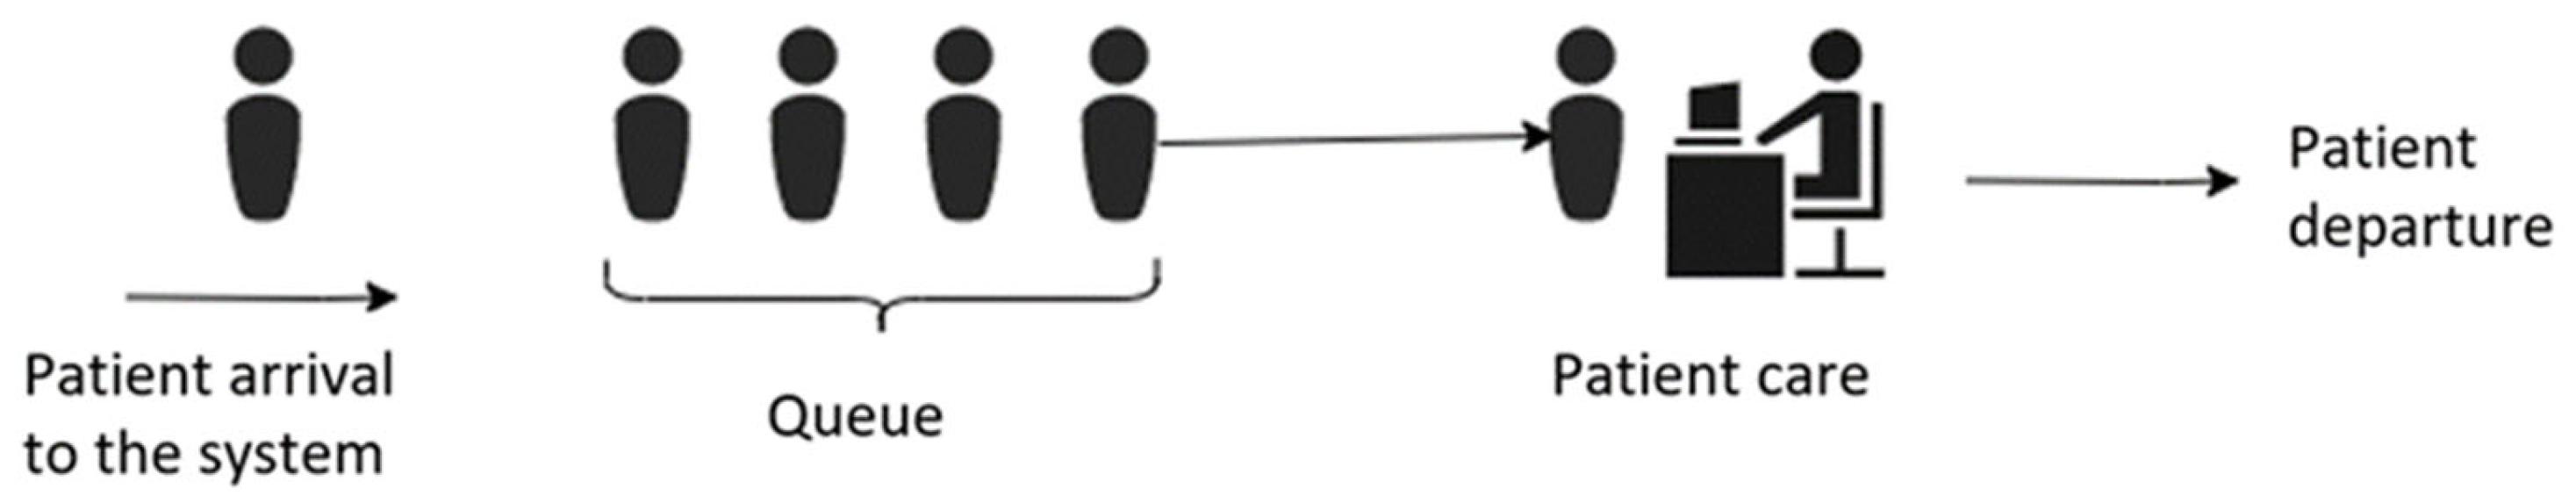
A single-channel, single-phase structure was used for modeling, and arrival and service patterns were solved by computer simulation [
24]. Patients are generated at an input source and join a queue. On the other side, at a particular time, a member of the queue is selected to provide the service through a service mechanism [
25].
The simulation model follows Kendall’s notation to formally represent the structure of queuing systems. This notation, expressed as A/B/K, characterizes queuing systems through three key parameters: the probability distribution of arrivals (A), the distribution of service times (B), and the number of servers or service channels (K). Queues were modeled as an M/M/1 queue, assuming probability distributions for the arrival rate and the service rate and a single service channel. This representation provides a convenient conceptual framework that facilitates the analysis of patient waiting times [
26].
The simulation model follows Kendall’s notation to formally represent the structure of queuing systems. This notation, expressed as A/B/K, characterizes queuing systems through three key parameters: the probability distribution of arrivals (A), the distribution of service times (B), and the number of servers or service channels (K). Queues were modeled as an M/M/1 queue, assuming probability distributions for the arrival rate and the service rate and a single service channel. This representation provides a convenient conceptual framework that facilitates the analysis of patient waiting times [
27].
This article uses engineering techniques to model waiting times in specialized outpatient clinics in the Costa Rican public health system. It also proposes a patient triage strategy aimed at reducing the influx of cases that do not require specialized medical care. This measure seeks to improve the opportunity for all patients to receive care. The developed model incorporates stochastic values in all its input variables, allowing for a more realistic representation of the system’s inherent variability.
2. Materials and Methods
When patients visit a Level 1 clinic, they are initially seen by a general practitioner (a doctor with a bachelor’s degree and no specialized medical training). If the general practitioner determines that the patient’s condition requires more complex care, they are referred to a specialist at one of the hospitals in this study. Once referred, hospital staff schedule an appointment with the appropriate specialist.
Specialist consultations are conducted in hospitals or Level 2 clinics by physicians with advanced training and certification in specific medical areas. If a patient must wait more than 90 days for this consultation, they are officially placed on a waiting list.
This study focuses on analyzing these long wait times to better understand and address delays in accessing specialized medical care within the health system.
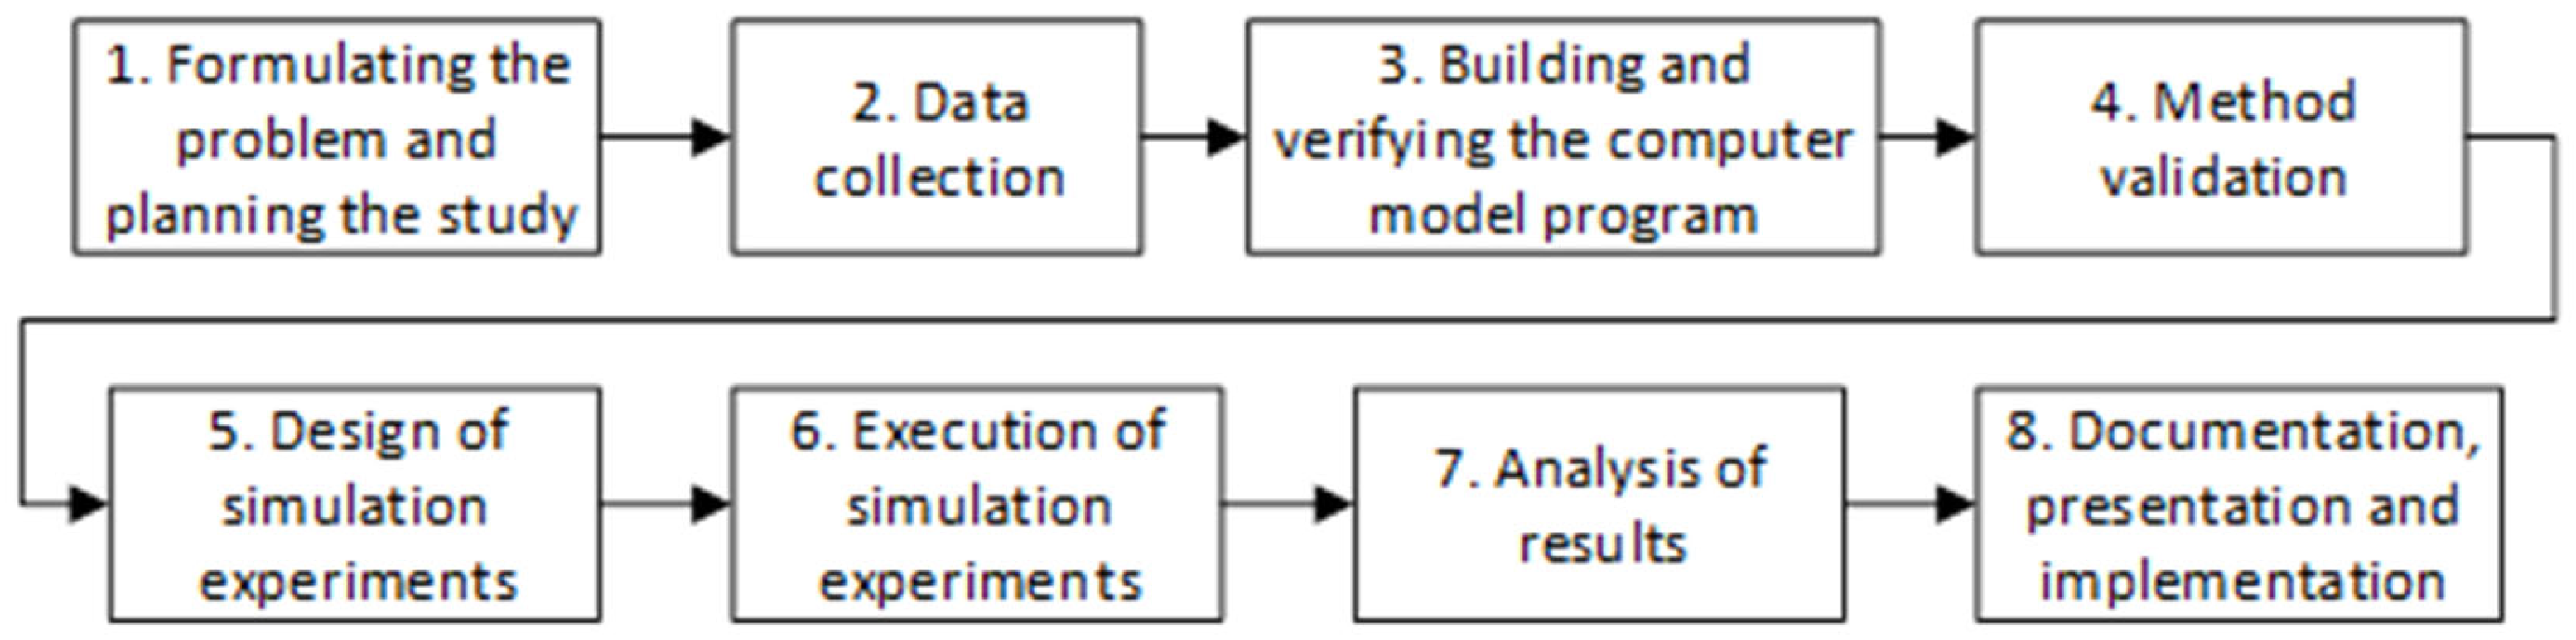
Figure 1 shows the methodology used. The research team defines the problem, creates a work plan, and collects data. Once the model is specified, they verify that the software represents the real system as faithfully as possible with the validation stage, which consists of comparing the model’s dependent variables with historical reports.
The models were based on the M/M/1 queuing system. In this notation, the first “M” represents a Markovian (i.e., exponential) distribution for inter-arrival times, the second “M” denotes an exponential distribution for service times, and the final “1” indicates a single server in the system. In typical applications, the interarrival and service times are assumed to follow exponential distributions, reflecting the memoryless property of these processes.
λ represents the average arrival rate and
μ the average service rate. The traffic intensity
ρ =
λ/
μ must be less than 1 for the system to reach a steady-state equilibrium. If this condition is not met (i.e.,
λ/
μ ≥ 1), the system becomes unstable, and the expected number of customers in the queue will grow indefinitely over time [
28].
Figure 2 shows a schematic of the queuing theory model.
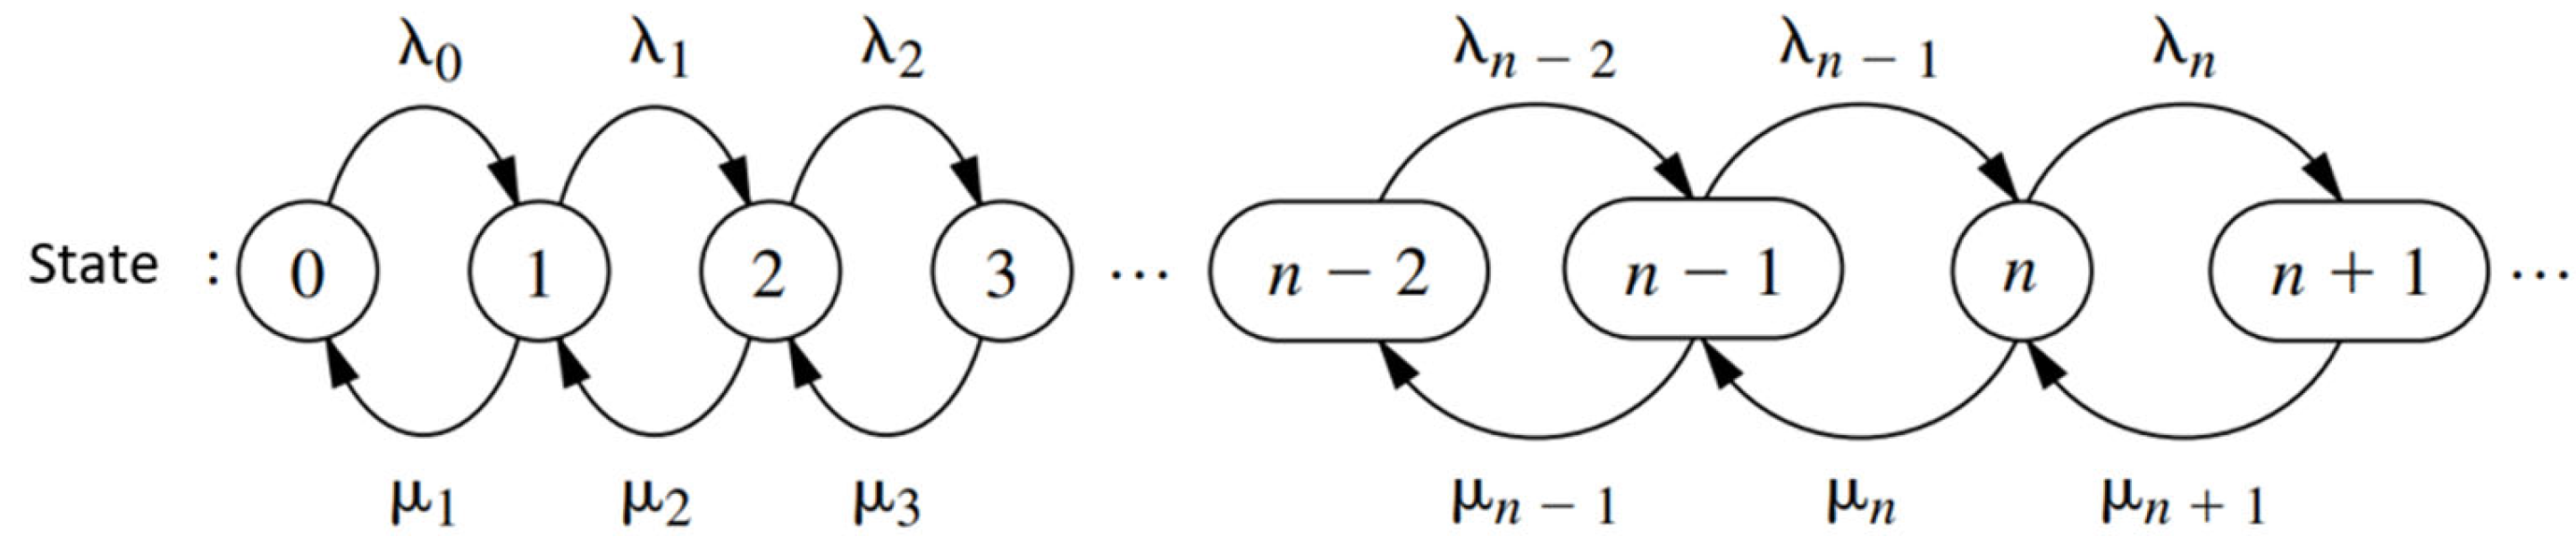
Figure 3 describes the behavior of a birth and death process. Each arrival occurs, symbolized by
λn, and µn represents the patient’s care. The birth and death processes allow us to model the number of patients waiting. The state of the system at time
t (
t ≥ 0), denoted by
N(
t), is the number of customers in the queuing system at time
t.
The birth and death process is described in probabilistic terms as how
N(
t) changes as
t increases [
28]. Given
N(
t) =
n, the probability distribution of births is exponential with parameter
λn (
n = 0, 1, 2…). The probability distribution of deaths is exponential with parameter
µn (
n = 0, 1, 2…). The variables are mutually independent.
Many constraints affect capacity and flow: absenteeism, work overload, vacation, medical leave, etc. Historical records were used to represent these constraints, which implicitly include them.
To build the model, the best-fit curve was selected for the arrivals and attendances of each system. Input Analyser, a statistical software designed explicitly for this purpose, was used to define the best-fit curve. Given the interval specification, the Input Analyser calculates a Chi-square goodness-of-fit statistic, a Kolmogorov–Smirnov test, and squared error criteria [
29].
Then, a representation of the services was made using the Monte Carlo technique. Monte Carlo simulation creates a mathematical model representing a system with random input variables. These variables are assigned randomly generated values according to defined probability distributions. The model is run using these values, and the process is repeated several times [
30]. The Monte Carlo method simulates various possible outcomes using random sampling and statistical analysis. In healthcare, this methodology has proven invaluable in treatment planning, risk assessment, and resource allocation. The model was run for two years with these values, and each run was replicated 10 times. The simulation thus estimated the average waiting time for a patient to receive a specialized outpatient consultation.
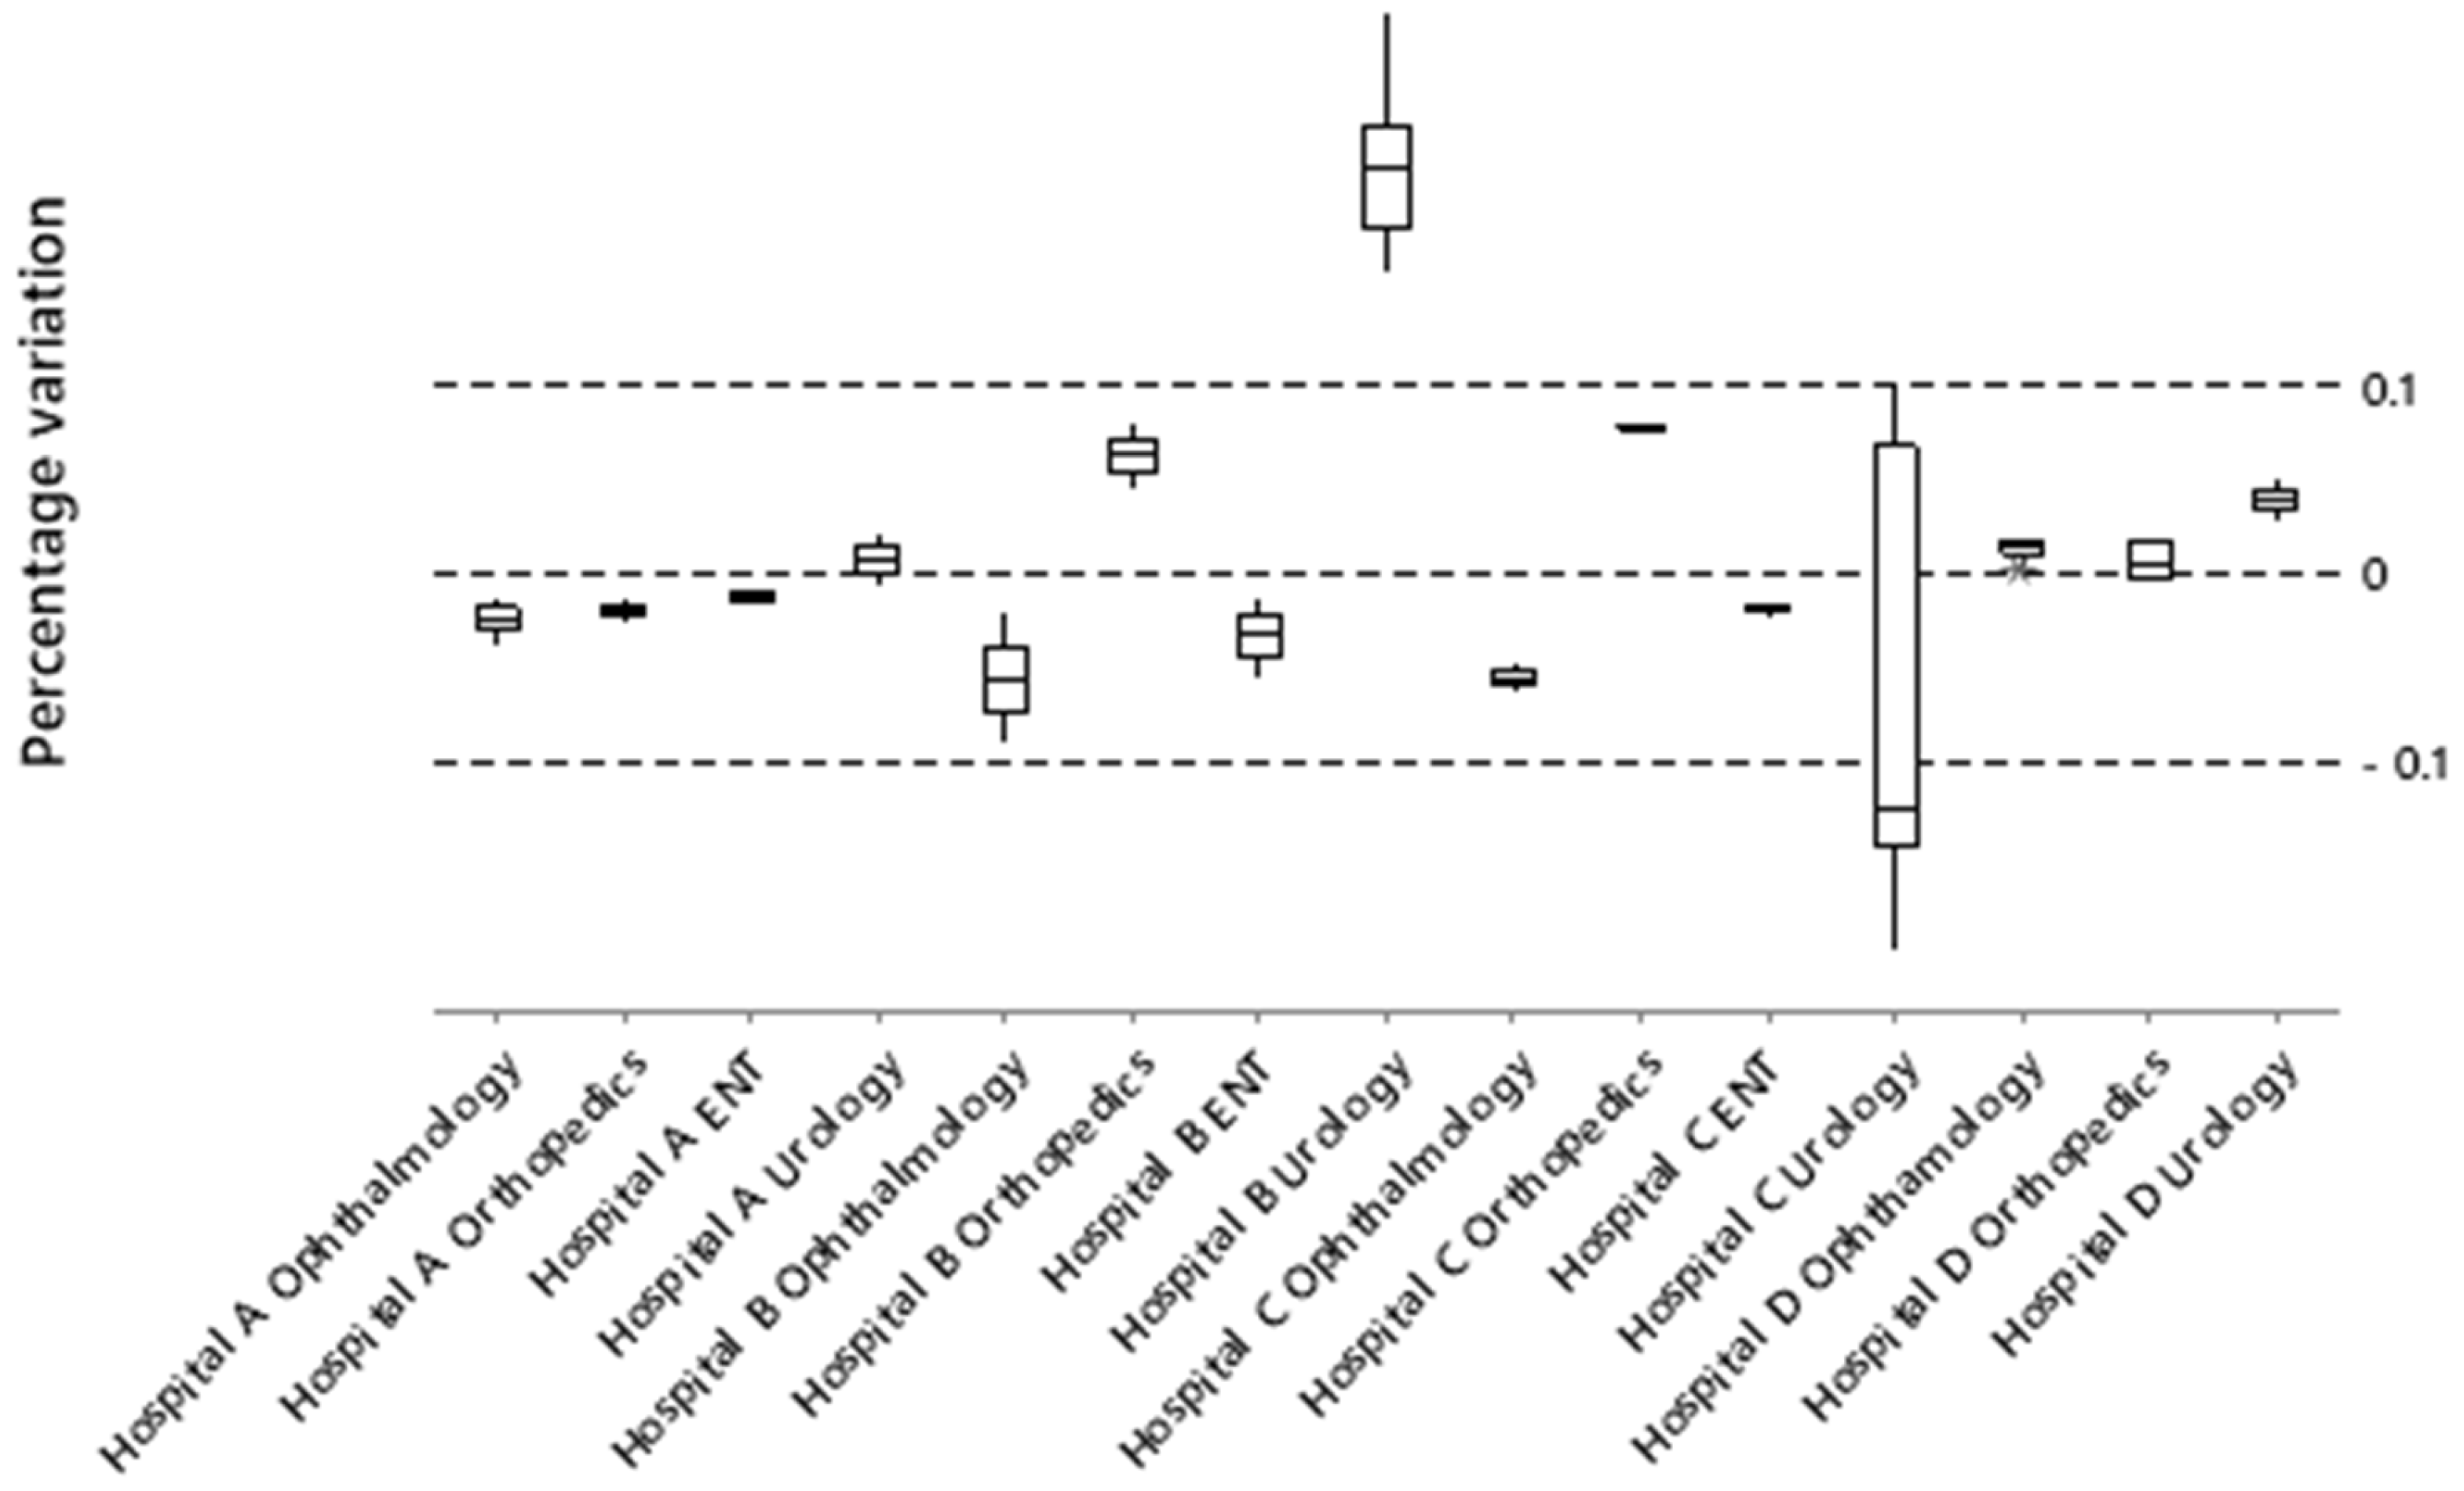
The percentage variation technique was used to validate the data, calculating the percentage variation in simulated waiting times versus actual data. Those specialties with a percentage variation of less than 10% were validated, meaning they are suitable for the design of experiments. Equation (1) shows the percentages of variation of the simulated data compared to the actual reports.
No universal criterion exists for these limits, but expert judgment and statistical measures (such as percentage difference) are often used. Given the complexity of data in healthcare systems, a 10% variation rate is acceptable [
31].
After the classification, the number of simulations to be applied to each model for the design of the experiments was determined. The number of simulation runs is the number of times the model must be run for the data obtained to be statistically reliable for decision making [
32]. Equation (2) shows the variation around the mean obtained.
where
h is the variation around the obtained mean,
t is the standard deviation of the mean,
n is the number of observations, and
s is the standard deviation. The sample size required to ensure adequate statistical reliability is obtained from Equation (3).
where
Z is the confidence level,
p is the expected proportion, and E is the margin of error.
In the design of the experiments, the behavior of waiting times with a reduction in the arrival rate was determined. Patients who did not require a specialized consultation were excluded according to a classification made by a group of specialist physicians.
3. Results
Figure 4 shows the status of the waiting lists. The horizontal axis represents the specialties, the left vertical axis represents the number of patients waiting, and the right vertical axis represents the average wait time in months. Ophthalmology, orthopedics, otorhinolaryngology, and urology are the specialties with the longest wait times, accounting for 74% of the total patient population.
Ophthalmology has an average wait time of 24 months. Most cataract patients are between 48 and 95 years old, and their vision deteriorates progressively during the waiting period [
33,
34].
In orthopedics, the wait times are 34 months, with conditions such as lower back pain, shoulder pain, ligament tears, and trauma from traffic accidents. Many of these patients arrive at secondary care without any established treatment, such as postural hygiene treatments, shoulder exercises, and nonsteroidal anti-inflammatory drugs, treatments that the general practitioner can provide at the primary care level [
35].
Otorhinolaryngology (ENT) treatment lasts 27 months. Patients were referred to an initial consultation with the specialist. Finally, patients referred to urology wait an average of 21 months.
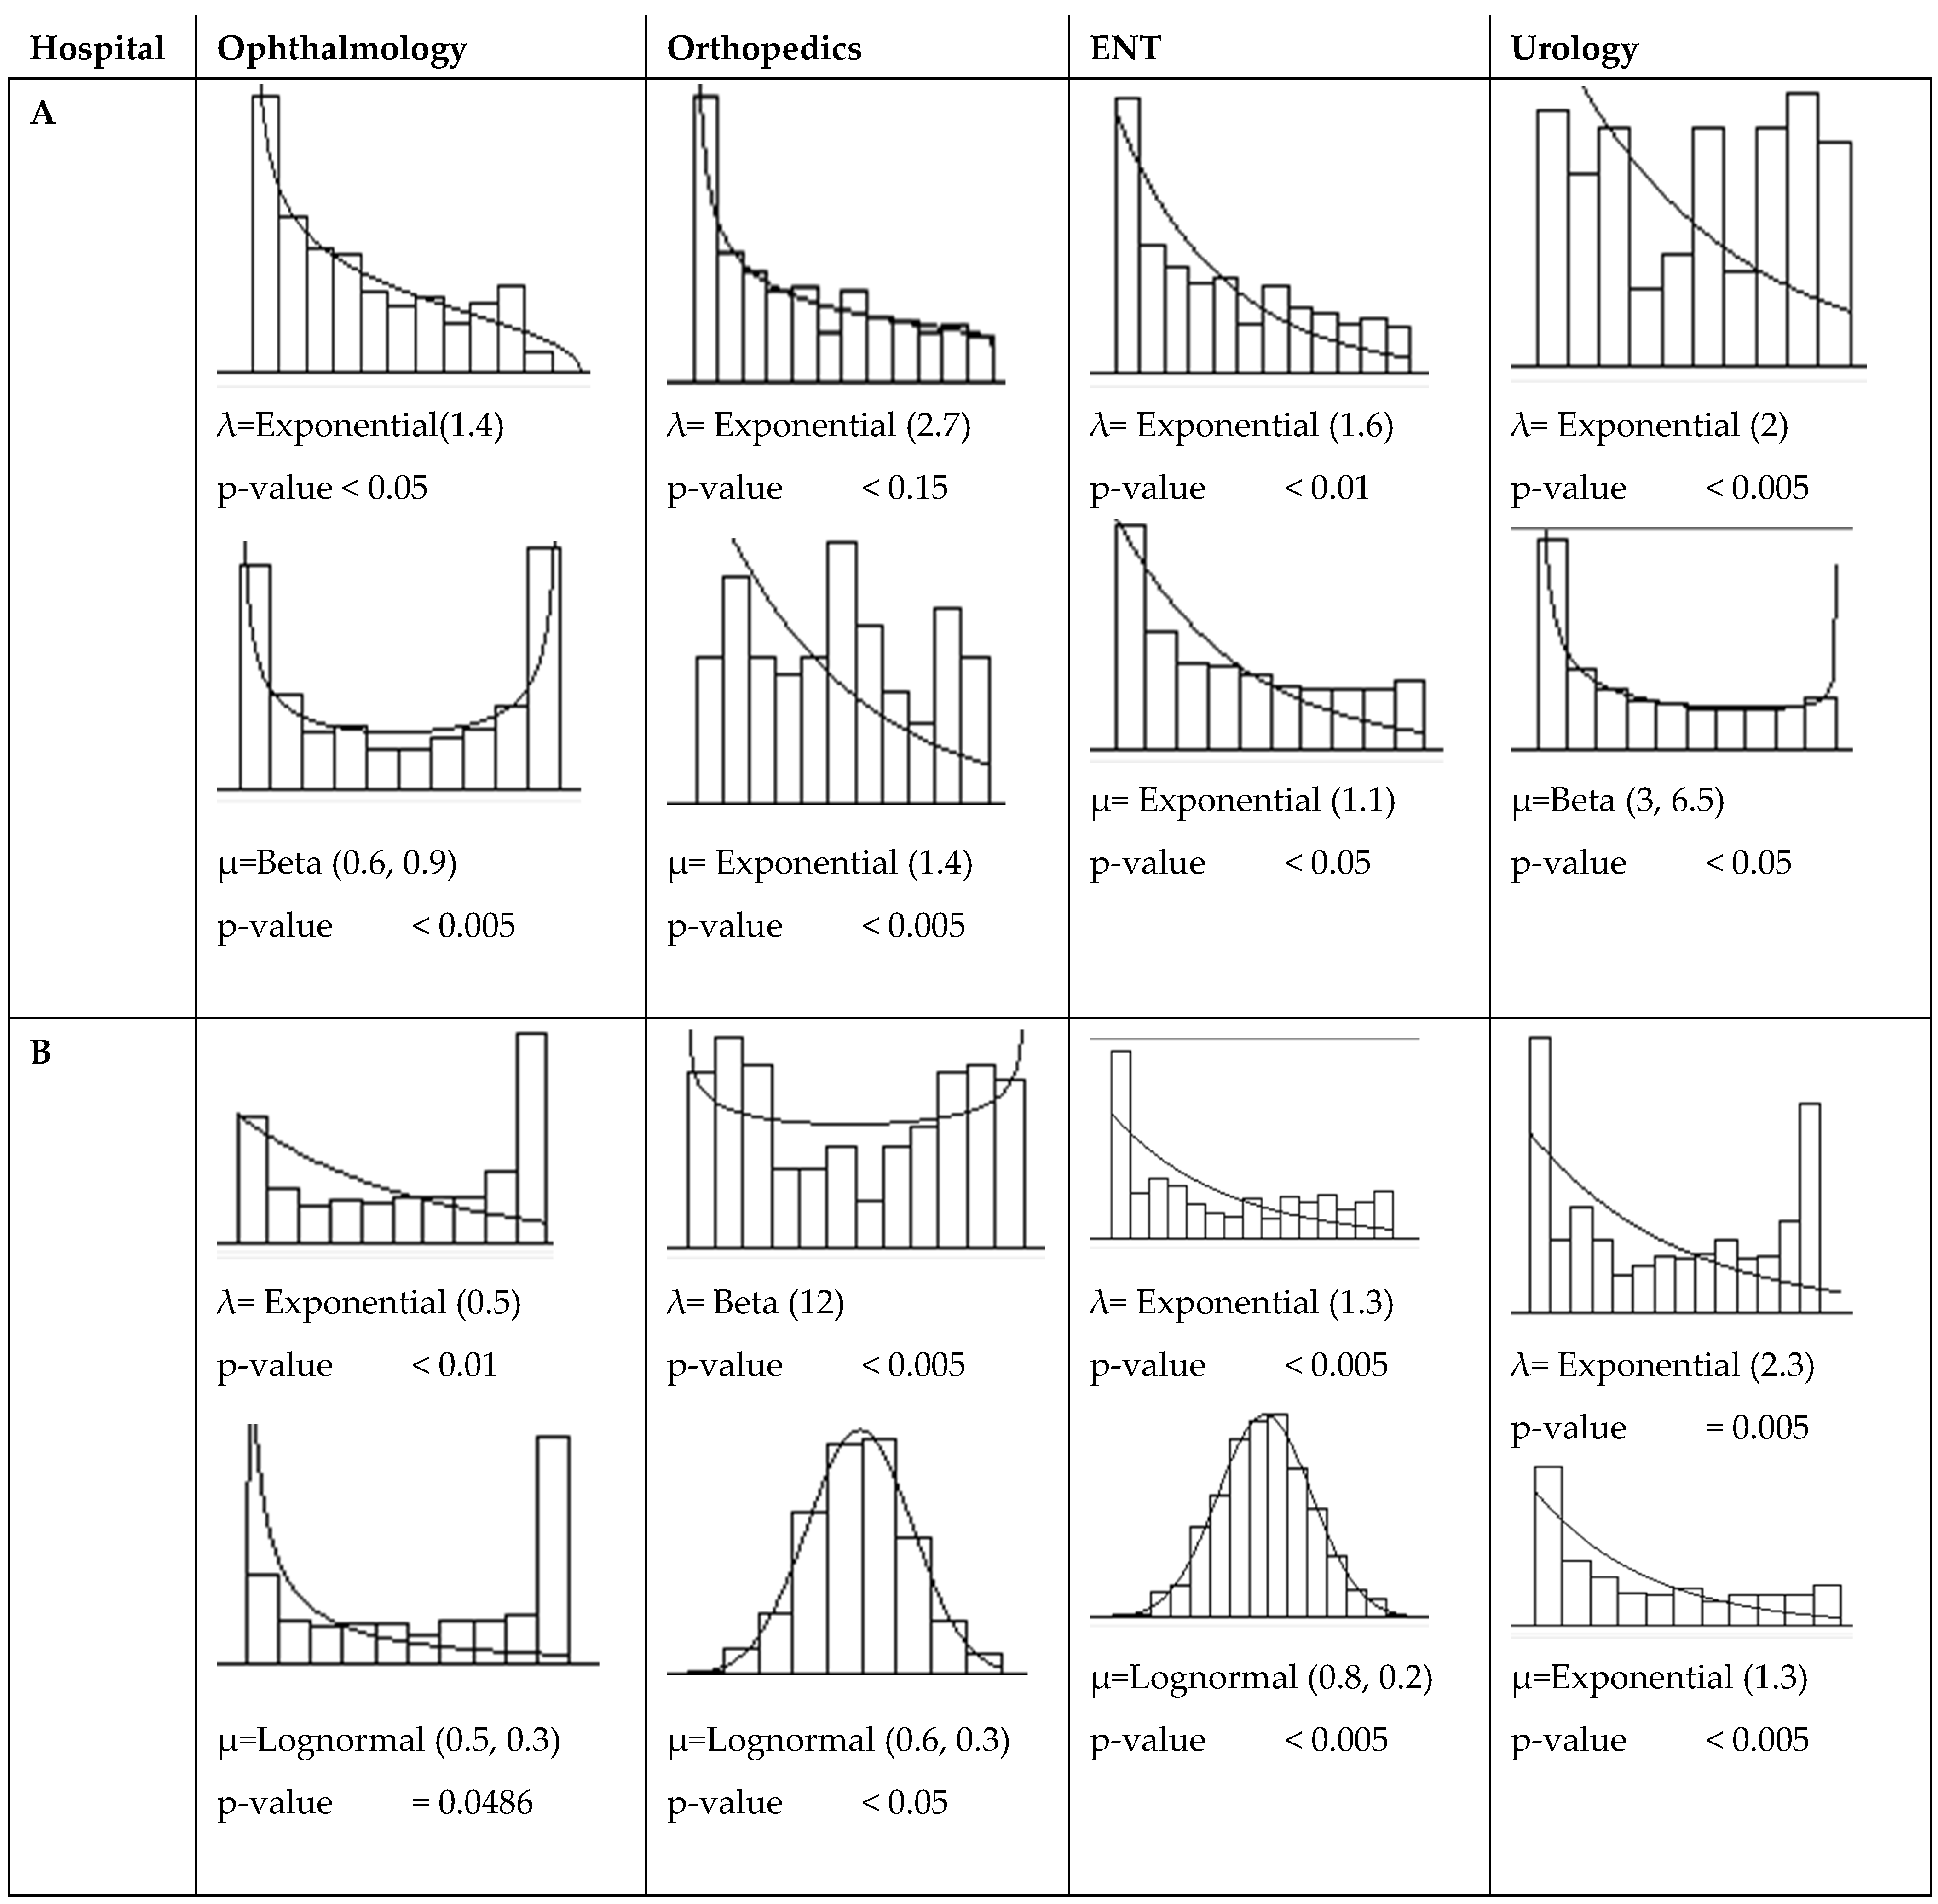
Once the specialties to be studied have been selected,
Figure 5 defines the input and output statistics for each system, according to the values supplied by the hospitals [
28].
The objective of the simulation is to use a computer to represent Costa Rica’s public health system and analyze trends in average patient wait times based on the experiments that will be implemented later.
The data for the simulation was collected over six months. It was necessary to know how many patients requested specialized consultations (arrival rate), how many were seen during that period (service rate), and the number of patients in the queue for each specialty studied.
The independent variables are the average arrival rate (λ), patients arriving to request a consultation per unit of time, and the average service rate (μ), or clients served per unit of time. The relevant dependent variables for patients are waiting time and the number in the queue. The queue discipline is FIFO (first in, first out), and the simulation time was one year. The simulated queue model is a current replica; the innovative aspect is the change in the number of patients in the queue and the waiting time by performing better triage at the first level of care.
Each data set was analyzed using Arena’s Input Analyser tool to identify the best-fitting probability distribution. Input Analyser provides the Kolmogorov–Smirnov test as a goodness-of-fit criterion for comparing the empirical distribution of the data with theoretical probability distributions.
The Input Analyser allows you to identify the best-fit curve and the corresponding
p-value for a Kolmogorov–Smirnov test. At least 95% confidence and a 5% error were obtained in all cases for the selected probability distribution.
Figure 5 shows the best-fit curves for arrival rate (λ) and service rate (μ) for hospitals A and B. Hospitals B and C also have their own fit curves for λ and μ in each specialty.
Figure 5 includes beta and lognormal functions. The beta distribution can represent a wide range of real-world scenarios, replacing other distributions that might be expected to describe a process. Furthermore, the beta distribution typically provides a superior fit when applying goodness-of-fit tests, such as the Kolmogorov–Smirnov test, to empirical service time data. Similarly, the lognormal distribution offers a robust alternative for modeling service times in real-world systems.
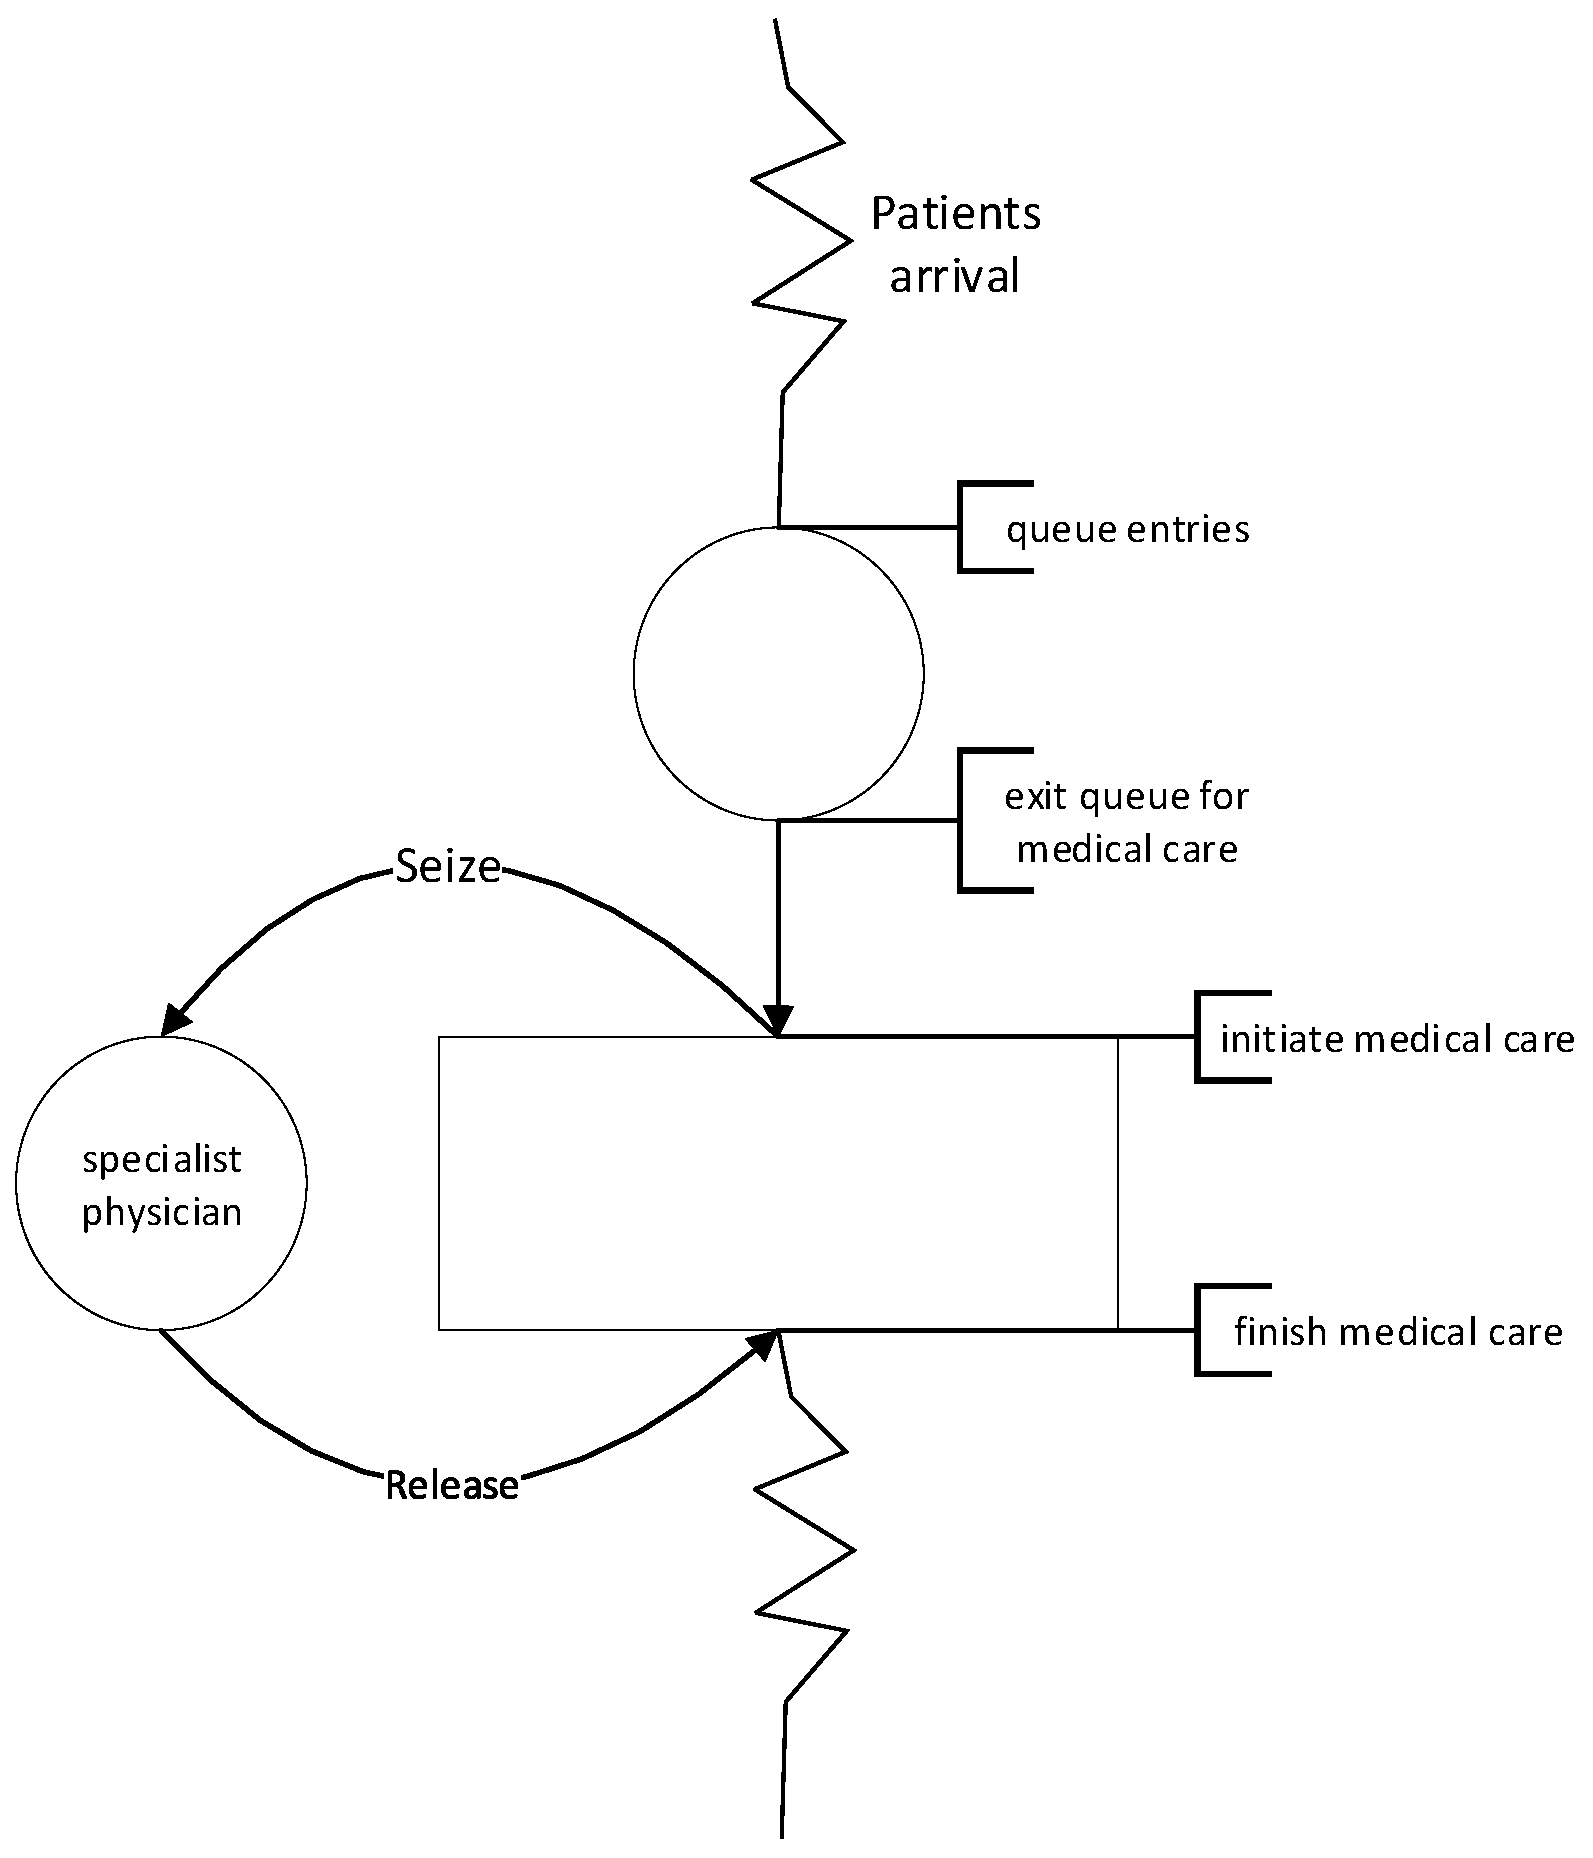
The diagram in
Appendix A represents the patient flow in a simulated healthcare system. Patients arrive and line up for medical care. When a specialist physician becomes available, the patient is seen and leaves the system. The physician becomes available for the next medical care.
Figure 6 shows the percentage variations in simulated wait times compared to actual reports, a calculation used to validate the model, with acceptance limits of ±10%.
As can be seen, not all constructed models follow the behavior of actual queues and wait times. The experiments of the urology systems could not be modeled reliably due to the data limitations of Hospitals B and C.
Some effective interventions to reduce and maintain wait times in specialized outpatient clinics include better referral management, open access strategies, and staff allocation [
36].
Aligned with the first strategy mentioned above, this study analyzes medical referrals, using expert judgment, to classify patients into two groups. The first group is those who truly required the specialized care for which they were referred. In contrast, the second group is patients whose conditions can be resolved with a general practitioner consultation.
Working groups of medical specialists conducted a pre-sampling, and referrals for each specialty were analysed to determine whether the patient needed to reach Level II of care or if their health problem could have been resolved at Level I. The results indicated that approximately 20% of the referrals were unnecessary and that the health problem could have been resolved at Level I.
Selecting a confidence level of 95%, an expert proportion of 20%, and a margin of error of 5%, it was determined that the sample size should be 245 observations to ensure adequate statistical reliability.
Table 1 includes 350 records. For ophthalmology, the referred patients who required a specialist consultation are 91% in Hospital A, 75% in Hospital B, 80% in Hospital C, and 88% in Hospital D. Orthopedics presented the most incredible opportunity to reduce unnecessary referrals. In Hospital B, 70% of orthopedic referrals required specialist care, followed by 83% in Hospital A, 69% in Hospital C, and 88% in Hospital D.
In otorhinolaryngology, the proportion of required referrals is 58% in Hospital C, 70% in Hospital B, and 83% in Hospital A. Overall, 71% of referrals from all specialties are required for specialist consultation. In urology, 78% of cases in Hospital B, 92% in Hospital D, and 97% in Hospital A were also identified as eligible for Level II care.
Using probability curves, the percentages were represented to simulate the arrival rate, considering only patients who require specialist consultation, and to compare the current system with the proposed one.
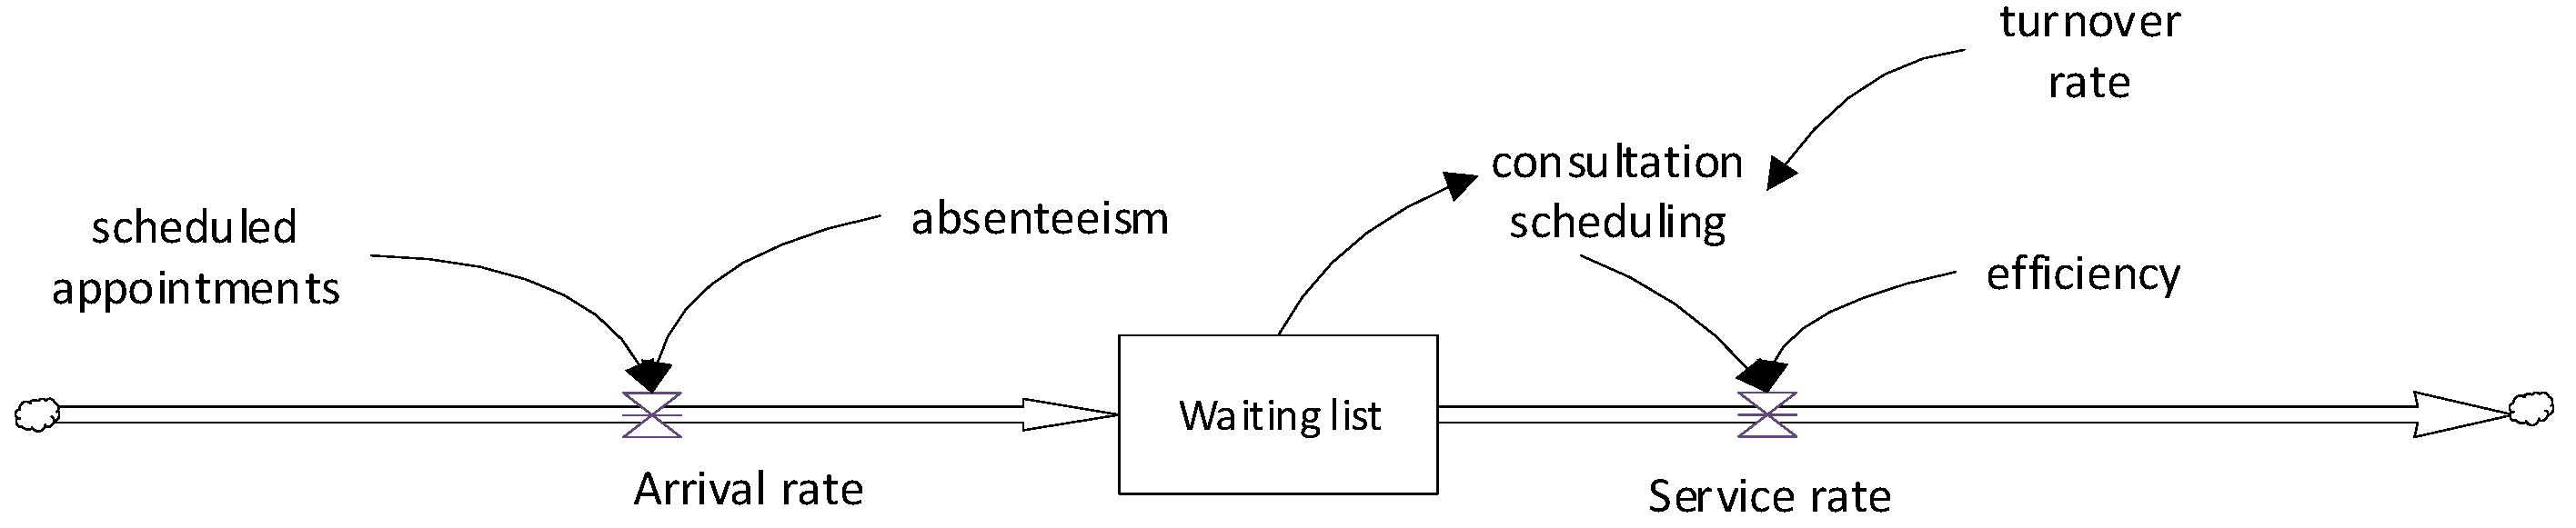
Figure 7 illustrates a conceptual model of the current patient referral process. It consists of three main components: patient arrival, the waiting list, and the provision of specialized care.
Patients enter the system from the left, representing those referred from primary care. These arrivals are affected by consultation demand and patient absenteeism. They then encounter a queuing system, symbolized as a waiting list, where they wait until their assigned appointment. After this waiting time, patients receive a specialized consultation. The number of consultations is limited to an established schedule, and the specialist’s efficiency measures adherence to this schedule. This model represents a FIFO queuing structure, where patients are seen in the order that they are added to the list.
The appointment schedule is the scheduling of patients by day and time. It is worth noting that the number of scheduled patients exceeds the daily capacity, anticipating no-shows. These patient overcharges are handled by administrative staff based on their expertise. No-shows refer to patients who do not show up on the day and time of the appointment.
Consultation scheduling refers to the allocation of physician hours dedicated to specialized outpatient care. It is important to note that these professionals are often responsible for performing multiple clinical functions. Efficiency is the number of patients seen divided by the standard capacity. All values are stochastic, based on historical records, which provide the sensitivity of the probability distribution curves.
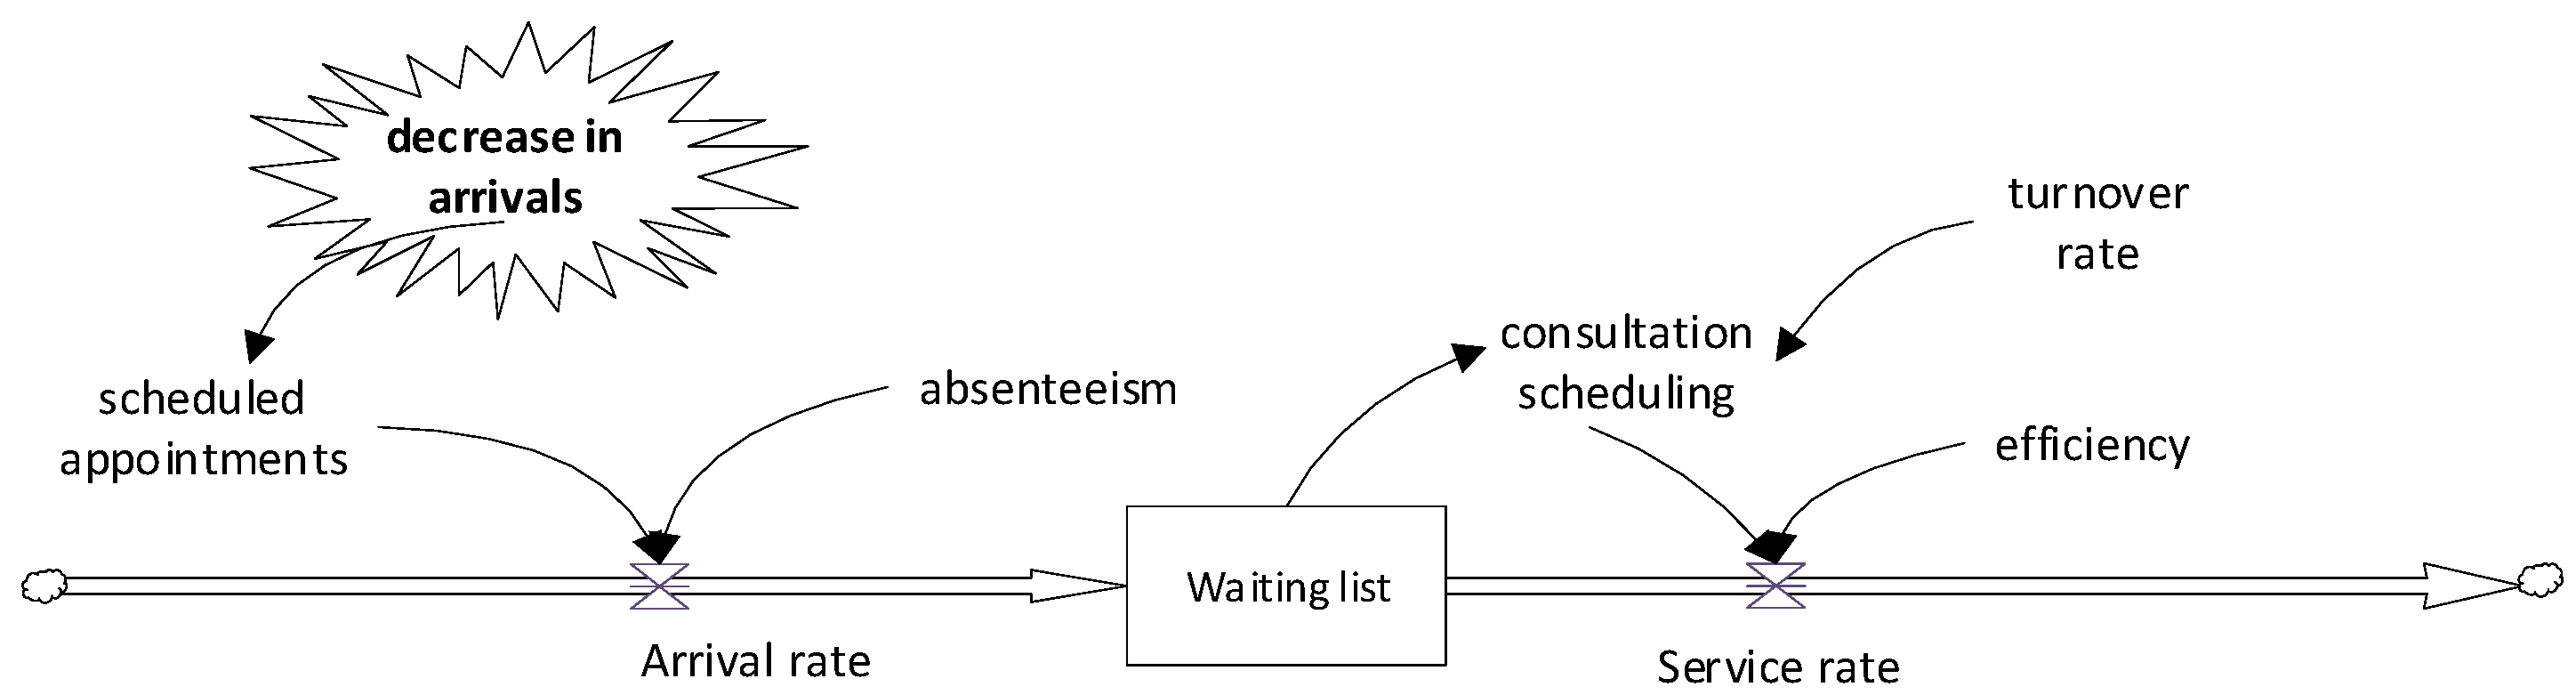
In
Figure 8, patients also enter the system through scheduled appointments, but in this case, the key element, the decrease in arrivals, is incorporated.
Figure 9 illustrates the average waiting times in days for a specialty consultation under current conditions. The line chart displays the average waiting time in days over 24 months for the medical specialties, with each specialty represented by a different line and marker style.
Ophthalmology shows the highest waiting times, between 450 and 540 days, with no apparent signs of improvement. Orthopedics shows moderate waiting times at the beginning of the period, with a gradual downward trend, decreasing to approximately 400 days. Otorhinolaryngology maintains relatively stable waiting times, with occasional fluctuations between 380 and 420 days. Urology presents the lowest and most stable waiting times, between 230 and 300 days throughout the observation period. Overall, the waiting times remain high for all specialties.
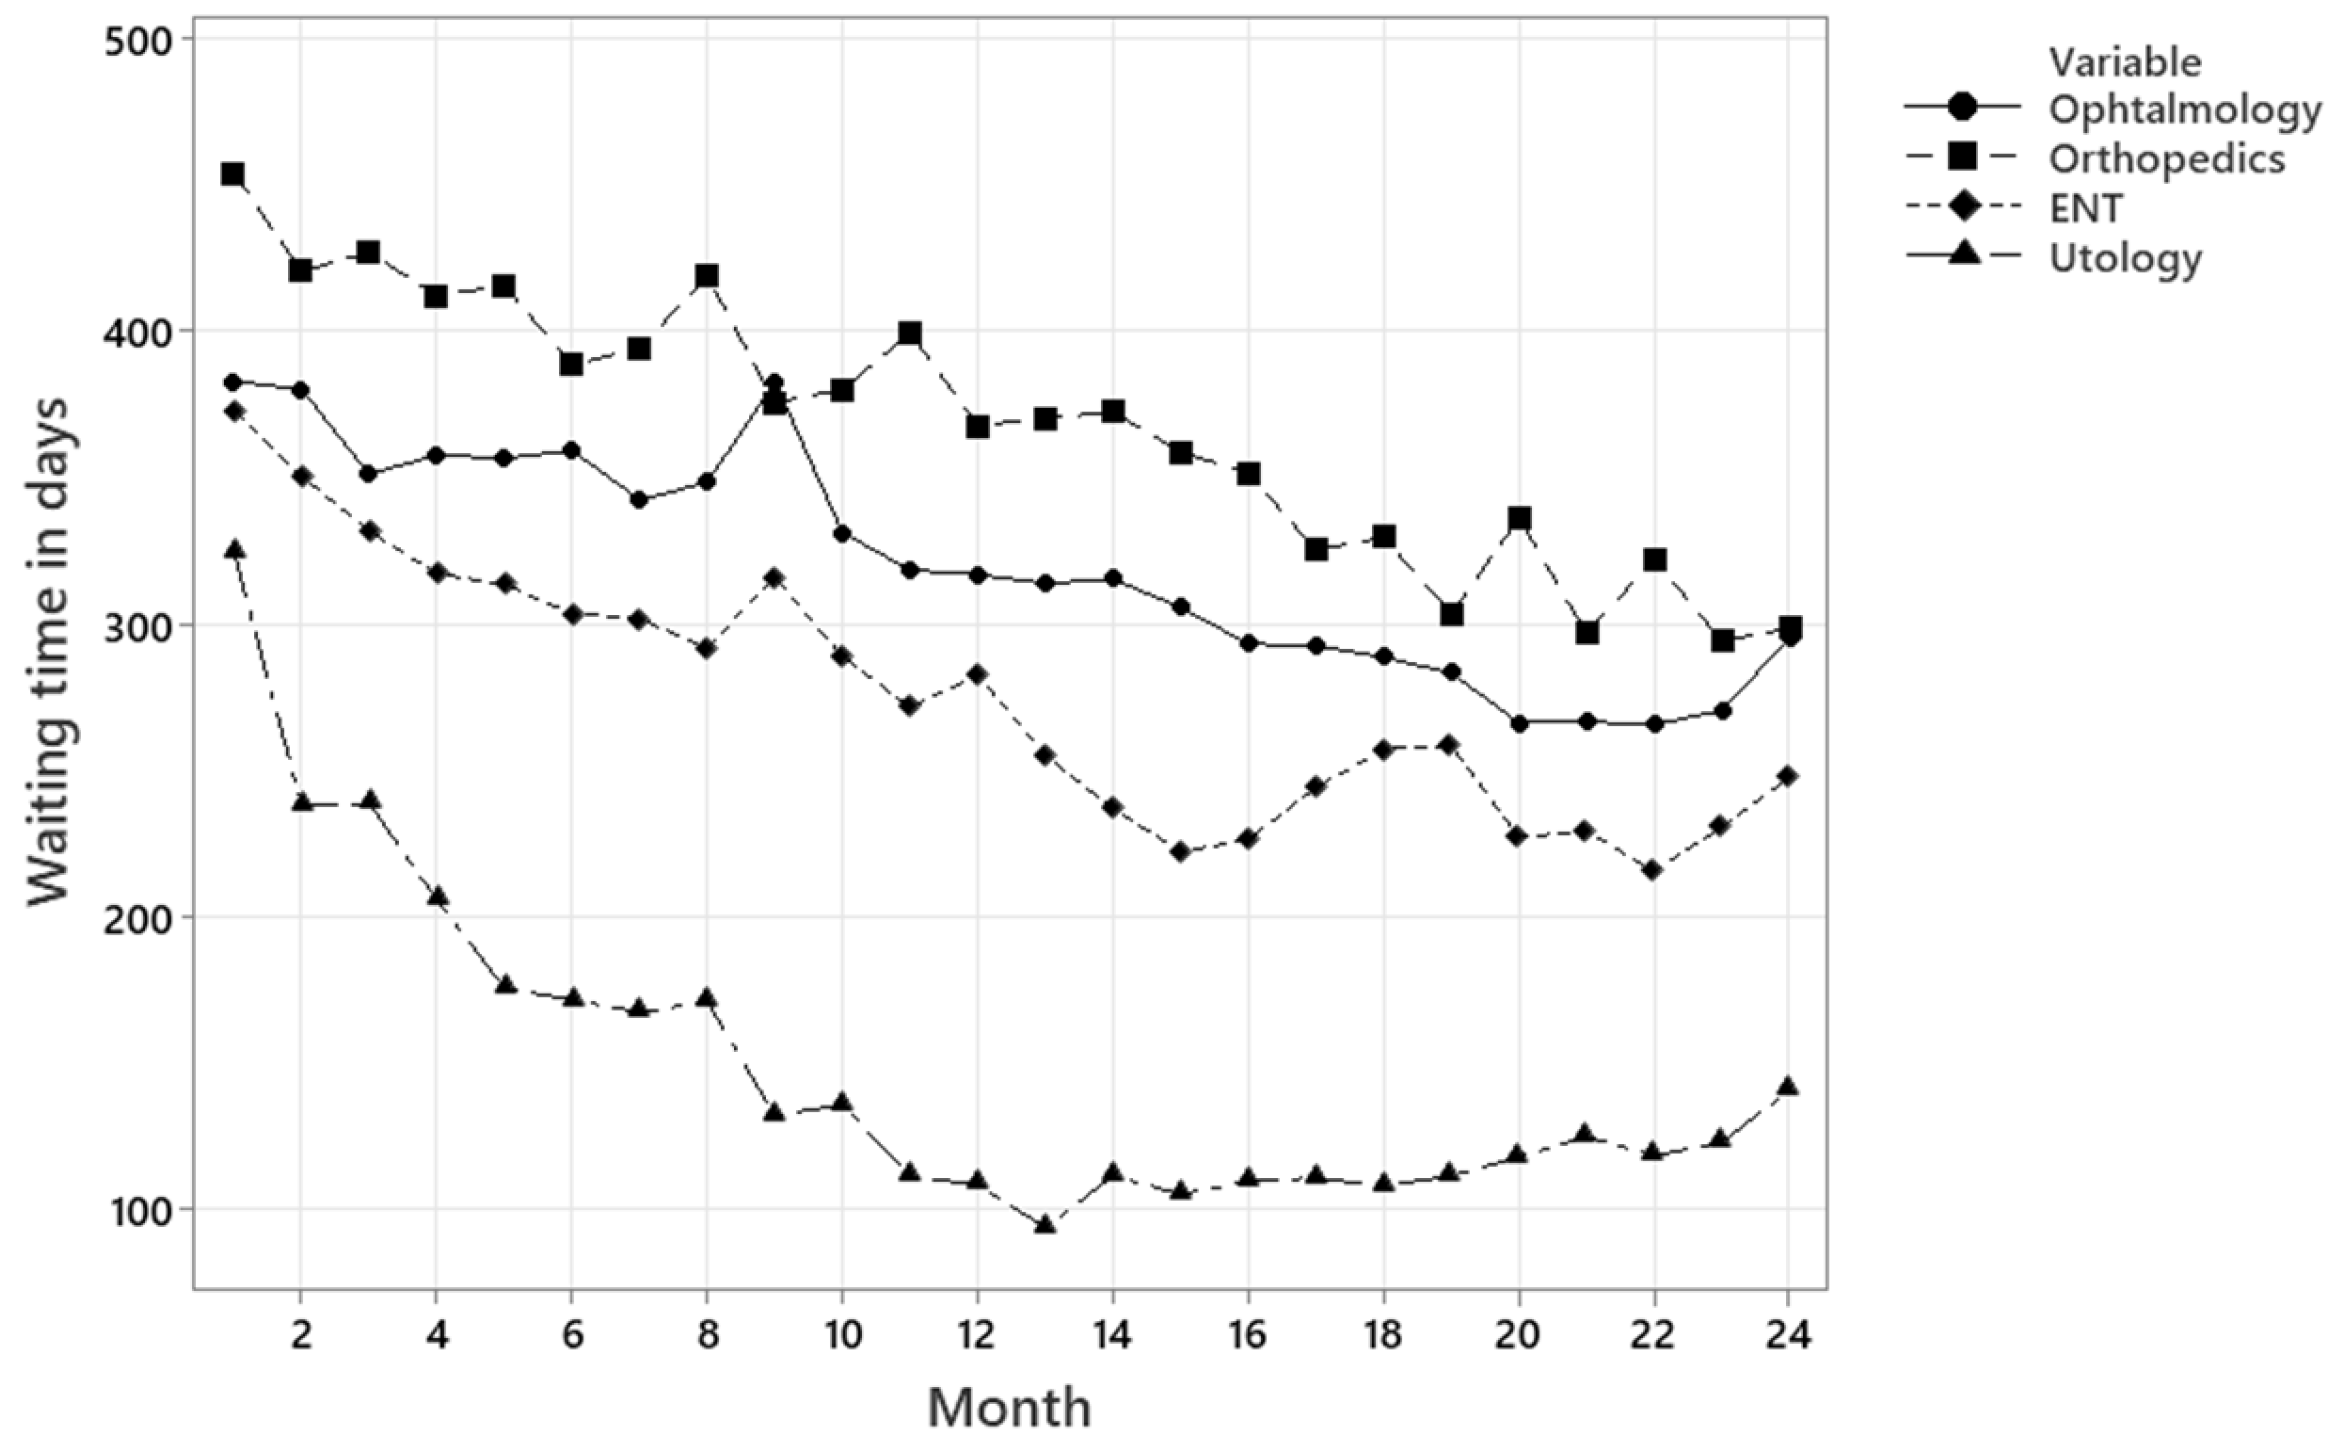
Figure 10 represents the trends in waiting times for the proposed system, measured over 24 months. The data suggests a significant improvement in wait times for all specialties compared to the baseline scenario. Ophthalmology, which initially showed values close to 380 days, experienced a gradual and sustained decline, stabilizing at around 300 days at the end of the period. Orthopedics followed a similar trend, falling from over 420 days to less than 300 days, with some variability along the timeline. Otorhinolaryngology showed a clear downward trend, decreasing from 370 days to 250 days, with moderate fluctuations. Urology demonstrated the most substantial reduction, falling from 350 days at the beginning to 100 days after the first year, where it remained stable. These results indicate that the proposed system effectively reduces waiting times in all four specialties, with the most pronounced impact observed for urology and otorhinolaryngology.
To validate the data in
Figure 9 and
Figure 10, the Kolmogorov–Smirnov (K–S) goodness-of-fit test was applied for each medical specialty. The test statistic was 0.0814 for both ophthalmology and orthopedics, indicating a good level of confidence in the data, namely 0.109 for otorhinolaryngology (ENT) with an acceptable fit, and 0.19 for urology, which is a marginal but statistically acceptable result. These values confirm that the results are statistically valid for simulation purposes.
4. Discussion
This study suggests that it is possible to reduce waiting time in a sustained manner without increasing the installed capacity for care, achieving timely care and improving the country’s health situation. If we consider that the proposal does not mean expanding the supply of resources, such as specialist physicians and support personnel, the research results are of great benefit. This methodology can be replicated in other specialties within the healthcare system. The article presents the developed model and its formulation.
To reduce waiting times, changes are required: the promotion of telemedicine, a greater variety of medications available at the first level, and the implementation of referral protocols are the main ones. Telemedicine would allow the exchange of information for the diagnosis, treatment, and prevention of diseases and injuries, and for continuing health education [
37].
In Latin America, the main challenges hospitals face in adopting telemedicine include issues related to technological infrastructure, staff training, and existing regulations. Resistance to change and a lack of clear policies supporting its practical implementation are also significant barriers [
38].
Approximately 75% of medical consultations result in at least one prescription, highlighting pharmacotherapy as the most common therapeutic intervention in modern medical practice. However, some conditions that a general practitioner could treat are referred to a specialist due to the limited medication list in primary care clinics.
This strategy risks inappropriate use, resulting from factors such as excessive pharmaceutical promotion, cognitive errors, prescribers’ lack of awareness of costs, or simple omissions. To mitigate these risks, it is essential to implement institutional strategies such as continuing education programs, clinical audits, evidence-based prescribing policies, and real-time reminders during the prescription process.
For the implementation of patient referral protocols to the second level [
37], protocols provide physicians with health care recommendations based on valid and up-to-date empirical evidence. In this way, guidelines facilitate the dissemination of high-standard practices that would otherwise have much less impact [
39]. Furthermore, it has been shown that adherence to guidelines and protocols can reduce healthcare costs by up to 25% [
2]. In medicine, as well as in all specialties, the use of mobile applications for professional development has grown [
40]. This may be a good option to implement them [
41].
To expand this research, the study could extend to other specialties or other hospitals in larger environments to generate more evidence.
One of the limitations of this research is the sample size in
Table 1, which could have a bias. This can be seen in the variation of percentages between hospitals for the same specialty. Another limitation is related to the list of changes. The changes mentioned were prioritised, but others can be added, such as more medical equipment in the first level and standardized infrastructure. Finally, another possible limitation would be the considerations taken in developing the FIFO model. To mitigate this limitation, future work could assess how the considerations taken affect the variability of the results.
5. Conclusions
The analysis conducted by specialist physicians showed that a significant proportion of patients on waiting lists for specialist consultations could be effectively treated at the primary care level, without compromising the quality of medical care.
Up to 29% of the medical referrals analyzed were unnecessary and could have been resolved at the primary care level. The specialty of orthopedics presented the most significant opportunity for improvement, with up to 31% of referrals avoidable.
The proposed model shows that a 22% decrease in the average referral rate generated substantial reductions in waiting times, without requiring additional resources, such as more specialists or overtime.
Under the proposed system, the waiting times decreased steadily across all specialties over 24 months. Ophthalmology and orthopedics reduced their waiting times to less than 300 days. Otorhinolaryngology decreased from 370 to 250 days, and urology showed the most significant improvement, decreasing from 350 to 100 days in the first year and remaining stable. This evidence transforms the traditional paradigm of increasing capacity as the only solution to the waiting list problem and positions improving the referral process as an alternative.
The results show the urgency of redesigning referral protocols from the first level, integrating technological tools to support general practitioners. Improving the availability of essential medications and standardizing the referral criteria are necessary actions.
Furthermore, the estimated economic savings of USD 264,000 annually for just four specialties highlight the financial potential. The budgets of the hospitals in this study total approximately USD 440 million. The savings from the proposal represent less than 1% of the amount allocated for their operations. However, other specialties with waiting lists would also generate savings. The CCSS had revenues of EUR 12 billion in 2024, of which EUR 7.3 billion corresponds to the health section, which is used for patient care in clinics and hospitals.
In summary, this study validates a technical simulation model and provides evidence of the benefits of the proposed system. Extrapolating this methodology to other specialties and hospitals could generate a systemic healthcare transformation toward equity, efficiency, and sustainability.


 and
and 


