Article

Determination of the Activation Energy of the Thermal Isomerization of Oleic Acid with Raman Spectroscopy and Partial Least Squares Regression

Department of Chemical Biology and Applied Chemistry, College of Engineering, Nihon University, Koriyama 963-8642, Japan
*
Author to whom correspondence should be addressed.
Spectrosc. J. 2025, 3(2), 17; https://doi.org/10.3390/spectroscj3020017
Submission received: 28 February 2025 / Revised: 5 April 2025 / Accepted: 6 May 2025 / Published: 8 May 2025
(This article belongs to the Special Issue Feature Papers in Spectroscopy Journal)

Abstract

:
Unsaturated fatty acids have cis and trans isomers. The naturally stable isomer is the cis isomer, which is changed to the trans isomer by a thermal reaction. The reaction order, reaction constant, and activation energy are required to confirm the reaction mechanism. Therefore, the concentrations of the cis and trans isomers must be determined simultaneously. In the present study, oleic acid (cis isomer) and elaidic acid (trans isomer) were measured using Raman spectroscopy and partial least squares regression. The thermal reaction of oleic acid was performed at several temperatures. The reaction was determined as a first-order reaction. The reaction rate constants at several temperatures were determined as 1.3 × 10⁻³ to 5.2 × 10⁻³/h at 100 °C to 160 °C by plotting the logarithm of the oleic acid concentration against reaction time. The activation energy obtained by the Arrhenius plot was 31 kJ/mol.

1. Introduction

Fatty acids are hydrocarbons with carboxyl groups and are one of the three major nutrients. Because fatty acids are an energy source for humans and a chemical precursor for cell membranes, we acquire them from many foods. Fatty acids can be saturated or unsaturated. Unsaturated fatty acids consist of cis and trans isomers, which are geometric isomers in which the hydrogens connected to the carbon double bond are located on the same side in the cis isomer and on the opposite side in the trans isomer. Although the trans isomer of a natural fatty acid is more stable than the cis isomer, the cis fatty acid is present naturally [1,2,3]. A small amount of the trans isomer can be produced while making a solid oil from the cis fatty acid; for example, in margarine and shortening [4,5]. However, trans fatty acids harm humans by increasing bad cholesterol and decreasing good cholesterol [6,7], eventually causing several adult diseases, such as arterial sclerosis, cardiac infarct, and brain infarct [8,9,10]. Therefore, the WHO (World Health Organization) recommends that trans fats should be less than 1% of the total energy consumed [11,12]. Thus, measuring trans fatty acids is vital. The thermal isomerization of oleic acid to elaidic acid is shown in Scheme 1.
Gas chromatography (GC) has been used to determine fatty acid concentrations because it can detect and quantify fatty acids with high sensitivity [13,14,15]. However, methyl esterification is often required to increase the vapor pressure of the fatty acids, and thus GC requires additional work and is time consuming. Furthermore, the temperature must be increased to achieve a high vapor pressure in GC, causing an equilibrium change and the establishment of a new equilibrium, as the equilibrium constant at a given temperature cannot be directly obtained. Therefore, the temperature should be kept constant during separation to determine the equilibrium constant at a specific temperature.
Spectroscopy can be used to investigate the chemical equilibrium. IR spectroscopy, which is a vibrational spectroscopy technique, has been used for quantitative analysis and confirming reaction mechanisms [16,17,18]. Because molecules have unique IR spectra, this technique is used for qualitative analysis. However, the absorption of a specific vibration can indicate the molecule’s concentration according to the Beer–Lambert law, and thus IR spectroscopy can also be used for quantitative analysis. Unsaturated fatty acids have been quantified by IR spectroscopy [19,20]. Although the IR spectra of oleic and elaidic acids are similar, the peak at 966 cm−1 only appears in the IR spectrum of elaidic acid, and the absorbance at 966 cm−1 has been used for quantification [21,22]. However, because the other peaks of elaidic and oleic acids are identical, oleic acid cannot be quantified simultaneously using IR spectroscopy. In Raman spectroscopy, the vibrational levels for the double bond differ slightly, where oleic and elaidic acids have peaks at 1656 and 1669 cm−1, respectively [23,24,25,26]. Therefore, we used Raman spectroscopy in the present study because it can simultaneously determine the reaction rate at several temperatures and the activation energy of the thermal isomerization of oleic acid.
In the present study, the activation energy of the isomerization reaction of oleic acid was determined by Raman spectroscopy. First, the quantitative method with Raman and PLS regression was improved to refine the determination quality. Then, the reaction order and rate constants at several temperatures were determined by using the oleic acid concentrations obtained by PLS regression. Finally, the activation energy of the thermal isomerization of oleic acid to elaidic acid was obtained from the Arrhenius plot. To the best of our knowledge, this is the first time Raman spectroscopy has been used to determine the reaction rates at several temperatures and the activation energy of the thermal isomerization of oleic acid.

2. Materials and Methods

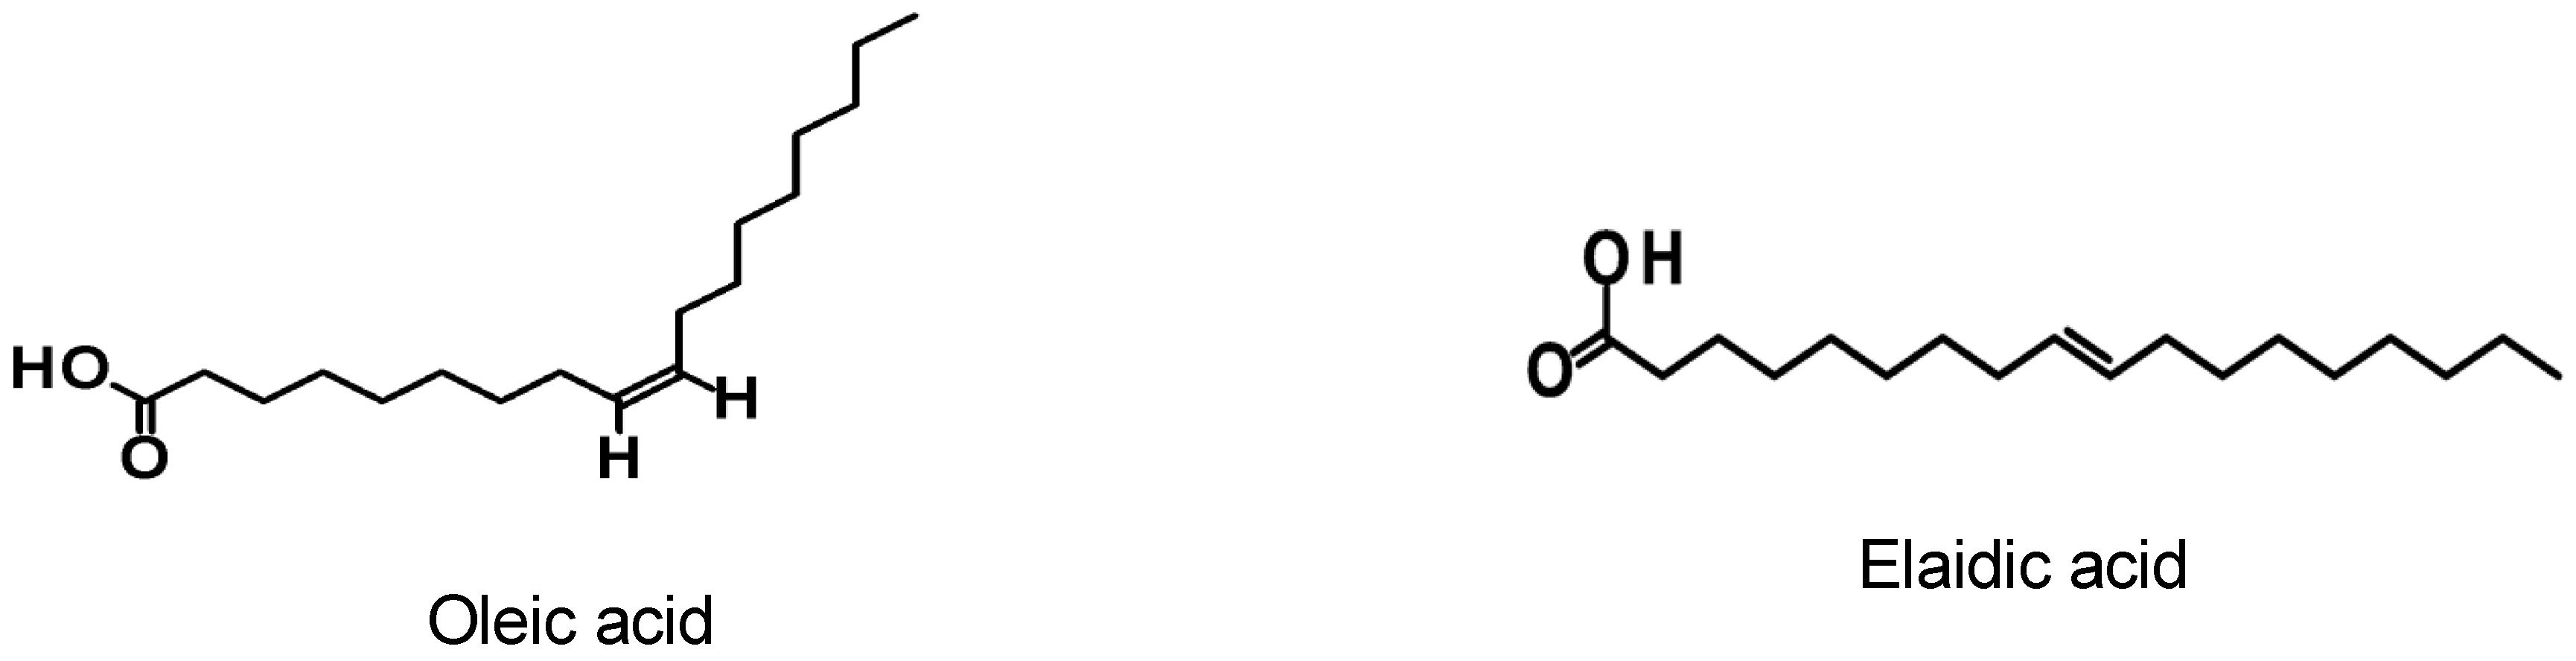
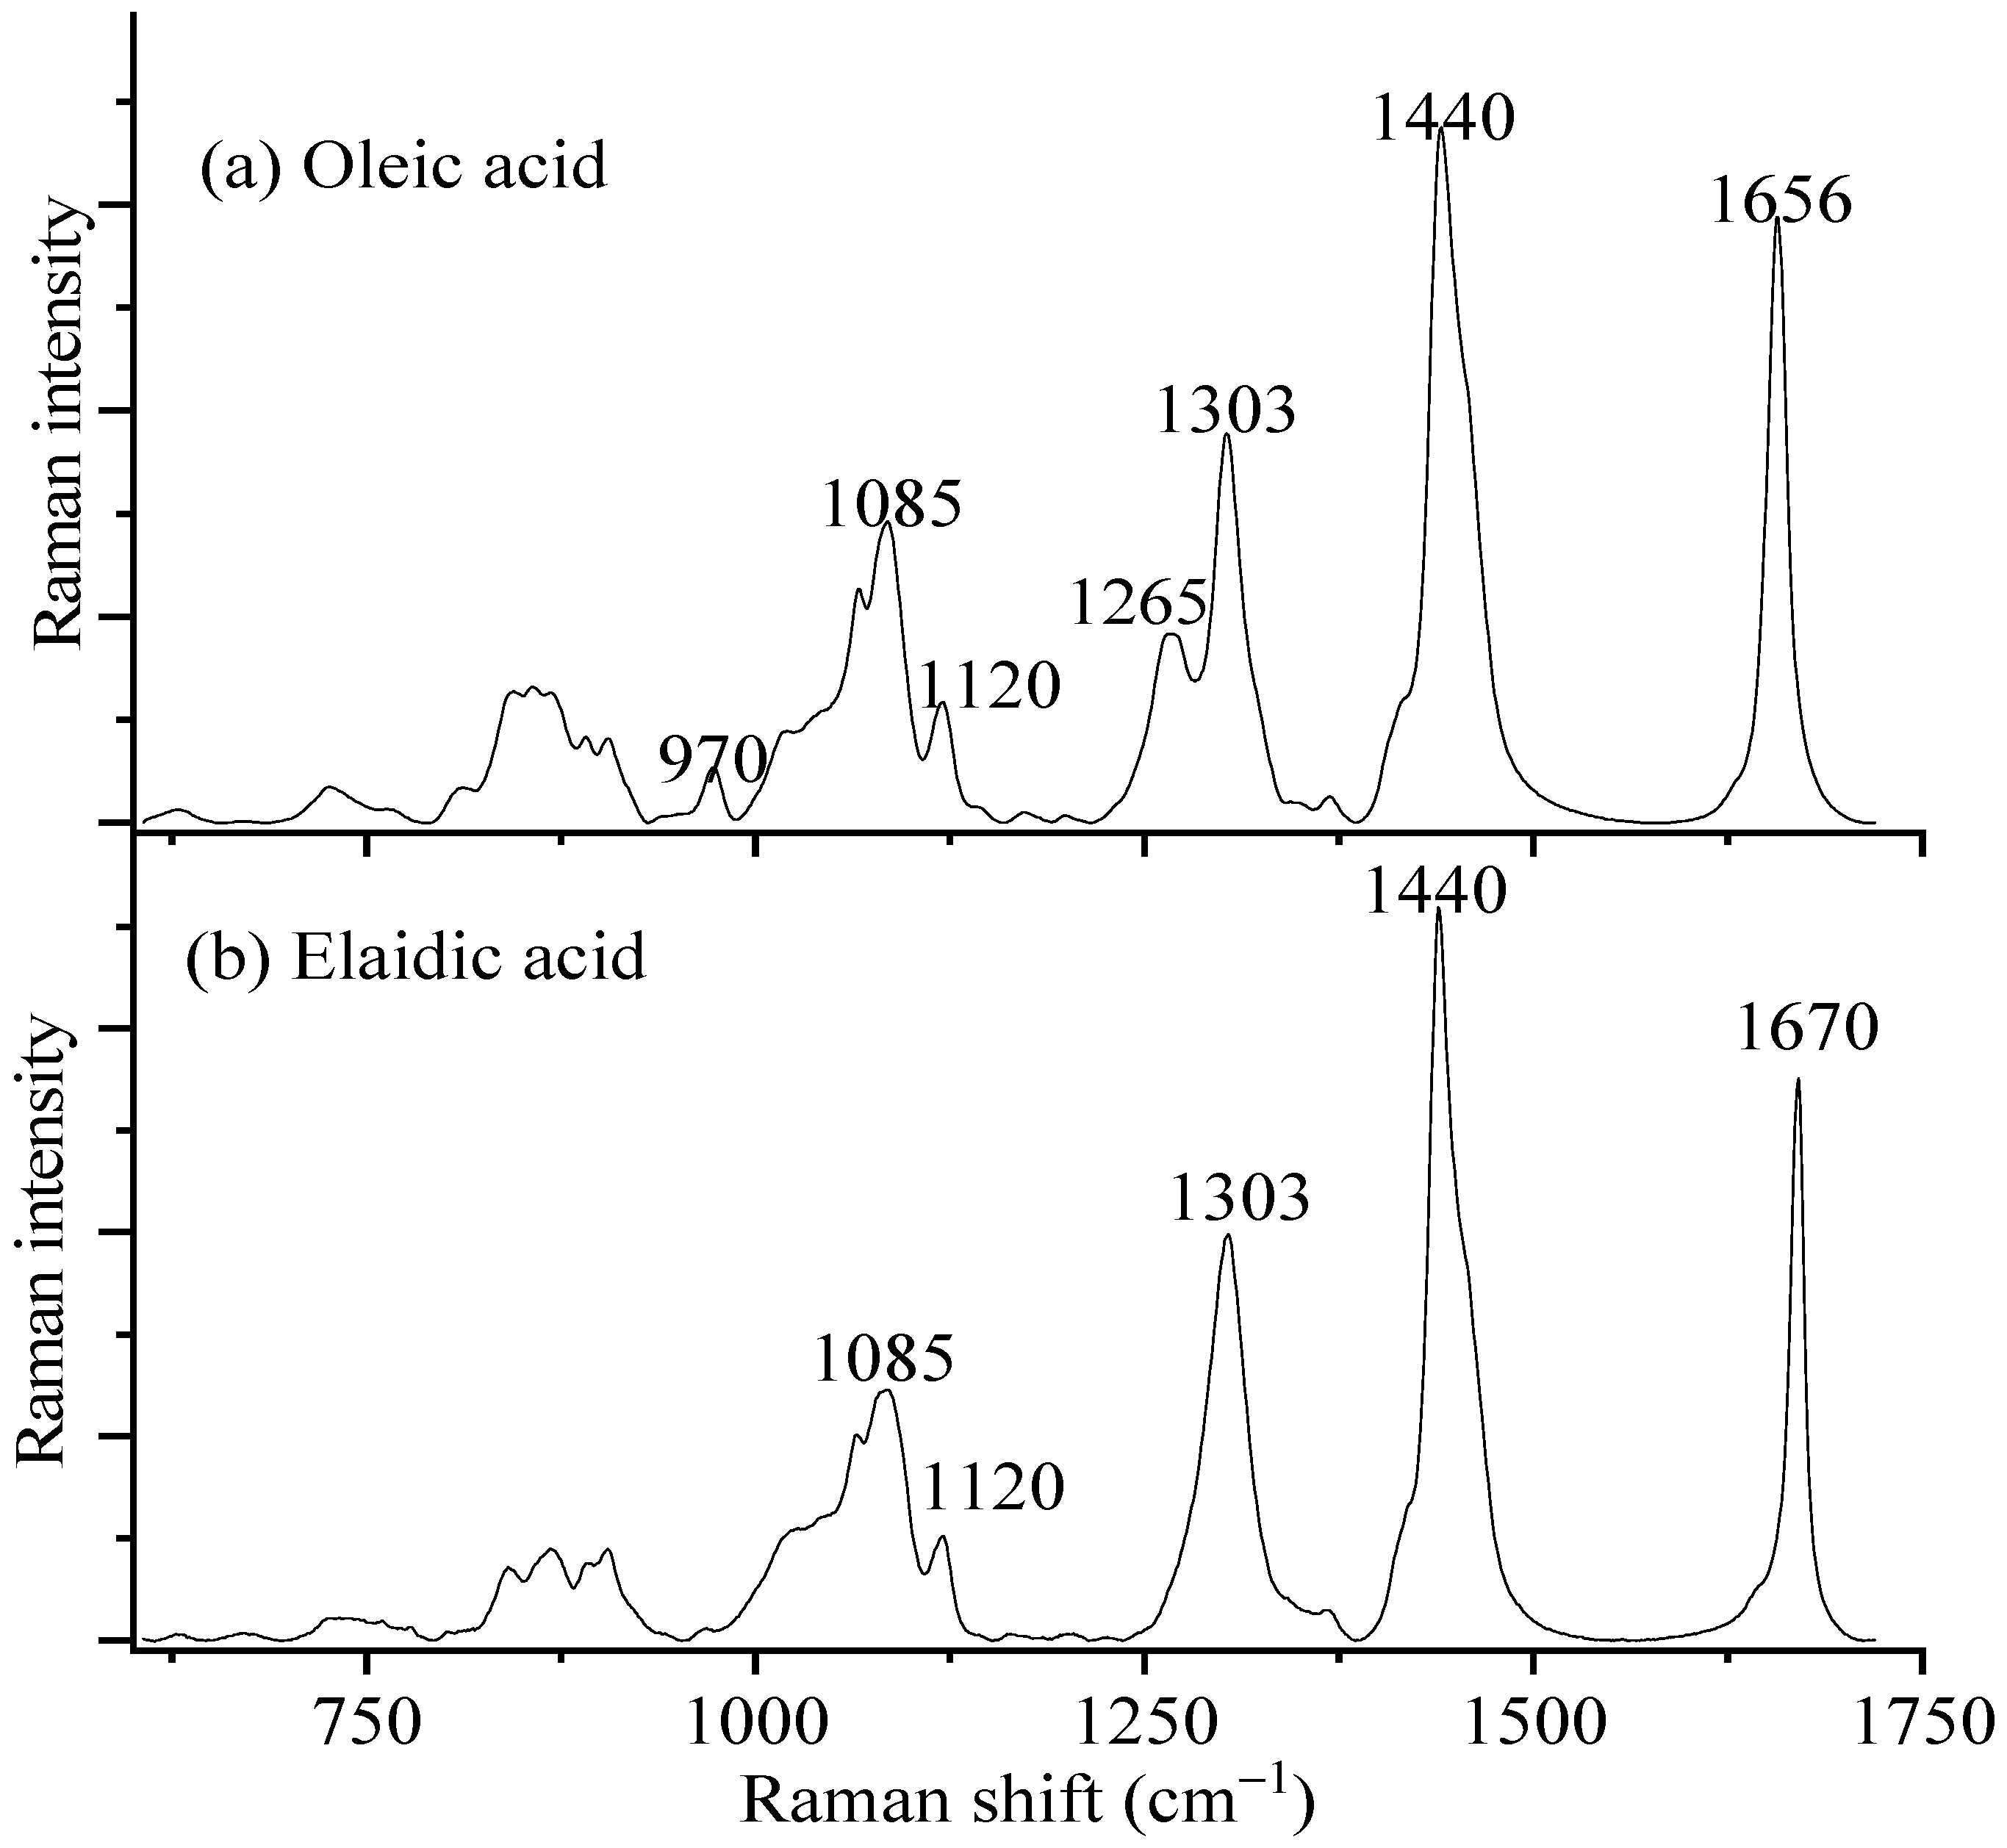
2.1. Raman Spectroscopy

A Raman microscope (In via, Renishaw, Wotton-under-Edge, UK) was used to measure the Raman spectra. A 785 nm semiconductor laser was focused with a ×50 lens to irradiate the oleic acid. The Rayleigh scattering was removed with a sharp cut filter, and the Raman scattering light was detected with a charge-coupled device (CCD) after being passed into a monochromator. The irradiation time was 1 s, and the Raman spectrum was obtained with an accumulation number of 80. The chloroform standard sample was measured simultaneously to correct variations in measuring conditions, such as laser power. The schematic measuring setup is shown in Supplementary Material Figure S1. The Raman intensity ratio between the sample and the standard was calculated.

2.2. Preparation of Mixed Solutions of Elaidic Acid and Analysis of the Raman Spectra

Oleic and elaidic acids were purchased from Tokyo Chemical Industry (Tokyo, Japan) and Sigma-Aldrich (St. Louis, MO, USA), respectively, and were used without further purification. Elaidic and oleic acid mixed solutions were prepared with mass fractions of oleic acid of 1.0, 0.9, 0.8, 0.7, 0.6, and 0.5. The mixed solutions were obtained by dissolving elaidic acid in oleic acid. The Raman spectra of these solutions were measured to establish the partial least squares (PLS) model using the Unscrambler X (CAMO, Oslo, Norway). The nonlinear iterative partial least squares (NIPALS) algorithm was used for PLS regression. The mass fractions of oleic and elaidic acids in the unknown samples were estimated using this model.

2.3. Thermal Isomerization of Oleic Acid

Oleic acid (1.0 g) was placed into bio-test tubes and heated with a dry thermo unit (DTU-1CN, TAITEC, Koshigaya, Japan). The heating was stopped every hour, and the heated sample was cooled in an ice bath to pause the reaction. The Raman spectra of the sample and the chloroform standard sample were measured simultaneously after cooling. The experiments were conducted at temperatures of 100 °C, 110 °C, 120 °C, 130 °C, 140 °C, 150 °C, and 160 °C. The mole fractions of oleic and elaidic acids were estimated using the PLS model obtained by the spectra of the known concentration samples. Because the isomerization reaction is a first-order reaction, a plot of the logarithm of the oleic acid concentration vs. reaction time gave a straight line. The slope of the straight line gave the constant reaction rate at the temperature. The Arrhenius plot of the logarithm of the reaction rate constants against the reciprocal of the temperature gave the activation energy of the thermal isomerization from the plot slope multiplied by the gas constant.

3. Results and Discussion

3.1. Prediction of the Fatty Acids Using PLS Regression

Figure 1 shows the Raman spectra of oleic (a) and elaidic (b) acids. The Raman spectrum of elaidic acid was measured at 48 °C, which was above the melting point (45 °C) of elaidic acid. The Raman spectrum of oleic acid resembled that of elaidic acid; both contained bands at 1085, 1220, 1303, and 1440 cm−1. The peaks that appeared only in the oleic acid spectrum were 970 and 1265 cm−1. The peaks at 1656 and 1670 cm−1 were assigned to the cis and trans C=C vibration. Table 1 shows the peak positions and their assignments.
A PLS regression model was constructed by measuring the Raman spectra of the oleic and elaidic mixtures at several concentrations. Figure 2 shows the Raman spectra of mixtures containing mass fractions of oleic acid of 1.0 (pure oleic acid), 0.90, 0.80, 0.70, 0.60, and 0.50 (corresponding mass fractions of elaidic acid: 0.0, 0.10, 0,20, 0.30, 0.40, and 0.50, respectively). The Raman spectra of the samples and the chloroform standard were measured simultaneously. The peak intensity at 667 cm−1 of chloroform was similar, indicating that the laser power of the incident light did not change while measuring the Raman spectra. Therefore, the Raman intensity change was due to the concentration of the cis or trans fatty acids. For example, around 1660 cm−1, the peak at 1656 cm−1 decreased as the elaidic acid mass fraction increased, whereas the peak at 1670 cm−1 increased. The peaks at 970 and 1265 cm−1 increased as the oleic acid mass fraction increased.
The Raman intensity depends on the sample concentration. However, because the peaks overlapped, it was difficult to determine the mass fraction of oleic acid in the mixture of oleic and elaidic acids by peak intensity alone. Thus, PLS regression was used. The PLS regression model was established by using the Raman spectra shown in Figure 2. Figure 3 shows the relationship between the actual and PLS-predicted concentrations of oleic and elaidic acids. The coefficient of determination (R2 value) was 1.0 for both straight lines. Next, the Raman spectra of the known concentrations of oleic and elaidic acids were measured and were determined by the PLS regression. Table 2 shows the mass fraction obtained with the PLS-predicted values of oleic and elaidic acids. These values were identical to the actual concentrations. The limit of detection and the limit of quantification of elaidic acid were 0.003 and 0.01 of the mass fraction, respectively, as calculated from the standard deviation. Therefore, this model was suitable for determining the concentration of both fatty acids.

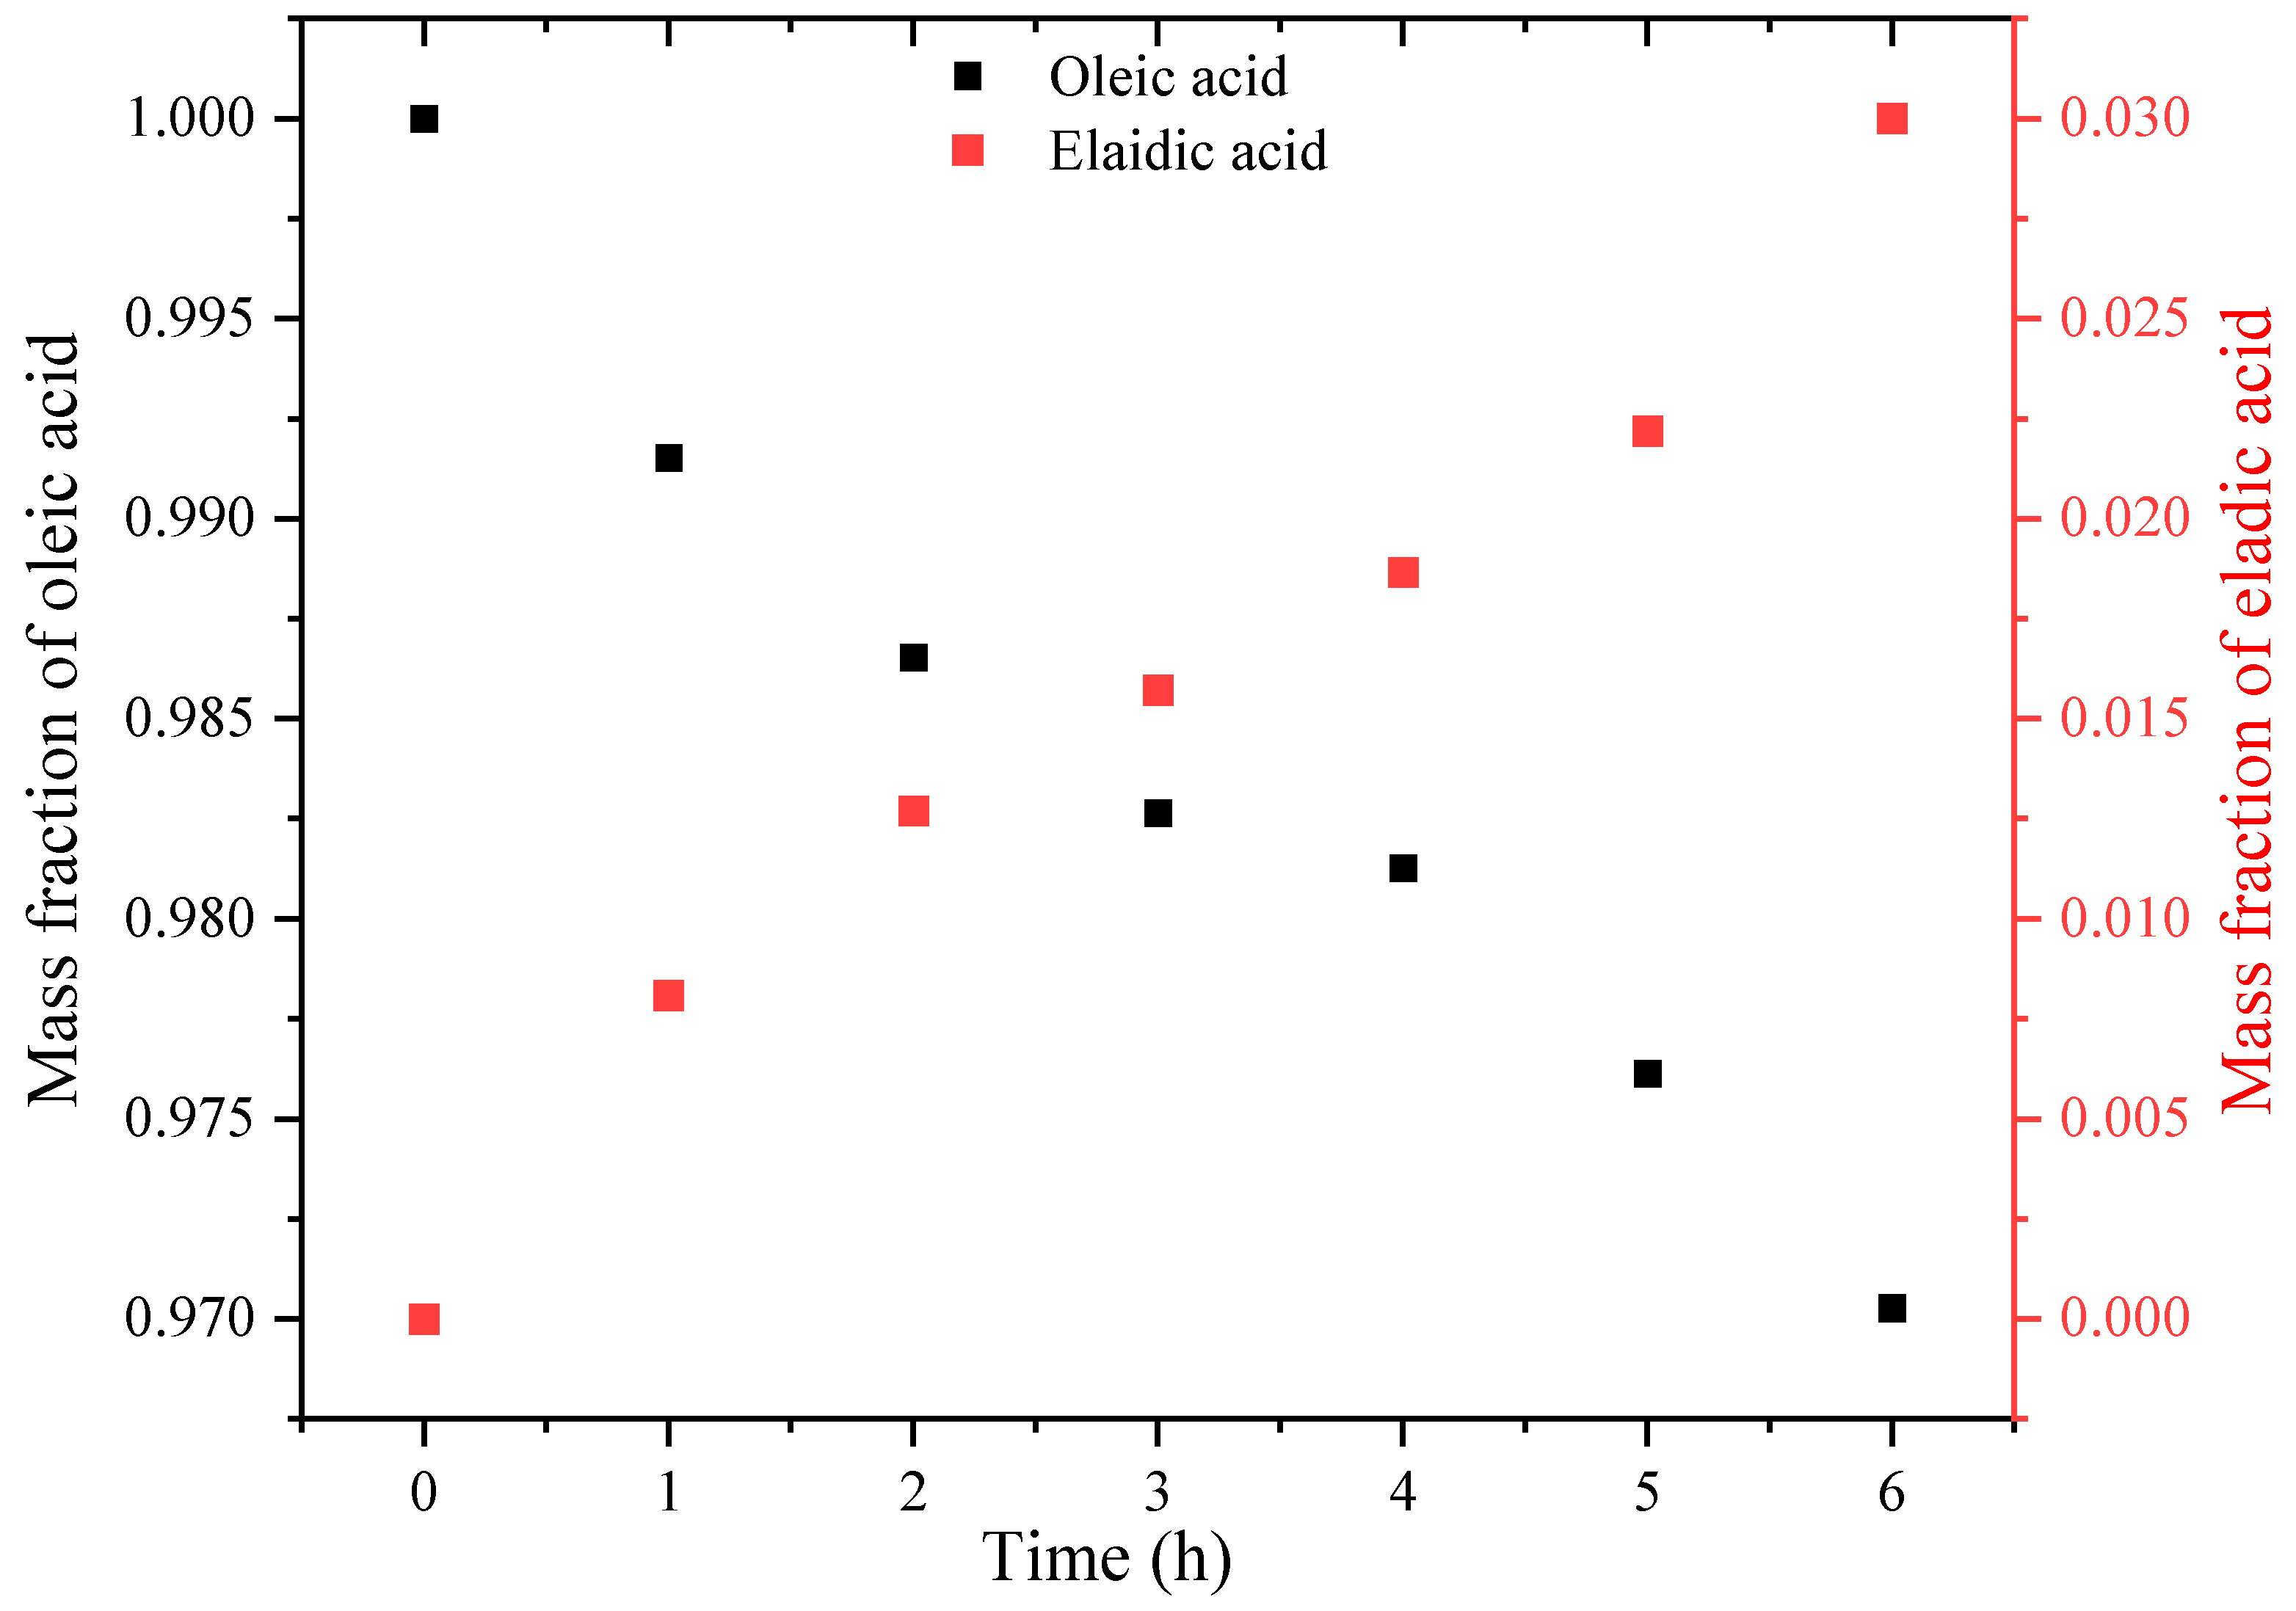
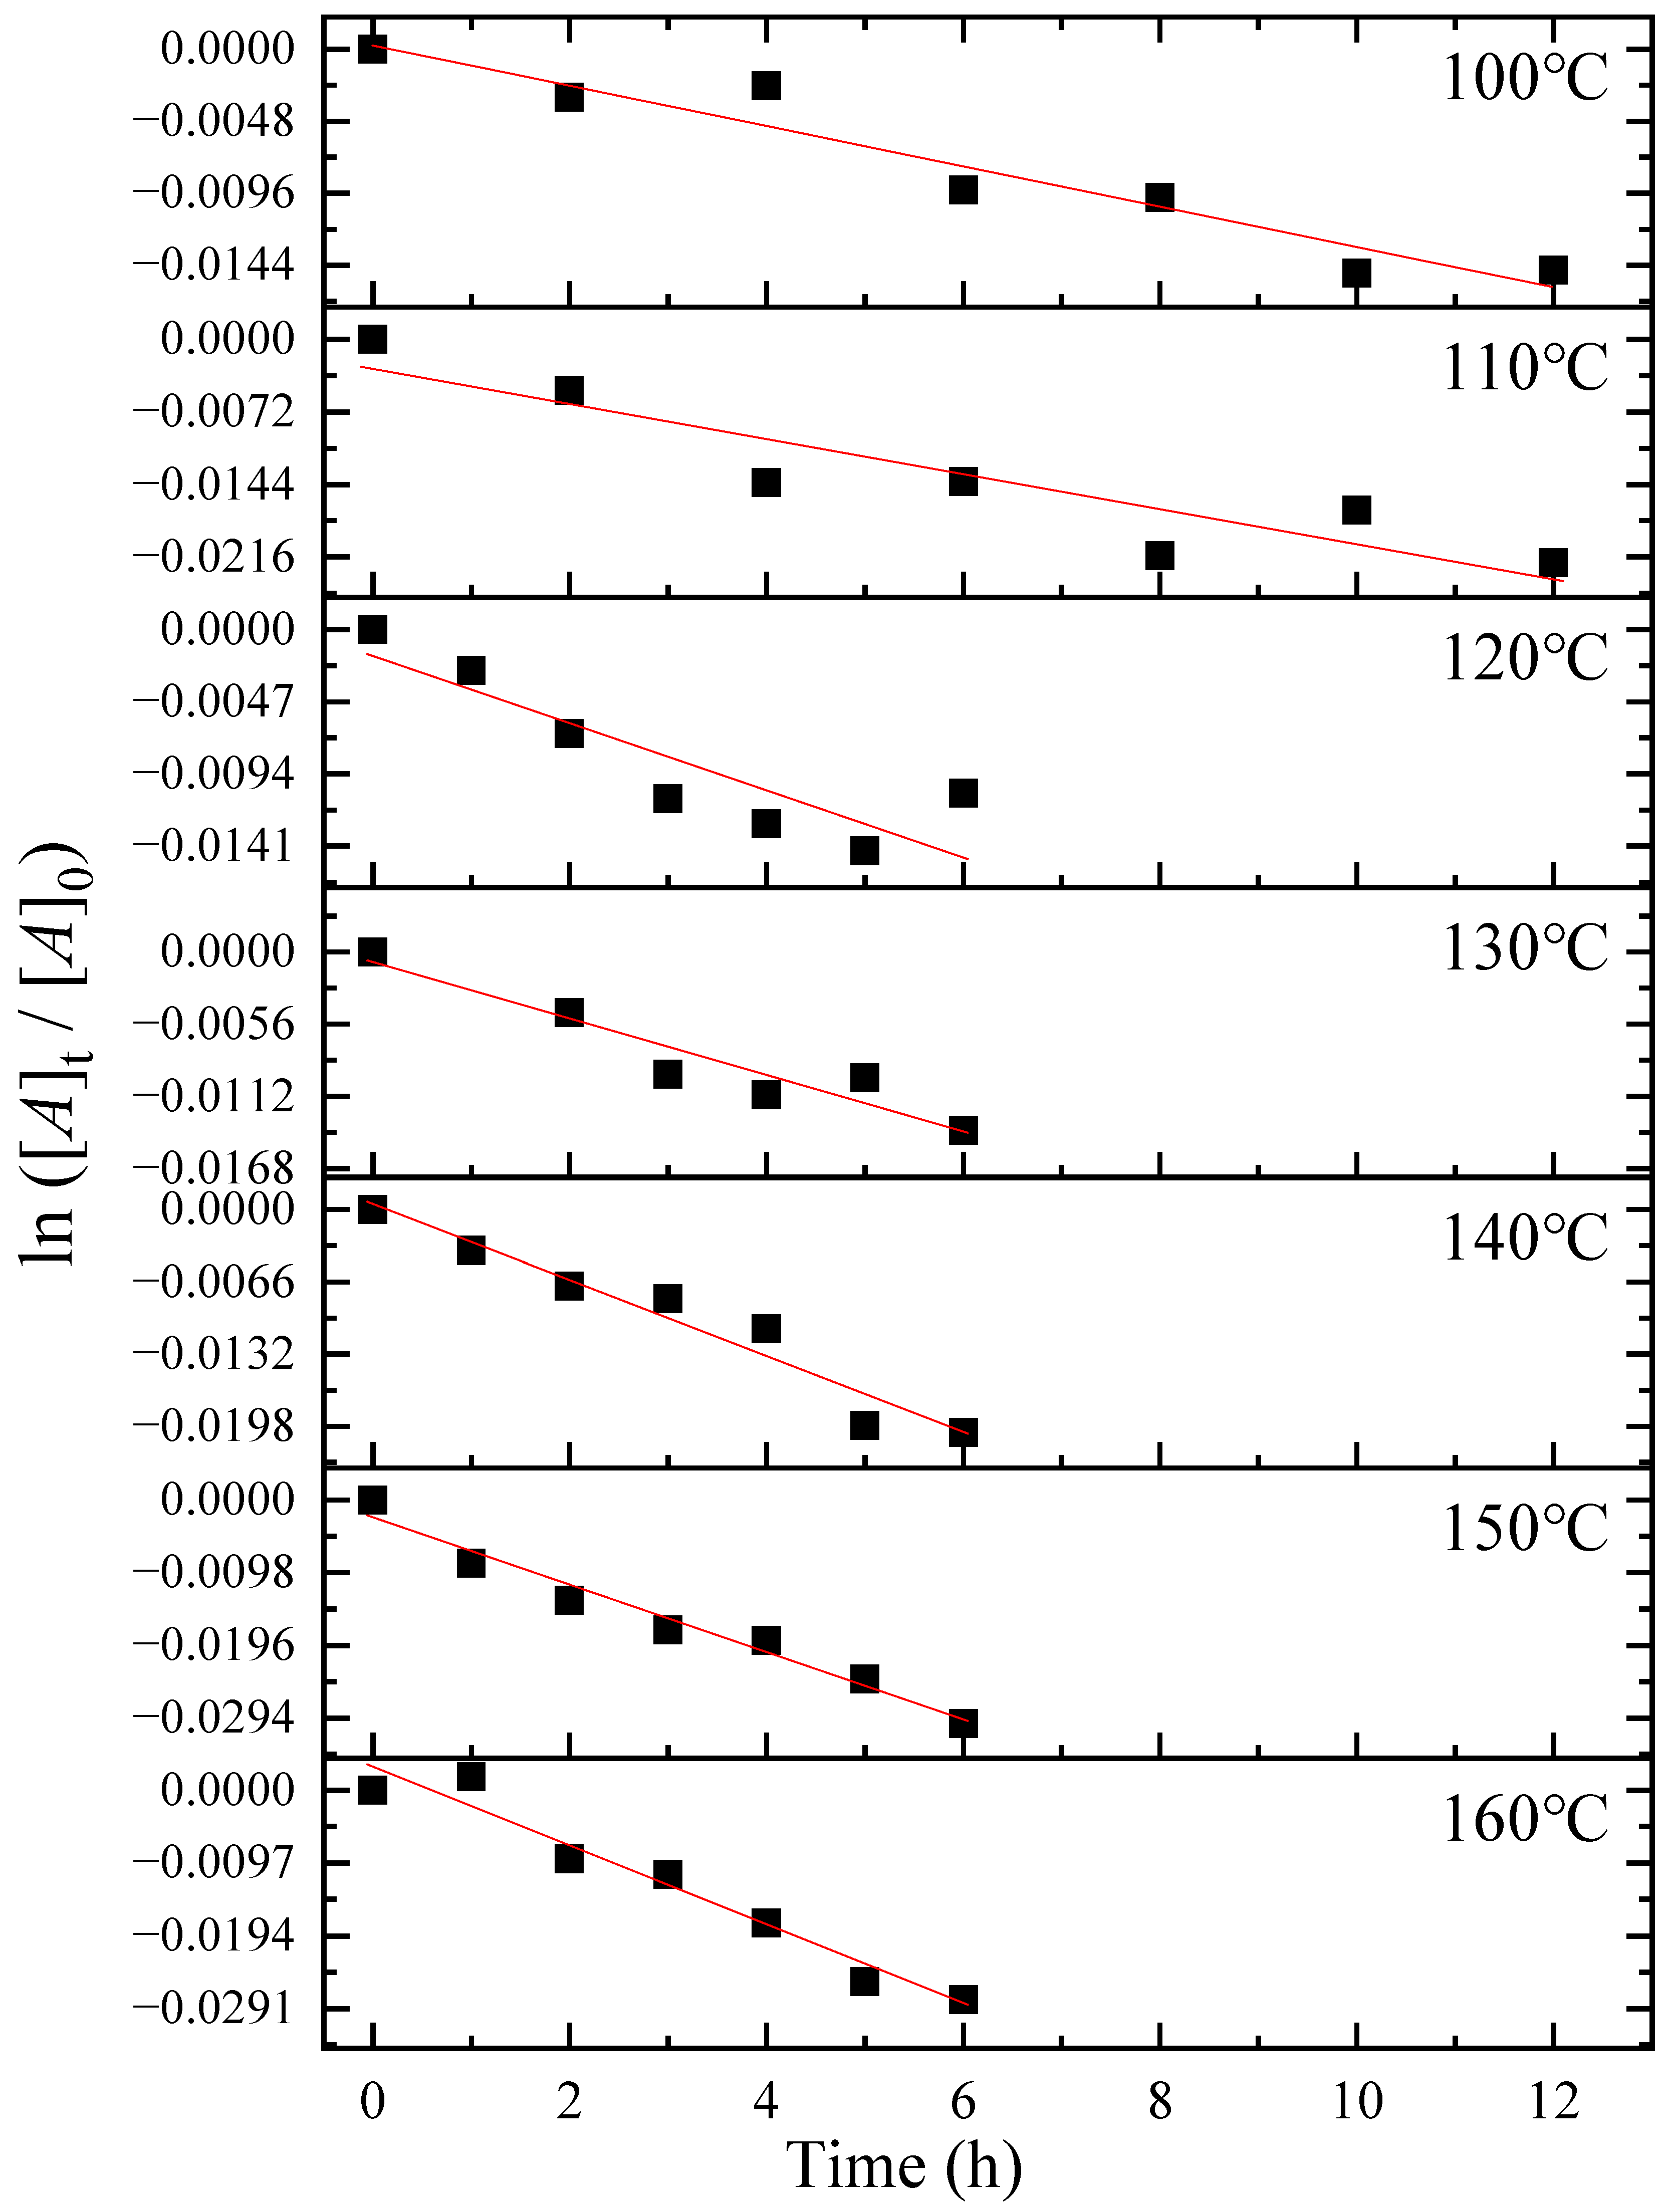
3.2. Thermal Isomerization of Oleic Acid

First, the thermal isomerization reaction was carried out at 150 °C to determine the reaction rate constant. Figure 4 shows the reaction time dependence of the Raman spectra at 150 °C. No new peaks appeared in the Raman spectrum after 6 h of heating, indicating that the thermal reaction of oleic acid did not produce new products. A small peak at 1670 cm−1 was observed, and the peak heights of oleic acid at 1656 and 1265 cm−1 decreased, suggesting that the trans form was produced from oleic acid. The oleic and elaidic acid concentrations were determined using the PLS model (Figure 3). Figure 4 shows the mass fractions of oleic and elaidic acid obtained by PLS regression plotted against reaction time. The mass fraction of oleic acid was defined as 1 at the beginning of the reaction and decreased over the reaction time, whereas that of elaidic acid increased.
Assuming that the reaction was a first-order reaction, the logarithm of the mass fraction of oleic acid against the reaction time was plotted in Figure 5. A first-order reaction obeys the equation ln [A] = ln [A]0kt, where [A] is the concentration of the reactant, [A]0 is the initial concentration of the reactant, k is the reaction rate constant at that temperature, and t is reaction time. A straight line was obtained, and the slope of the graph was the reaction constant of 4.54 × 10⁻³ ± 0.36 × 10⁻³/h for the thermal reaction of oleic acid to form elaidic acid at 150 °C.
The thermal reaction of oleic acid was conducted at several temperatures. The mass fraction of oleic acid was obtained by PLS regression, and the logarithm of the mass fraction of the oleic acid was plotted against time at several temperatures (Figure 6). The slopes increased with temperature. The rate constants at each temperature are shown in Table 3.

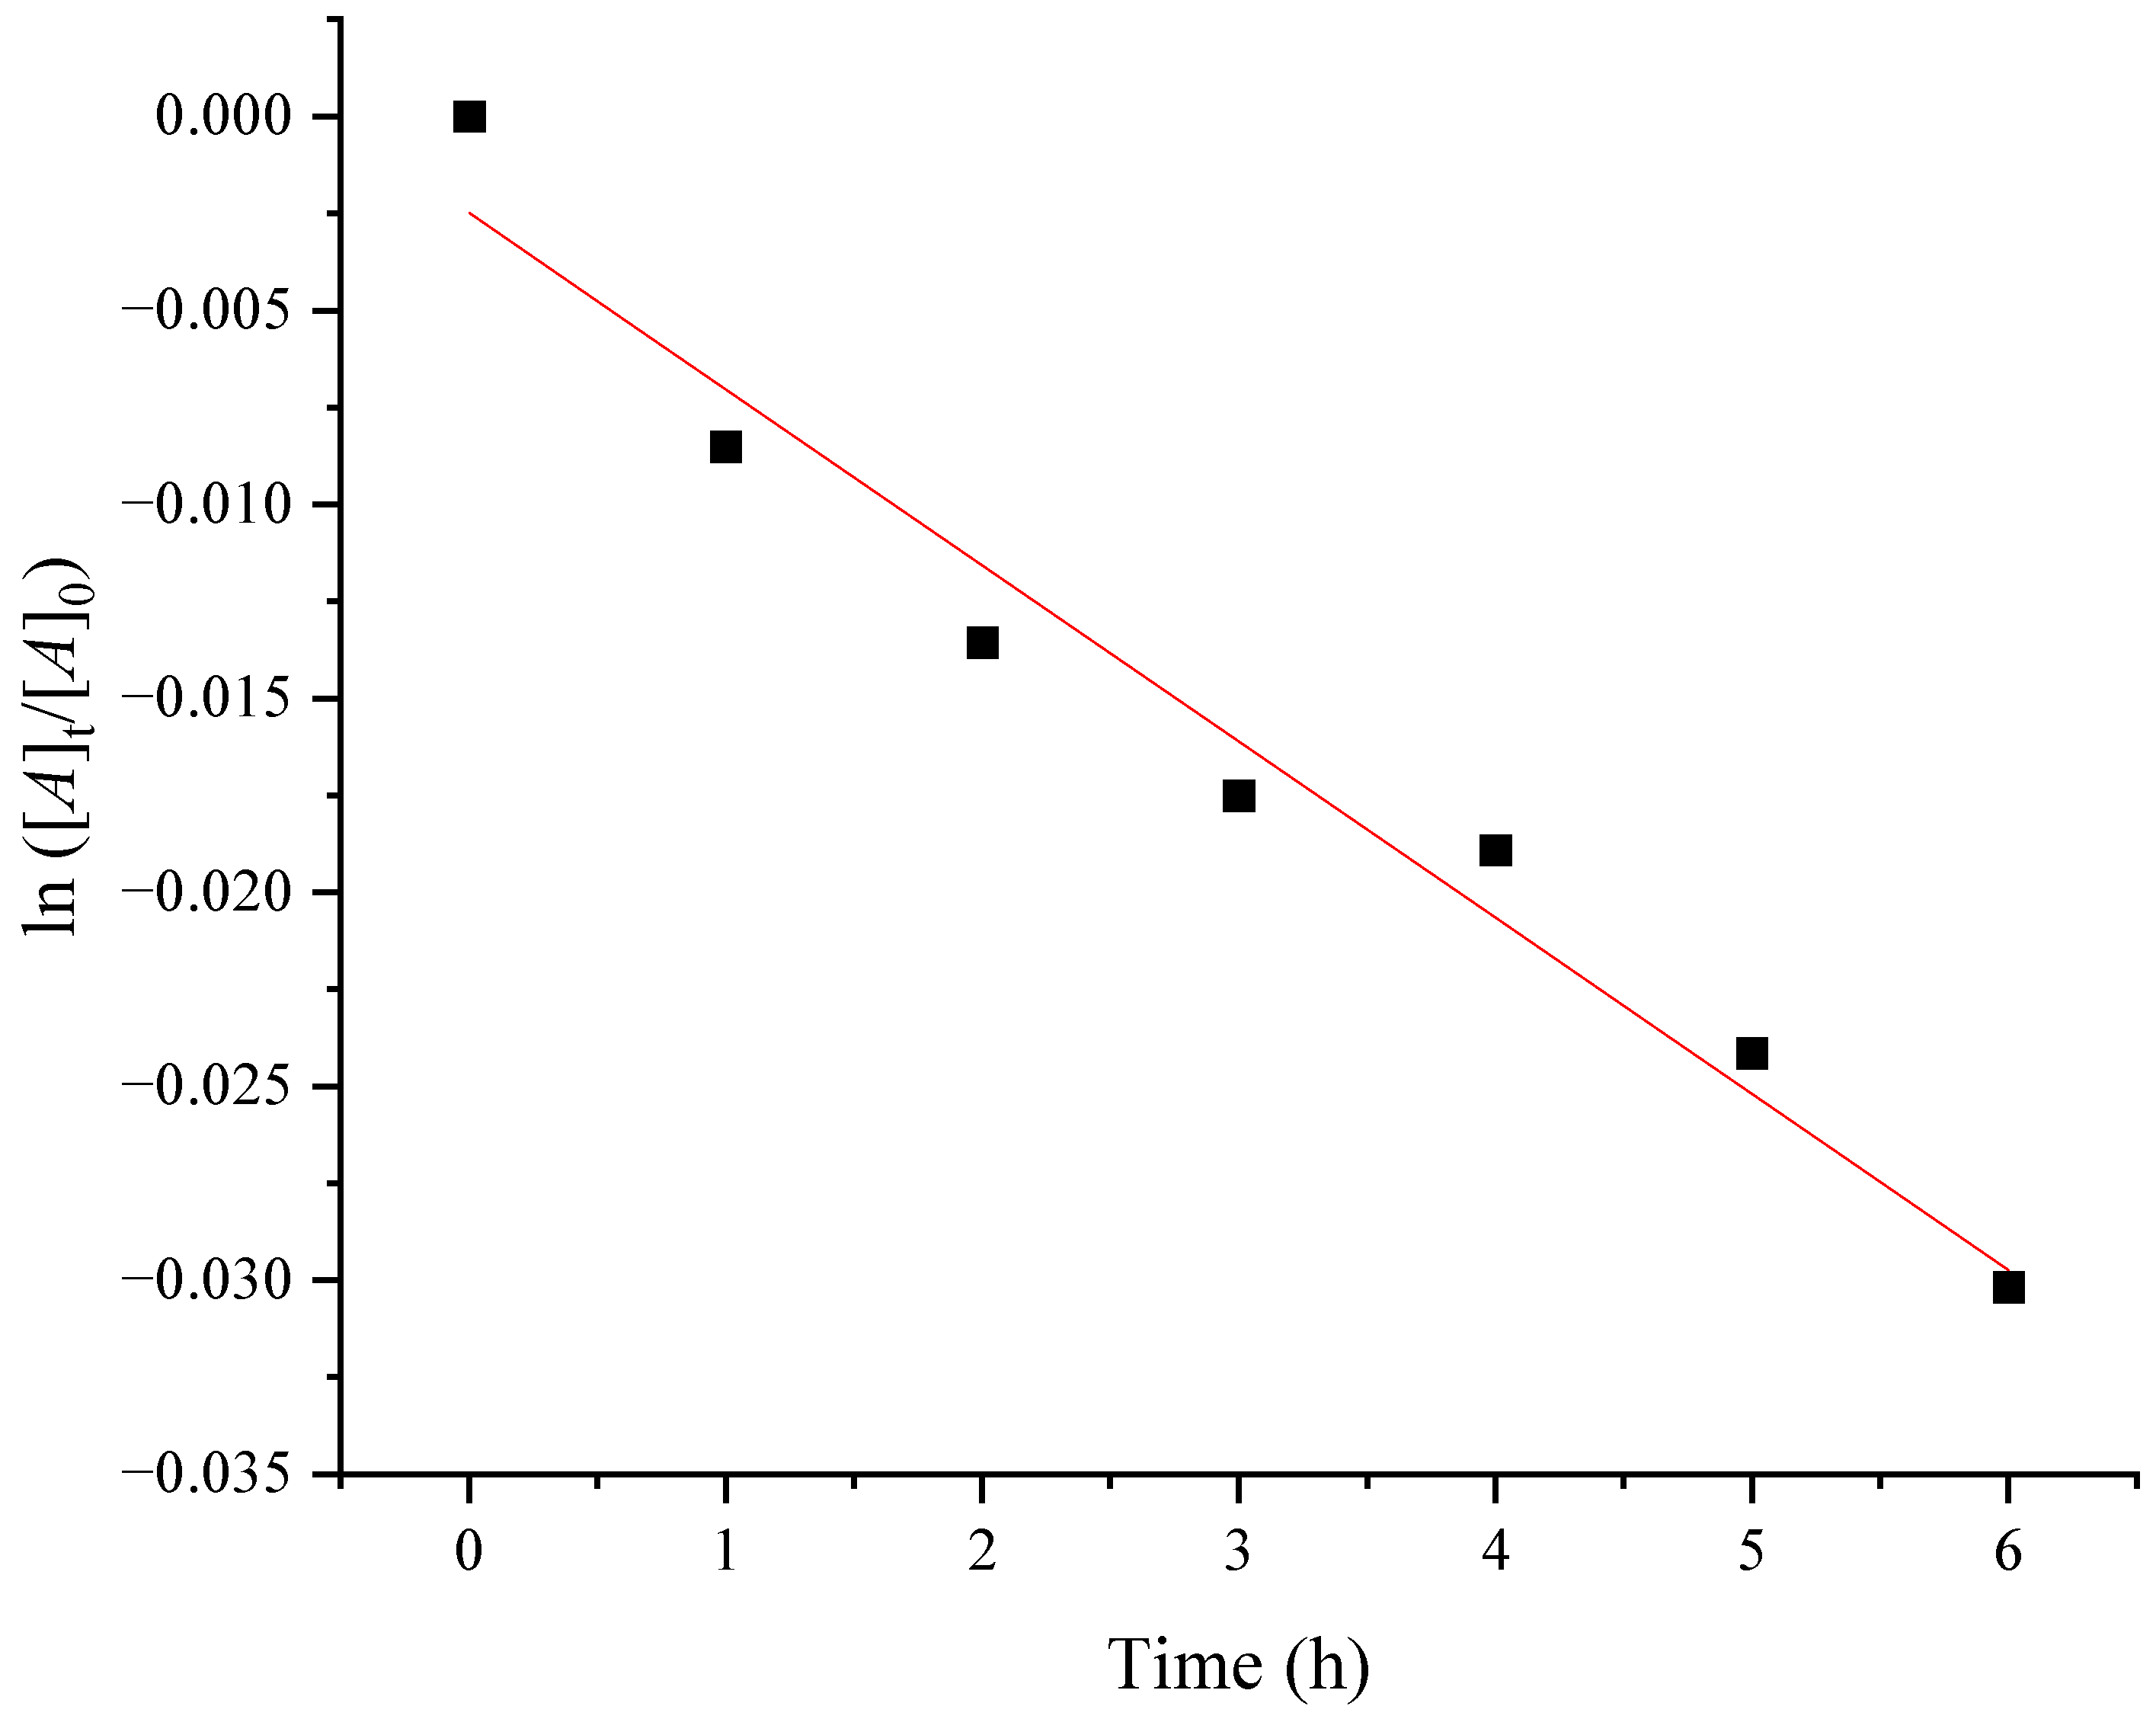
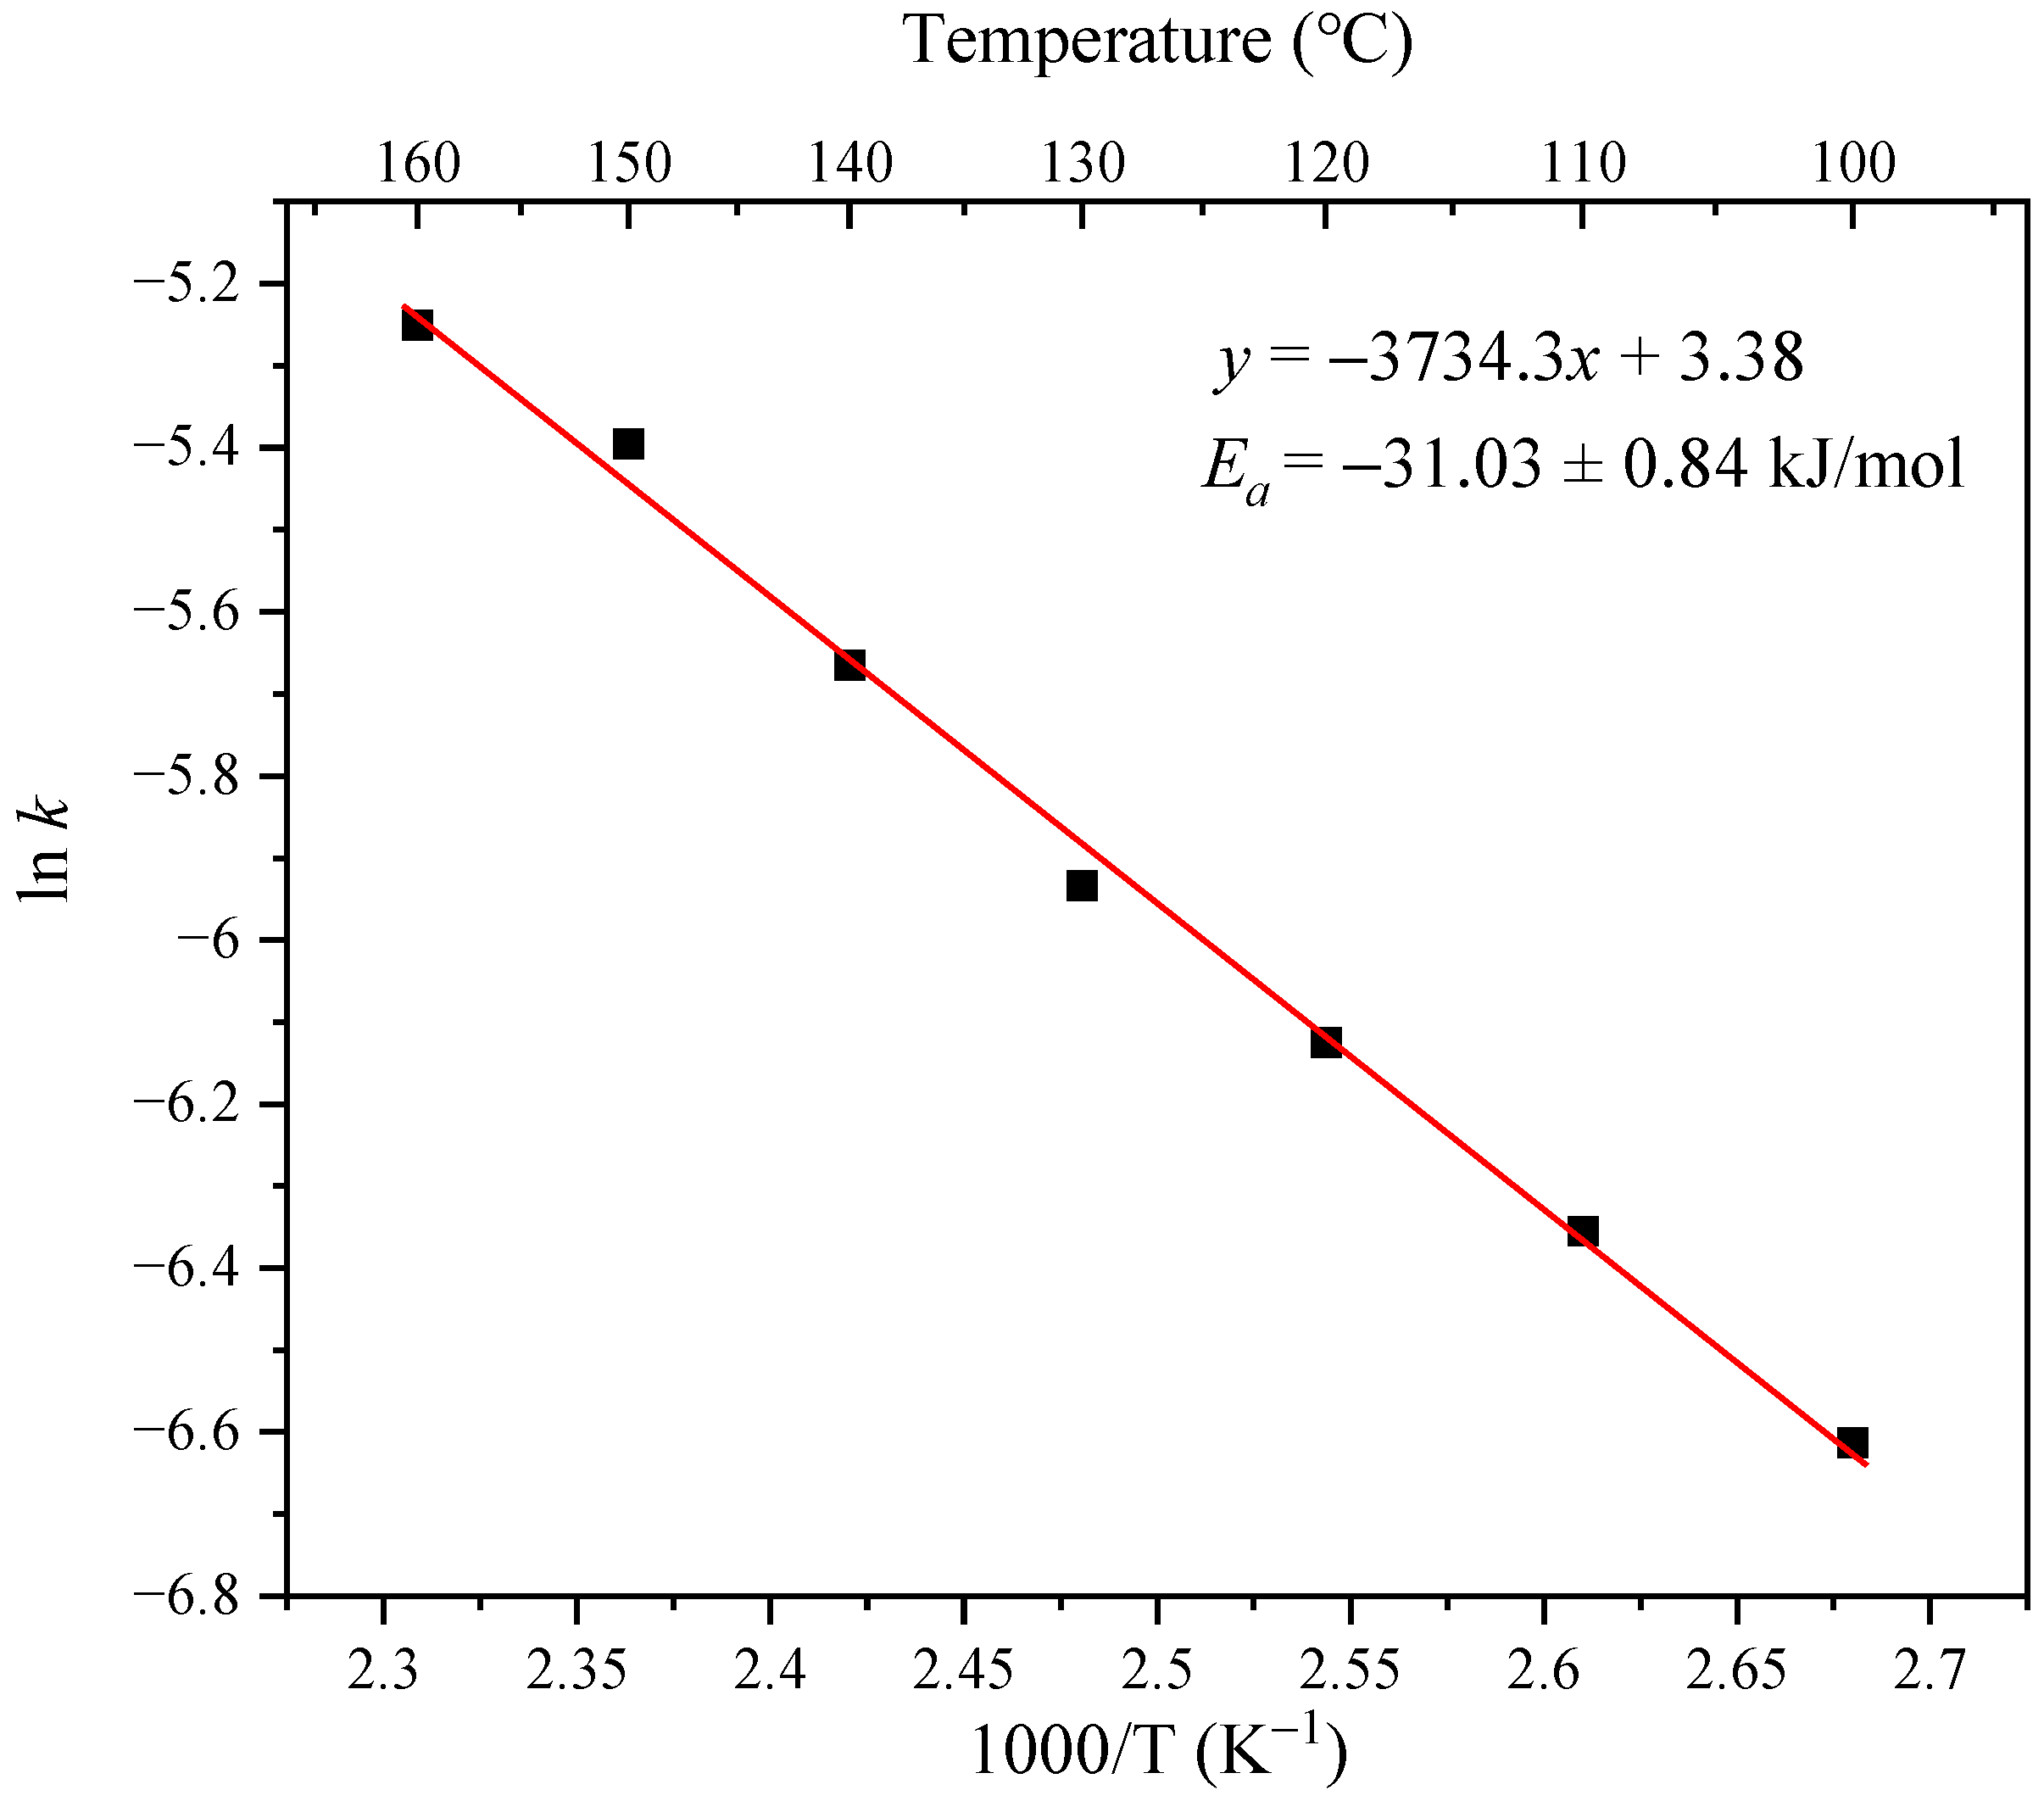
3.3. Activation Energy of the Thermal Isomerization of Oleic Acid

The activation energy is an important value in a reaction mechanism and is obtained from the Arrhenius plot. The Arrhenius equation is k = Aexp(−Ea/RT), where Ea is the activation energy, R is the gas constant, and T is the absolute temperature in kelvin. Ln k is plotted against the reciprocal of the absolute temperature. The slope of the plot is −Ea/R; therefore, activation energy Ea is obtained by the slope times the gas constant, R.
Figure 7 shows that the Arrhenius plot exhibited good linearity, with a determining factor of 0.999 and slope of –3734 ± 101 K. Therefore, the activation energy of the thermal isomerization of the oleic acid was 31.0 ± 0.8 kJ/mol.
This activation energy for the isomerization of oleic acid was smaller than in previous studies. He et al. reported that the activation energy was 97 kJ/mol for thermal isomerization of oleic acid in camellia oil measured by GC [28]. However, because the camellia oil was methylated before the GC measurements, the value is the activation energy of methyl oleate. Furthermore, camellia oil contains other fatty oils, which could interfere with the thermal isomerization of oleic acid. Therefore, the activation energy of oleic acid isomerization in camellia oil was higher than that of pure oleic acid isomerization. Cheng et al. obtained the rate constants of pure oleic acid isomerization at several temperatures by IR spectroscopy based on the peak area at 966 cm−1, which is assigned to elaidic acid [29]. Although they did not calculate the activation energy, we estimated it from their rate constants at 120 °C, 150 °C, and 180 °C as 33 kJ/mol, similar to our value. Therefore, our results suggest that quantitative analysis by Raman spectroscopy and PLS regression may be a valuable method for studying the reaction mechanism without chemical separation.

4. Conclusions

The thermal isomerization of oleic acid was analyzed by Raman spectroscopy and PLS regression. The mass fractions obtained by the PLS regression agreed with the actual mass fractions. The RMSE was 1.1 × 10⁻³. The logarithm of the mass fraction of oleic acid obtained by the PLS regression was plotted against the reaction time. A straight line was obtained, indicating that the reaction obeyed first-order kinetics, and the rate constants were measured at several temperatures (100 °C to 160 °C). The reaction rates were 1.34 ± 0.16 and 5.25 ± 0.51/h for 100 °C to 160 °C, respectively. The activation energy of the reaction was obtained as 31.0 ± 0.8 kJ/mol from the Arrhenius plot. The results demonstrated that the activation energy of the thermal reaction could be obtained by Raman spectroscopy and PLS regression without separation. This method can be used for the monitoring and real-time measurement of oleic acid (cis isomer) and elaidic acid (trans isomer).

Supplementary Materials

The following supporting information can be downloaded at: https://www.mdpi.com/article/10.3390/spectroscj3020017/s1, Figure S1: Schematic setup for simultaneous the sample and the standard.

Author Contributions

Conceptualization, Y.N.; methodology, A.W.; visualization. A.W.; writing—original draft Y.N.; writing—review and editing., A.W. and Y.N. All authors have read and agreed to the published version of the manuscript.

Funding

This research received no external funding.

Institutional Review Board Statement

Not applicable.

Informed Consent Statement

Not applicable.

Data Availability Statement

Data are available upon request from the authors.

Conflicts of Interest

The authors declare no conflicts of interest.

References

  1. Rustan, A.C.; Drevon, C.A. Fatty Acids: Structures and Properties. In Encyclopedia of Life Sciences; John Wiley & Sons, Ltd.: Hoboken, NJ, USA, 2005. [Google Scholar] [CrossRef]
  2. Shah, B.; Thadani, U. Trans Fatty Acids Linked to Myocardial Infarction and Stroke: What Is the Evidence? Trends Cardiovasc. Med. 2019, 29, 306–310. [Google Scholar] [CrossRef] [PubMed]
  3. Liu, W.; Lu, G.H. Cis-Trans Isomerization of Unsaturated Fatty Acids in Edible Oils to Prepare Trans Fat. Grasas Aceites 2018, 69, e268. [Google Scholar] [CrossRef]
  4. Martin, C.A.; Milinsk, M.C.; Visentainer, J.V.; Matsushita, M.; de-Souza, N.E. Trans Fatty Acid-Forming Processes in Foods: A Review. An. Acad. Bras. Ciênc. 2007, 79, 343–350. [Google Scholar] [CrossRef] [PubMed]
  5. Bhardwaj, S.; Passi, S.J.; Misra, A. Overview of Trans Fatty Acids: Biochemistry and Health Effects. Diabetes Metab. Syndr. Clin. Res. Rev. 2011, 5, 161–164. [Google Scholar] [CrossRef] [PubMed]
  6. Takeuchi, H.; Sugano, M. Industrial Trans Fatty Acid and Serum Cholesterol: The Allowable Dietary Level. J. Lipids 2017, 2017, 1–10. [Google Scholar] [CrossRef]
  7. Brouwer, I.A.; Wanders, A.J.; Katan, M.B. Effect of Animal and Industrial Trans Fatty Acids on HDL and LDL Cholesterol Levels in Humans—A Quantitative Review. PLoS ONE 2010, 5, e9434. [Google Scholar] [CrossRef]
  8. Li, C.; Cobb, L.K.; Vesper, H.W.; Asma, S. Global Surveillance of Trans-Fatty Acids. Prev. Chronic Dis. 2019, 16, E147. [Google Scholar] [CrossRef]
  9. Soares-Miranda, L.; Stein, P.K.; Imamura, F.; Sattelmair, J.; Lemaitre, R.N.; Siscovick, D.S.; Mota, J.; Mozaffarian, D. Trans-Fatty Acid Consumption and Heart Rate Variability in 2 Separate Cohorts of Older and Younger Adults. Circ. Arrhythmia Electrophysiol. 2012, 5, 728–738. [Google Scholar] [CrossRef]
  10. Islam, M.A.; Amin, M.N.; Siddiqui, S.A.; Hossain, M.P.; Sultana, F.; Kabir, M.R. Trans Fatty Acids and Lipid Profile: A Serious Risk Factor to Cardiovascular Disease, Cancer and Diabetes. Diabetes Metab. Syndr. Clin. Res. Rev. 2019, 13, 1643–1647. [Google Scholar] [CrossRef]
  11. Uauy, R.; Aro, A.; Clarke, R.; Ghafoorunissa; L’Abbé, M.R.; Mozaffarian, D.; Skeaff, C.M.; Stender, S.; Tavella, M. WHO Scientific Update on Trans Fatty Acids: Summary and Conclusions. Eur. J. Clin. Nutr. 2009, 63, S68–S75. [Google Scholar] [CrossRef]
  12. World Health Organization. Saturated Fatty Acid and Trans-Fatty Acid Intake for Adults and Children: WHO Guideline Summary; World Health Organization: Geneva, Switzerland, 2023; Available online: https://iris.who.int/handle/10665/375034 (accessed on 17 July 2023).
  13. Eder, K. Gas Chromatographic Analysis of Fatty Acid Methyl Esters. J. Chromatogr. B Biomed. Sci. Appl. 1995, 671, 113–131. [Google Scholar] [CrossRef]
  14. Seppänen-Laakso, T.; Laakso, I.; Hiltunen, R. Analysis of Fatty Acids by Gas Chromatography, and Its Relevance to Research on Health and Nutrition. Anal. Chim. Acta 2002, 465, 39–62. [Google Scholar] [CrossRef]
  15. Chiu, H.-H.; Kuo, C.-H. Gas Chromatography-Mass Spectrometry-Based Analytical Strategies for Fatty Acid Analysis in Biological Samples. J. Food Drug Anal. 2020, 28, 60–73. [Google Scholar] [CrossRef]
  16. May, W.E.; Cavanagh, R.R.; Turk, G.C.; Winchester, M.; Travis, J.; Smith, M.V.; DeRose, P.; Choquette, S.J.; Kramer, G.W.; Sieber, J.R.; et al. Analytical Chemistry. In Springer Handbook of Metrology and Testing; Springer Science & Business Media: Berlin/Heidelberg, Germany, 2011; pp. 145–203. [Google Scholar] [CrossRef]
  17. Hasegawa, T. Infrared Spectroscopy as a Vibrational Spectroscopy. In Quantitative Infrared Spectroscopy for Understanding of a Condensed Matter; Springer: Tokyo, Japan, 2017; pp. 1–36. [Google Scholar] [CrossRef]
  18. Othman, N. IR Spectroscopy in Qualitative and Quantitative Analysis. In Infrared Spectroscopy—Perspectives and Applications; IntechOpen: London, UK, 2023. [Google Scholar] [CrossRef]
  19. Sinclair, R.G.; McKay, A.F.; Myers, G.S.; Jones, R.N. The Infrared Absorption Spectra of Unsaturated Fatty Acids and Esters1. J. Am. Chem. Soc. 1952, 74, 2578–2585. [Google Scholar] [CrossRef]
  20. Christy, A.A.; Egeberg, P.K. Quantitative Determination of Saturated and Unsaturated Fatty Acids in Edible Oils by Infrared Spectroscopy and Chemometrics. Chemom. Intell. Lab. Syst. 2006, 82, 130–136. [Google Scholar] [CrossRef]
  21. Mossoba, M.M.; Azizian, H.; Kramer, J.K.G. Application of infrared spectroscopy to the rapid determination of total saturated, trans, monounsaturated, and polyunsaturated fatty acids In AOCS Lipid Library, Oils and Fats; AOCS: Urbana, IL, USA, 2019; Available online: https://www.aocs.org/resource/application-of-infrared-spectroscopy-to-the-rapid-determination-of-total-saturated-trans-monounsaturated-and-polyunsaturated-fatty-acids/ (accessed on 17 July 2023).
  22. Sherazi, S.T.H.; Kandhro, A.; Mahesar, S.A.; Bhanger, M.I.; Talpur, M.Y.; Arain, S. Application of Transmission FT-IR Spectroscopy for the Trans Fat Determination in the Industrially Processed Edible Oils. Food Chem. 2009, 114, 323–327. [Google Scholar] [CrossRef]
  23. Rensonnet, A.; Tipping, W.J.; Malherbe, C.; Faulds, K.; Eppe, G.; Graham, D. Spectral Fingerprinting of Cellular Lipid Droplets Using Stimulated Raman Scattering Microscopy and Chemometric Analysis. Analyst 2024, 149, 553–562. [Google Scholar] [CrossRef]
  24. Baranov, D.; Lynch, M.J.; Curtis, A.C.; Carollo, A.R.; Douglass, C.R.; Mateo-Tejada, A.M.; Jonas, D.M. Purification of Oleylamine for Materials Synthesis and Spectroscopic Diagnostics for Trans Isomers. Chem. Mater. 2019, 31, 1223–1230. [Google Scholar] [CrossRef]
  25. Numata, Y.; Kobayashi, H.; Oonami, N.; Kasai, Y.; Tanaka, H. Simultaneous Determination of Oleic and Elaidic Acids in Their Mixed Solution by Raman Spectroscopy. J. Mol. Struct. 2019, 1185, 200–204. [Google Scholar] [CrossRef]
  26. Rahmania, H.; Indrayanto, G.; Windarsih, A.; Fernando, D.; Bakar, N.K.A.; Rohman, A. Standard Review of the Application of Molecular Spectroscopic and Chromatographic-Based Methods for Determination of Trans Fatty Acids in Food Products. Appl. Food Res. 2025, 5, 100657. [Google Scholar] [CrossRef]
  27. Czamara, K.; Majzner, K.; Pacia, M.Z.; Kochan, K.; Kaczor, A.; Baranska, M. Raman Spectroscopy of Lipids: A Review. J. Raman Spectrosc. 2014, 46, 4–20. [Google Scholar] [CrossRef]
  28. He, C.; Qin, L.; Yang, J.; Zhu, Y. Revealing the Heat-Induced Cis-Trans Isomerization of Unsaturated Fatty Acids in Camellia Oil. LWT 2023, 173, 114293. [Google Scholar] [CrossRef]
  29. Cheng, N.; Zhang, J.; Yin, J.; Li, S. Computational and Experimental Research on Mechanism of Cis/Trans Isomerization of Oleic Acid. Heliyon 2018, 4, e00768. [Google Scholar] [CrossRef] [PubMed]
Scheme 1. Thermal isomerization of oleic acid to elaidic acid.
Spectroscj 03 00017 sch001
Figure 1. Raman spectra of oleic (a) and elaidic (b) acids.
Spectroscj 03 00017 g001
Figure 2. Raman spectra of oleic and elaidic acids in several mass fractions.
Spectroscj 03 00017 g002
Figure 3. Calibration curve obtained by PLS regression.
Spectroscj 03 00017 g003
Figure 4. Mass fraction obtained by PLS regression against reaction time.
Spectroscj 03 00017 g004
Figure 5. Logarithm of the mass fraction of oleic acid against reaction time.
Spectroscj 03 00017 g005
Figure 6. Logarithm of the mass fraction of oleic acid against reaction time at several temperatures.
Spectroscj 03 00017 g006
Figure 7. Arrhenius plot of the thermal isomerization of oleic acid.
Spectroscj 03 00017 g007
Table 1. Raman shift values and their assignments for oleic and elaidic acids.
Raman Shift (cm−1)Assignments [27]
Oleic AcidElaidic Acid
970C-H out-of-plane bending
10651065C-C antisym. stretching
10851085C-C symmetry stretching (COOH side)
11201120C-C symmetry stretching (CH3 side)
1265C-H in-plane stretching
13031303CH3 twisting
14401440CH2 stretching
16561670C=C stretching
Table 2. Mass fractions of oleic and elaidic acids estimated by PLS regression.
Oleic AcidElaidic Acid
Actual Mass FractionEstimated Mass FractionActual Mass FractionEstimated Mass Fraction
1.00001.0000 ± 0.00110.00000.0001 ± 0.0011
0.90000.9007 ± 0.00980.10000.1003 ± 0.0010
0.79990.8032 ± 0.00100.20010.2030 ± 0.0010
0.70020.7019 ± 0.00120.29980.3013 ± 0.0012
0.59980.6023 ± 0.00110.40020.4022 ± 0.0011
0.50010.5012 ± 0.00100.49990.5010 ± 0.0010
RMSEP0.0045RMSEP0.0041
REMSEP: root mean square error of prediction.
Table 3. Rate constants of the thermal reaction of oleic acid at different temperatures.
Temperature (°C)Rate Constant (h−1) × 103
1001.34 ± 0.16
1101.74 ± 0.34
1202.19 ± 0.52
1302.65 ± 0.35
1403.47 ± 0.37
1504.54 ± 0.36
1605.25 ± 0.51
Disclaimer/Publisher’s Note: The statements, opinions and data contained in all publications are solely those of the individual author(s) and contributor(s) and not of MDPI and/or the editor(s). MDPI and/or the editor(s) disclaim responsibility for any injury to people or property resulting from any ideas, methods, instructions or products referred to in the content.

