Review

The Triangle: Carotenoids–Retinoids–Cytochromes Govern Essential Functions for Development and Progression of Cancer

Laboratory of Laser Molecular Spectroscopy, Department of Chemistry, Institute of Applied Radiation Chemistry, Lodz University of Technology, Wróblewskiego 15, 93-590 Łódź, Poland
*
Author to whom correspondence should be addressed.
Spectrosc. J. 2025, 3(1), 9; https://doi.org/10.3390/spectroscj3010009
Submission received: 14 January 2025 / Revised: 13 February 2025 / Accepted: 3 March 2025 / Published: 7 March 2025

Abstract

:
In this review, we demonstrate that the carotenoids–retinoids–cytochromes c triangle is an important cancer factor controlling most aspects of the development, proliferation, and progression of cancer. Cancer is a multidimensional disease that needs a balance between the enzymes controlling the amount of carotenoids, the production of retinoids (particularly retinoic acid), and the concentration of cytochromes (particularly cytochrome c). The proper balance between these enzymes will help in overcoming the bottleneck in cancer therapeutics using drugs. First, we discuss the impact of carotenoids on cancer. In the next section, we show how carotenoid cleavage products, including retinal, retinol, and retinoic acid, induce positive and negative effects on cancer development. Then, we discuss the impact of cytochrome c on cancer. We have demonstrated that an alteration in the cellular redox status of cytochrome c is a crucial factor in cancer, influencing numerous aspects of malignant progression. The results obtained by Raman imaging showed significant differences between normal and cancerous human cells. First, a significant redox imbalance in the hem group of cytochrome c with the upregulation of the reduced form of hem is observed. Cancer tissue has a higher concentration of reduced cytochrome c than normal tissue. Secondly, both breast and brain tumors exhibit enhanced de novo lipogenesis in comparison to normal cells. Third, this research illustrates the essential function of the extracellular matrix in oxidative phosphorylation and apoptosis pathways.

1. The Impact of Carotenoids on Cancers

Epithelial cells in both the blood and the extracellular matrix are abundant in the carotenoids of healthy individuals. Carotenoids disappear from the tissue or their amount is drastically reduced in patients who do suffer from breast cancer [1], but the reason for this is not well understood. The explanation of this fact is of fundamental importance to understanding the mechanisms of cancer development, but it has not been clarified yet.
The first papers that analyzed carotenoid content in tissue reported a negligible concentration both in normal and cancerous breast tissues [2]. This finding was clearly supported three years later by Abramczyk’s group [3,4,5,6], providing evidence that carotenoids act as the principal Raman biomarkers for distinguishing normal, benign, and malignant breast tissues, along with their detection in blood. Carotenoids are found in normal tissue and in the blood of healthy patients who do not suffer from breast cancer [1,3,4,5,6]. The level of carotenoids is drastically reduced in cancer. For example, we found that the epithelial cells of normal human ducts are abundant in carotenoids, but they are not present in the epithelial cells of cancerous ducts. Moreover, in human studies, the carotenoid concentrations in the serum were significantly lower in patients with breast cancers than those in healthy control subjects [1].
The mechanisms of carotenoids’ disappearance are still unclear. Efforts towards understanding the effects of low carotenoids concentrations in cancer diseases may help to explain the mechanisms of breast cancer development [1].
Raman spectroscopy and imaging are analytical methods in which inelastic scattered light is used to obtain information about molecular vibrations. Raman scattering (RS) is an inelastic scattering process with a transfer of energy between the molecular vibrations (and rotations) and the scattered photons. It is worth emphasizing that RS has long been used to analyze the chemical compositions of tissues/single cells and is widely employed in cancer screening and diagnosis [7,8,9]. To assess the diagnostic value of Raman biomarkers in monitoring cancer pathology, we employed chemometric techniques, including principal component analysis (PCA). Data from the spectroscopy technique are widely analyzed with machine learning algorithms [7,10]. Figure 1 presents a PCA score plot. Without delving into the technical details of PCA, it is evident that the samples depicted in Figure 1 are divided into two distinct groups. Specifically, the samples on the left side of the plot consist almost entirely of tumor tissues, while those on the right side represent predominantly normal tissues, clearly separated along PC1. The level of carotenoids decreases from right to left. Raman bands characteristic of carotenoids are presented at 1004, 1158, and 1520 cm−1, corresponding to the vibrations of C–C coupled with C–CH3 and C=C stretching (Figure 1B).
Although the complete spectrum of the physiological effects of carotenoids in humans remains unclear, there is evidence suggesting that they play a crucial role in numerous biological processes affecting human health and disease development, such as antioxidant capacity, cell-to-cell communication, the conversion of some carotenoids to retinol as a source of vitamin A, and light harvesting for photosynthesis [11,12,13,14,15,16,17,18,19].
Carotenoids, unlike those in plants, fungi, bacteria, and algae, cannot be produced in animals and humans and need to be acquired through the diet. There are many papers discussing the current status of knowledge on the preventive potential of carotenoids in cancer development [12,15,20,21,22,23,24,25,26,27,28,29,30]. Numerous studies have reported that a high intake of carotenoid-rich fruits and vegetables reduced the risk of cancer in several pathologies such as lung, breast, and prostate cancers [18,31,32,33,34,35,36,37]. The mechanisms by which particular carotenoids inhibit cancer have been suggested [11,12,13,14,38]. These mechanisms include antioxidant effects, anti-inflammatory actions, immune modulation, the stimulation of cell differentiation, the induction of apoptosis, the inhibition of proliferation, the modulation of the nuclear receptor superfamily, the enhancement of gap junction communication, and the regulation of growth factor and Wnt/β-catenin signaling (Figure 2).
However, a high intake of carotenoids has a double face: the carotenoids treatment of diseases triggered by oxidative stress is beneficial, but some clinical studies have also reported harmful effects, such as a higher incidence of lung cancer [39,40,41,42,43,44,45]. Among carotenoid cleavage products are highly reactive epoxides and aldehydes, and as a result, these products may increase oxidative stress by impairing mitochondrial respiration [46].
Data on the location and distribution of carotenoids in human cells and tissues remain controversial due to analytical obstacles in the structural elucidation of carotenoids [11,47].
At the tissue level, a major issue is the identification and quantification of chemical differences between the amount of carotenoids in cancerous and normal tissues. Different groups have shown their expertise in examining human breast cancerous tissues [1,2,3,4,5,6,48,49,50], the brain [51,52], the colon [53,54], and the head and neck [55].
To properly address the intriguing fact of carotenoids’ disappearance in cancer tissue, let us discuss Figure 3.
As shown in Figure 3, the disappearance of carotenoids can occur through two pathways. In the first pathway, β-carotene is converted into apocarotenals by the CMOII enzyme. The second pathway, which is more relevant in cancer, involves β-carotene being cleaved by the CMOI enzyme (β-carotene 15,15′-oxygenase) into two retinal molecules (retinaldehyde). Retinal is then processed by the alcohol dehydrogenase (ADH) family to produce retinol, which is converted into retinyl esters by LRAT. Additionally, retinal is transformed by ALDH1 or RALDH enzymes into retinoic acid (RA), which can be further metabolized by cytochrome P450 (CYP) 26 enzymes into more polar compounds, such as the transcriptionally inactive 4-oxo retinoic acid. The second channel may be used to explain the disappearance of β-carotene in cancers. The concentration of CMOI is low at normal physiological conditions, while it increases in cancers. Therefore, in normal cells, β-carotene is not cleaved as efficiently as in cancerous cells. This is the reason why β-carotene is present in blood and normal tissue. CMOI belongs to the family of carotenoid oxygenases [57]. In humans, enzymes are expressed in the small intestine and liver [58]. Enzymes from this family contain an Fe2+ active site, typically coordinated by four histidine residues. The CMOI activity level is enhanced by dietary unsaturated triacylglycerols (TAGs) [59]. This suggests that the low level of β-carotene can be controlled by dietary unsaturated triacylglycerols.
The effect of CMOI activity was demonstrated in breast tissue [1] and is presented in Figure 1 and Figure 3. One can see that there is a reverse correlation between the Raman intensity of monounsaturated TAGs vibration at 2845 cm−1 and the bands of carotenoids at 1520 and 1158 cm−1 in breast cancerous tissue. The TAGs concentration proportional to Raman intensity increases when the concentration of β-carotene decreases due to the activity of CMOI enzyme in cancerous tissue [1].
To summarize, one can state that the role of β-carotene in cancer development has more than a double face. On the one hand, the antioxidant capacity of carotenoids plays an important role in preventing increased ROS in cancer cells. On the other hand, carotenoid cleavage products (CCPs), including highly reactive aldehydes and epoxides, may increase impairing mitochondrial function by oxidative stress and a higher risk of cancer induced by CCPs [46]. Third, carotenoid cleavage products, including retinal, retinol, and retinoic acid, may induce positive and negative effects on cancer development that will be discussed in the next chapter.

2. The Impact of Retinoic Acid on Cancers and Immunity

The impact of retinoids on cancer has been reported in many studies [60,61,62,63]. Like carotenoids, retinoids demonstrate a double face in cancer development. It has been reported that retinoids were used in the treatment of glioma [62]. A positive role of retinoids in breast cancer treatment has been reported [60,64].
However, elevated retinoid levels were suggested to be potentially detrimental in certain inflammatory pathologies [65,66]. Alterations in cellular retinol-binding protein expression have been associated with an increased risk of breast, prostate, and ovarian cancers, and glioblastoma [67]. Lower levels of cellular retinol-binding protein-I (CRBP-1) expression have been detected in breast and other types of cancers [59]. Aberrant retinoid signaling within the cytoplasm and nucleus has also been documented in human cancers [68]. Vitamin A has been reported to regulate oxidative phosphorylation in mitochondria [69]. Increasing evidence supports the significant role of retinoic acid in immunity [70]. Additionally, retinoic acid-induced genes (RIG-I) have been shown to activate abortive anti-SARS-CoV-2 signaling in human lung cells [71].

2.1. Retinoid-Binding Proteins and Retinoic Acid Nuclear Receptors

Retinoids are crucial for regulating cellular signaling pathways. Disrupted retinoid signaling in the cytoplasm and nucleus has been observed in human cancers [68]. Label-free Raman microscopy has recently been demonstrated to be a valuable method for uncovering the precise role of retinoids in cancer cell metabolism and signaling. The function of retinoids has been investigated in normal astrocytes (NHA), high-grade glioblastoma tumor cells (U-87 MG), and human medulloblastoma and glioblastoma tissues [72].
The signaling functions of retinoids are closely associated with retinoid-binding proteins, as retinoids do not exist freely in the extracellular space. Retinoid-binding proteins are grouped into three categories: retinol-binding proteins (RBPs), cellular retinol/retinal-binding proteins, and cellular retinoic acid-binding proteins (CRABPs). RBP is synthesized in the liver, heart, testes, eyes, spleen, and other tissues, with its expression and release into circulation reliant on vitamin A availability [70]. The STRA6 (stimulated by retinoic acid 6) receptor, a ligand-activated surface protein, binds the holo–RBP complex (retinol-RBP), activating the JAK/STAT pathway. This signaling pathway transmits extracellular cues to the nucleus, where it drives gene transcription for immunity, cell proliferation, differentiation, and apoptosis. Dysregulated JAK/STAT signaling contributes to cancer and immune system dysfunctions [73,74,75,76]. JAKs, intracellular tyrosine kinases, activate STAT proteins [74], though the detailed mechanism of activation by retinol-RBP remains unclear and demands further exploration [70].
Research suggests that retinoic acid may influence tumor immune responses [70]. Nevertheless, its full impact on immune cells, inflammatory conditions, and cancer is not yet completely understood [77]. The discovery of retinoic acid’s critical role in generating immunoglobulin A (IgA)–secreting B cells highlights its multifaceted role in mucosal immunity [77]. Numerous studies on various in vivo and cell models show that retinoid depletion leads to T lymphocyte dysregulation, reduced antibody responses to T cell-dependent antigens, and impaired nonspecific immune responses [77].
In summary, retinoic acid appears to enhance antitumor immunity by inducing cell differentiation and supporting lymph node migration. However, it also suppresses the mitochondrial signaling protein pathways and reduces cytokine production, potentially diminishing immunity in cancer [77].

2.2. Retinoids in Cancers Studied by Raman Imaging

To better understand the role of retinoids in cellular signaling in cancers, we must use proper tools for detecting the distribution of retinoids in specific organelles of cells. Raman spectroscopy and imaging serve as valuable tools for detecting alterations in the organelle biochemical profiles associated with cancer progression.
It has been found by Raman imaging that retinol and retinoic acid spectacularly modify the chemical profile of brain cancer cells [72,78]. The findings in the papers in [72,78] offer increasing evidence of a more fundamental role for retinol and retinoic acid than previously understood. The presented results indicate that retinol and retinoic acid are crucial for both signal transduction and metabolic reprogramming in cancer cells, with these processes being interdependent. These changes can be tracked through alterations in the chemical composition of lipid droplets, mitochondria, and the nucleus.
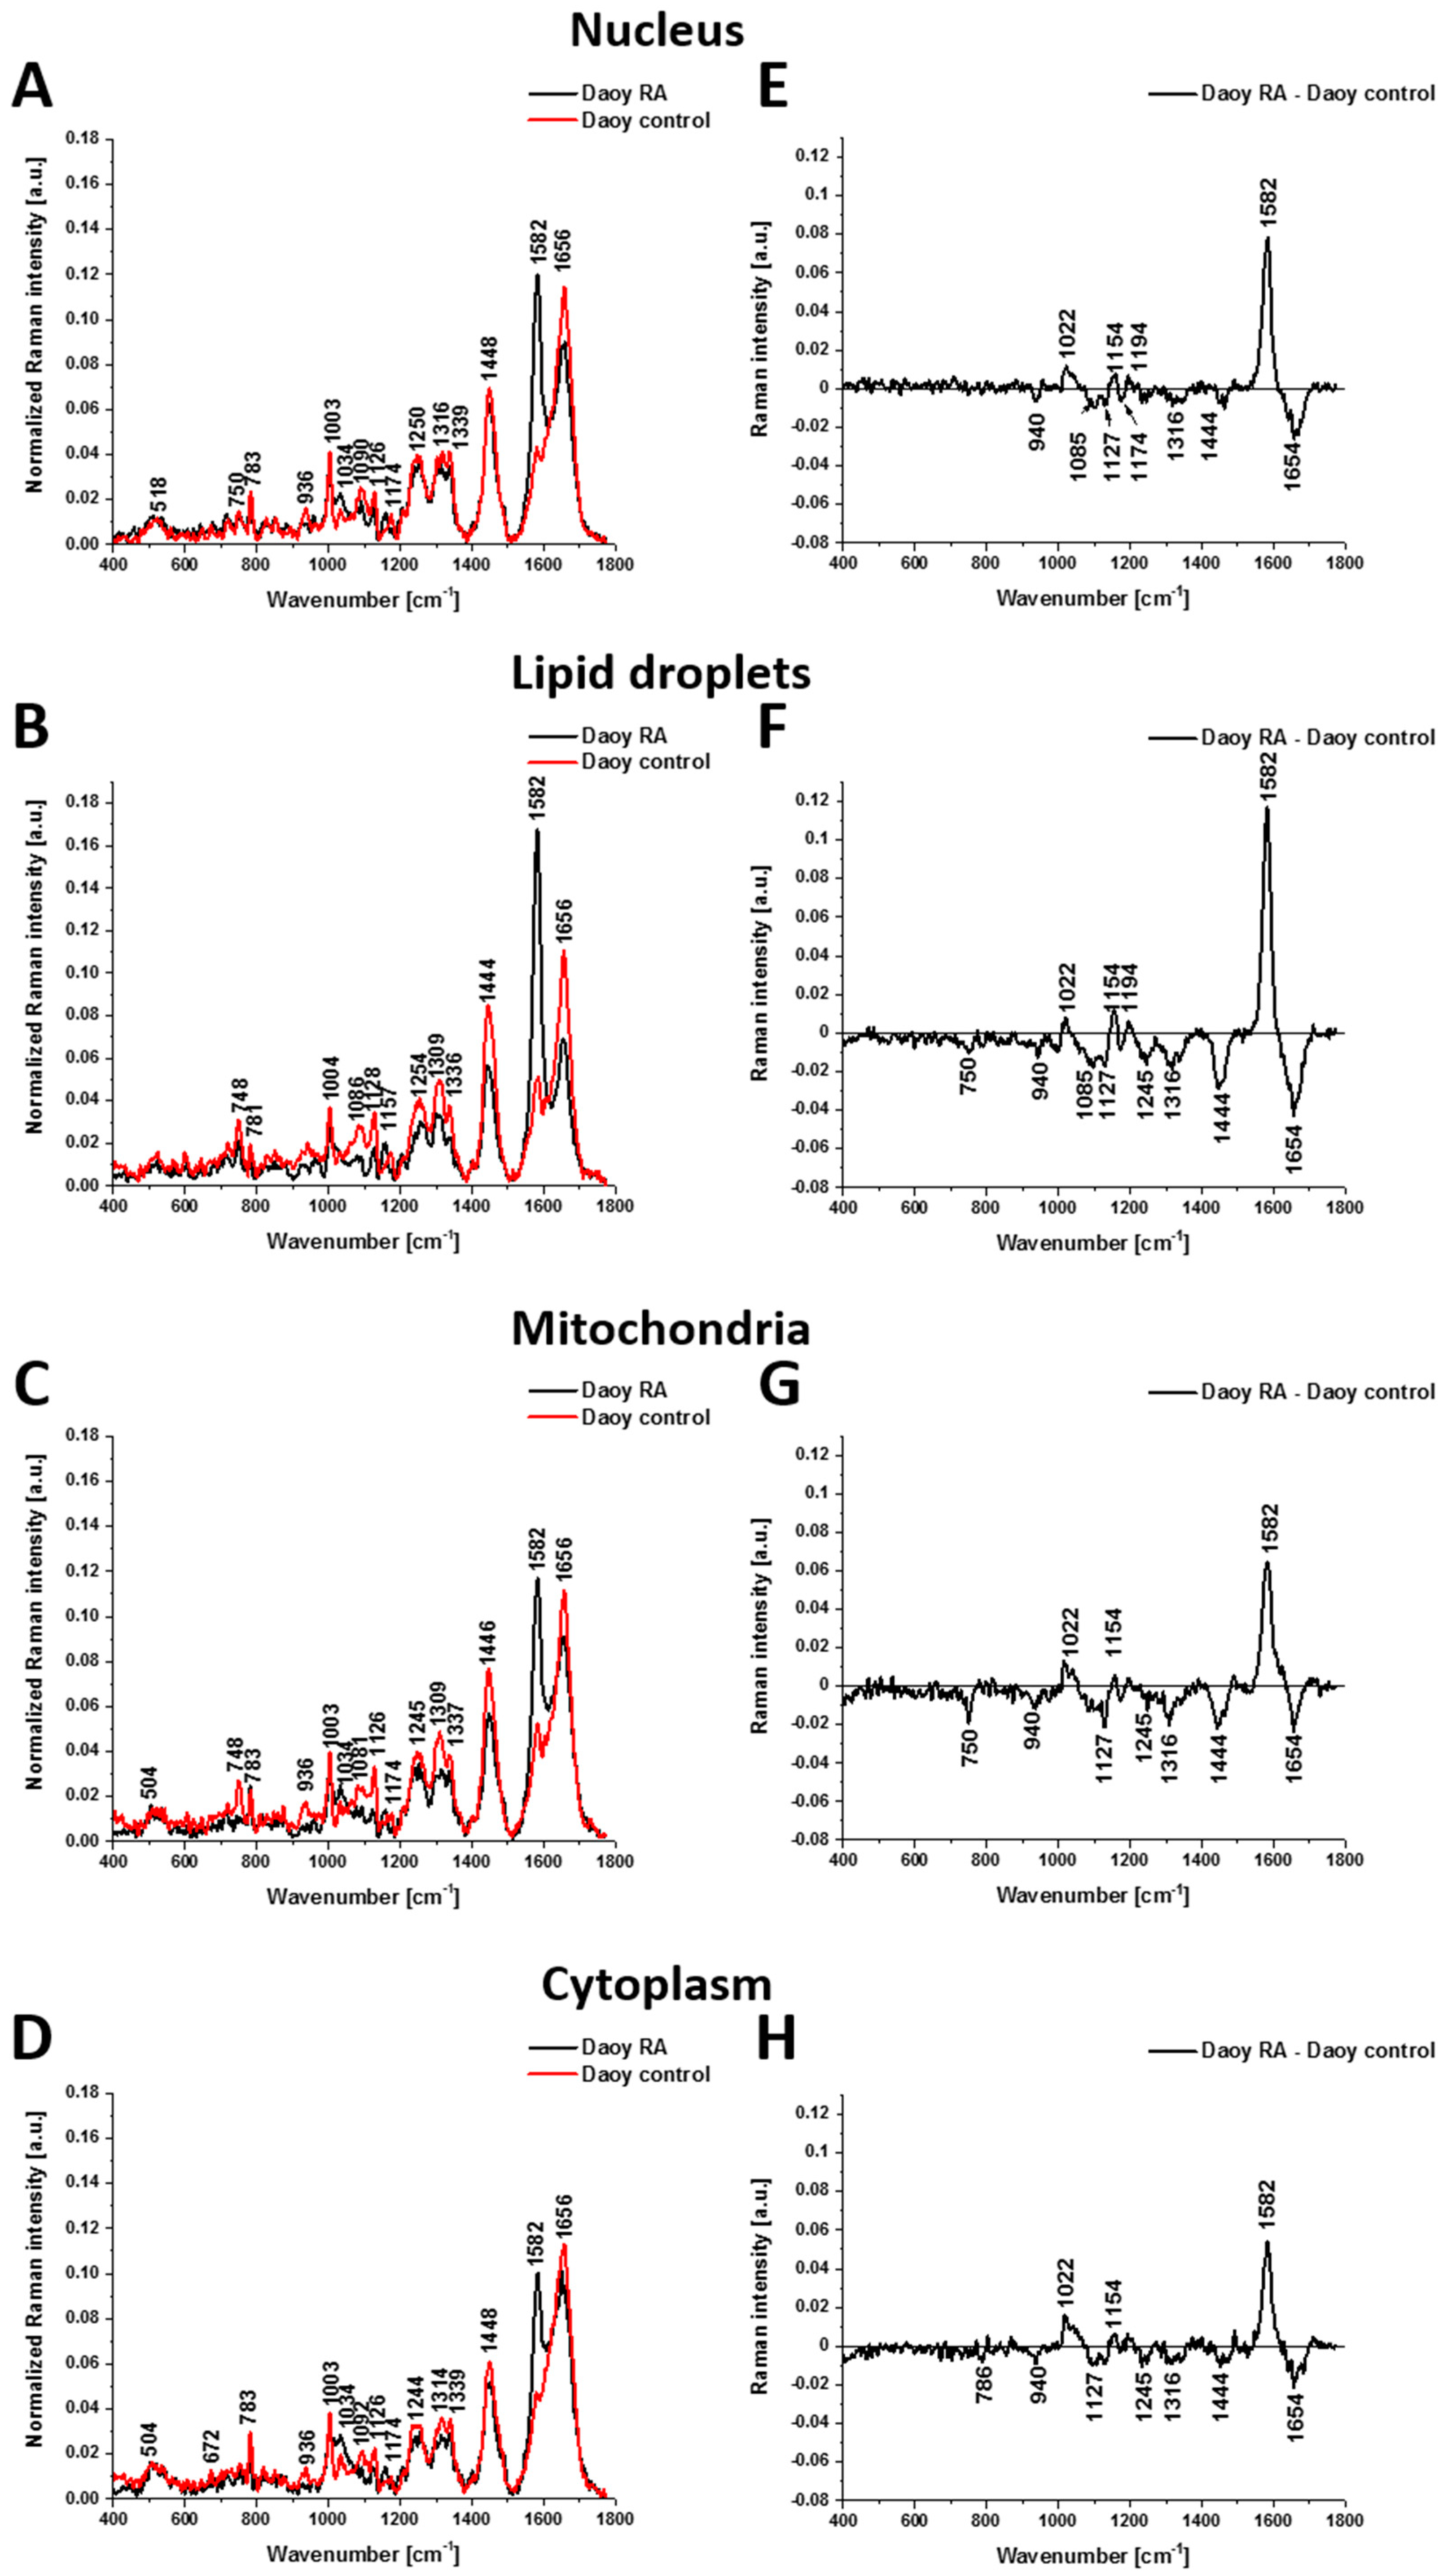
To clarify the role of retinoids in cancer, medulloblastoma cells (DAOY) were incubated with retinoic acid (RA) [78]. Figure 4 shows the Raman spectra of a nucleus, lipid droplets, cytoplasm, and mitochondria in the DAOY cells incubated with RA. As one can see from Figure 4, RA (spectrum marked in black) induces a spectacular effect on the Raman spectra of medulloblastoma cells, particularly on the band at 1582 cm−1 when compared with the control cells (without RA). The amount of reduced cytochrome c is also elevated following in vitro incubation with retinoic acid (Figure 4).
The main advantage of using Raman spectroscopy and imaging is the fact that they can monitor the redox status of cytochromes in mitochondria [78]. It was reported that the intensity of the band at 1584 cm−1 corresponding to the reduced cytochrome c increases drastically upon incubation with retinoic acid for all organelles, but the effect is the strongest for lipid droplets. The Raman biomarker I (1584/1444) (the ratio of Raman intensity of cytochrome c to lipids C-H) for mitochondria increases from 0.69 to 2.40 upon incubation with retinoic acid.
It was reported that the Raman band at 1584 cm−1 is very strong in brain cancer cells when supplemented with both retinol and retinoic acid at 532 nm excitation. In contrast, it has been shown that the Raman signal at 1584 cm−1 in normal brain cells (NHA) is much weaker.
The concentration of retinoic acid in human cells and tissues depends on three groups of enzymes: the alcohol dehydrogenase (ADH) family that converts retinal to retinol, the aldehyde dehydrogenase ALDH (also known as RALDH), that converts retinal to retinoic acid, and the third group, cytochrome enzymes, are critical elements in RA biosynthesis as the major retinoic acid metabolizing enzyme, CYP26A, belonging to the cytochrome family leads to the further oxidation of retinoic acid and converts retinoic acid into more polar compounds, including 4-oxo retinoic acid, which is believed to be transcriptionally inactive (Figure 3). Thus, cytochrome c is the third element in the triangle: carotenoids–retinoids–cytochromes that play a key role in the development and progression of cancer. Little is known about how the expression of cytochromes may influence the development of cancers and immune responses. The role of cytochromes in cancer development will be discussed in the next chapter.

3. The Impact of Cytochrome c on Cancers and Immunity

Impact of Cytochrome c on Immune Cells, Inflammatory Diseases, and Cancer

The critical element in RA biosynthesis is a broad enzyme family of cytochromes, CYP26A, which disrupts RA metabolism by promoting RA catabolism (Figure 3) [79,80,81]. It is not clear how the expression of this enzyme may influence the development of cancer and immune responses. There is a central dogma of immunology that pathogen-associated molecular patterns (PAMPs) and damage-associated molecular patterns (DAMPs) activate the innate immune system by interacting with pattern recognition receptors (PRRs). Endogenous molecules known as DAMPs are released by damaged or dying cells and activate the innate immune system by interacting with PRRs. While DAMPs play a role in the body’s defense mechanisms, they can also trigger harmful inflammatory responses.
Evidence suggests that cytochrome c, when mislocalized, may act as a DAMP and provoke an inflammatory reaction within the immune system in the cytoplasm [82]. Recently, we reported [83] that at normal physiological conditions, cytochrome c is located in the cell mitochondria. At pathological conditions, cytochrome c acts as a DAMP molecule, because it is released to the cytoplasm and extracellular matrix, leading to inflammation. The release of cytochrome c into cytoplasm and circulation is recognized by the immune cells through the same PRRs that recognize pathogen-associated molecular patterns.
The mechanisms of cytochrome c release are controversial. It is suggested that the permeabilization of the outer or the inner membrane is responsible for the downstream events, and this issue is still one of the debated topics. The recently presented results in Abramczyk’s group show direct evidence that cytochrome c is released to the lumen of the breast duct from the epithelial cells in the cancerous duct [83]. Significant differences were observed in the protein and lipid profiles within the lumen and epithelial cells of normal versus cancerous ducts. In breast cancer ducts, cytochrome c, cardiolipin, and palmitic acid were identified as the primary components present in the lumen. By contrast, the lumen of normal ducts was found to be empty and devoid of cytochrome c [83].
It has been demonstrated that the monounsaturated fatty acids dominate the epithelial cells of the normal duct, ensuring the proper membrane fluidity of the epithelial cells, while cardiolipin and palmitic acid are located around the duct in the extracellular matrix. In contrast, epithelial cancerous cells and the lumen are rich in saturated lipids, such as cardiolipin and palmitic acid. Cell membranes, being highly vulnerable to injury, rely on their lipid profile to maintain proper fluidity. The imbalance between saturated and unsaturated fatty acids detected in the epithelial cells of the cancerous duct compromises membrane fluidity, leading to structural deformations and diminished mechanical stability. These fluidity-related changes cause cardiolipin, cytochrome c, and palmitic acid to be expelled from epithelial cells into the lumen. The resulting distortion of epithelial cells enables the release of cytochrome c, which contributes to apoptosis [83].
Recently, Abramczyk et al. showed that cytochrome c is an important cancer driver that controls various aspects of development, proliferation, and malignant progression [78,84]. Briefly, cytochrome c is synthesized from two inactive precursor molecules: apocytochrome c (a protein that is encoded by a nuclear gene and imported into mitochondria) and heme (which is synthesized in mitochondria). The covalent attachment of apocytochrome c to heme is catalyzed by heme lyase and creates cytochrome c, a 14.5 kDa protein that is normally confined between the inner and outer mitochondrial membranes.
Cytochrome c plays a dual role, acting as a mitochondrial redox carrier to transfer electrons between complexes III and IV in the electron transport chain and as a cytoplasmic initiator of apoptosis by triggering the caspase cascade [85]. The oxidized form of the heme group in cytochrome c can accept an electron from complex III and then transfer this electron to complex IV, which is the final protein carrier in the mitochondrial electron-transport chain and serves as a cytoplasmic apoptosis-triggering agent, activating the caspase cascade.
However, routine methods such as enzyme-linked immunosorbent assays (ELISAs), Western blot, high-performance liquid chromatography (HPLC), spectrophotometry, and flow cytometry are unable to monitor the dual roles of cytochrome c in apoptosis and oxidative phosphorylation. These methods cannot specifically measure cytochrome c concentrations within mitochondria, the cytoplasm, or the extracellular matrix, limiting their ability to detect its precise localization. Therefore, existing analytical technologies cannot detect cytochrome c localization inside and outside specific organelles.
In Raman imaging, we do not need to disrupt cells to open up the cells to release the cellular organelles to learn about their biochemical composition. Therefore, Raman imaging provides information about the chemical profile in specific organelles and helps to understand the mechanisms governing the role of cytochrome c in cancers. Our results demonstrated that cytochrome c is a key protein that is needed to maintain life (respiration) and cell death (apoptosis) [52,83,84]. To ask whether cytochrome c makes decisions on life and death, we analyzed the vibrations of cytochrome c in animal brains and in human brains by Raman imaging [80].
Figure 5 shows cytochrome c activity in the animal brain.
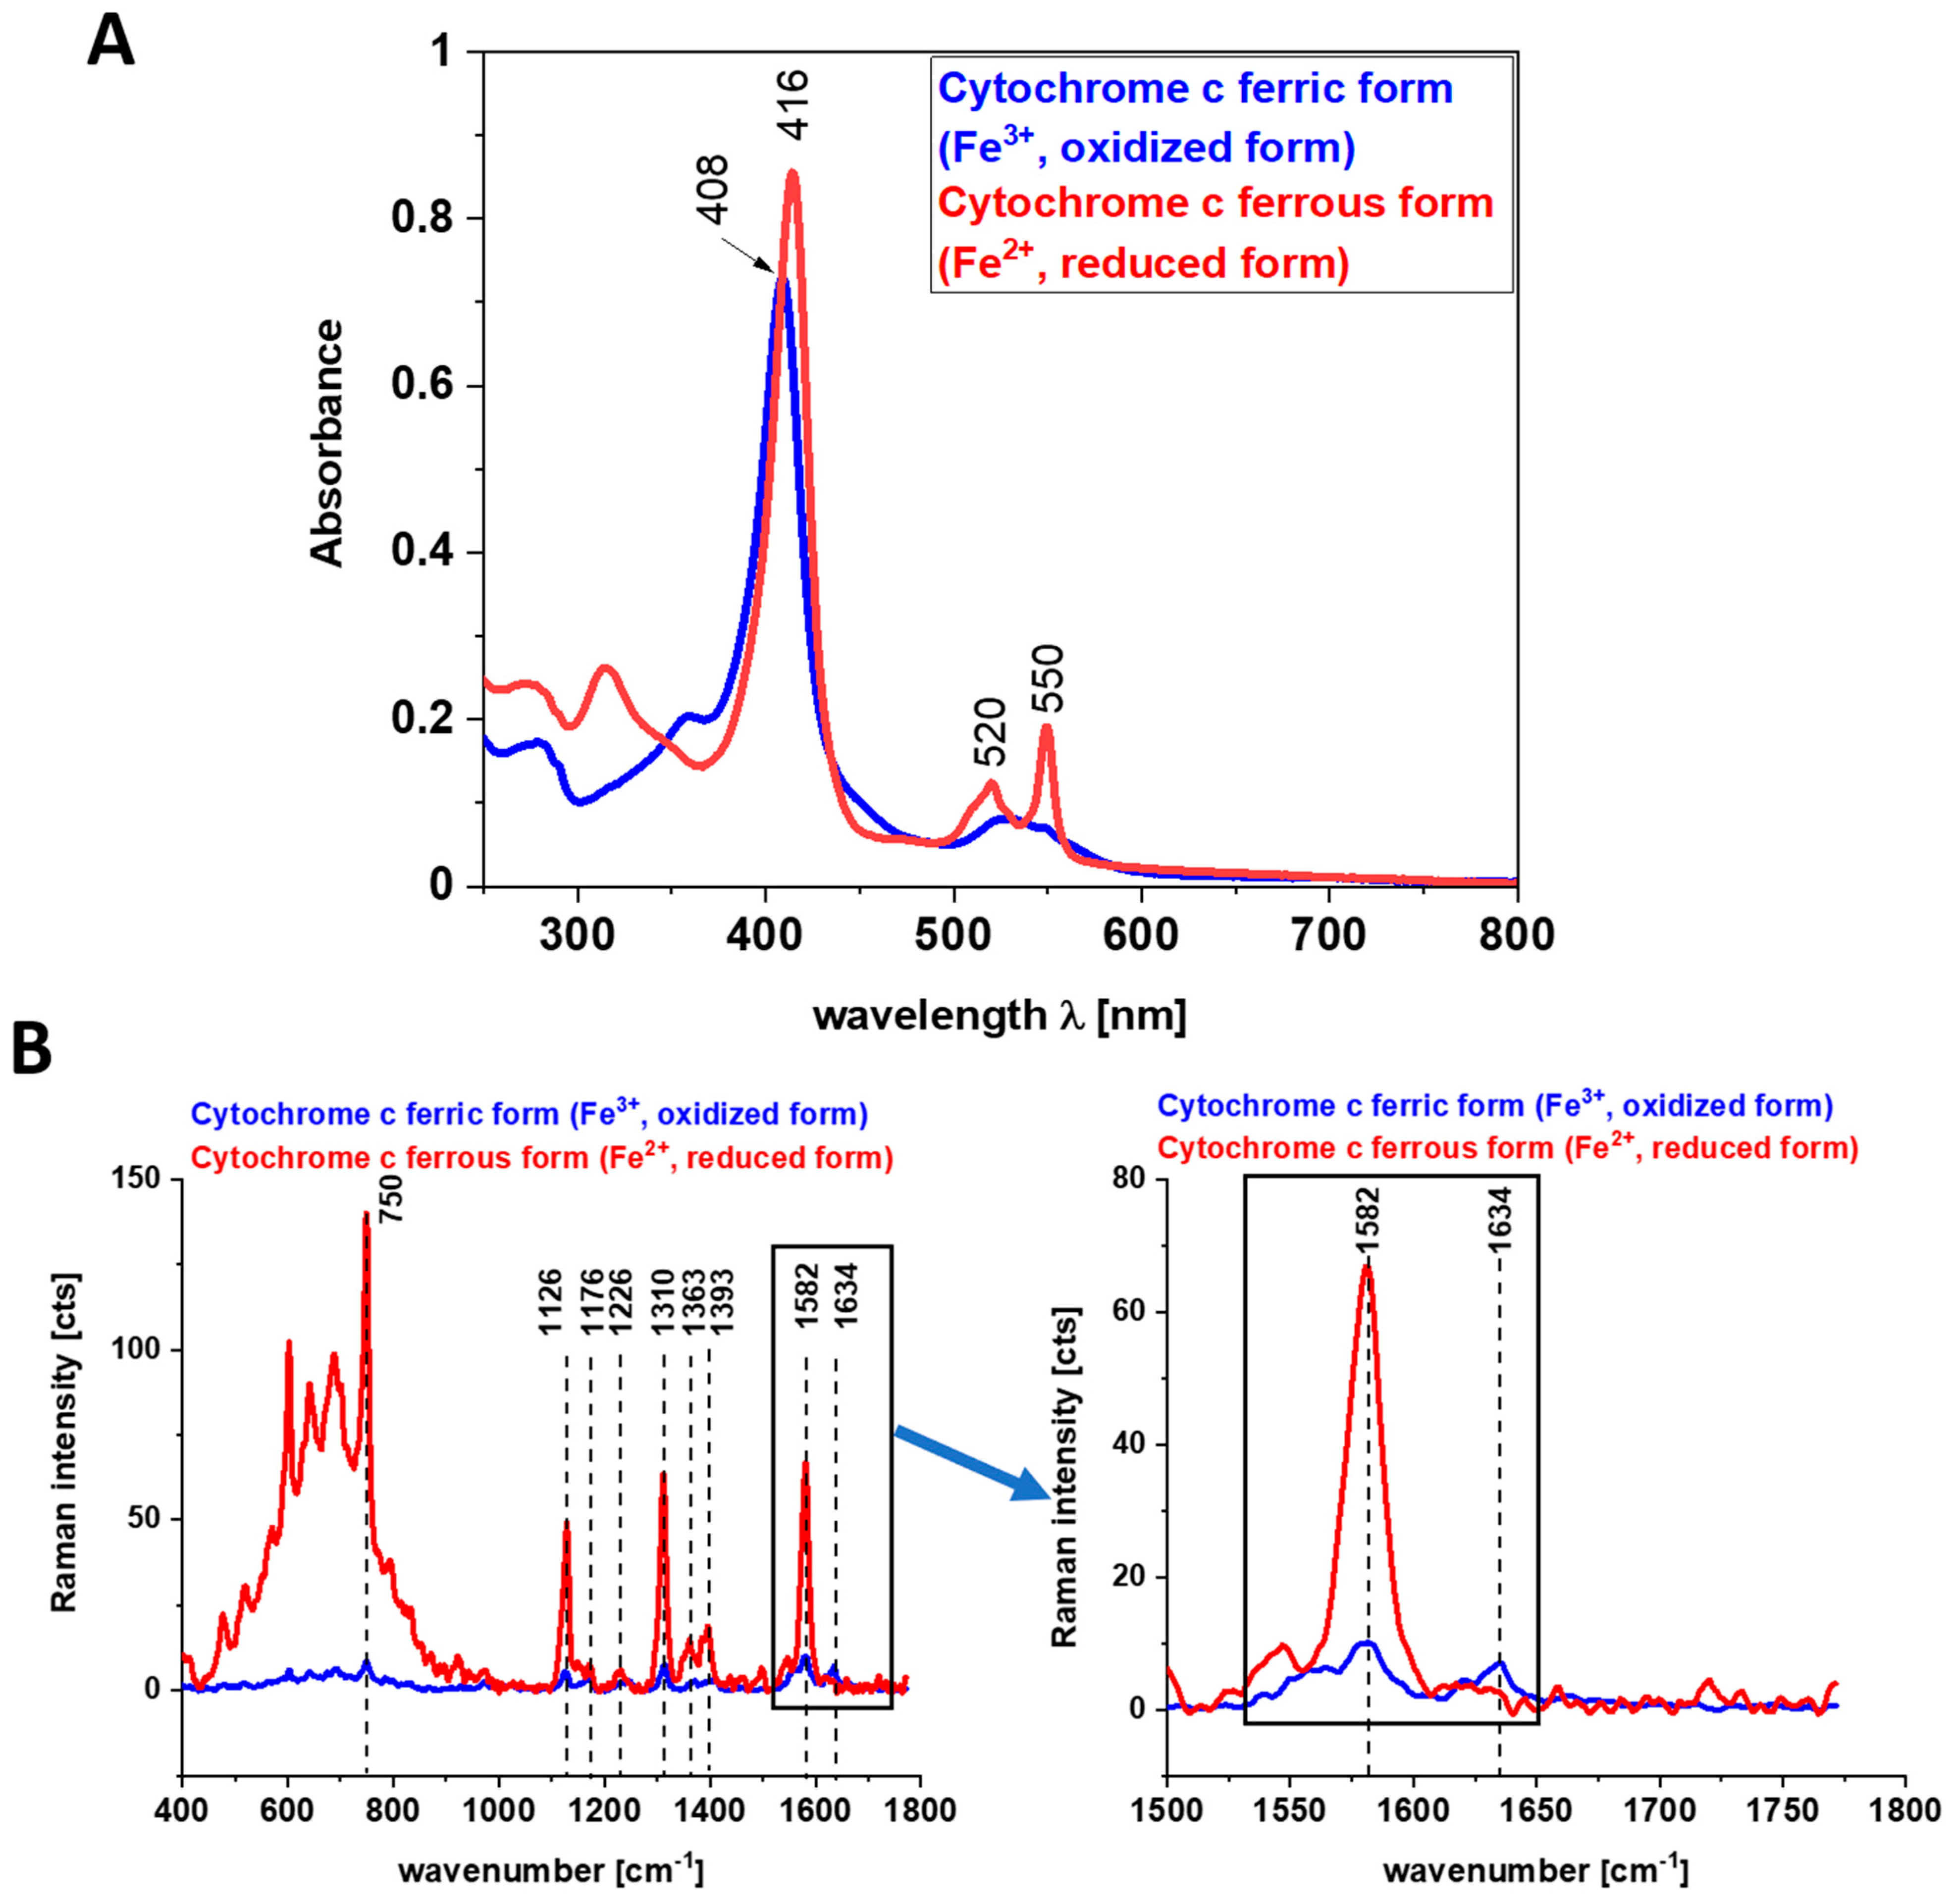
The arrows in Figure 5 show the vibrations of cytochrome c. What is especially striking is the v19 mode (1584 cm−1), corresponding to the methine bridge vibrations, which produces one of the most prominent bands in the Raman spectrum excited at 532 nm corresponding to the Q absorption band of cytochrome c (Figure 6A). The peaks at 750, 1126, and 1310 cm−1 also belong to cytochrome c. The Raman bands of the reduced form have higher intensities than the oxidized forms of cytochrome c, as one can see from Figure 6B.
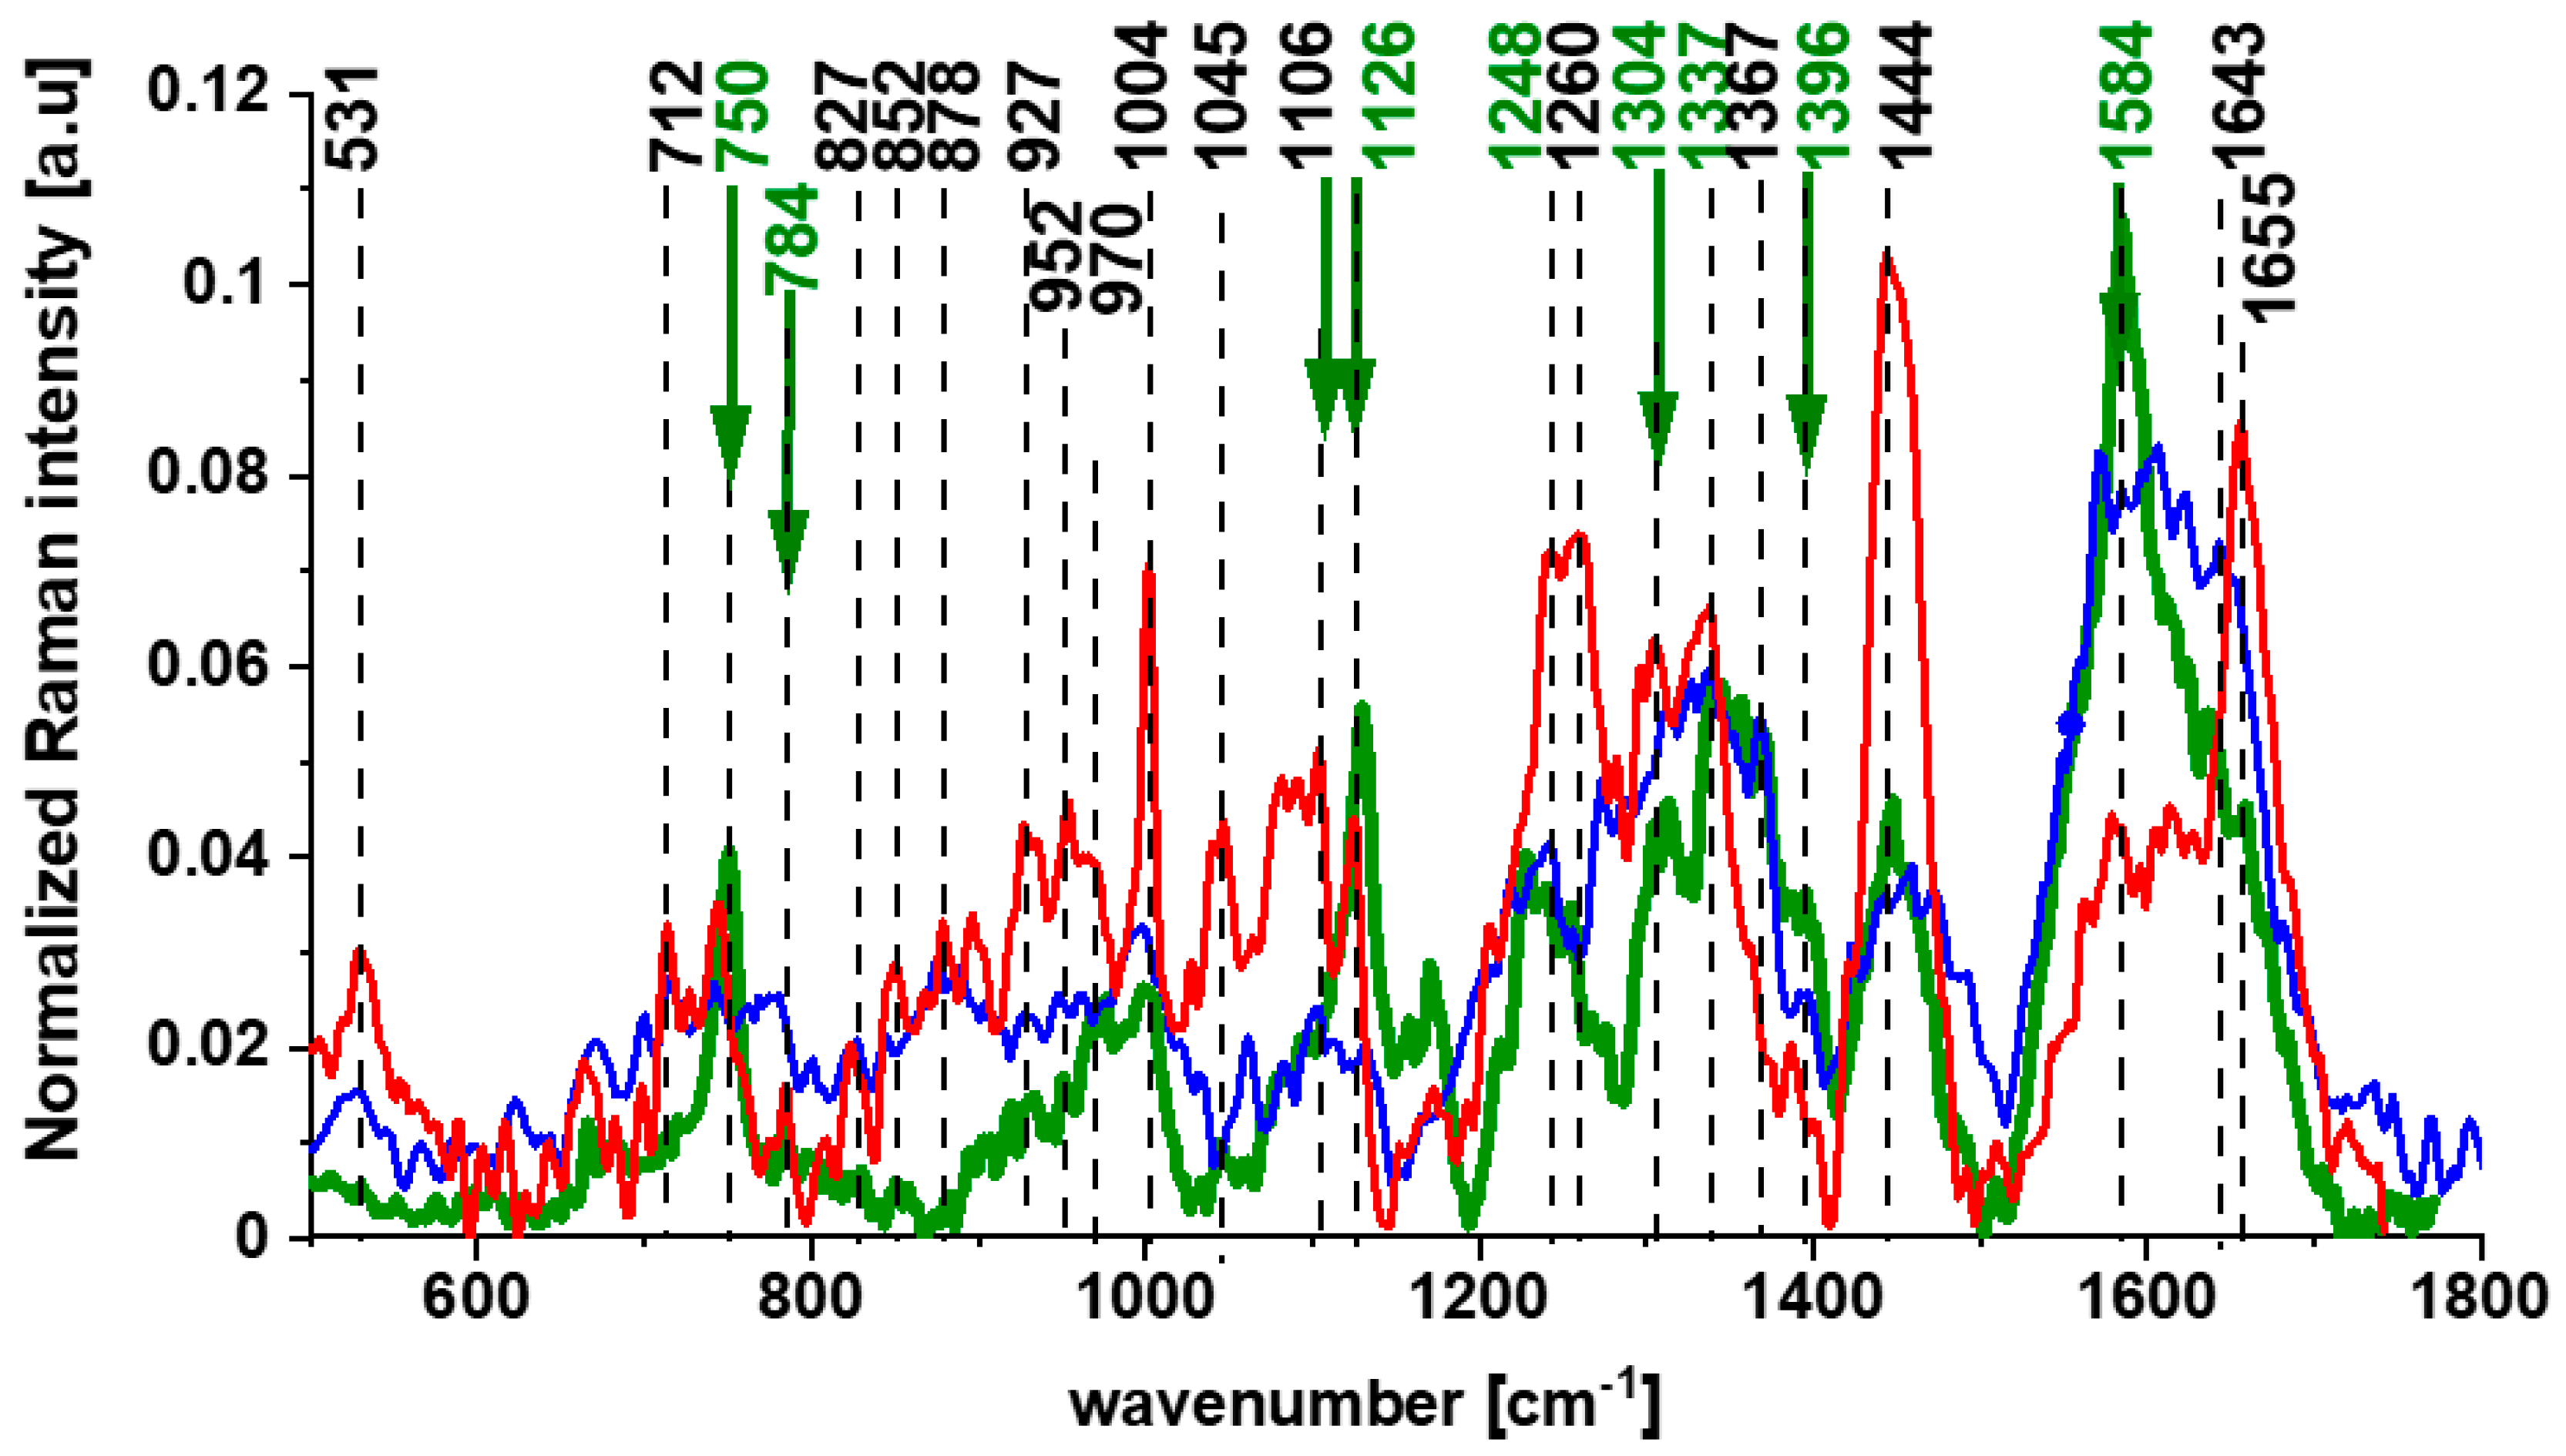
Because of the results for animal brains, it would be extremely valuable to control cytochrome activity in humans. To help address these challenges, we examined the Raman spectra of cytochromes for the ex vivo human brain tissue of highly aggressive medulloblastoma (Figure 7) [84].
Note that the same as for animal brain resonance Raman enhancement is observed for the human brain tissue at 532 nm. The most significant resonance Raman enhancement at 532 nm is observed for the reduced forms of cytochrome c at c.a. 1584 cm−1 (Figure 6B) [84]. Similar effects were obtained for breast cancer [80].
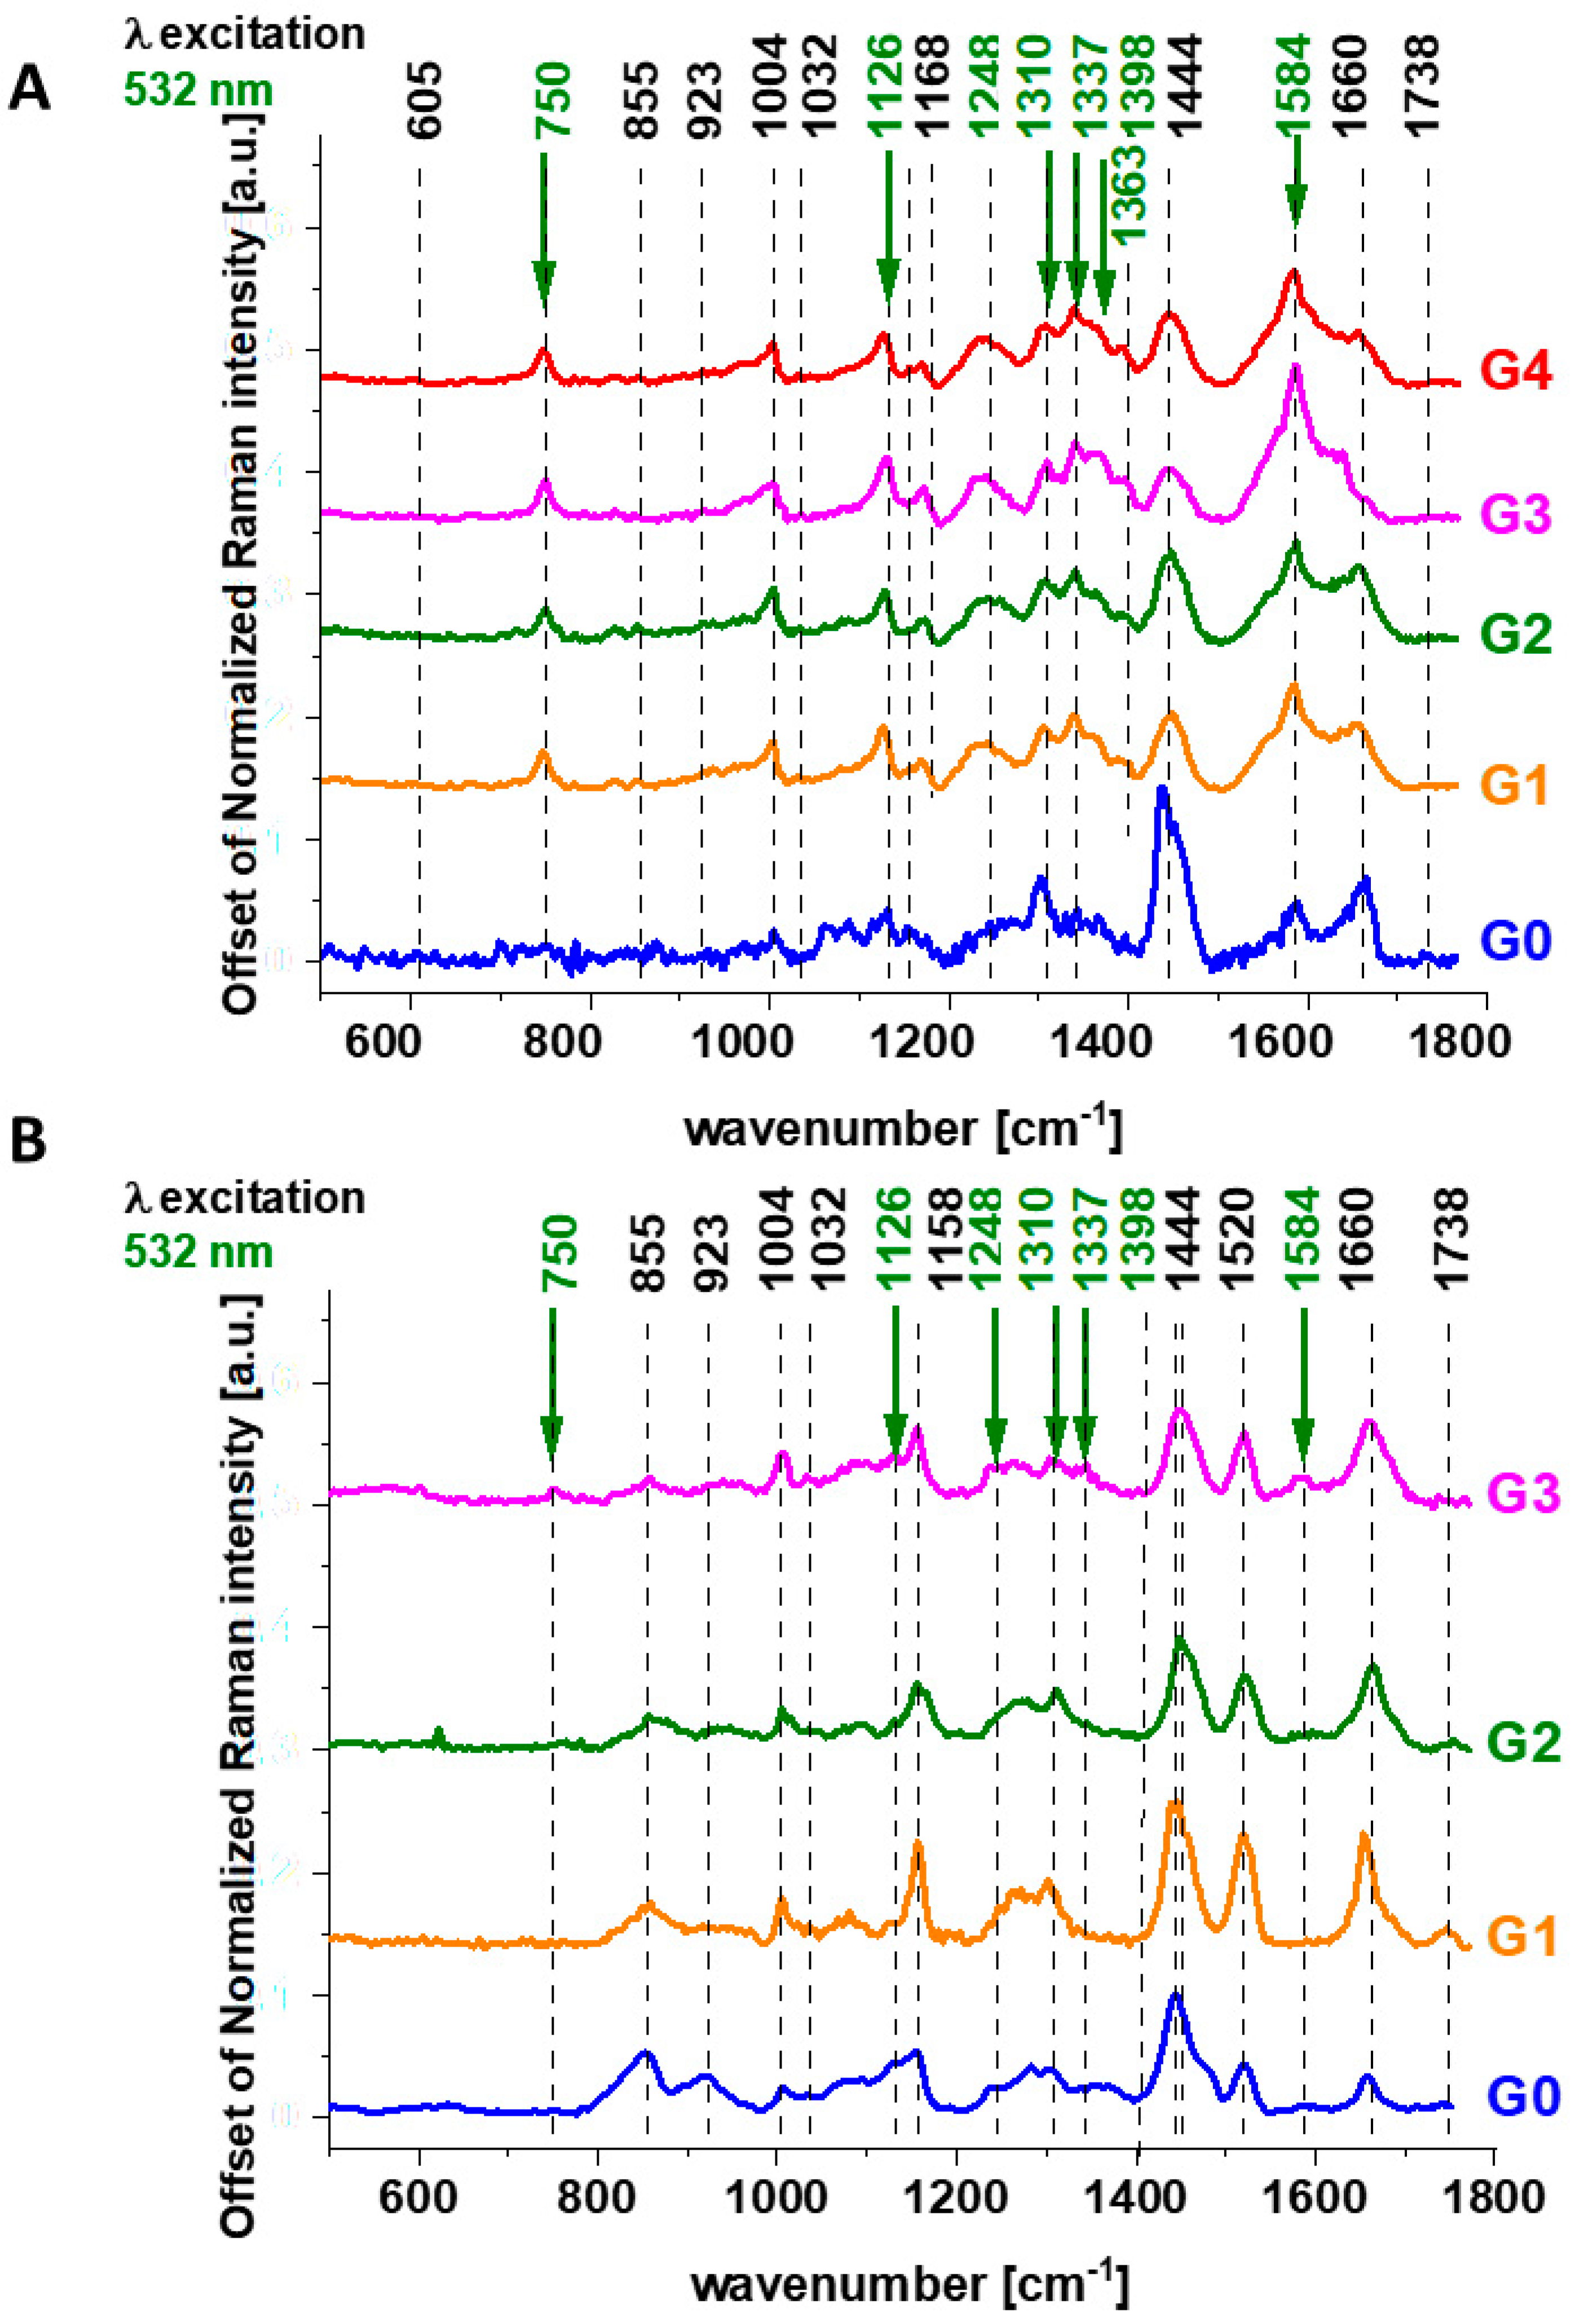
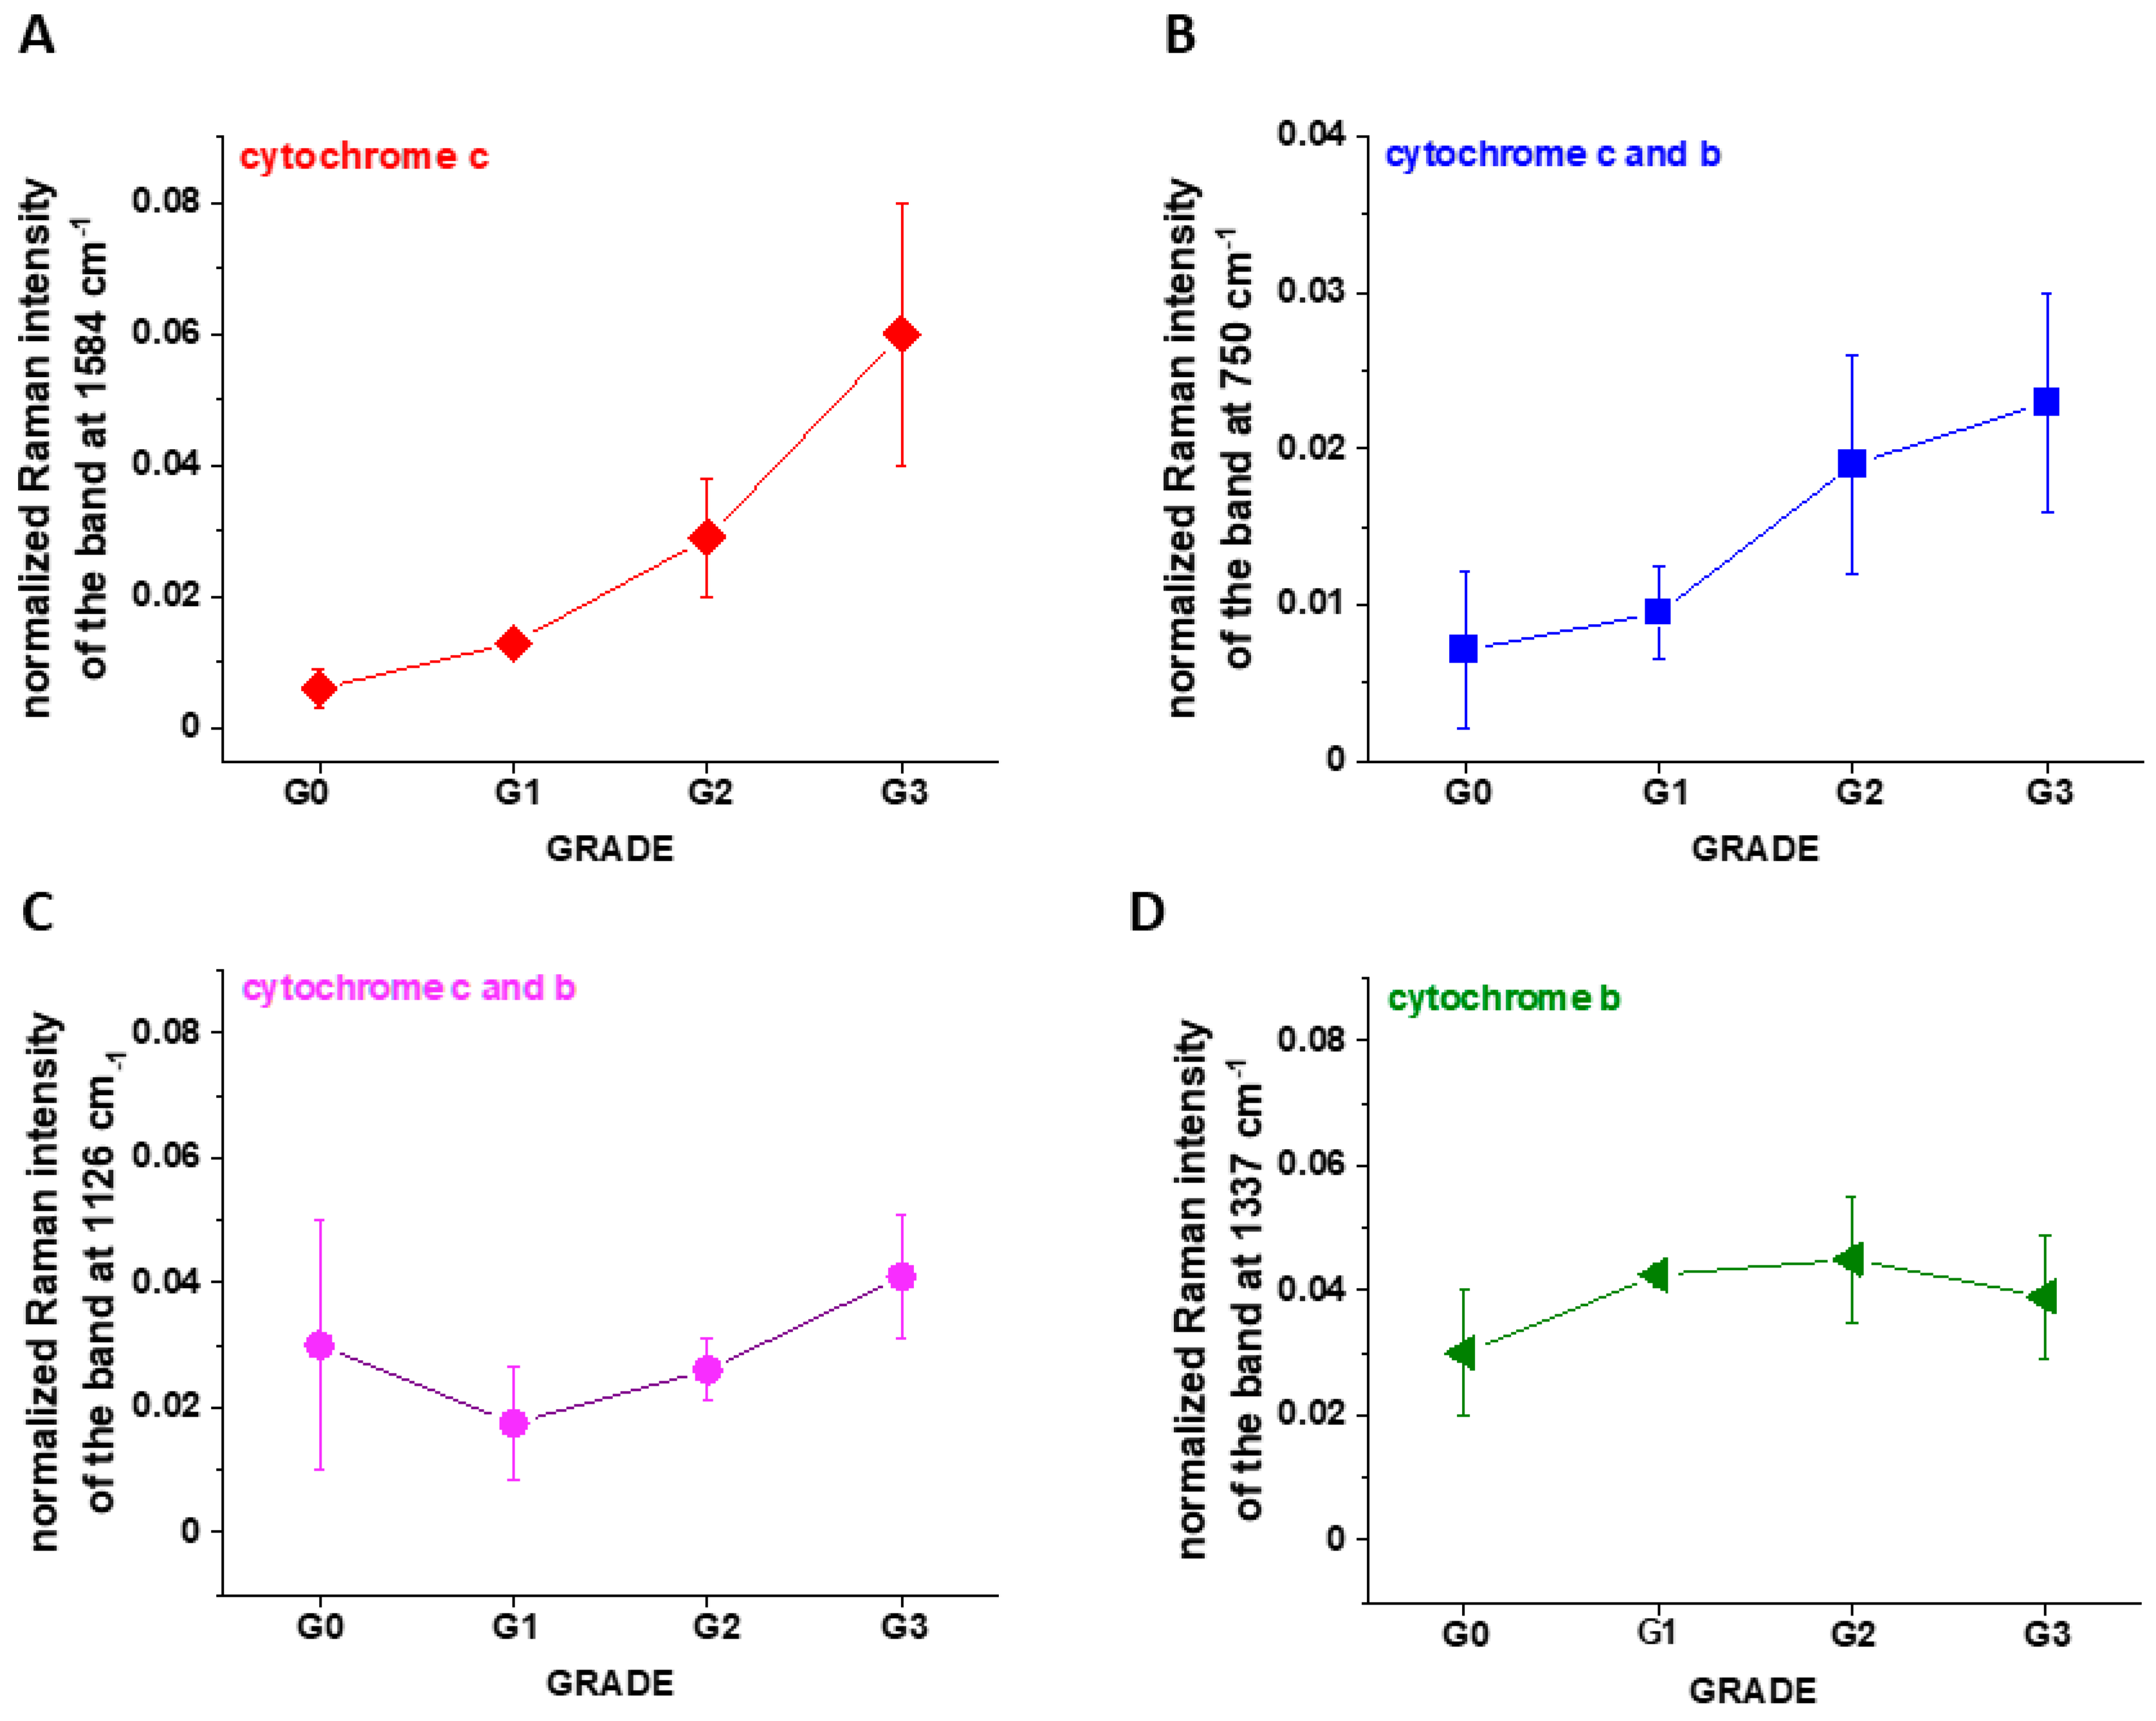
To check whether the redox state of cytochrome c is related to the brain and breast cancer aggressiveness, the Raman redox state biomarkers represented by the Raman intensity of 1584 cm−1 and some other cytochromes Raman vibrations were analyzed [84]. The results are presented in Figure 8 and Figure 9. It is evident that for human breast tissue, the Raman intensity of cytochrome c increases with cancer aggressiveness.
The results obtained in Ref. [84] found a relation between the concentration of cytochrome c and breast cancer aggressiveness. A similar correlation was obtained for brain cancer [84]. Figure 10 shows the Raman intensities of cytochrome c and cytochrome b in human brain tissue: I1584 (A) and I1337 (B) as a function of brain tumor grade malignancy G0–G4 at laser excitation at 532 nm.
It was reported [84] that for human brain tissue, the Raman intensity of cytochrome c first increases with cancer aggressiveness, while for the most aggressive grade IV, it decreases again. The level of cytochrome b does not change.
So far, no available technology has demonstrated the ability to measure cytochrome c concentrations within specific organelles. Consequently, existing analytical techniques cannot comprehensively determine the localization of cytochrome c within and outside organelles. To check if vibrations of cytochrome c can be used for pathology assessment in living cells, we analyzed the Raman spectra of brain and breast cancer cell lines within in vitro incubation.
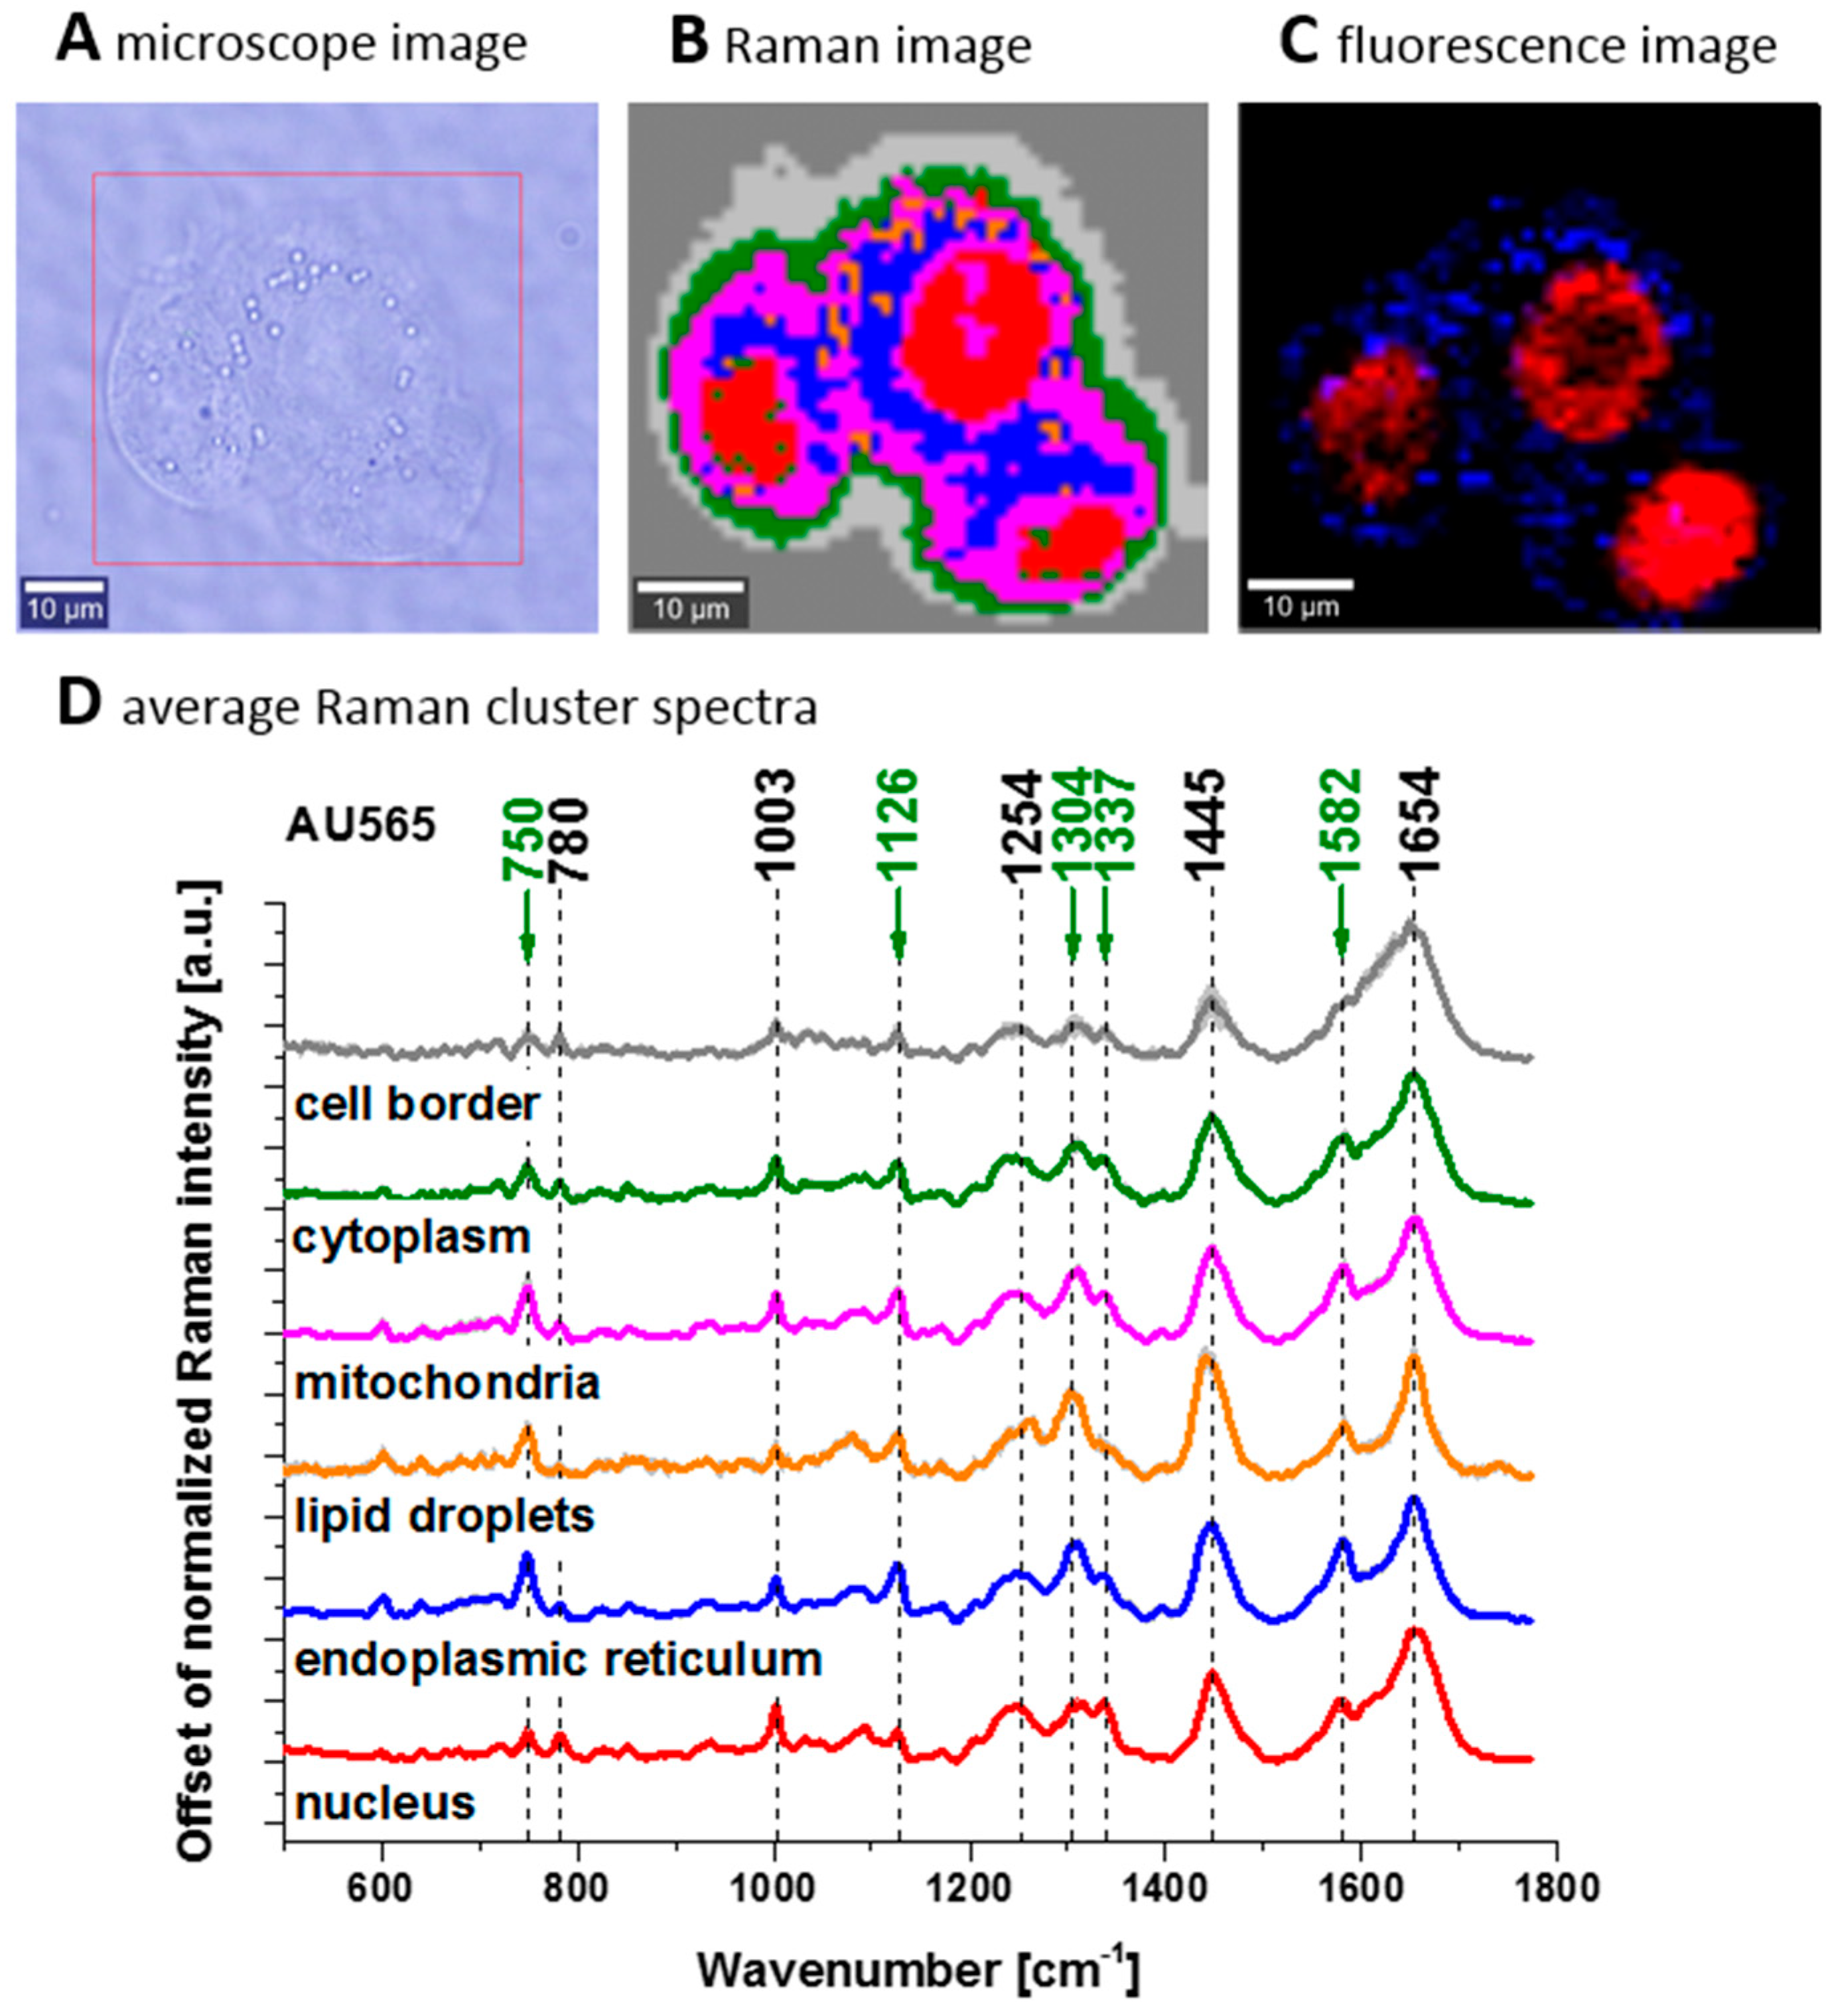
Figure 11 shows that the cytochrome c vibrations are visible in specific organelles of cells within in vitro conditions. Therefore, the Raman approach will be very useful in learning about the mechanisms of cytochrome c release to the cytoplasm and affecting breast cancer. Let us concentrate on the vibration of cytochrome c at 1582 cm−1. The Raman intensities demonstrate that cancer cells represent the oxidized cytochrome c Fe3+ rather than the reduced cytochrome c Fe2+ that dominates in the cancer tissues presented so far.
This striking trend for in vitro cells, which is opposite to that observed in tissues (Figure 12), suggests the important role the extracellular matrix plays in cancer metabolism [78,80]. To study the effect of the extracellular matrix, the authors [80] compared the correlation between the concentration of cytochrome c vs. cancer aggressiveness for human tissues and in vitro cell cultures.
Their results, presented in Figure 12, confirm the importance of tumor microenvironment within the immediate vicinity of tumor cells such as fibroblasts, immune cells, and the extracellular matrix. It was found that the Raman ratio I(1584/1444) is particularly important as a biomarker of brain cancer malignancy. It was found that the plots of the Raman intensities of the bands at 1584 and 1444 cm−1 (Figure 12) provide an important cell-physiologic response; normally cytochrome c operates at a low, basal level in normal cells, but it is strongly induced to very high levels in pathological cancer states.

4. Conclusions

This review aimed to highlight the potential of Raman spectroscopy and imaging, which give new hope for cancer research and diagnosis by monitoring changes in the metabolic pathways of carotenoids, retinoids, and cytochromes. Those techniques offer unsurpassed sensitivity, multiplexing capabilities, and biochemical selectivity and specificity to the field of the molecular imaging of cancer progression.
The Raman research in the field of brain and breast cancer cell metabolism suggests that the triangle—carotenoids–retinoids–cytochromes c—is an important cancer driver, controlling various aspects of development, proliferation, and malignant progression. Cancer is a multidimensional disease that needs balance between the enzymes controlling the disappearance of carotenoids, the production of retinoids (particularly retinoic acid), and the concentration of cytochromes (particularly cytochrome c): beta-carotene-15,15′-oxygenase (CMOI, CMOII), the aldehyde dehydrogenase 1 family of enzymes (ALDH 1 or RALDH), different forms of alcohol dehydrogenase (ADH) from the MDR superfamily, a variety of retinol dehydrogenases (RDHs) from the SDR, and enzymes that belong to the cytochrome P450 (CYP) 26 family converting retinoic acid into more polar compounds, including 4-oxo retinoic acid, which are believed to be transcriptionally inactive.
It was reported that a change in the cellular redox status of cytochrome c is a particularly important factor controlling various aspects of malignant progression. The results of the Raman imaging demonstrated a redox imbalance in human cancer tissue, driven by the upregulation of the reduced Fe2+ form of cytochrome c. The concentration of reduced cytochrome c is significantly higher in cancer tissue than in normal tissue.
In addition, breast and brain tumors exhibit higher levels of de novo lipogenesis compared to normal cells. These results emphasize the significant role of the extracellular matrix in the mechanisms underlying oxidative phosphorylation and apoptosis.

Author Contributions

Writing—original draft preparation, H.A., M.K. and J.S.; writing—review and editing, J.S., M.K. and H.A.; funding acquisition, H.A. All authors have read and agreed to the published version of the manuscript.

Funding

This work was supported by the National Science Centre of Poland (Narodowe Centrum Nauki, UMO-2021/43/B/ST4/01547).

Institutional Review Board Statement

Not applicable.

Informed Consent Statement

Not applicable.

Data Availability Statement

No new data were created or analyzed in this study. Data sharing is not applicable to this article.

Conflicts of Interest

The authors declare no competing interests. The funders had no role in the design of the study; in the collection, analyses, or interpretation of the data; in the writing of the manuscript, or in the decision to publish the results.

References

  1. Surmacki, J.; Brozek-Pluska, B.; Kordek, R.; Abramczyk, H. The Lipid-Reactive Oxygen Species Phenotype of Breast Cancer. Raman Spectroscopy and Mapping, PCA and PLSDA for Invasive Ductal Carcinoma and Invasive Lobular Carcinoma. Molecular Tumorigenic Mechanisms beyond Warburg Effect. Analyst 2015, 140, 2121–2133. [Google Scholar] [CrossRef]
  2. Haka, A.S.; Shafer-Peltier, K.E.; Fitzmaurice, M.; Crowe, J.; Dasari, R.R.; Feld, M.S. Diagnosing Breast Cancer by Using Raman Spectroscopy. Proc. Natl. Acad. Sci. USA 2005, 102, 12371–12376. [Google Scholar] [CrossRef] [PubMed]
  3. Abramczyk, H.; Brozek-Pluska, B.; Surmacki, J.; Jablonska-Gajewicz, J.; Kordek, R. Raman “optical Biopsy” of Human Breast Cancer. Prog. Biophys. Mol. Biol. 2012, 108, 74–81. [Google Scholar] [CrossRef]
  4. Brozek-Pluska, B.; Musial, J.; Kordek, R.; Bailo, E.; Dieing, T.; Abramczyk, H. Raman Spectroscopy and Imaging: Applications in Human Breast Cancer Diagnosis. Analyst 2012, 137, 3773–3780. [Google Scholar] [CrossRef]
  5. Surmacki, J.; Musial, J.; Kordek, R.; Abramczyk, H. Raman Imaging at Biological Interfaces: Applications in Breast Cancer Diagnosis. Mol. Cancer 2013, 12, 48. [Google Scholar] [CrossRef] [PubMed]
  6. Abramczyk, H.; Brozek-Pluska, B. Raman Imaging in Biochemical and Biomedical Applications. Diagnosis and Treatment of Breast Cancer. Chem. Rev. 2013, 113, 5766–5781. [Google Scholar] [CrossRef]
  7. Jain, G.K.; Verma, R.; Chougule, A.; Singh, B. Scientific Advances in Cancer Detection Using Raman Spectroscopy. Asian Pac. J. Cancer Prev. 2024, 25, 3977–3986. [Google Scholar] [CrossRef] [PubMed]
  8. Abramczyk, H.; Surmacki, J. Effect of COVID-19 mRNA Vaccine on Human Lung Carcinoma Cells In Vitro by Means of Raman Spectroscopy and Imaging. ACS Omega 2023, 8, 42555–42564. [Google Scholar] [CrossRef]
  9. Conforti, P.M.; Lazzini, G.; Russo, P.; D’Acunto, M. Raman Spectroscopy and AI Applications in Cancer Grading: An Overview. IEEE Access 2024, 12, 54816–54852. [Google Scholar] [CrossRef]
  10. Aizezi, N.; Ye, Y.; Chen, Z.; Liu, Y. Impact of Soldering Temperatures on Heavy Metal and Dust Emissions: A LIBS-Based Environmental Pollution Analysis. Spectrochim. Acta Part B At. Spectrosc. 2025, 225, 107124. [Google Scholar] [CrossRef]
  11. Tapiero, H.; Townsend, D.M.; Tew, K.D. The Role of Carotenoids in the Prevention of Human Pathologies. Biomed. Pharmacother. 2004, 58, 100–110. [Google Scholar] [CrossRef] [PubMed]
  12. Bertram, J.S.; Vine, A.L. Cancer Prevention by Retinoids and Carotenoids: Independent Action on a Common Target. Biochim. Biophys. Acta Mol. Basis Dis. 2005, 1740, 170–178. [Google Scholar] [CrossRef] [PubMed]
  13. Tanaka, T.; Shnimizu, M.; Moriwaki, H. Cancer Chemoprevention by Carotenoids. Molecules 2012, 17, 3202–3242. [Google Scholar] [CrossRef] [PubMed]
  14. Elliott, R. Mechanisms of Genomic and Non-Genomic Actions of Carotenoids. Biochim. Biophys. Acta Mol. Basis Dis. 2005, 1740, 147–154. [Google Scholar] [CrossRef]
  15. Krinsky, N.I.; Johnson, E.J. Carotenoid Actions and Their Relation to Health and Disease. Mol. Asp. Med. 2005, 26, 459–516. [Google Scholar] [CrossRef]
  16. Nishino, H. Cancer Prevention by Carotenoids. Mutat. Res. Fundam. Mol. Mech. Mutagen. 1998, 402, 159–163. [Google Scholar] [CrossRef]
  17. Chedea, V.S.; Jisaka, M. Lipoxygenase and Carotenoids: A Co-Oxidation Story. Afr. J. Biotechnol. 2013, 12, 2786–2791. [Google Scholar]
  18. Giovannucci, E. Lycopene and Prostate Cancer Risk. Methodological Considerations in the Epidemiologic Literature. Pure Appl. Chem. 2002, 74, 1427–1434. [Google Scholar] [CrossRef]
  19. Shultz, T.D.; Chew, B.P.; Seaman, W.R.; Luedecke, L.O. Inhibitory Effect of Conjugated Dienoic Derivatives of Linoleic Acid and β-Carotene on the in Vitro Growth of Human Cancer Cells. Cancer Lett. 1992, 63, 125–133. [Google Scholar] [CrossRef]
  20. Mayne, S.T.; Cartmel, B.; Scarmo, S.; Lin, H.; Leffell, D.J.; Welch, E.; Ermakov, I.; Bhosale, P.; Bernstein, P.S.; Gellermann, W. Noninvasive Assessment of Dermal Carotenoids as a Biomarker of Fruit and Vegetable Intake. Am. J. Clin. Nutr. 2010, 92, 794–800. [Google Scholar] [CrossRef]
  21. Institute of Medicine (US) Panel on Dietary Antioxidants and Related Compounds. Dietary Reference Intakes for Antioxidants; Vitamin C, Vitamin E, Seenium and Carotenoids. J. Am. Diet. Assoc. 2000, 100, 637–640. [Google Scholar] [CrossRef] [PubMed]
  22. Peng, Y.M.; Peng, Y.S.; Lin, Y.; Moon, T.; Roe, D.J.; Ritenbaugh, C. Concentrations and Plasma-Tissue-Diet Relationships of Carotenoids, Retinoids, and Tocopherols in Humans. Nutr. Cancer 1995, 23, 233–246. [Google Scholar] [CrossRef]
  23. McEligot, A.J.; Rock, C.L.; Flatt, S.W.; Newman, V.; Faerber, S.; Pierce, J.P. Plasma Carotenoids Are Biomarkers of Long-Term High Vegetable Intake in Women with Breast Cancer. J. Nutr. 1999, 129, 2258–2263. [Google Scholar] [CrossRef]
  24. Trial, P.P.; Lanza, E.; Schatzkin, A.; Daston, C.; Corle, D.; Freedman, L.; Ballard-barbash, R.; Caan, B.; Lance, P.; Marshall, J.; et al. Implementation of a 4-y, high-fiber, high-fruit-and-vegetable, low-fat dietary intervention: Results of dietary changes in the Polyp Prevention Trial. Am. J. Clin. Nutr. 2001, 74, 387–401. [Google Scholar]
  25. Marmot, M.; Atinmo, T.; Byers, T. Food, Nutrition, Physical Activity and the Prevention of Cancer: A Global Perspective; American Institute for Cancer Research: Washington, DC, USA, 2007; Volume 148, ISBN 9780972252225. [Google Scholar]
  26. Liu, S.; Manson, J.E.; Lee, I.M.; Cole, S.R.; Hennekens, C.H.; Willett, W.C.; Buring, J.E. Fruit and Vegetable Intake and Risk of Cardiovascular Disease: The Women’s Health Study. Am. J. Clin. Nutr. 2000, 72, 922–928. [Google Scholar] [CrossRef]
  27. Kristal, A.R.; Peters, U.; Potter, J.D. Is It Time to Abandon the Food Frequency Questionnaire? Cancer Epidemiol. Biomark. Prev. 2005, 14, 2826–2828. [Google Scholar] [CrossRef] [PubMed]
  28. Semba, R.D.; Ferrucci, L.; Cappola, A.R.; Ricks, M.O.; Ray, A.L.; Xue, Q.L.; Guralnik, J.M.; Fried, L.P. Low Serum Selenium Is Associated with Anemia among Older Women Living in the Community: The Women’s Health and Aging Studies I and II. Biol. Trace Elem. Res. 2006, 112, 97–107. [Google Scholar] [CrossRef]
  29. van Poppel, G.; van den Berg, H. Vitamins and Cancer. Cancer Lett. 1997, 114, 195–202. [Google Scholar] [CrossRef]
  30. van Poppel, G. Carotenoids and Cancer: An Update with Emphasis on Human Intervention Studies. Eur. J. Cancer 1993, 29, 1335–1344. [Google Scholar] [CrossRef]
  31. Ruano-Ravina, A.; Figueiras, A.; Barros-Dios, J. Diet and Lung Cancer: A New Approach. Eur. J. Cancer Prev. 2000, 9, 395–400. [Google Scholar] [CrossRef]
  32. DiGiovanna, J.J. Retinoid Chemoprevention in Patients at High Risk for Skin Cancer. Med. Pediatr. Oncol. 2001, 36, 564–567. [Google Scholar] [CrossRef] [PubMed]
  33. Cho, E.; Spiegelman, D.; Hunter, D.J.; Chen, W.Y.; Zhang, S.M.; Colditz, G.A.; Willett, W.C. Premenopausal Intakes of Vitamins A, C, and E, Folate, and Carotenoids, and Risk of Breast Cancer. Cancer Epidemiol. Biomark. Prev. 2003, 12, 713–720. [Google Scholar]
  34. Cook, N.R.; Stampfer, M.J.; Ma, J.; Manson, J.A.E.; Sacks, F.M.; Buring, J.E.; Hennekens, C.H. Β-Carotene Supplementation for Patients With Low Baseline Levels and Decreased Risks of Total and Prostate Carcinoma. Cancer 1999, 86, 1783–1792. [Google Scholar] [CrossRef]
  35. Ritenbaugh, C. Carotenoids and Cancer. Nutr. Today 1987, 21, 14–19. [Google Scholar] [CrossRef]
  36. Ziegler, R.G. Vegetables, Fruits, and Carotenoids and the Risk of Cancer. Am. J. Clin. Nutr. 1991, 53, 251S–259S. [Google Scholar] [CrossRef]
  37. Gallicchio, L.; Boyd, K.; Matanoski, G.; Tao, X.; Chen, L.; Lam, T.K.; Shiels, M.; Hammond, E.; Robinson, K.A.; Caulfield, L.E.; et al. Carotenoids and the Risk of Developing Lung Cancer: A Systematic Review. Am. J. Clin. Nutr. 2008, 88, 372–383. [Google Scholar] [CrossRef]
  38. Sharoni, Y.; Danilenko, M.; Dubi, N.; Ben-Dor, A.; Levy, J. Carotenoids and Transcription. Arch. Biochem. Biophys. 2004, 430, 89–96. [Google Scholar] [CrossRef] [PubMed]
  39. Omenn, G.S.; Goodman, G.E.; Thornquist, M.D.; Balmes, J.; Cullen, M.R.; Glass, A.; Keogh, J.P.; Meyskens, F.L.; Valanis, B.; Williams, J.H.; et al. Effects of a Combination of Beta Carotene and Vitamin A on Lung Cancer and Cardiovascular Disease. N. Engl. J. Med. 1996, 334, 1150–1155. [Google Scholar] [CrossRef]
  40. Connor, E.M.; Sperling, R.S.; Gelber, R.; Kiselev, P.; Scott, G.O.M. The Effect of Vitamin E and Beta Carotene on the Incidence of Lung Cancer and Other Cancers in Male Smokers. N. Engl. J. Med. 1994, 331, 1173–1180. [Google Scholar] [CrossRef]
  41. Albanes, D.; Heinonen, O.P.; Taylor, P.R.; Virtamo, J.; Edwards, B.K.; Rautalahti, M.; Hartman, A.M.; Palmgren, J.; Freedman, L.S.; Haapakoski, J.; et al. α-Tocopherol and β-Carotene Supplements and Lung Cancer Incidence in the Alpha-Tocopherol, Beta-Carotene Cancer Prevention Study: Effects of Base-Line Characteristics and Study Compliance. J. Natl. Cancer Inst. 1996, 88, 1560–1570. [Google Scholar] [CrossRef]
  42. Mayne, S.T.; Taylor, S. Beta-Carotene, Carotenoids, and Disease Prevention in Humans. Carotenoids Dis. Hum. 1996, 5, 690–701. [Google Scholar] [CrossRef]
  43. Wang, X.-D.; Russell, R.M. Procarcinogenic and Anticarcinogenic Effects of B-Carotene. Nutr. Rev 1999, 57, 263–272. [Google Scholar] [CrossRef] [PubMed]
  44. Britton, G. Structure and Properties of Carotenoids in Relation to Function. FASEB J. 1995, 9, 1551–1558. [Google Scholar] [CrossRef]
  45. Young, A.J.; Lowe, G.M. Antioxidant and Prooxidant Properties of Carotenoids. Arch. Biochem. Biophys. 2001, 385, 20–27. [Google Scholar] [CrossRef]
  46. Siems, W.; Sommerburg, O.; Schild, L.; Augustin, W.; Langhans, C.D.; Wiswedel, I. B-Carotene Cleavage Products Induce Oxidative Stress in Vitro by Impairing Mitochondrial Respiration. FASEB J. 2002, 16, 1805–1807. [Google Scholar] [CrossRef]
  47. Maoka, T. Recent Progress in Structural Studies of Carotenoids in Animals and Plants. Arch. Biochem. Biophys. 2009, 483, 191–195. [Google Scholar] [CrossRef] [PubMed]
  48. Brozek-Pluska, B.; Jablonska-Gajewicz, J.; Kordek, R.; Abramczyk, H. Phase Transitions in Oleic Acid and in Human Breast Tissue as Studied by Raman Spectroscopy and Raman Imaging. J. Med. Chem. 2011, 54, 3386–3392. [Google Scholar] [CrossRef] [PubMed]
  49. Abramczyk, H.; Brozek-Pluska, B.; Surmacki, J.; Jablonska, J.; Kordek, R. The Label-Free Raman Imaging of Human Breast Cancer. J. Mol. Liq. 2011, 164, 123–131. [Google Scholar] [CrossRef]
  50. Abramczyk, H.; Surmacki, J.; Brozek-Płuska, B.; Morawiec, Z.; Tazbir, M. The Hallmarks of Breast Cancer by Raman Spectroscopy. J. Mol. Struct. 2009, 924–926, 175–182. [Google Scholar] [CrossRef]
  51. Kopec, M.; Błaszczyk, M.; Radek, M.; Abramczyk, H. Raman Imaging and Statistical Methods for Analysis Various Type of Human Brain Tumors and Breast Cancers. Spectrochim. Acta Part A Mol. Biomol. Spectrosc. 2021, 262, 120091. [Google Scholar] [CrossRef]
  52. Abramczyk, H.; Surmacki, J.M.; Brozek-Pluska, B.K.M. Revision of Commonly Accepted Warburg Mechanism of Cancer Development: Redox-Sensitive Mitochondrial Cytochromes in Breast and Brain Cancers by Raman Imaging. Cancers 2021, 13, 2599. [Google Scholar] [CrossRef]
  53. Brozek-Pluska, B.; Dziki, A.; Abramczyk, H. Virtual Spectral Histopathology of Colon Cancer—Biomedical Applications of Raman Spectroscopy and Imaging. J. Mol. Liq. 2020, 303, 112676. [Google Scholar] [CrossRef]
  54. Brozek-Pluska, B. Statistics Assisted Analysis of Raman Spectra and Imaging of Human Colon Cell Lines–Label Free, Spectroscopic Diagnostics of Colorectal Cancer. J. Mol. Struct. 2020, 1218, 128524. [Google Scholar] [CrossRef]
  55. Brozek-Pluska, B.; Kopec, M.; Niedzwiecka, I.; Morawiec-Sztandera, A. Label-Free Determination of Lipid Composition and Secondary Protein Structure of Human Salivary Noncancerous and Cancerous Tissues by Raman Microspectroscopy. Analyst 2015, 140, 2107–2113. [Google Scholar] [CrossRef]
  56. Surmacki, J.M.; Abramczyk, H. Confocal Raman Imaging Reveals the Impact of Retinoids on Human Breast Cancer via Monitoring the Redox Status of Cytochrome c. Sci. Rep. 2023, 13, 15049. [Google Scholar] [CrossRef]
  57. Kowatz, T.; Babino, D.; Kiser, P.; Palczewski, K.; Von Lintig, J. Characterization of Human β,β-Carotene-15,15′-Monooxygenase (BCMO1) as a Soluble Monomeric Enzyme. Arch. Biochem. Biophys. 2013, 539, 214–222. [Google Scholar] [CrossRef] [PubMed]
  58. During, A.; Smith, M.K.; Piper, J.B.; Smith, J.C. β-Carotene 15,15′-Dioxygenase Activity in Human Tissues and Cells: Evidence of an Iron Dependency. J. Nutr. Biochem. 2001, 12, 640–647. [Google Scholar] [CrossRef] [PubMed]
  59. During, A.; Nagao, A.; Terao, J. B-Carotene 15,15*-Dioxygenase Activity and Cellular Retinol-Binding Protein Type II Level Are Enhanced by Dietary Unsaturated Triacylglycerols in Rat Intestines. Biochem. Mol. Roles Nutr. 1998, 128, 1614–1619. [Google Scholar] [CrossRef]
  60. Farias, E.F.; Ong, D.E.; Ghyselinck, N.B.; Nakajo, S.; Kuppumbatti, Y.S.; Lopez, R.M. Cellular Retinol-Binding Protein I, a Regulator of Breast Epithelial Retinoic Acid Receptor Activity, Cell Differentiation, and Tumorigenicity. J. Natl. Cancer Inst. 2005, 97, 21–29. [Google Scholar] [CrossRef]
  61. Doldo, E.; Costanza, G.; Agostinelli, S.; Tarquini, C.; Ferlosio, A.; Arcuri, G.; Passeri, D.; Scioli, M.G.; Orlandi, A. Vitamin A, Cancer Treatment and Prevention: The New Role of Cellular Retinol Binding Proteins. BioMed. Res. Int. 2015, 2015, 624627. [Google Scholar] [CrossRef]
  62. Mawson, A.R. Retinoids in the Treatment of Glioma: A New Perspective. Cancer Manag. Res. 2012, 4, 233–241. [Google Scholar] [CrossRef]
  63. Napoli, J.L. Retinoic Acid: Its Biosynthesis and Metabolism. Prog. Nucleic Acid Res. Mol. Biol. 1999, 63, 139–188. [Google Scholar] [PubMed]
  64. Travis, G.H.; Golczak, M.; Moise, A.R.; Palczewski, K. Diseases Caused by Defects in the Visual Cycle: Retinoids as Potential Therapeutic Agents. Annu. Rev. Pharmacol. Toxicol. 2007, 47, 469–512. [Google Scholar] [CrossRef] [PubMed]
  65. Malkovsky, M.; Dore, C.; Hunt, R.; Palmer, L.; Chandler, P.; Medawar, P.B. Enhancement of Specific Antitumor Immunity in Mice Fed a Diet Enriched in Vitamin A Acetate. Proc. Natl. Acad. Sci. USA 1983, 80, 6322–6326. [Google Scholar] [CrossRef]
  66. Malkovský, M.; Edwards, A.J.; Hunt, R.; Palmer, L.; Medawar, P.B. T-Cell-Mediated Enhancement of Host-versus-Graft Reactivity in Mice Fed a Diet Enriched in Vitamin A Acetate. Nature 1983, 302, 338–340. [Google Scholar] [CrossRef] [PubMed]
  67. Napoli, J.L. Cellular Retinoid Binding-Proteins, CRBP, CRABP, FABP5: Effects on Retinoid Metabolism, Function and Related Diseases. Pharmacol. Ther. 2017, 173, 19–33. [Google Scholar] [CrossRef]
  68. Kwong, J.; Lo, K.W.; Chow, L.S.N.; To, K.F.; Choy, K.W.; Chan, F.L.; Mok, S.C.; Huang, D.P. Epigenetic Silencing of Cellular Retinol-Binding Proteins in Nasopharyngeal Carcinoma. Neoplasia 2005, 7, 67–74. [Google Scholar] [CrossRef]
  69. Shete, V.; Quadro, L. Mammalian Metabolism of β-Carotene: Gaps in Knowledge. Nutrients 2013, 5, 4849–4868. [Google Scholar] [CrossRef]
  70. Pino-Lagos, K.; Guo, Y.; Noelle, R.J. Retinoic Acid: A Key Player in Immunity. BioFactors 2010, 36, 430–436. [Google Scholar] [CrossRef]
  71. Yamada, T.; Sato, S.; Sotoyama, Y.; Orba, Y.; Sawa, H.; Yamauchi, H.; Sasaki, M.; Takaoka, A. RIG-I Triggers a Signaling-Abortive Anti-SARS-CoV-2 Defense in Human Lung Cells. Nat. Immunol. 2021, 22, 820–828. [Google Scholar] [CrossRef]
  72. Abramczyk, H.; Imiela, A.; Surmacki, J. Novel Strategies of Raman Imaging for Monitoring Intracellular Retinoid Metabolism in Cancer Cells. J. Mol. Liq. 2021, 334, 116033. [Google Scholar] [CrossRef]
  73. Noy, N. Vitamin a Transport and Cell Signaling by the Retinol-Binding Protein Receptor STRA6. In Subcellular Biochemistry; Springer: Dordrecht, The Netherlands, 2016; Volume 81, pp. 77–93. [Google Scholar] [CrossRef]
  74. Berry, D.C.; O’Byrne, S.M.; Vreeland, A.C.; Blaner, W.S.; Noy, N. Cross Talk between Signaling and Vitamin A Transport by the Retinol-Binding Protein Receptor STRA6. Mol. Cell. Biol. 2012, 32, 3164–3175. [Google Scholar] [CrossRef] [PubMed]
  75. Blaner, W.S. STRA6, a Cell-Surface Receptor for Retinol-Binding Protein: The Plot Thickens. Cell Metab. 2007, 5, 164–166. [Google Scholar] [CrossRef]
  76. Goswami, R.; Kaplan, M.H. STAT Transcription Factors in T Cell Control of Health and Disease, 1st ed.; Elsevier Inc.: Amsterdam, The Netherlands, 2017; Volume 331. [Google Scholar]
  77. Mora, J.R.; Iwata, M.; Eksteen, B.; Song, S.Y.; Junt, T.; Senman, B.; Otipoby, K.L.; Yokota, A.; Takeuchi, H.; Ricciardi-Castagnoli, P.; et al. Generation of Gut-Homing IgA-Secreting B Cells by Intestinal Dendritic Cells. Science 2006, 314, 1157–1160. [Google Scholar] [CrossRef] [PubMed]
  78. Abramczyk, H.; Surmacki, J.M.; Brozek-Pluska, B. Redox State Changes of Mitochondrial Cytochromes in Brain and Breast Cancers by Raman Spectroscopy and Imaging. J. Mol. Struct. 2022, 1252, 132134. [Google Scholar] [CrossRef]
  79. Taimi, M.; Helvig, C.; Wisniewski, J.; Ramshaw, H.; White, J.; Amad, M.; Korczak, B.; Petkovich, M. A Novel Human Cytochrome P450, CYP26C1, Involved in Metabolism of 9-Cis and All-Trans Isomers of Retinoic Acid. J. Biol. Chem. 2004, 279, 77–85. [Google Scholar] [CrossRef]
  80. Abu-Abed, S.S.; Beckett, B.R.; Chiba, H.; Chithalen, J.V.; Jones, G.; Metzger, D.; Chambon, P.; Petkovich, M. Mouse P450RAI (CYP26) Expression and Retinoic Acid-Inducible Retinoic Acid Metabolism in F9 Cells Are Regulated by Retinoic Acid Receptor γ and Retinoid X Receptor α. J. Biol. Chem. 1998, 273, 2409–2415. [Google Scholar] [CrossRef]
  81. Ribes, V.; Otto, D.M.E.; Dickmann, L.; Schmidt, K.; Schuhbaur, B.; Henderson, C.; Blomhoff, R.; Wolf, C.R.; Tickle, C.; Dollé, P. Rescue of Cytochrome P450 Oxidoreductase (Por) Mouse Mutants Reveals Functions in Vasculogenesis, Brain and Limb Patterning Linked to Retinoic Acid Homeostasis. Dev. Biol. 2007, 303, 66–81. [Google Scholar] [CrossRef]
  82. Eleftheriadis, T.; Pissas, G.; Liakopoulos, V.; Stefanidis, I. Cytochrome c as a Potentially Clinical Useful Marker of Mitochondrial and Cellular Damage. Front. Immunol. 2016, 7, 279. [Google Scholar] [CrossRef]
  83. Abramczyk, H.; Brozek-Pluska, B.; Kopeć, M. Double Face of Cytochrome c in Cancers by Raman Imaging. Sci. Rep. 2022, 12, 2120. [Google Scholar] [CrossRef]
  84. Abramczyk, H.; Brozek-Pluska, B.; Kopec, M.; Jakub, S.; Błaszczyk, M.; Radek, M. Redox Imbalance and Biochemical Changes in Cancer by Probing Redox-Sensitive Mitochondrial Cytochromes in Label-Free Visible Resonance Raman Imaging. Cancers 2021, 13, 960. [Google Scholar] [CrossRef] [PubMed]
  85. Ow, Y.L.P.; Green, D.R.; Hao, Z.; Mak, T.W. Cytochrome c: Functions beyond Respiration. Nat. Rev. Mol. Cell Biol. 2008, 9, 532–542. [Google Scholar] [CrossRef] [PubMed]
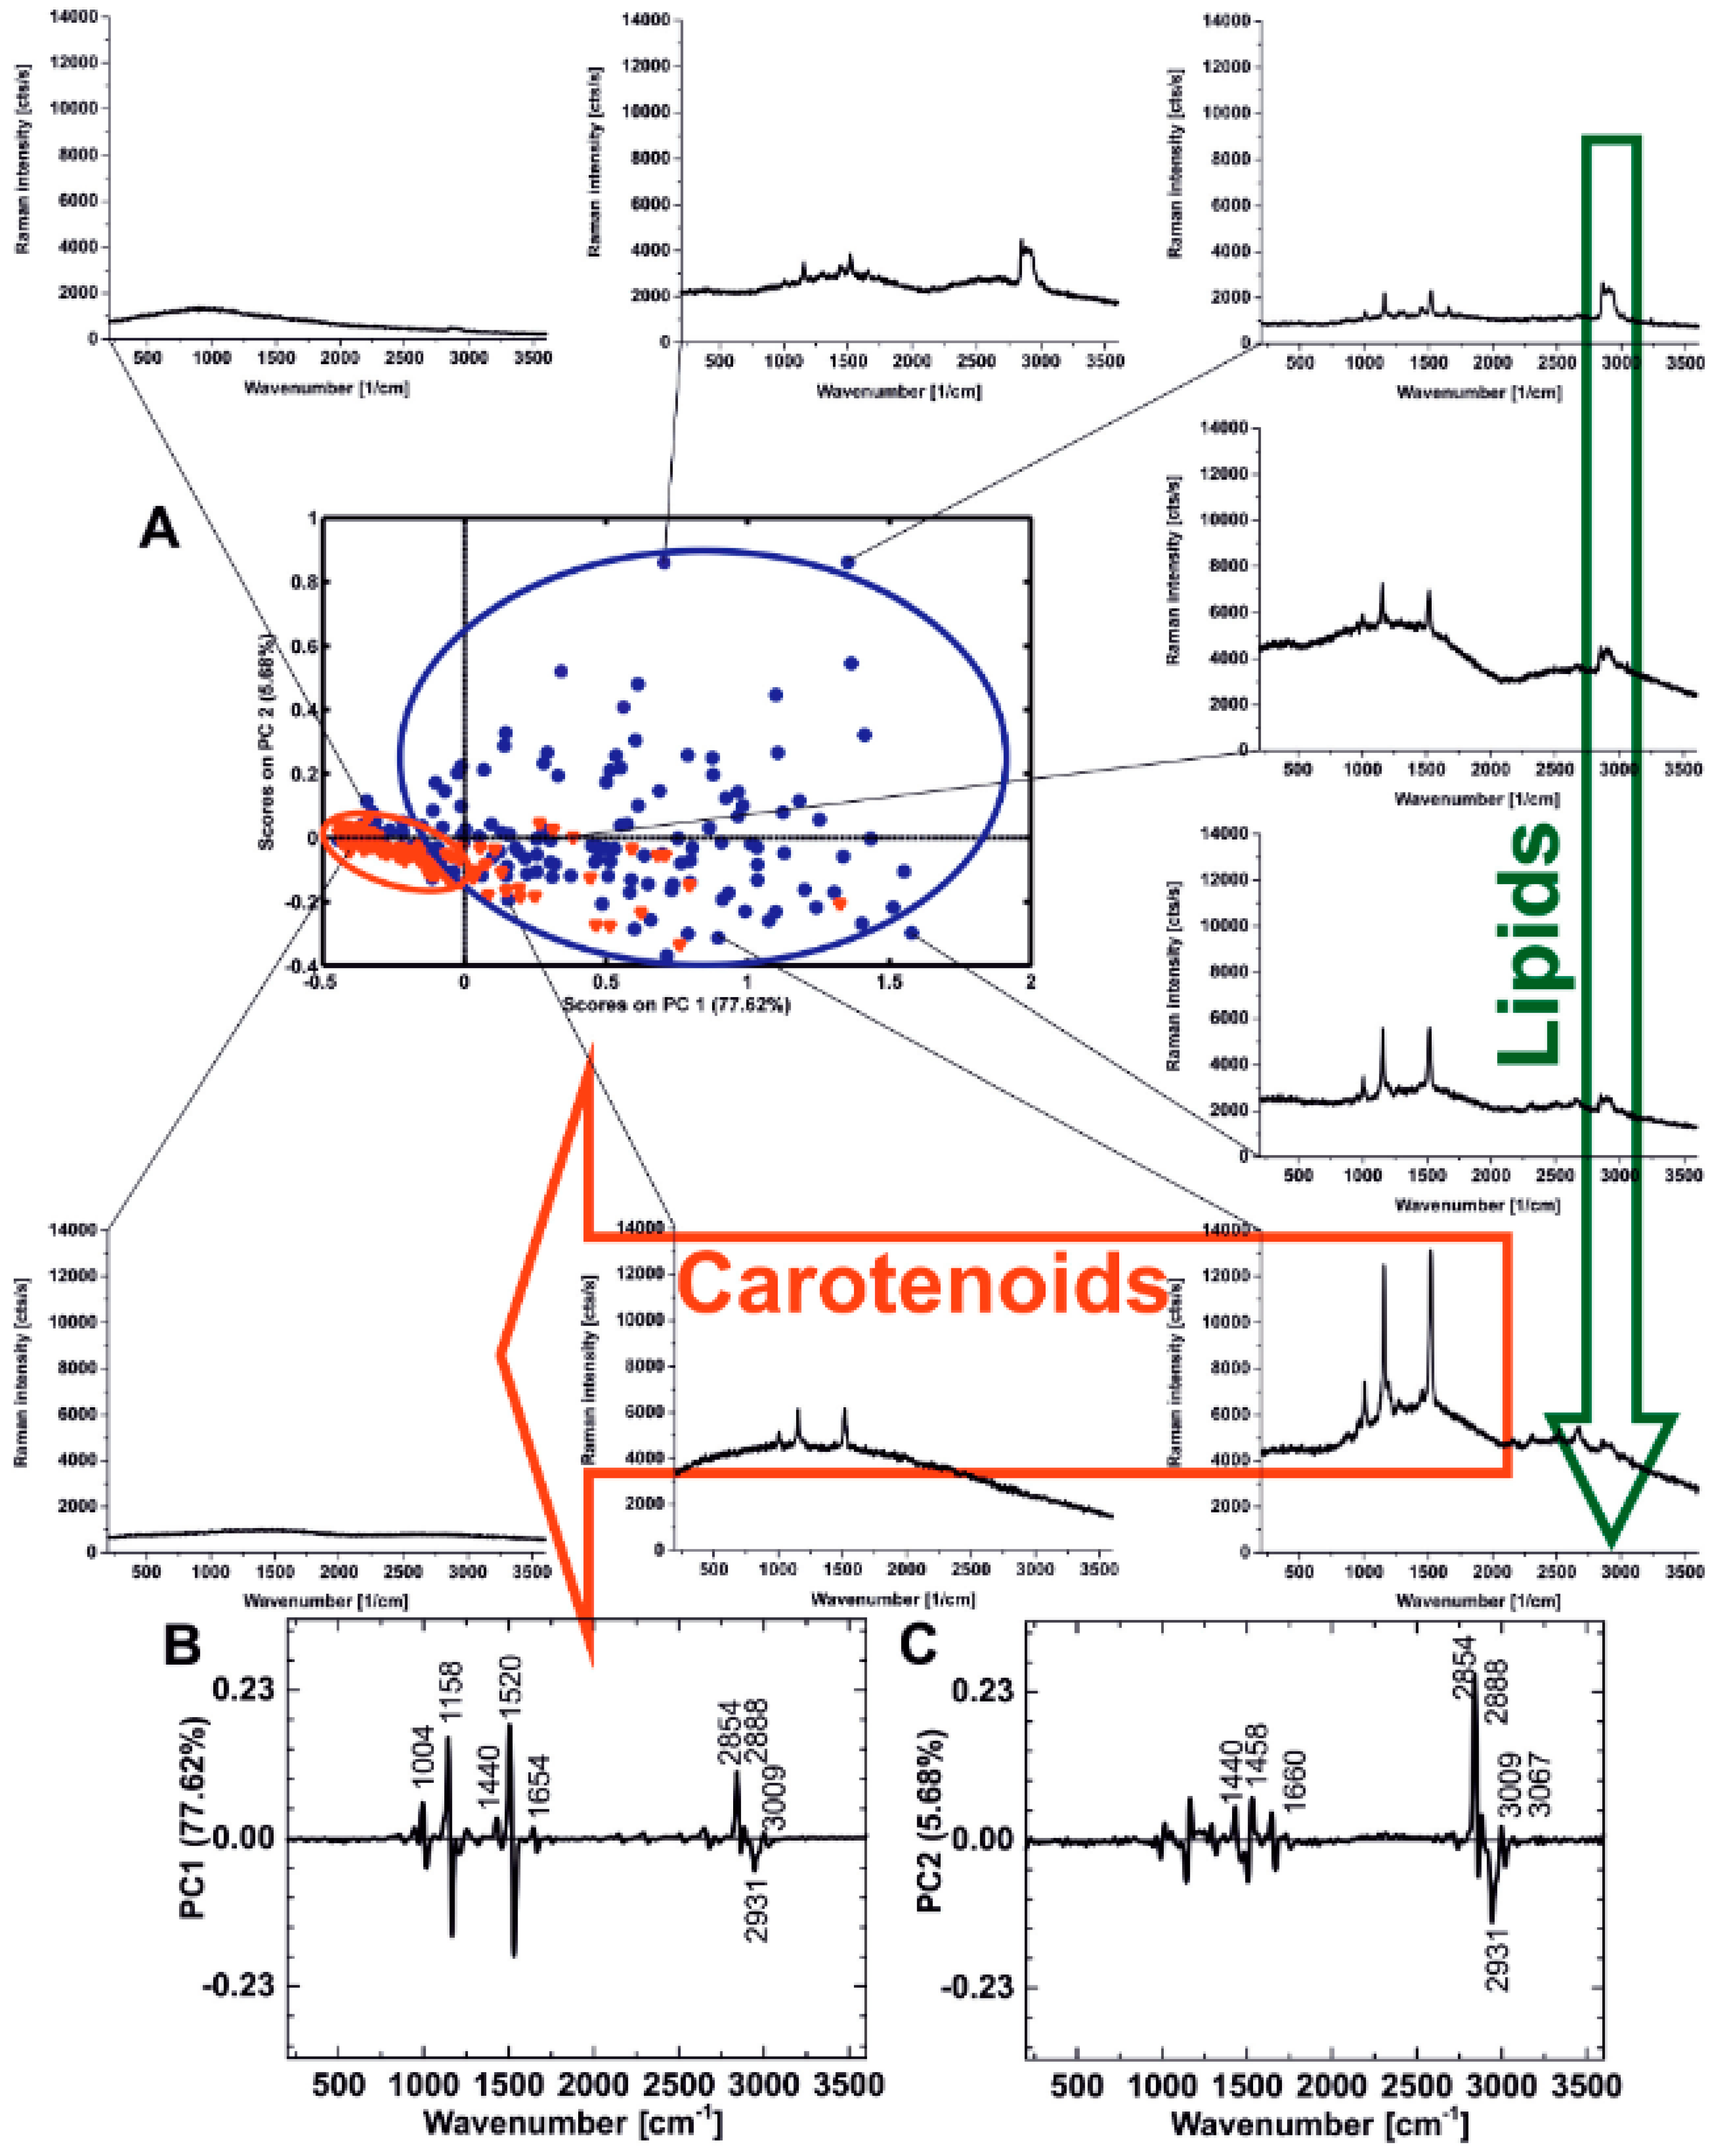
Figure 1. PCA score plot (model: SNV, mean center, 1st derivative) for the average Raman spectra of the human breast tissue samples from the tumor mass (red triangles) and the safety margin (blue circles), bulk tissue, integration time 0.5 s, laser power 25 mW, step 2 cm−1, 200–3600 cm−1 (A). PCA loading plot for PC1 (B) and PC2 (C). Reproduced from Ref. [1] with permission from the Royal Society of Chemistry.
Spectroscj 03 00009 g001
Figure 2. Mechanisms by which carotenoids can suppress carcinogenesis.
Spectroscj 03 00009 g002
Figure 3. Summary of β-carotene metabolism [56]. Reproduced from Ref. [56] with permission from Springer Nature.
Spectroscj 03 00009 g003
Figure 4. The average Raman spectra obtained at 532 nm wavelength laser excitation from the cluster analysis of nuclei (A), lipid droplets (B), mitochondria (C), and cytoplasm (D) of human medulloblastoma control cells (DAOY) (red line) and DAOY cells incubated with 50 μM of retinoic acid (RA) by 24 h (black line). Difference spectra of nuclei (E), lipid droplets (F), mitochondria (G), and cytoplasm (H); (n = 3) [78]. Reproduced from Ref. [78] with permission from Elsevier.
Spectroscj 03 00009 g004
Figure 5. Raman-guided in vivo animal (rat) brain analysis (A), the average (number of animals, n = 6) Raman spectrum of the in vivo brain of animal model (rat) at the excitation 785 nm (red) and of the ex vivo brain of animal model (rat) at the excitation 532 nm (green) and 785 nm (blue) (B), Raman spectrum of ferrous (Fe2+, reduced form) and ferric (Fe3+, oxidized form) forms of cytochrome c (green, magenta) (0.18 mM solution in PBS (PBS—phosphate-buffered saline), excitation line 532 nm, laser power 0.5 mW, accumulation time 2.0 s, number of accumulation 20 (C), structural formula of heme c in cytochrome c (D) [78]. Reproduced from Ref. [78] with permission from Elsevier.
Spectroscj 03 00009 g005
Figure 6. Electronic absorption spectra (A) and Raman spectra (B) of cytochrome c in ferric (oxidized, Fe3+) and ferrous (reduced, Fe2+) states in phosphate buffer pH = 7.3, cuvette optical path 1 cm. Ferrous cytochrome c was prepared by adding 10-fold excess NaBH4 (as a reductor) [84]. Reproduced from Ref. [84] with permission from MDPI.
Spectroscj 03 00009 g006
Figure 7. The average Raman spectra for the human brain tissue of medulloblastoma (grade of malignancy WHO G4) at different excitations of the ex vivo tumor human brain tissue of medulloblastoma at excitations 355 nm (blue), 532 nm (green), and 785 nm (red) for the same area of the samples [84]. Reproduced from Ref. [84] with permission from MDPI.
Spectroscj 03 00009 g007
Figure 8. The average Raman spectra of ex vivo human normal (grade of malignancy G0) and tumor G1. G2, G3, and G4 brain tissue (A) and ex vivo human normal (grade of malignancy G0) and G1, G2, and G3 breast tissue (B); surgically resected specimens at 532 nm [84]. Reproduced from Ref. [84] with permission from MDPI.
Spectroscj 03 00009 g008
Figure 9. The Raman intensity ratio of the peaks at 1584 cm−1 (A), 750 cm−1 (B), 1126 cm−1 (C), and 1337 cm−1 (D) in human breast tissue for n(G0) = 22, n(G1) = 3, n(G2) = 9, n(G3) = 5 as a function of breast cancer grade malignancy G0–G3 at excitation 532 nm [84]. Reproduced from Ref. [84] with permission from MDPI.
Spectroscj 03 00009 g009
Figure 10. The Raman intensities of cytochrome c and cytochrome b in human brain tissue: I750, I1126, I1584 (A), and I1337 (B) for n(G0) = 1, n(G1) = 17, n(G2) = 9, n(G3) = 4, and n(G4) = 13 as a function of brain tumor grade malignancy G0–G4 at excitation 532 nm [84]. Reproduced from Ref. [84] with permission from MDPI.
Spectroscj 03 00009 g010
Figure 11. Confocal Raman spectroscopy analysis of the human adenocarcinoma cell line (invasive ductal cancer (AU565)) at the 532 nm wavelength excitation. (A) Microscopy image and (B) Raman image from the cluster analysis (nucleus (red), endoplasmic reticulum (blue), lipid droplets (orange) cytoplasm (green), mitochondria (magenta), cell border (light gray), area out of the cell (dark gray), image size: 55 mm × 50 mm, resolution of 1 m, laser excitation 532 nm, power 10 mW, integration time 0.3 s). (C) fluorescence image of lipids (blue, Oil Red O staining) and nucleus (red, Hoechst staining) (D) [84]. Reproduced from Ref. [84] with permission from MDPI.
Spectroscj 03 00009 g011
Figure 12. The Raman biomarker I(1584/1444) as a function of brain tumor grade malignancy G0–G4 for human tissues and for in vitro human brain cells of normal astrocytes (NHA), astrocytoma (CRL-1718), glioblastoma (U87-MG), and medulloblastoma (DAOY) [78]. Reproduced from Ref. [78] with permission from Elsevier.
Spectroscj 03 00009 g012
Disclaimer/Publisher’s Note: The statements, opinions and data contained in all publications are solely those of the individual author(s) and contributor(s) and not of MDPI and/or the editor(s). MDPI and/or the editor(s) disclaim responsibility for any injury to people or property resulting from any ideas, methods, instructions or products referred to in the content.