Article

Trend in STEAM Careers in the Depopulated Spain

by
Pablo Fernández-Arias
,
María Sánchez-Jiménez
,
Álvaro Antón-Sancho
and
Diego Vergara
*
Technology, Instruction and Design in Engineering and Education Research Group, Catholic University of Ávila, 05005 Ávila, Spain
*
Author to whom correspondence should be addressed.
Trends High. Educ. 2023, 2(1), 77-100; https://doi.org/10.3390/higheredu2010006
Submission received: 11 January 2023 / Revised: 21 January 2023 / Accepted: 24 January 2023 / Published: 28 January 2023

Abstract

:
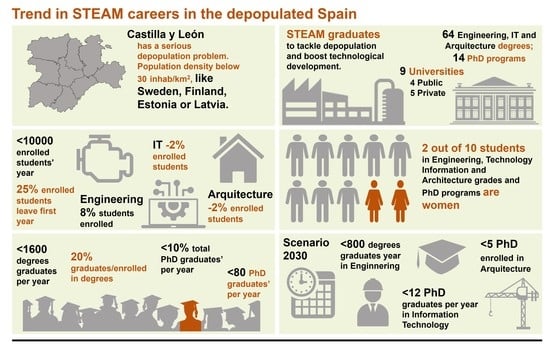
Spain has a serious depopulation problem in large part of its territory and mainly in rural areas, where the population density is even lower than ten inhabitants per km2. An example of this depopulation phenomenon, known as “depopulated Spain”, is the region of Castilla y León. STEAM knowledge areas (Sciences, Technologies, Engineering, Art, and Mathematics) are essential to achieve the socio-economic growth of the territories and, with it, the desired population growth. Faced with this challenge, STEAM graduates can help to strengthen the industrial fabric and increase economic development. The main objectives of this research are the analysis (i) of the trend and (ii) of the gender gap in STEAM degrees and Ph.D. programs in Castilla y León. The evolution of the number of enrolled and graduated students in STEAM knowledge areas in the last years was analyzed to achieve these objectives, as well as the future trend. The results obtained showed a lack of STEAM graduates in Castilla y León, as well as the existence of a gender gap. Given this scenario, it is difficult to affirm the sustainability of the research, economic, and industrial systems in the region.

Graphical Abstract

1. Introduction

1.1. Context and Approach

Research dealing with the economic development of localities and regions explains that, in this development, the region’s human stock, which will shape the labor market, has a decisive influence [1]. Although there is some divergence about which human capital is most conducive to local and regional economic development, the most advanced and economically developed societies, such as the United States, explain that this human capital should be focused, in the coming decades, on meeting the growing needs of technological development and digitization, which is why they are promoting the choice of STEAM (Science, Technology, Engineering, Arts, and Mathematics) degrees among their young people [2]. The specialized literature explains that this set of degrees is the most influential in developing the right skills so that young people who enter the labor market can do so while contributing constructively to the economic development of their regions [3].
However, within the STEAM knowledge areas (involving basic, mathematical, and experimental sciences, in addition to technical areas), the literature identifies that it is the technical areas that provide the most immediate and short-term influence on the transformation of the labor market and the sources of production and wealth generation in the regions [4]. This fact is justified because technical knowledge is the most immediately applicable to the development of production goods of an essentially technological and digital nature that are at the forefront of technological development, such as the development of green and sustainable technologies [5], information and communication technologies [6], or the development of computer chips and microchips [7]. All this justifies that, within the STEAM degrees, it is the “TE” (technology and engineering, which includes engineering, information technology, and architecture) degrees that have the most immediate and short/medium-term (on the horizon of the year 2030) influence on local development (Figure 1).
Historically, the need to have graduates in technological areas to increase local and regional economic development has been especially evident in rural and depopulated areas [8]. This especially affects depopulated and rural European regions due to the absence in Europe of policies specifically aimed at generating modern and digital communication networks, the incorporation of advanced and avant-garde technological means, and the absence of aid for its inhabitants to do a technological transition towards modern and sustainable technologies [9]. This reality specifically affects Spain because this country stands out, within the European sphere, in the inequality between regions in terms of the lack of technological development policies in depopulated areas [10].
This paper explored the situation of graduates and Ph.D. students in technical areas (technology and engineering) in Castilla y León, which is one of the largest depopulated regions in Spain, through a quantitative analysis of the data published by the competent authorities in this regard. The main objective was to make an estimate of the evolution of the presence of this type of professional in the labor market in the horizon of 2030, to conclude the impact that this presence may have in terms of meeting the objectives of economic and local development in the region. Furthermore, this study could serve as a reflection of the general trend that depopulated regions in Spain, or even in Europe, may follow.

1.2. Castilla y León (Spain): Depopulation and Development Needs

Spain has a serious depopulation problem in large part of its territory and mainly in rural areas, far from the large centers of depopulation [11,12,13,14]. This rural depopulation can be understood as a process that affects regions where the rural exodus has exceeded the natural growth of that population, reducing the total number of inhabitants to a critical level, especially in terms of population density and aging of demographic structures [15]. This phenomenon of rural depopulation, which encompasses the so-called emptied Spain, can also be seen as a demographic and territorial phenomenon, which consists of the decrease in the number of inhabitants of a territory in relation to a previous period because of negative vegetative growth or negative migratory balance or both simultaneously [16]. This problem is also present in the rural areas of a large part of the European territory [17,18]. Between 1950 and 2007, the European rural population decreased by about 20,000,000 inhabitants [19]. By 2030, the European rural population will be reduced by 75,000,000 inhabitants [20]. This rural depopulation can be considered the most serious threat to local economies due to several factors: (i) it limits growth opportunities due to the massive exodus of young people to the cities [17] for better job opportunities [12] and, consequently, the aging of the population in these areas [21]; (ii) it causes major environmental problems; (iii) it complicates the provision of public services [22]; (iv) it jeopardizes the existence of small municipalities [23,24]; and (v) it causes the stagnation of the economy in these areas [11]. In addition to being considered the most serious threat to rural economies, depopulation paralyzes industrial growth in the affected territories [17,25].
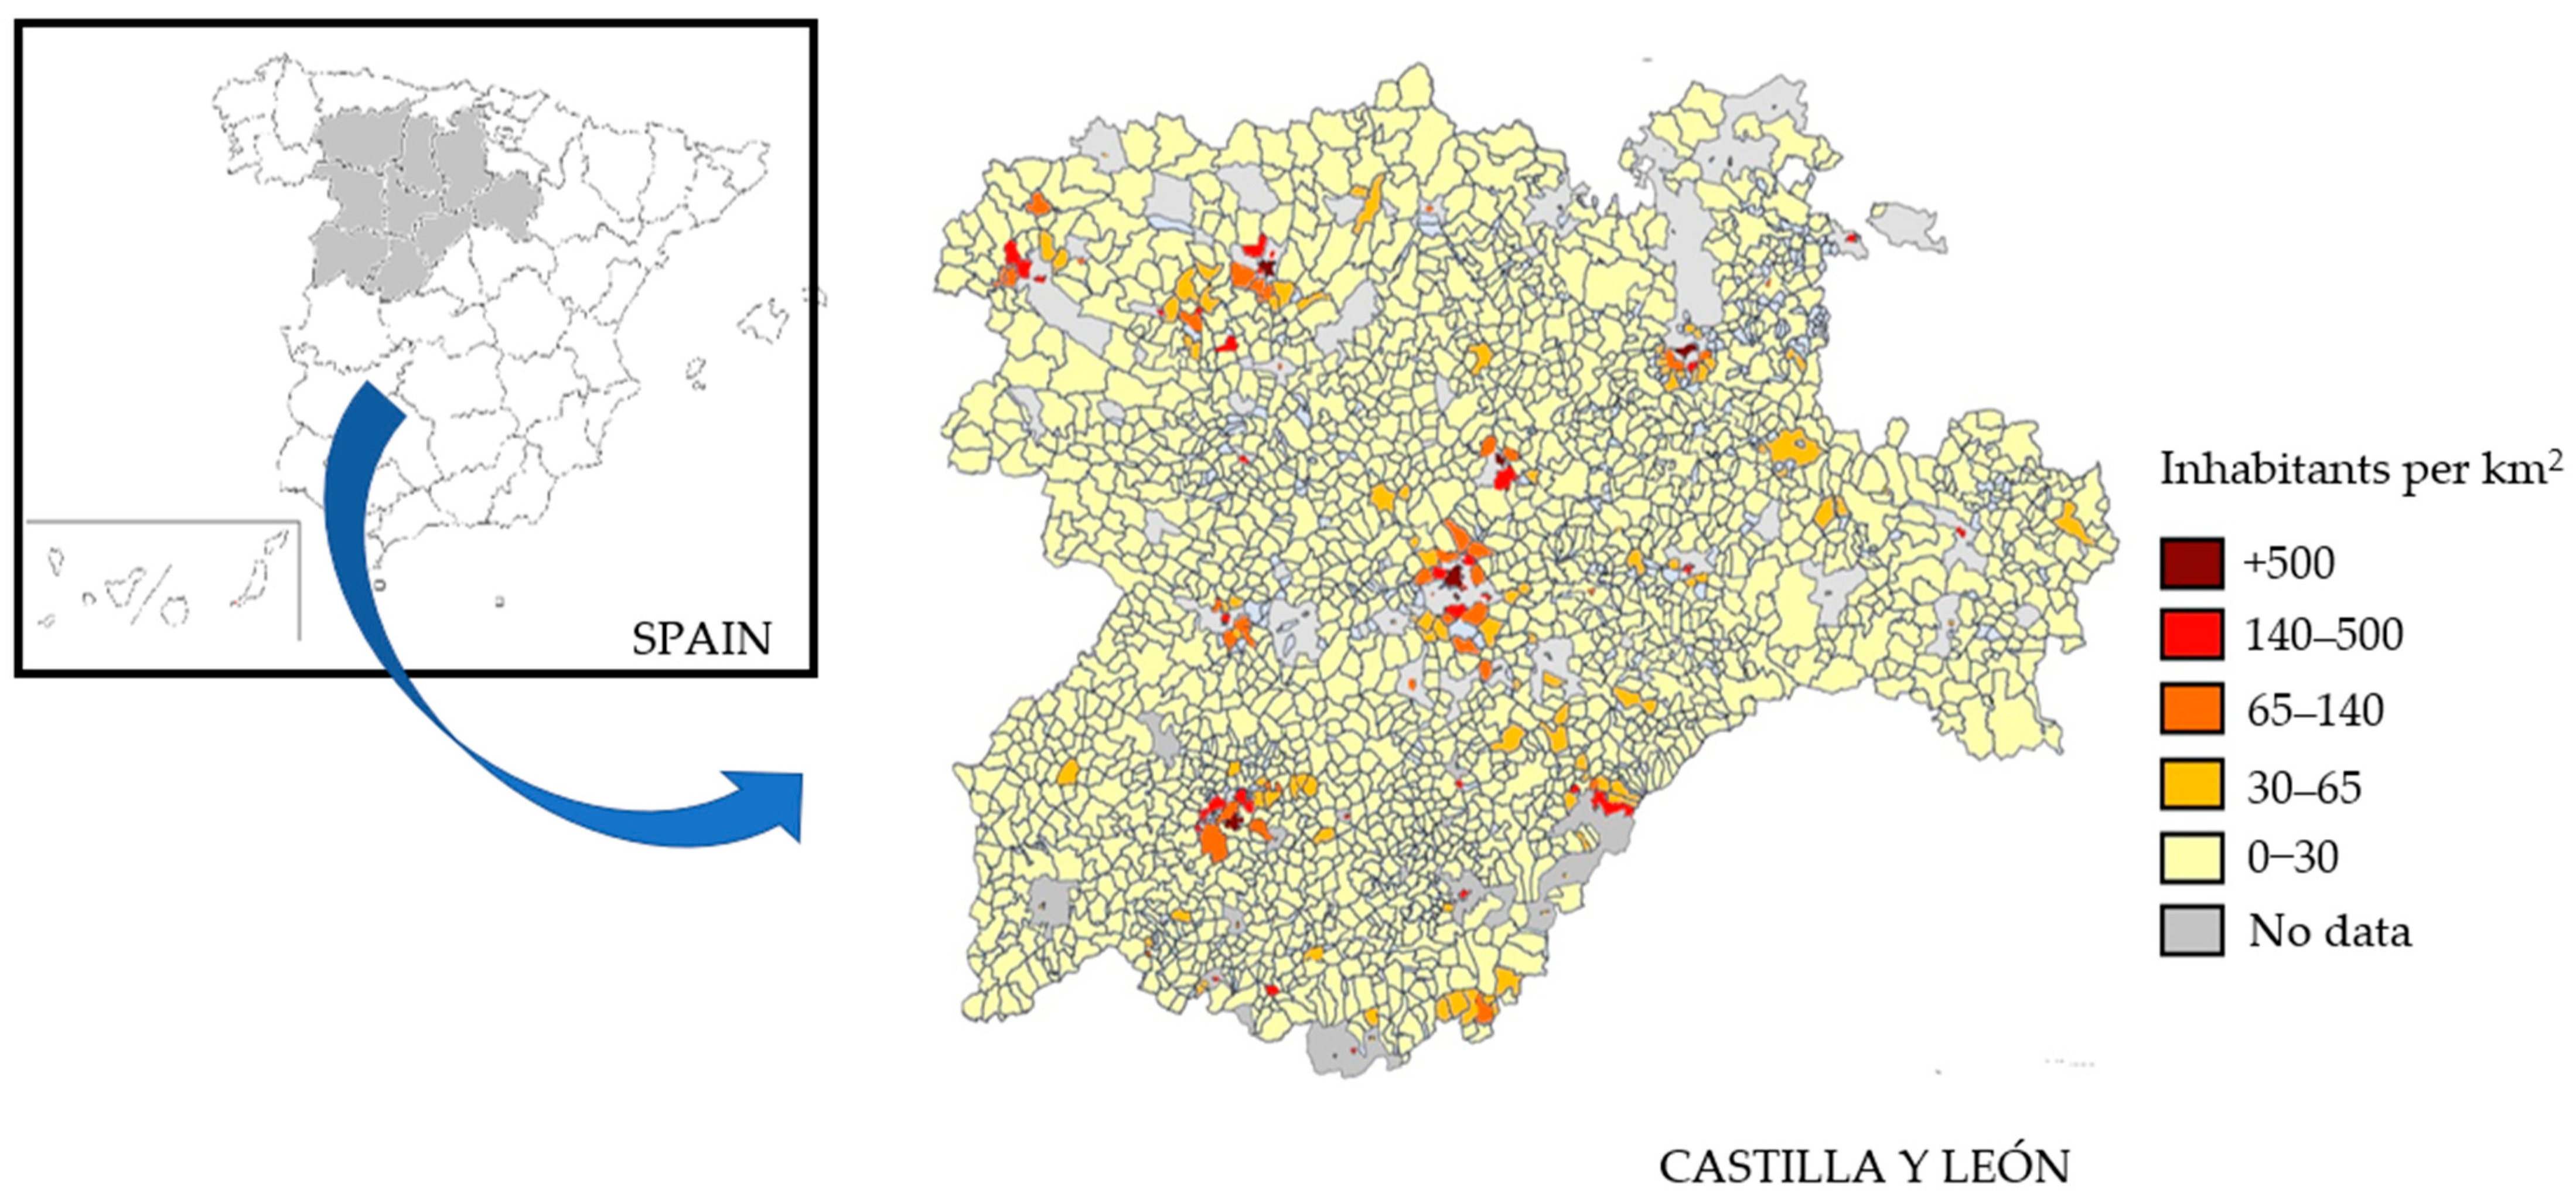
Spain is one of the European Union countries with the highest proportion of the aging population. The total number of people over 65 years old represented 18.8% of the population in 2017 and is estimated to exceed 30% in 2050 [21]. As can be seen in Figure 2, in 2021, the highest population densities in the country were in the large metropolitan areas (mainly Madrid, Barcelona, and Bilbao) [26], while the central areas of the country had a population density of fewer than 30 inhabitants per km2 (mainly Castilla y León and Castilla-la Mancha) [19].
As can be seen in Figure 2, in much of the interior of Spain, the outlook is uncertain due to the current depopulation. This problem affects low-density areas with imbalances in terms of age and gender structure [19] and is present in about 5000 national municipalities, which cover about 320,000 km2, i.e., more than 60% of the Spanish territory. At the national level, the population density in the country in 2021 was 94 inhabitants per km2, which is lower than the European average of 118 inhabitants per km2. Regions such as Aragon, Castilla y León, Castilla-La Mancha, Extremadura, and Asturias have a population density of fewer than 30 inhabitants per km2 [26] which, compared with the density of regions such as Madrid, with more than 800 inhabitants per km2, reflects this depopulation phenomenon.
In the case of Castilla y León, with a surface area of more than 90,000 km2—larger than that of countries such as Bulgaria or Luxembourg—and 2.4 million inhabitants, the population density of the region is close to 25 inhabitants per km2 [27]. This demographic decline has been going on for more than half a century [28,29] and has been accentuated in recent years. Since 1996, the region has been losing about 5000 inhabitants per year. This situation means that more than half of its municipalities have a population of fewer than 1000 inhabitants. As can be seen in Figure 3 below, most of the territory of Castilla y León has a population density of fewer than 30 inhabitants per year. This phenomenon of depopulation in Castilla y León means less industrial development in the affected areas and, therefore, less economic growth [30], while the more densely populated areas have a greater industrial and economic fabric, as well as other activities such as research and innovation [31,32].
Research, technological development, and innovation are fundamental for the socioeconomic growth of territories [30]. In Spain, development and research rates are accelerating, and new organizational forms and functions are emerging that promote research, knowledge, and technology commercialization [33]. STEAM (Sciences, Technologies, Engineering, Art, and Mathematics) graduates, PhDs, and researchers in technological knowledge areas help the industrial fabric and economic development [34,35,36,37]. The scientific and innovative system of the territory makes it possible to achieve results in terms of technological progress and, therefore, to promote economic growth [32]. Because STEAM degrees are directly related to ICT, they are a boost to society and of great use in reducing marginality and promoting inclusion [38]. Moreover, they are crucial for maintaining competitiveness within technological areas [39,40].
The presence of highly qualified professionals with these degrees is essential for the integration of new technologies existing in Industry 4.0: Big Data, robotics, artificial intelligence, etc. [41]. Likewise, this type of degree encourages creativity, interdisciplinarity based on problems or projects, collaboration, the development of skills that go beyond the purely technical and theoretical [42], and innovation, which is characteristics so in demand in our current century [43,44].
Therefore, to enhance innovation and stimulate industrial and economic growth, interest in STEAM careers needs to increase [45,46,47]. Moreover, numerous research has indicated that women are underrepresented in these careers in most industrialized countries of the world [38,48,49] and that they experience great difficulties in choosing these STEAM careers [50,51,52,53,54], being less likely to choose this type of university careers [52]. At the professional level, this situation is resulting in few women pursuing high-level professional careers [55,56,57]. Increasing the number of women studying and working in STEAM fields is essential to achieve better solutions to global challenges, as the potential for innovation is greater [58]. According to the Global Gender Gap Report 2020, the time it will take to close the gender gap will be 99.5 years. Spain is in eighth place with the lowest gender gap, with a figure of 79.5%, far from 100% [59].
In the case of Castilla y León, one of the policy measures taken to promote industrial and economic growth has been the development of regional policies to promote research, development, and innovation (R&D&I), thus helping settle the population and attract talent to Castilla y León. These policies are based on the idea that it is not possible to bet on everything and that the regions must identify the areas of technological and knowledge specialization that will allow them to generate increasingly competitive activities that generate wealth and employment.
In response to these requirements, Castilla y León has drawn up the Regional Research and Innovation Strategy for Smart Specialization (RIS3) of Castilla y León 2021–2027. The four essential aspects of the strategic approach identified in this RIS3 strategy of Castilla y León are: (i) to develop smart specialization priorities; (ii) to improve and strengthen the research and innovation ecosystem of Castilla y León; (iii) to take advantage of the benefits of digitalization; and (iv) to strengthen participatory governance for specialization.
The role of all the actors involved is important for achieving these four essential aspects: private companies, public administrations, universities, research centers, knowledge transfer offices, etc. But it is in the second objective—the improvement and strengthening of the research and innovation ecosystem of Castilla y León—that the system of universities and research in the region plays a fundamental role. Castilla y León has four public universities: (i) Burgos; (ii) León; (iii) Salamanca; and (iv) Valladolid; and five private universities: (i) Catholic University of Ávila; (ii) Pontifical University of Salamanca; (iii) European University Miguel de Cervantes (Valladolid); (iv) University Isabel I (Burgos); and (v) IE University (Segovia).
In terms of research, Castilla y León has two science parks associated with the Universities of Valladolid and Salamanca, as well as three technology parks in Valladolid, Burgos, and León, in addition to several technology centers, including CIDAUT and CARTIF. Not forgetting that the region has the National Cybersecurity Institute in León, as well as other national or mixed research centers, such as the Higher Council for Scientific Research, the Energy, Environmental and Technological Research Center, as well as regionally owned research centers, such as the Agricultural Technological Institute of Castilla y León. To this research network, research carried out in private for-profit companies must be added.
According to data from the Spanish Foundation for Science and Technology [60], this regional system of universities and research accounted for more than 10,200 people employed full-time in R&D&I activities in the region in 2008, which represents about 4% of the personnel employed in R&D&I activities at the national level. However, ten years later, the number of people employed in R&D&I activities was less than 10,000 people. In terms of researchers, the number is still lower than the number of people employed in R&D&I activities, being close to 6500 researchers. As far as scientific production is concerned, in 2019, researchers in Castilla y León published around 5000 scientific articles, conference proceedings, and annual reviews. This high activity placed the region among the six regions of the country with the highest scientific production, behind regions with larger populations, such as Madrid, Catalonia, Andalusia, Valencia, and the Basque Country. Finally, in terms of Ph.D. theses, Castilla y León, had more than 500 Ph.D. theses defended in 2018, a figure that again placed the region among the regions with the highest number of PhDs produced.
Some authors have analyzed the social economy as a factor in the economic development and resilience of the population in rural areas of Spain [61]. Others have analyzed the level of satisfaction of Ph.D. holders in Spain [62]. However, given this scenario, characterized by two fundamental aspects: (i) a progressive de-population; and (ii) the need to promote and maintain the university and research system in the region, this study analyzed the existing trends in the number of enrolled students in Castilla y León in university degrees and in subsequent Ph.D. programs, in areas of knowledge related to STEAM, such as Engineering, Information Technology and Architecture (Figure 1), and compared them with existing trends at the national level. In this way, it is possible to draw conclusions about the possibilities of maintaining a scientific and research community in Castilla y León that will allow the development of the university and research system in the region in the coming decades. On the other hand, it will be necessary to import talent from abroad or repatriate the talent that has emigrated from the region for years.

1.3. Research Objectives

The general objective of this research is to analyze the trend of the presence of graduates and researchers from technical areas and its evolution in the horizon of 2030, within STEAM areas in depopulated Spain. Specifically, the evolution of the number of enrolled and graduated students with university degrees and Ph.D. programs in technical areas of knowledge, such as Engineering, Information Technology, and Architecture, within STEAM degrees, in Castilla y León was analyzed, as well as the possible existence of a gender gap and its comparison with the national situation.

2. Materials and Methods

2.1. Research Variables

The main independent variables are: (i) programs: grades and Ph.D.; and (ii) students: enrolled and graduates. The results presented are of degree titles, which is what in Spain qualifies for the exercise of the engineering or architecture profession. Other independent variables are: (i) gender; and (ii) location: Castilla y León or Spain. (Figure 4).
To carry out the present study, data from the Spanish Ministry of Universities [63] of those enrolled in the degrees and Ph.D. programs of Information Technology, Engineering and Architecture, from the academic year 2015–2016 to 2020–2021 in Castilla y León and Spain were analyzed. The data of graduates in the degrees and doctorates in these areas of knowledge from the academic year 2015–2016 to the academic year 2020–2021 were also analyzed. Around two third of the participants are under 25 years of age; therefore, there is an evident and very large bias due to age. For this reason, age has not been considered an explanatory variable.

2.2. Research Design and Data Analysis

This research has been carried out in four phases (Figure 5): (i) Phase I: determination, definition, and formulation of the research objectives and variables; (ii) Phase II: search for data; (iii) Phase III: analysis of the data obtained in obtaining proportions and regression models; and (iv) Phase IV: discussion of results and conclusions.

3. Results

Once the data were collected (Phase II, Figure 5), the data analysis of the present research (Phase III, Figure 5) was organized into two sections: (i) University degrees; and (ii) Ph.D. programs. In each section, results were obtained on the situation both specific to Castilla y León and general for Spain in three fundamental variables: (i) enrolled students; (ii) graduates; and (iii) gender gap.

3.1. University Degrees

Firstly, the number of new students entering the different areas of knowledge in Castilla y León (Table 1) presented a complicated situation. The specific weight of new students in Engineering and Architecture, with respect to other areas of knowledge, showed a decreasing trend and was close to 3% in the last six academic years, which means a loss of 500 students between 2015 and 2021. On the other hand, Spain had an average percentage of enrolled students in the last six academic years (from the academic year 2015–2016 to the last consolidated academic year 2020–2021) lower than 16% [63], falling by 1% in the last six academic years, which means in absolute values, losing about 2000 new entry students.
This loss of students in both the Spanish national system and Castilla y León also reflects a reduction in the specific weight of men (Table 1). In the last six academic years, in both university systems, the percentage of men has been reduced by 3%, which has led to a slight increase in the percentage of new female students in Engineering and Architecture degrees. However, the participation of women in this area of knowledge in both university systems is still less than 30%. This means that in Engineering and Architecture degree programs, less than one in three students are a woman. If this trend of a reduction in the percentage of men enrolled for the first time in Engineering and Architecture continues, one in three new students will be female by 2030.
Both in Spain and in Castilla y León, comparing the number of students enrolled among areas of knowledge, Engineering and Architecture is the area of knowledge with the lowest interest for students [63]. In the 2018–2019 academic year, the interest of students when enrolling in Engineering and Architecture was at 83%. This is the area of knowledge with the lowest admission rate, unlike other areas of knowledge, such as Sciences or Health Sciences, whose admission rate is over 90% and even over 100%. In the case of the degrees included in Health Sciences, more students apply for places in these degrees than places offered [63].
Regarding students enrolled in the different degrees in the area of Engineering and Architecture (Table 2), regardless of the academic year in which they are enrolled, Spain had an average percentage of students enrolled in the last six academic years of 17% (2015–2016 to 2020–2021). This percentage of enrollees in Engineering and Architecture is similar to the percentage of new entrants, which means that there is not a significant number of students changing degrees after their first year of study.
However, this average percentage of 17% of enrolled students has not risen since the 2017–2018 academic year. Therefore, if this downward trend continues, it is likely that in the next academic years the average percentage of enrolled students in Engineering and Architecture in Spain will drop from 16%. As for the university system of Castilla y León, the average percentage of enrollees in the last six academic years is still lower than the national one, close to 15%.
This drop is even greater if we compare the specific weight of the area of knowledge in the consolidated academic year 2018–2019, in terms of enrolled students, with the specific weight obtained in the academic year 2008–2009—the beginning of a great economic crisis in Spain—when around 25% of the students were enrolled in Engineering and Architecture. In the academic year 2018–2019, the percentage of enrolled students was around 17%; therefore, in a matter of ten academic years, the percentage of students enrolled in Engineering and Architecture has dropped by around 8%. This drop is significant, implying the loss of 10,000 students enrolled between 2008 and 2018.
As far as the gender gap is concerned, both in Castilla y León and Spain, less than one in three students enrolled in Engineering and Architecture is female. There is, therefore, a wide gender gap in both university systems, but it is worth noting that, in the case of Castilla y León, in the last six academic years, the gender gap has even increased. If this continues, with an annual reduction of close to 1% in the enrollment of women in Engineering and Architecture degrees in Castilla y León, it is possible that, by 2030, women will account for around 20% of the students enrolled in the area of Engineering and Architecture.
Regarding graduates in Engineering and Architecture, the results reflect an average percentage in Castilla y León and Spain close to 14% and 16%, respectively (Table 3). As in the case of new entrants and enrolled students, both in Castilla y León and Spain, a drop in the number of graduates was observed. Therefore, in comparison with other areas of knowledge, fewer and fewer students are completing their degrees in Engineering and Architecture.
If one continues comparing the results obtained for the area of knowledge of Engineering and Architecture, it is possible to observe that, both in Castilla y León and Spain, the rate of students who finish their degree compared to the number of students who start it, is very low (Table 4), obtaining in Castilla y León and Spain in the last six consolidated academic years a value of 14% and 17%, respectively. This means that, of the total number of students enrolled in Engineering and Architecture degrees, less than 20% manage to finish their university degree each year, which means that more than 80% of the university community remains enrolled in the degree at least during the following academic year. In absolute values, around 1500 students managed to finish their university degree in the academic year 2020–2021 in Castilla y León, in the area of Engineering and Architecture, while in Spain this figure was slightly higher than 28,700 graduates.
There are multiple factors that may explain why the rate of graduates compared to enrolled students is so low. Among these factors are: (i) a high dropout rate from the degree program; and (ii) longer time spent in the degree program. Regarding the first factor, in the 2013–2014 academic year, the dropout rate of newly enrolled students in Undergraduate studies stood at approximately 40%, while in Engineering and Architecture, it was about 28%. In the 2015–2016 academic year, with 25% of students dropping out after the first year, Engineering and Architecture ranked as the second knowledge area with the highest dropout rate, only behind Arts and Humanities. In two academic years, a reduction in the dropout rate is observed in Engineering and Architecture, which allows us to be optimistic about a lower dropout rate in Engineering and Architecture in the future. However, it is not possible to obtain quantitative results regarding its future evolution, neither in the university system of Castilla y León nor in the national university system.
If the dropout rate is approached from a gender perspective in the 2015–2016 academic year (Table 5) in Castilla y León, the female and male dropout rate is lower than in the national system. In both university systems, women enrolled for the first time in Engineering and Architecture have a lower tendency to drop out or change degrees after the first year than men [62]. In the case of men, their dropout and change rates after the first year are even higher than the average values obtained for the national system.
As for the second factor that explains this low rate of graduates compared to the number of students enrolled, it should be noted that the length of time students spend on Engineering and Architecture degrees is higher than in other areas of knowledge, with an average duration of around five years and a half (it should be bear in mind that the duration of an undergraduate degree in Spain, after adaptation to the European Higher Education Area (EHEA), is four years). This duration of Engineering and Architecture degrees is half-year longer than the average duration of undergraduate degrees in other areas of knowledge [65].
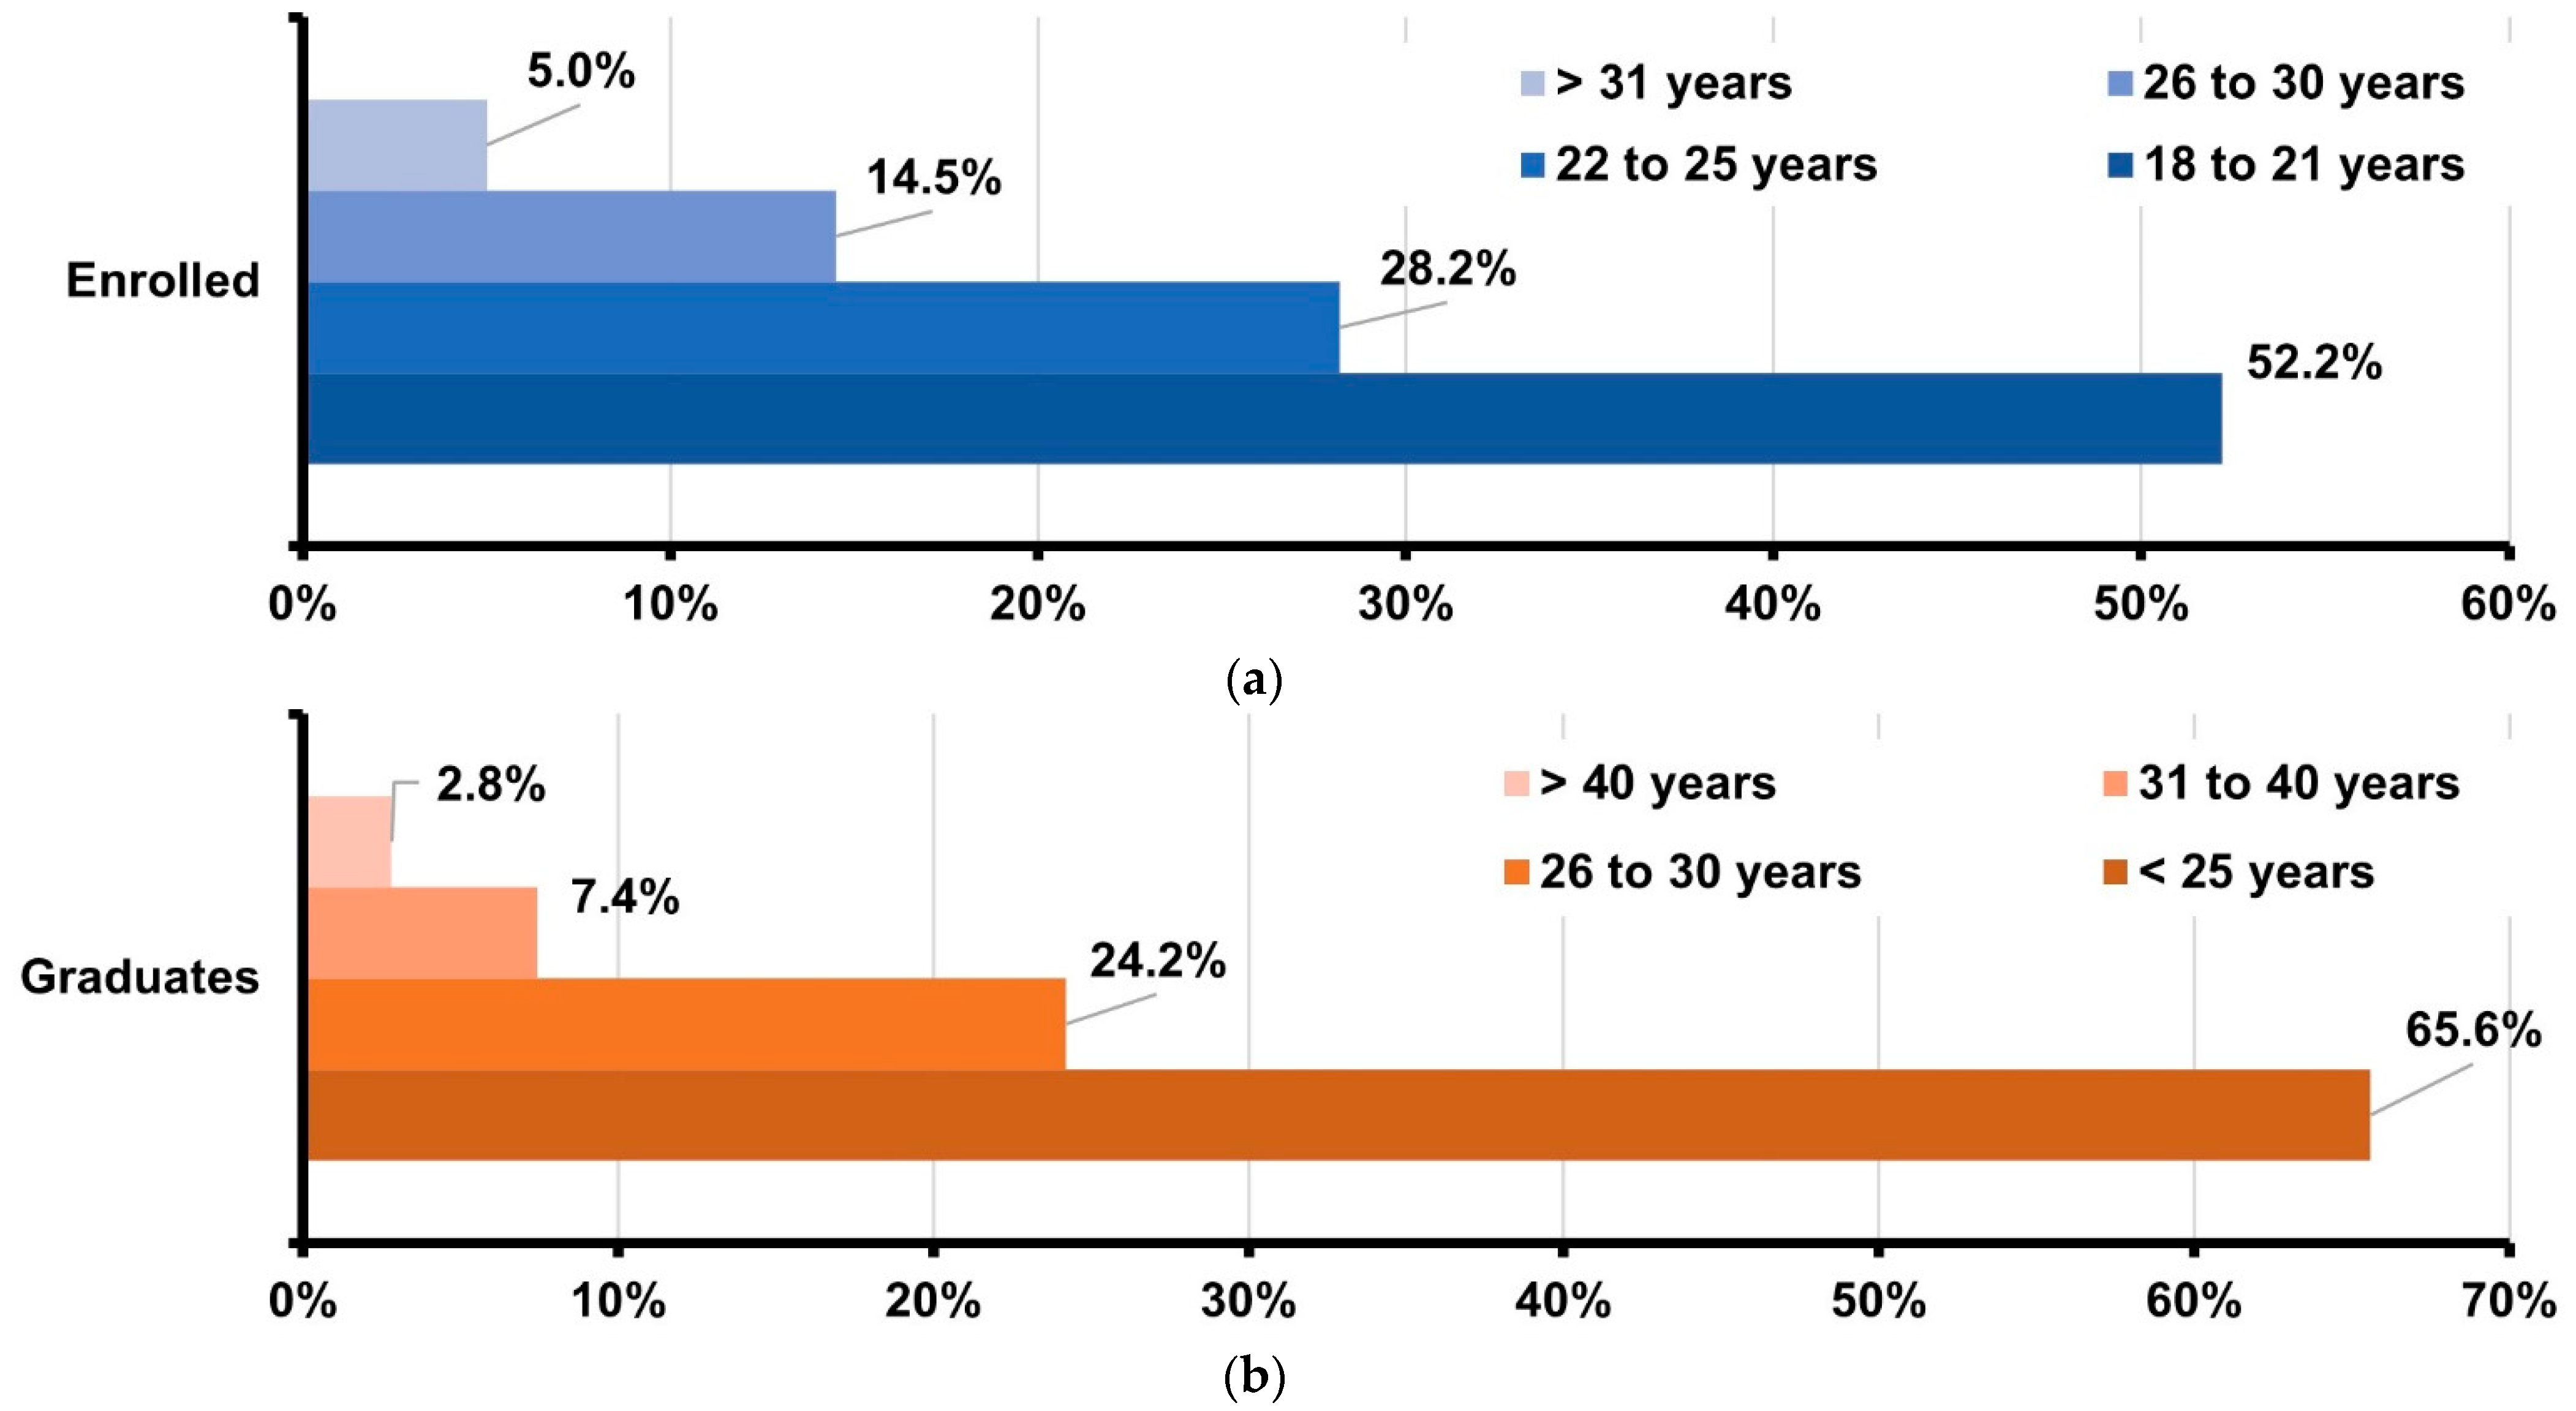
These two factors are not only influential in the low rate of graduates in Engineering and Architecture, but they also influence: (i) the reduced interest that students have in enrolling in degrees included in this area of knowledge, developed above; and (ii) the high age at which students complete their degree. On the second factor, the age at which students finish their studies, it should be emphasized that 52% of the students who enrolled in Engineering and Architecture in the 2018–2019 academic year were between 18 and 21 years old, and therefore, about 48% of the students, were over 22 years old (Figure 6a). This directly influences the fact that Engineering and Architecture is the area of knowledge where the percentage of graduates under 25 years of age is lower, around 65%, and yet the percentage of students over 25 years of age is higher, over 30% (Figure 6b).

3.2. Ph.D. Programs

Table 6 shows the situation of Ph.D. students in Engineering and Architecture in Castilla y León and Spain. These data are not from the first Enrollment but are the total data of students enrolled, regardless of the years of study in the Ph.D. program. In general, it can be said that the situation is similar to that identified for students enrolled in university degrees in the same area of knowledge. In the last six academic years (from the academic year 2015 to 2016 until the last consolidated academic year 2020–2021), the average percentage of students enrolled in Ph.D. programs in both Castilla y León and Spain has been 10.5% and 15.5%, respectively. This means that in the last consolidated academic year, 2020–2021, of the more than 95,000 students enrolled in Ph.D. programs in the different areas of knowledge in Spain, only less than 15,000 students chose programs related to Engineering and Architecture. The situation in Castilla y León is even worse than in the national university system since, in this same academic year, 2020–2021, of the 5200 students enrolled in Ph.D. programs in the different areas of knowledge, around 550 students chose Engineering and Architecture.
As far as the gender gap in students enrolled in Ph.D. programs in Engineering and Architecture is concerned, the percentage of women enrolled in this type of Ph.D. is higher than in related university degrees, being close to 30% in the last six consolidated academic years, both in Castilla y León and in Spain. This means that one in three students in Engineering and Architecture Ph.D. programs is female and that the interest of women in Engineering and Architecture Ph.D. programs is increasing compared to university degrees, where their percentage of enrollment is lower.
If we now analyze the results obtained for students graduating from Engineering and Architecture Ph.D. programs (Table 7), the situation is similar to that analyzed above for students enrolled in these programs. In Castilla y León, the percentage of graduates in Engineering and Architecture, compared to other areas of knowledge, in the last consolidated academic year 2020–2021, was 12%, while in Spain, it was 15.5%.
And as far as the gender gap in graduates in Engineering and Architecture is concerned, we can only highlight the significant reduction that has existed in recent years in Castilla y León going from a percentage of women over 56% in the academic year 2015–2016 to 22.4% in the academic year 2020–2021.
Finally, the results obtained in terms of students enrolled and graduates in Ph.D. programs in Engineering and Architecture were compared. For this purpose, the rate of students who complete their degree compared to the number of students who start their degree was determined (Table 8). The results showed that very few students enrolled in both Castilla y León and Spain manage to complete their Ph.D. programs. However, it is true that in both university systems, a significant improvement was observed, with a rate of Ph.D. students compared to those enrolled of no more than 5% in the 2015–2016 academic year to a rate close to 12% in the 2020–2021 academic year.
These results are critical for the sustainability of the university and R&D&I systems since in the case of Castilla y León, less than 50 students a year obtain their doctorate in Engineering and Architecture, while in Spain, this figure is close to 1200 students. In other words, each year, in each of the country’s 17 autonomous communities, around 70 students complete their Ph.D. program in Engineering and Architecture.

4. Discussion

Castilla y León is the Spanish region with the highest pass rate in the university entrance exams; however, not all students who can access the university system in the region do so, with only 64% enrolling in it. The rest emigrate to other autonomous communities in order to begin their university careers, mainly in Madrid, or they enroll in off-campus universities or in foreign universities [62]. These data reflect a harsh reality in terms of the continued exodus of young people from the region to other regions of the country and the complications involved in studying for a university degree or Ph.D. program in this region, characterized by long distances between its main urban centers.
In the 2020–2021 academic year, around 69,000 students were enrolled in undergraduate degrees in Castilla y León, of which just over 55,000 were studying at public universities in the region, while 14,000 were enrolled at private universities. Adding to the number of students enrolled in undergraduate degrees, the students enrolled in Master’s and Ph.D. programs, Castilla y León had over 80,000 students enrolled in university degrees, regardless of their level [66].
Regarding Engineering and Architecture, in Spain, 90% of the students in this area of knowledge study in Public Universities; however, in the case of Castilla y León, the percentage of students enrolled in public universities is close to 80%, while the remaining 20% study in private universities in the region or non-face-to-face [62]. Regarding the number of degrees, the region offered 85 bachelor’s and master’s degrees in the 2020–2021 academic year within the area of knowledge of Engineering and Architecture. Of these degrees, most were offered by the public universities of the region, mainly by the universities of Salamanca and Valladolid, with more than 20 degrees offered by each of them [63].
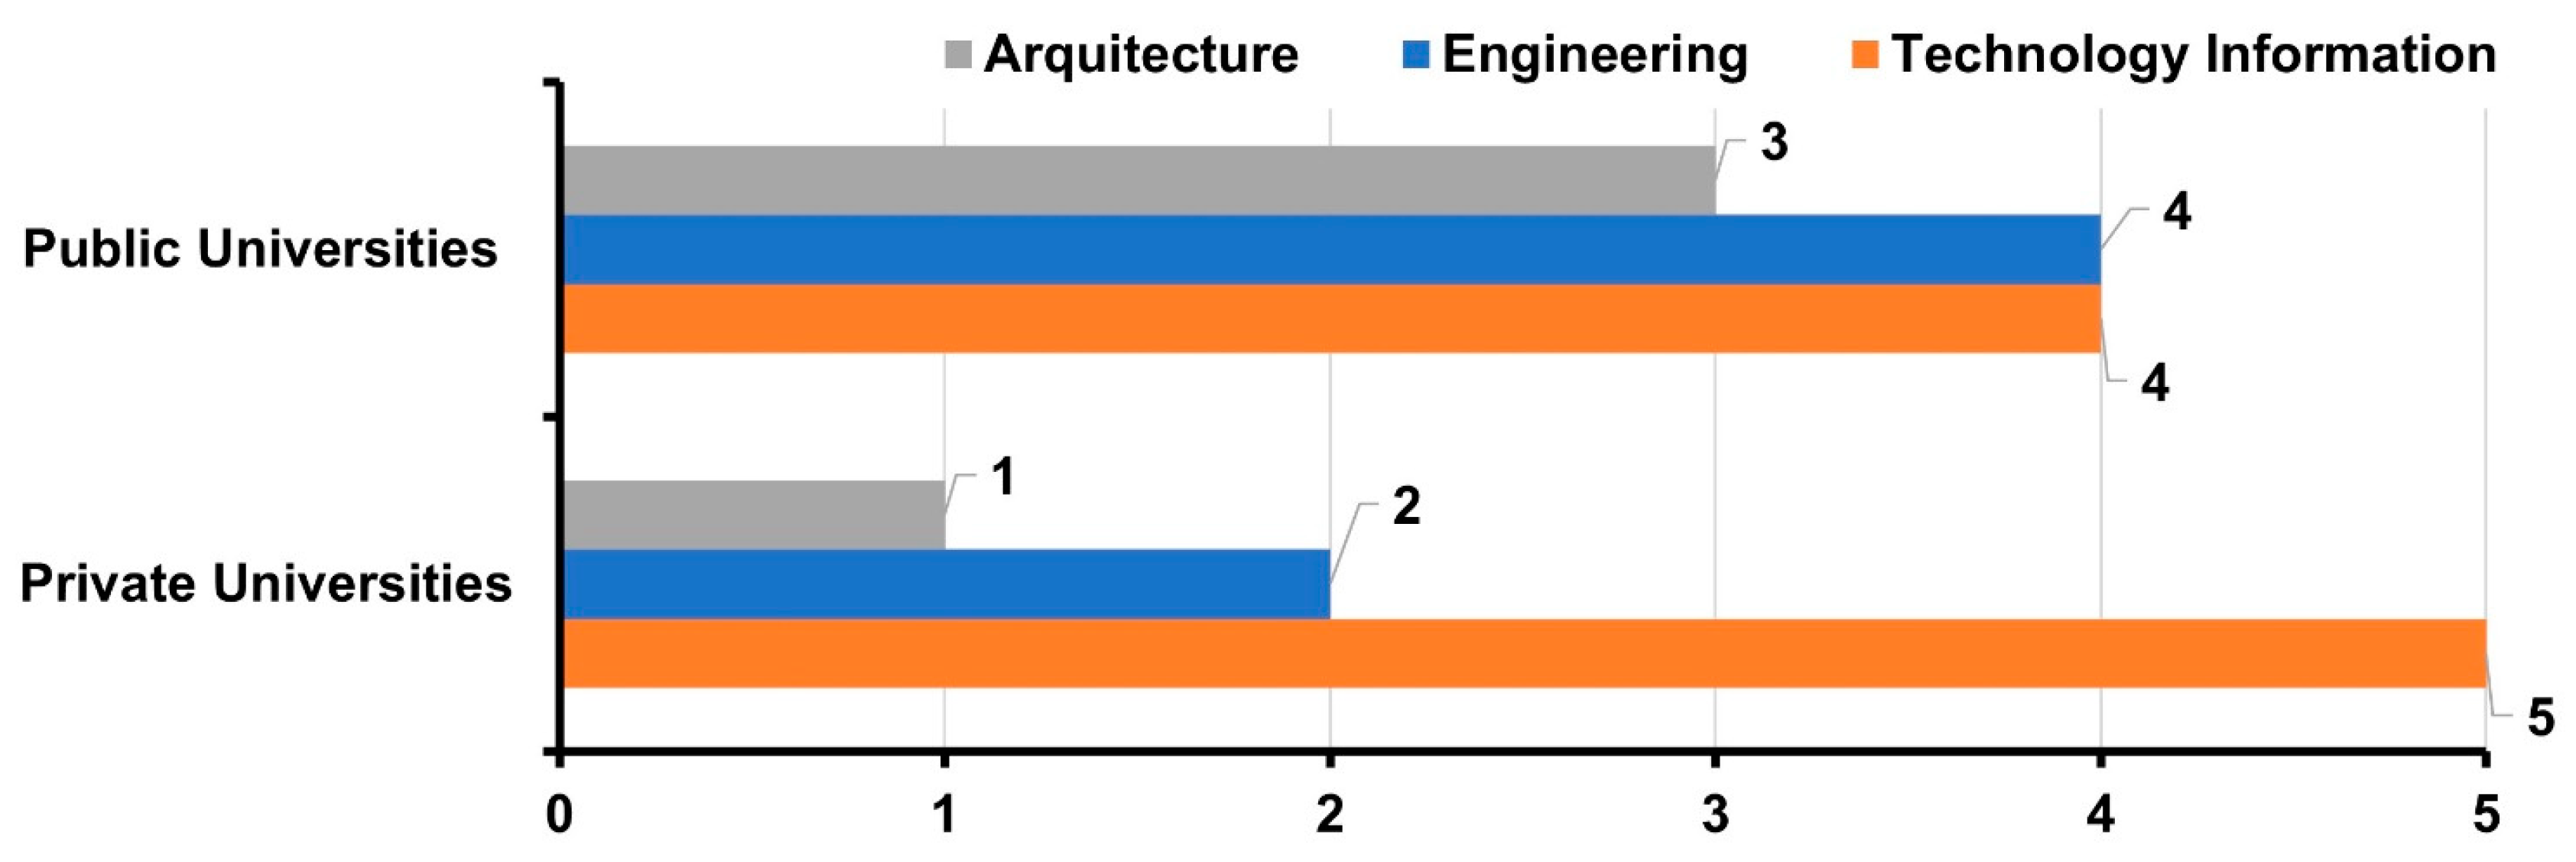
Regarding the different disciplines included in the area of knowledge included in this research and related to STEAM: (i) Engineering; (ii) Information Technology; and (iii) Architecture (Figure 7), the four public universities and two of the five private universities of Castilla y León offer at least one degree in Engineering (regardless of whether it is in Mechanics, industrial organization, aeronautics, civil, mining, electronics, electricity, materials, forestry, forestry, agronomy, etc.). As for Information Technology, all the universities in the region, both public and private, offer undergraduate degrees related to Computer Science. However, the diversity of degrees within the area of Computer Science is less than in the case of Engineering. Finally, as for Architecture, only three public universities and one private university in the region offer degrees related to Architecture.
From these results, it is possible to affirm that less than half of the academic offerings offer undergraduate and master’s degrees related to Architecture. Therefore, the lack of interest in this STEAM specialty is both on the part of the students—in view of the results in terms of the number of newly enrolled students (Table 1) and those enrolled in university degrees (Table 2) and in Ph.D. programs (Table 6)—and on the part of the academic institutions, which do not offer related degrees.
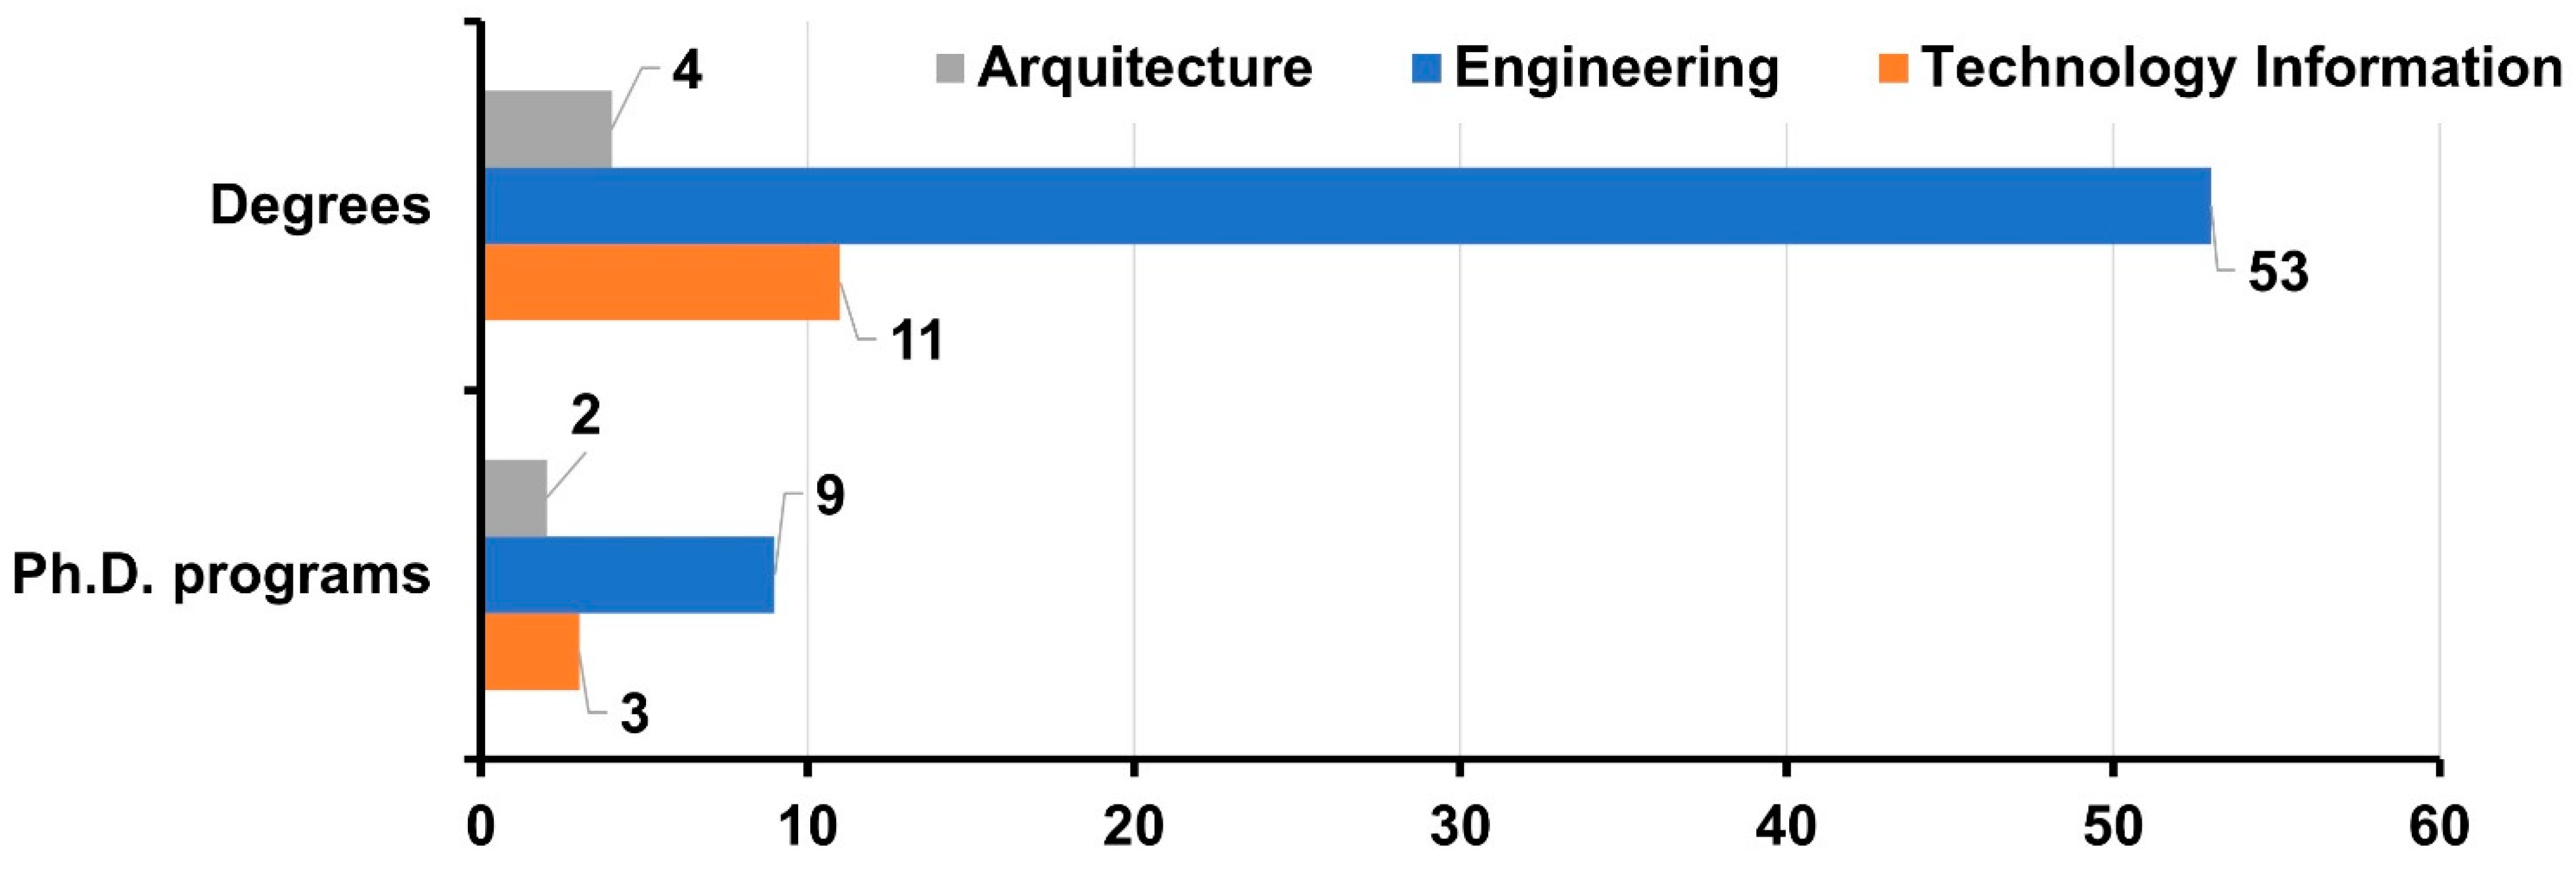
As for Ph.D. programs, a total of 68 undergraduate degrees and 14 Ph.D. programs are offered in the different universities of Castilla y León with undergraduate degrees in the area of knowledge of Engineering and Architecture (Figure 8). The wide academic offer of both undergraduate and Ph.D. programs in Engineering clearly stands out, accounting for 75% of the total number of degrees offered in the region, while in the case of Architecture and Computer Science, with 15 undergraduate degrees and 5 Ph.D. programs, they account for 25% of the total.
In order to compare the situation of the three specialties: Engineering, Information Technology, and Architecture in Castilla y León, from the data, different statistics were used: (i) % students enrolled; and (ii) annual percentage variation rate of students enrolled. The following formula was used to calculate this percentage variation rate:
Variation   rate   ( % ) = n 1 n 0 n 0 · 100
where, n 1 is the number of students in the current academic year and n 0 is the number of students in the previous academic year. Thus, it is possible to calculate the annual variation rate since the 2016–2017 academic year.
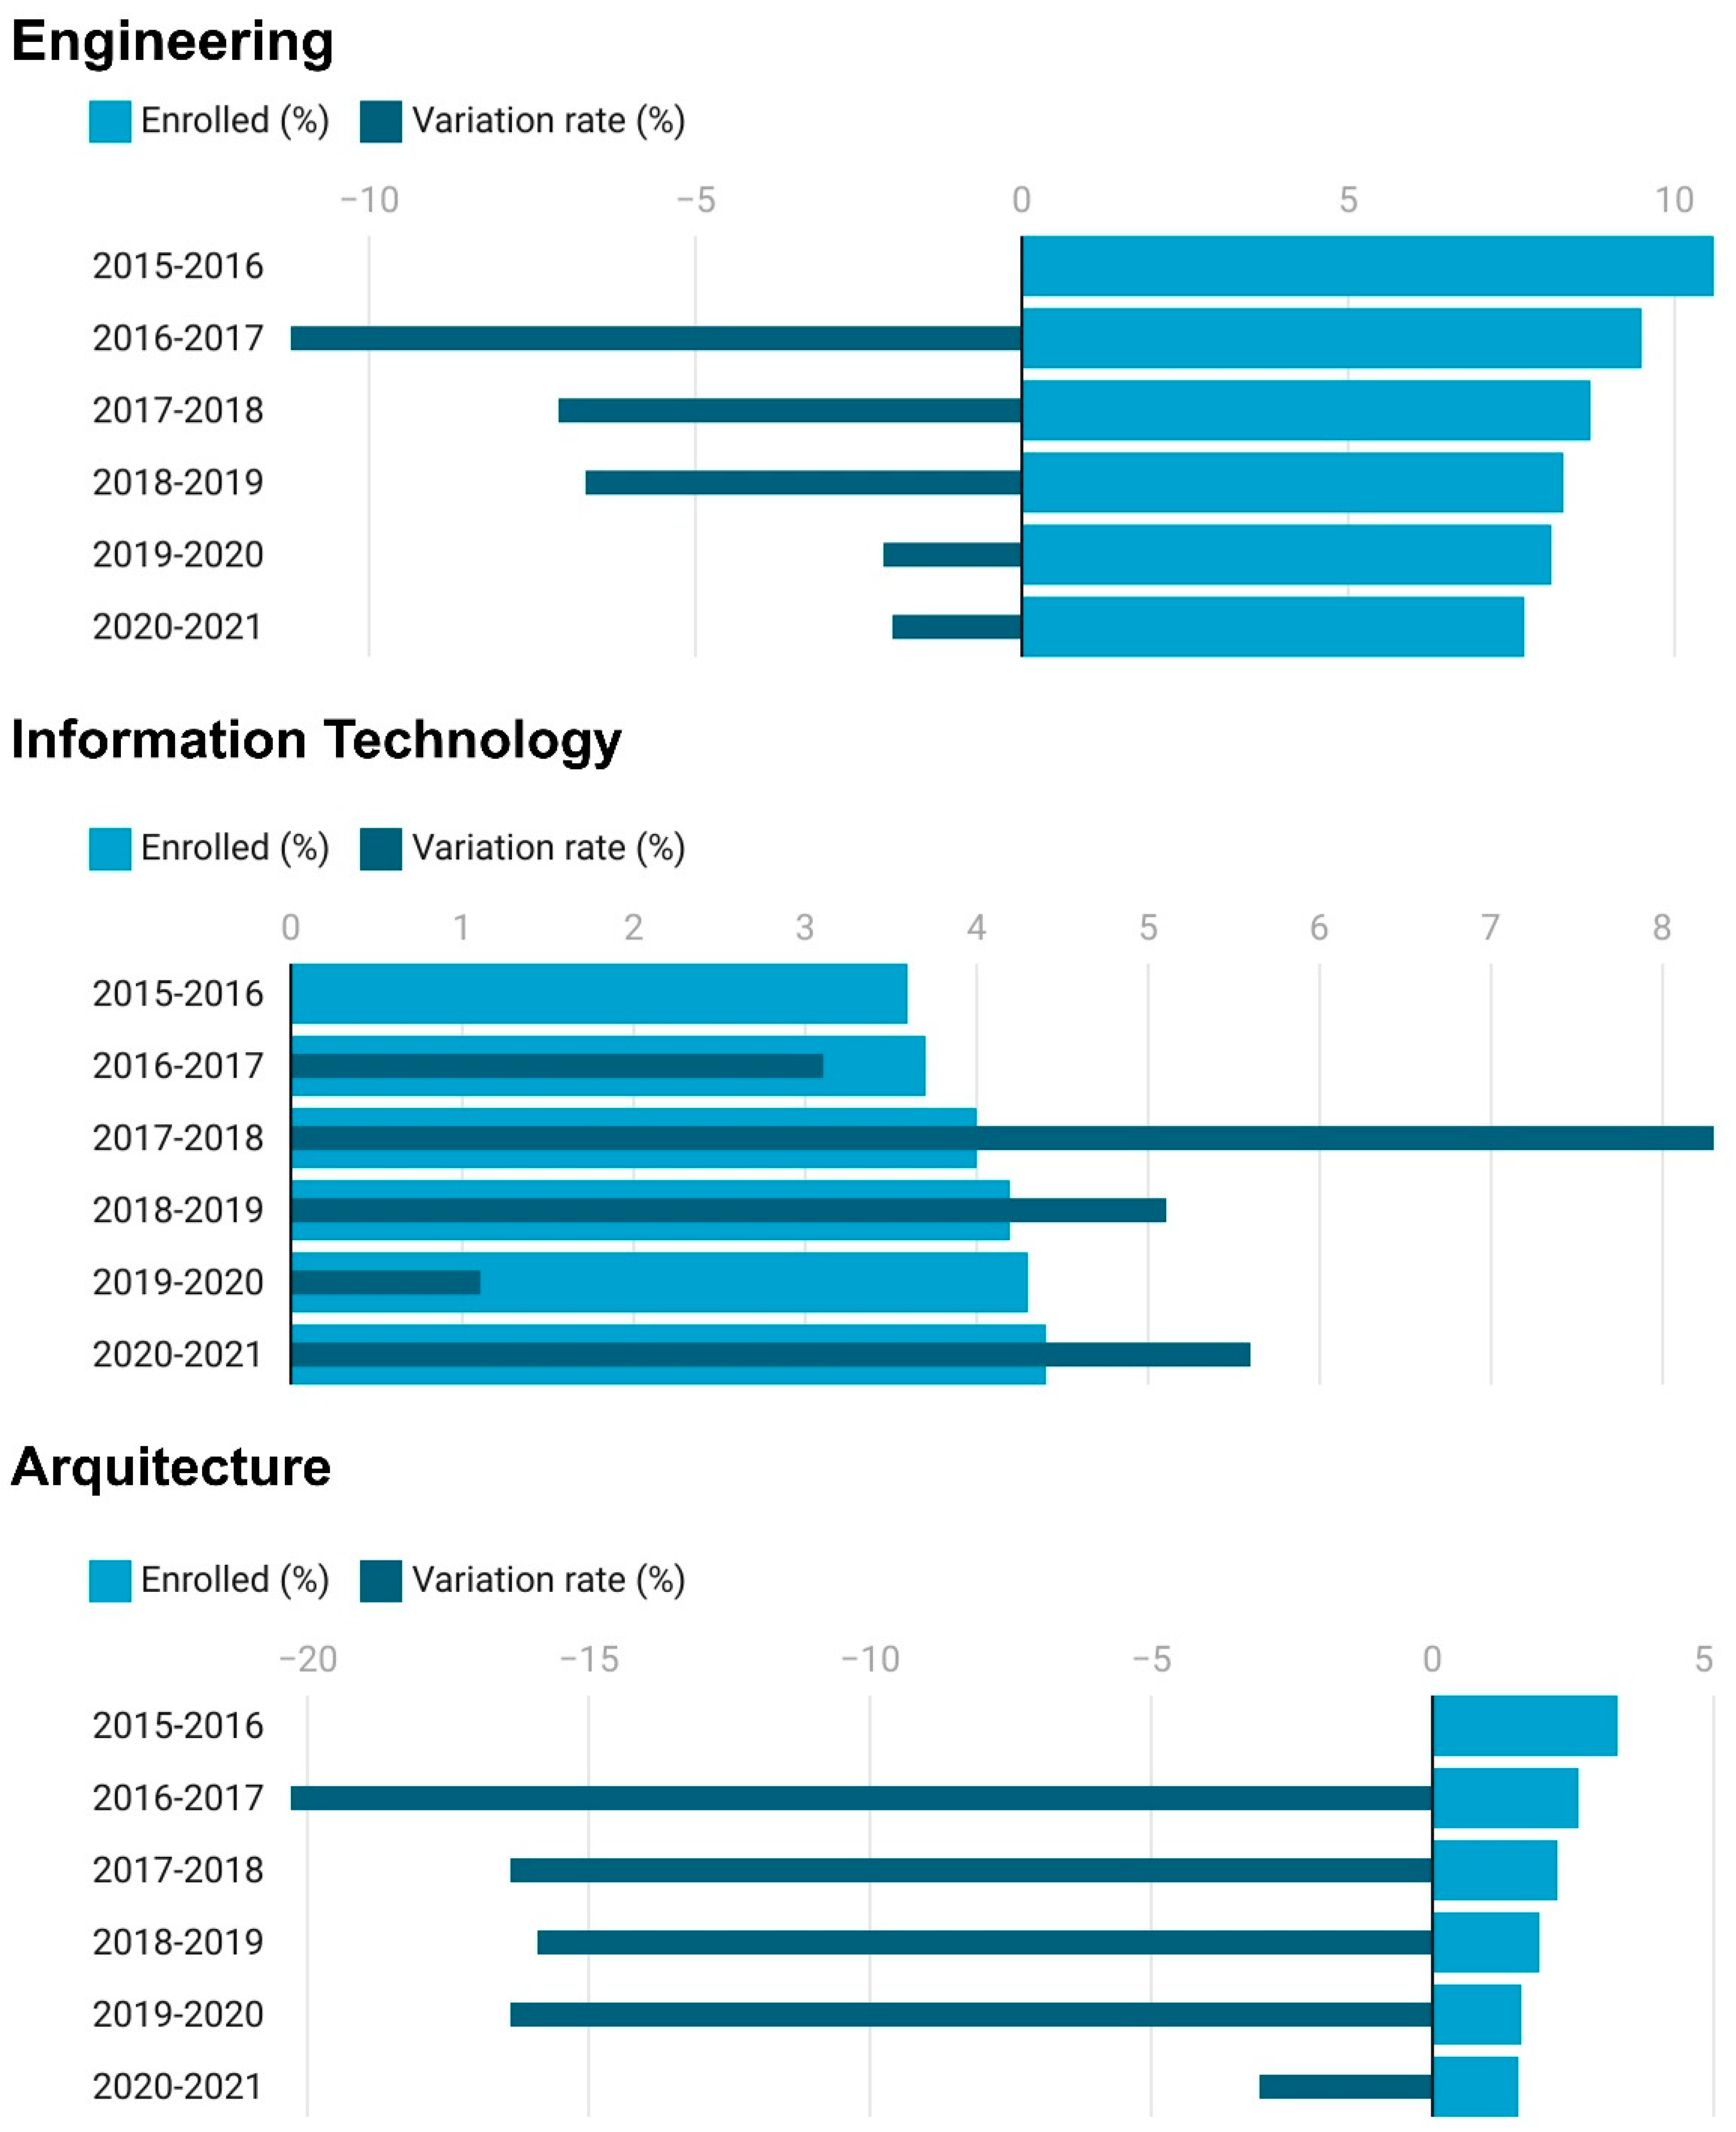
Regarding the number of students enrolled in Castilla y León, the situation is very different depending on whether it is Engineering, Information Technology, and Architecture (Figure 9). Engineering is the degree with the highest percentage of students; however, there is a progressive drop. In the 2015–2016 academic year, the region had more than 7000 students enrolled in Engineering degrees; however, in the last consolidated academic year, 2020–2021, the number of students enrolled was less than 6000. This means that from 2016 to 2021, the variation rate is negative, highlighting the academic year 2016–2017, when the variation rate was over 11%. As for Information Technology, despite being together with Architecture, the two least offered specialties in the region, the situation is very different from Engineering, with a progressive increase in terms of the percentage of students enrolled and the variation rate in positive values each academic year, des-emphasizing the academic year 2017–2018 when the variation rate was higher than 8%. However, the difference in absolute values between Engineering and Information Technology is still wide since in the last consolidated academic year, 2020–2021, around 3200 students enrolled in Castilla y León in Information Technology, while around 5600 students enrolled in Engineering.
Finally, Architecture is the degree with the most unfavorable situation in the region. The percentage of students enrolled falls year after year, being less than 5% in recent years, receiving in the academic year 2020–2021 only 1.5% of the students enrolled. Regarding the variation rate, it reflects the critical reality that the specialty is suffering, accumulating negative values in the last five academic years and, in four of them, a value higher than 15%.
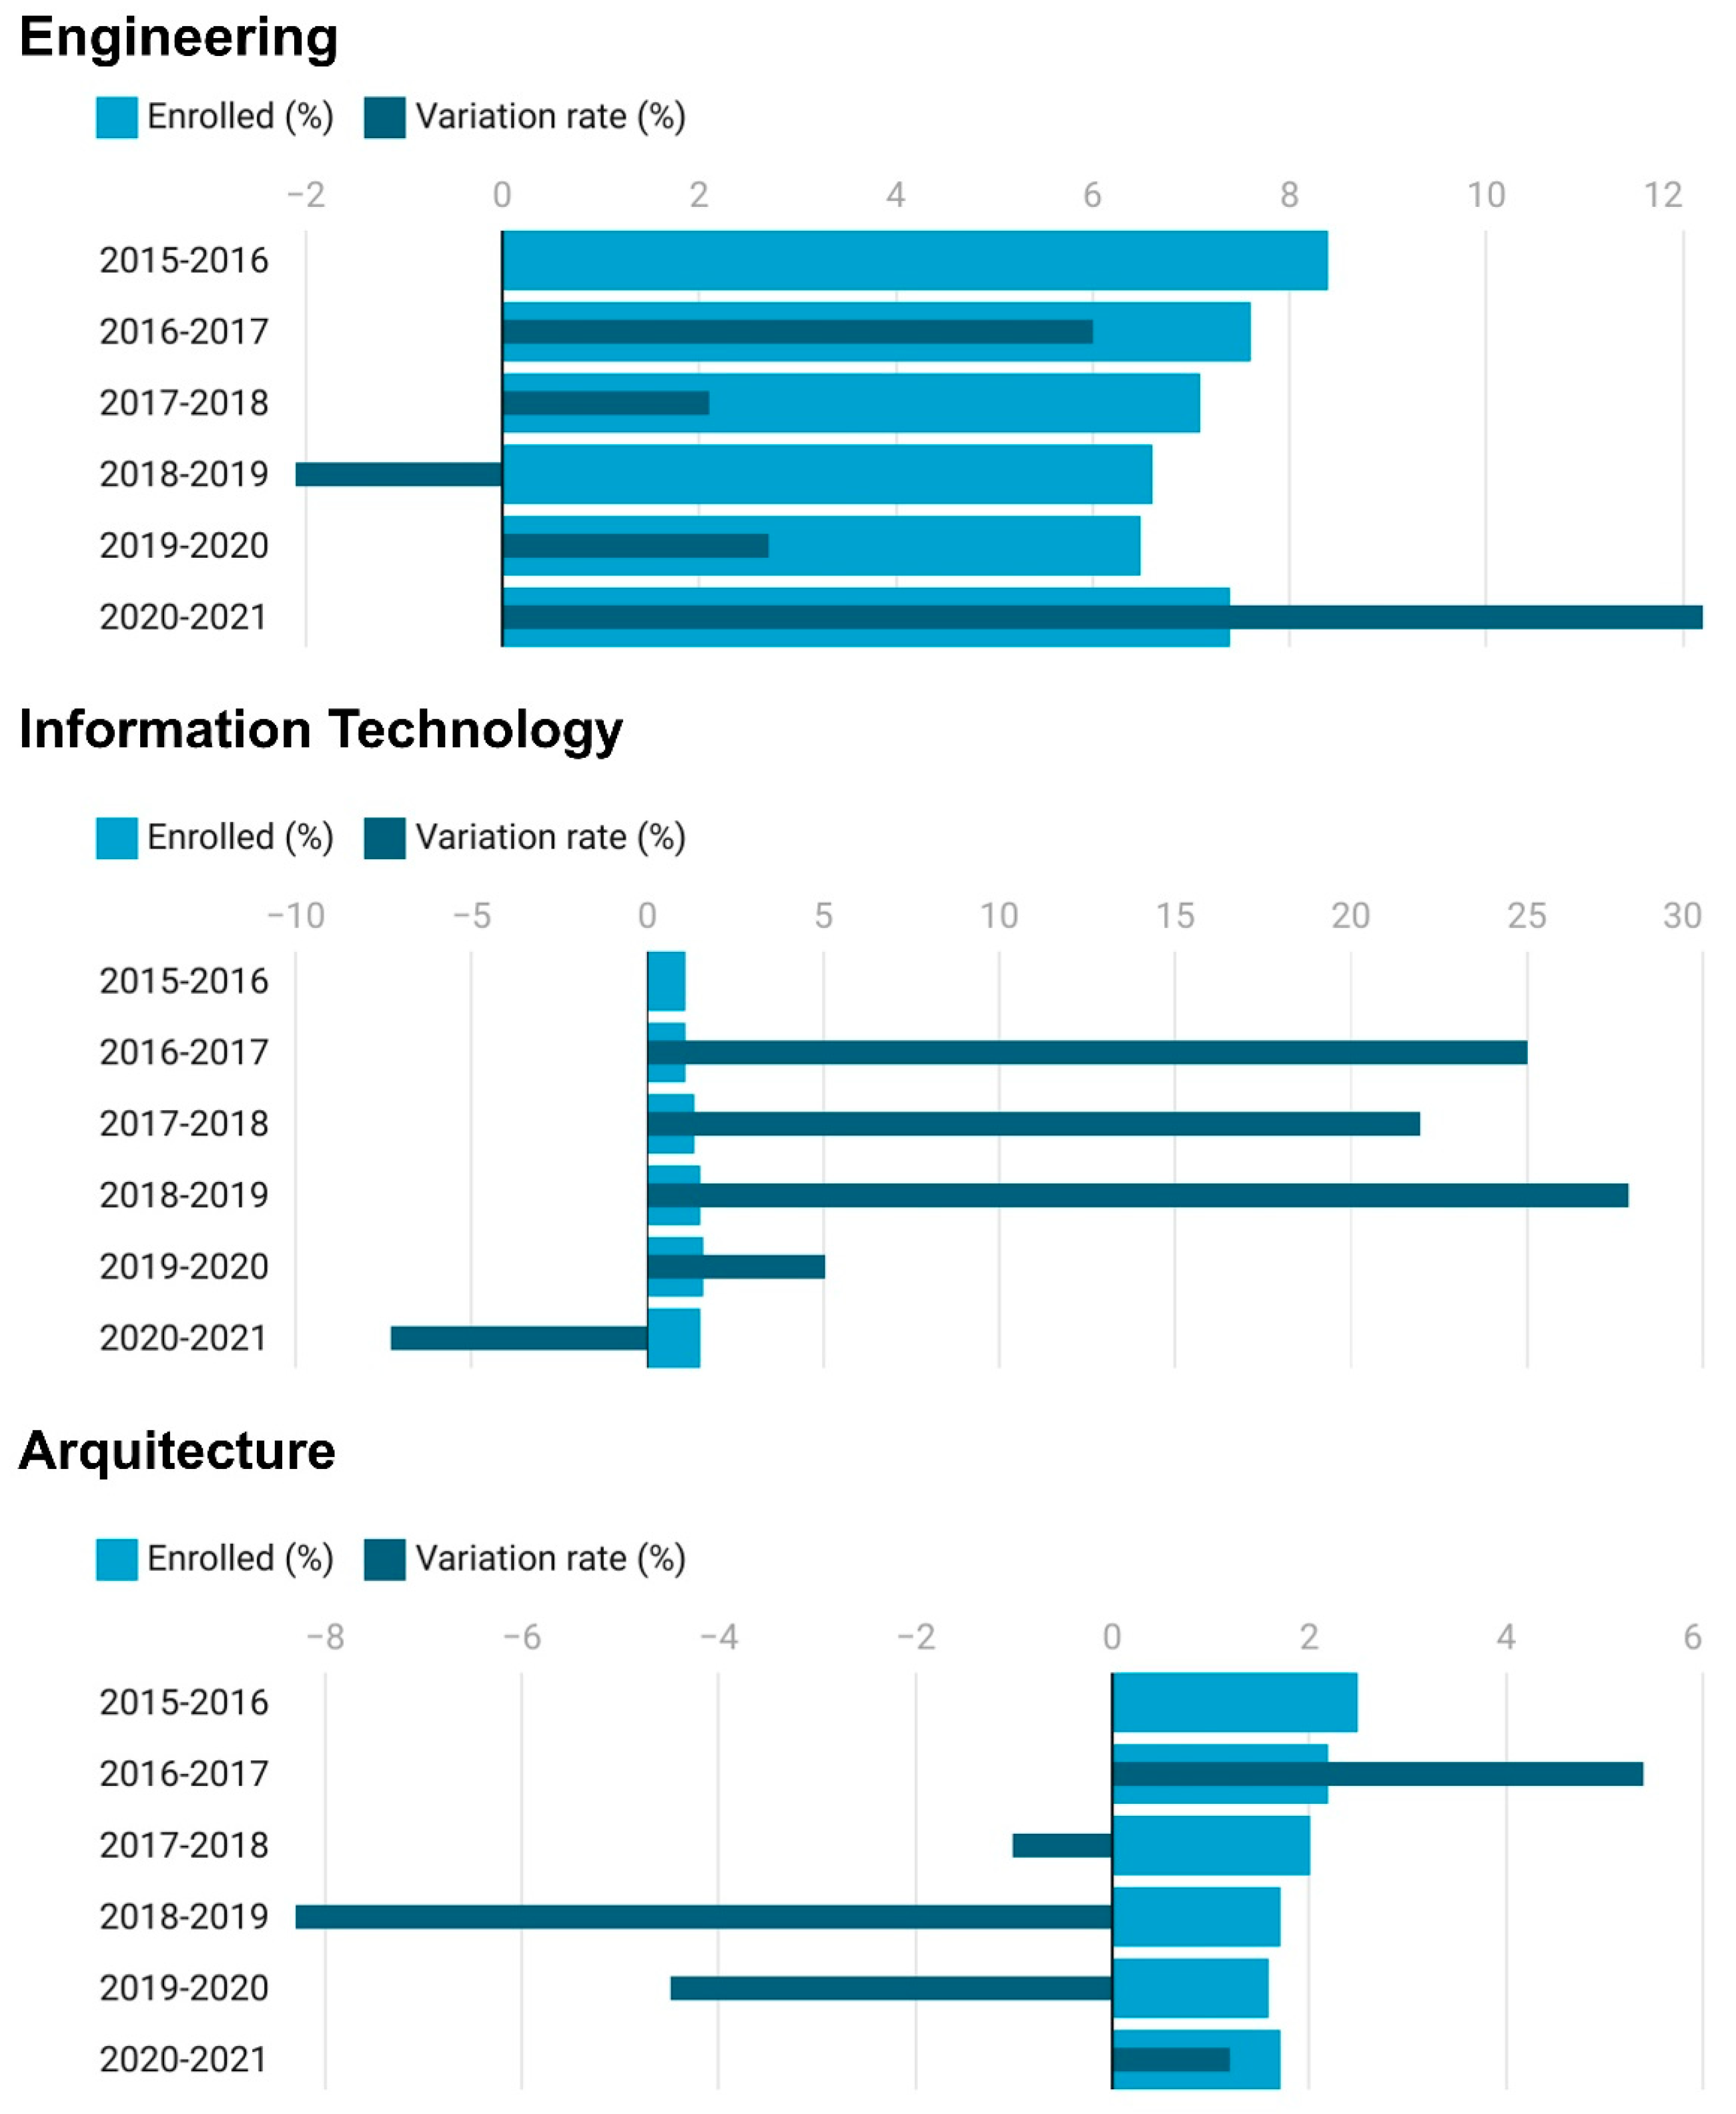
In terms of Ph.D. programs (Figure 10), the scenario has some significant differences with respect to that analyzed above for university degrees. In the case of engineering, the number of students enrolled accounts for about 7% of the total number of students enrolled in Ph.D. programs in Castilla y León. Regarding the variation rate, except for the 2018–2019 academic year, the rest of the academic years from 2016 to 2021 had a positive variation rate, which means that the number of students enrolled increased with respect to the previous academic year. In the case of Information Technology, the percentage of students enrolled is minimal, being less than 2% since the 2015–2016 academic year. However, in each academic year, the variation rate continued to grow, above 20% in the last courses, except for the last consolidated 2020–2021 academic year, probably as a consequence of the confinement originated by COVID-19 and the high mobility restrictions the country suffered. Finally, as for Architecture, the percentage of students enrolled is similar to Information Technology; however, in the case of Architecture, unlike Information Technology, the variation rate in the last academic years was negative, which means a decrease in the number of students enrolled in Architecture Ph.D. programs.
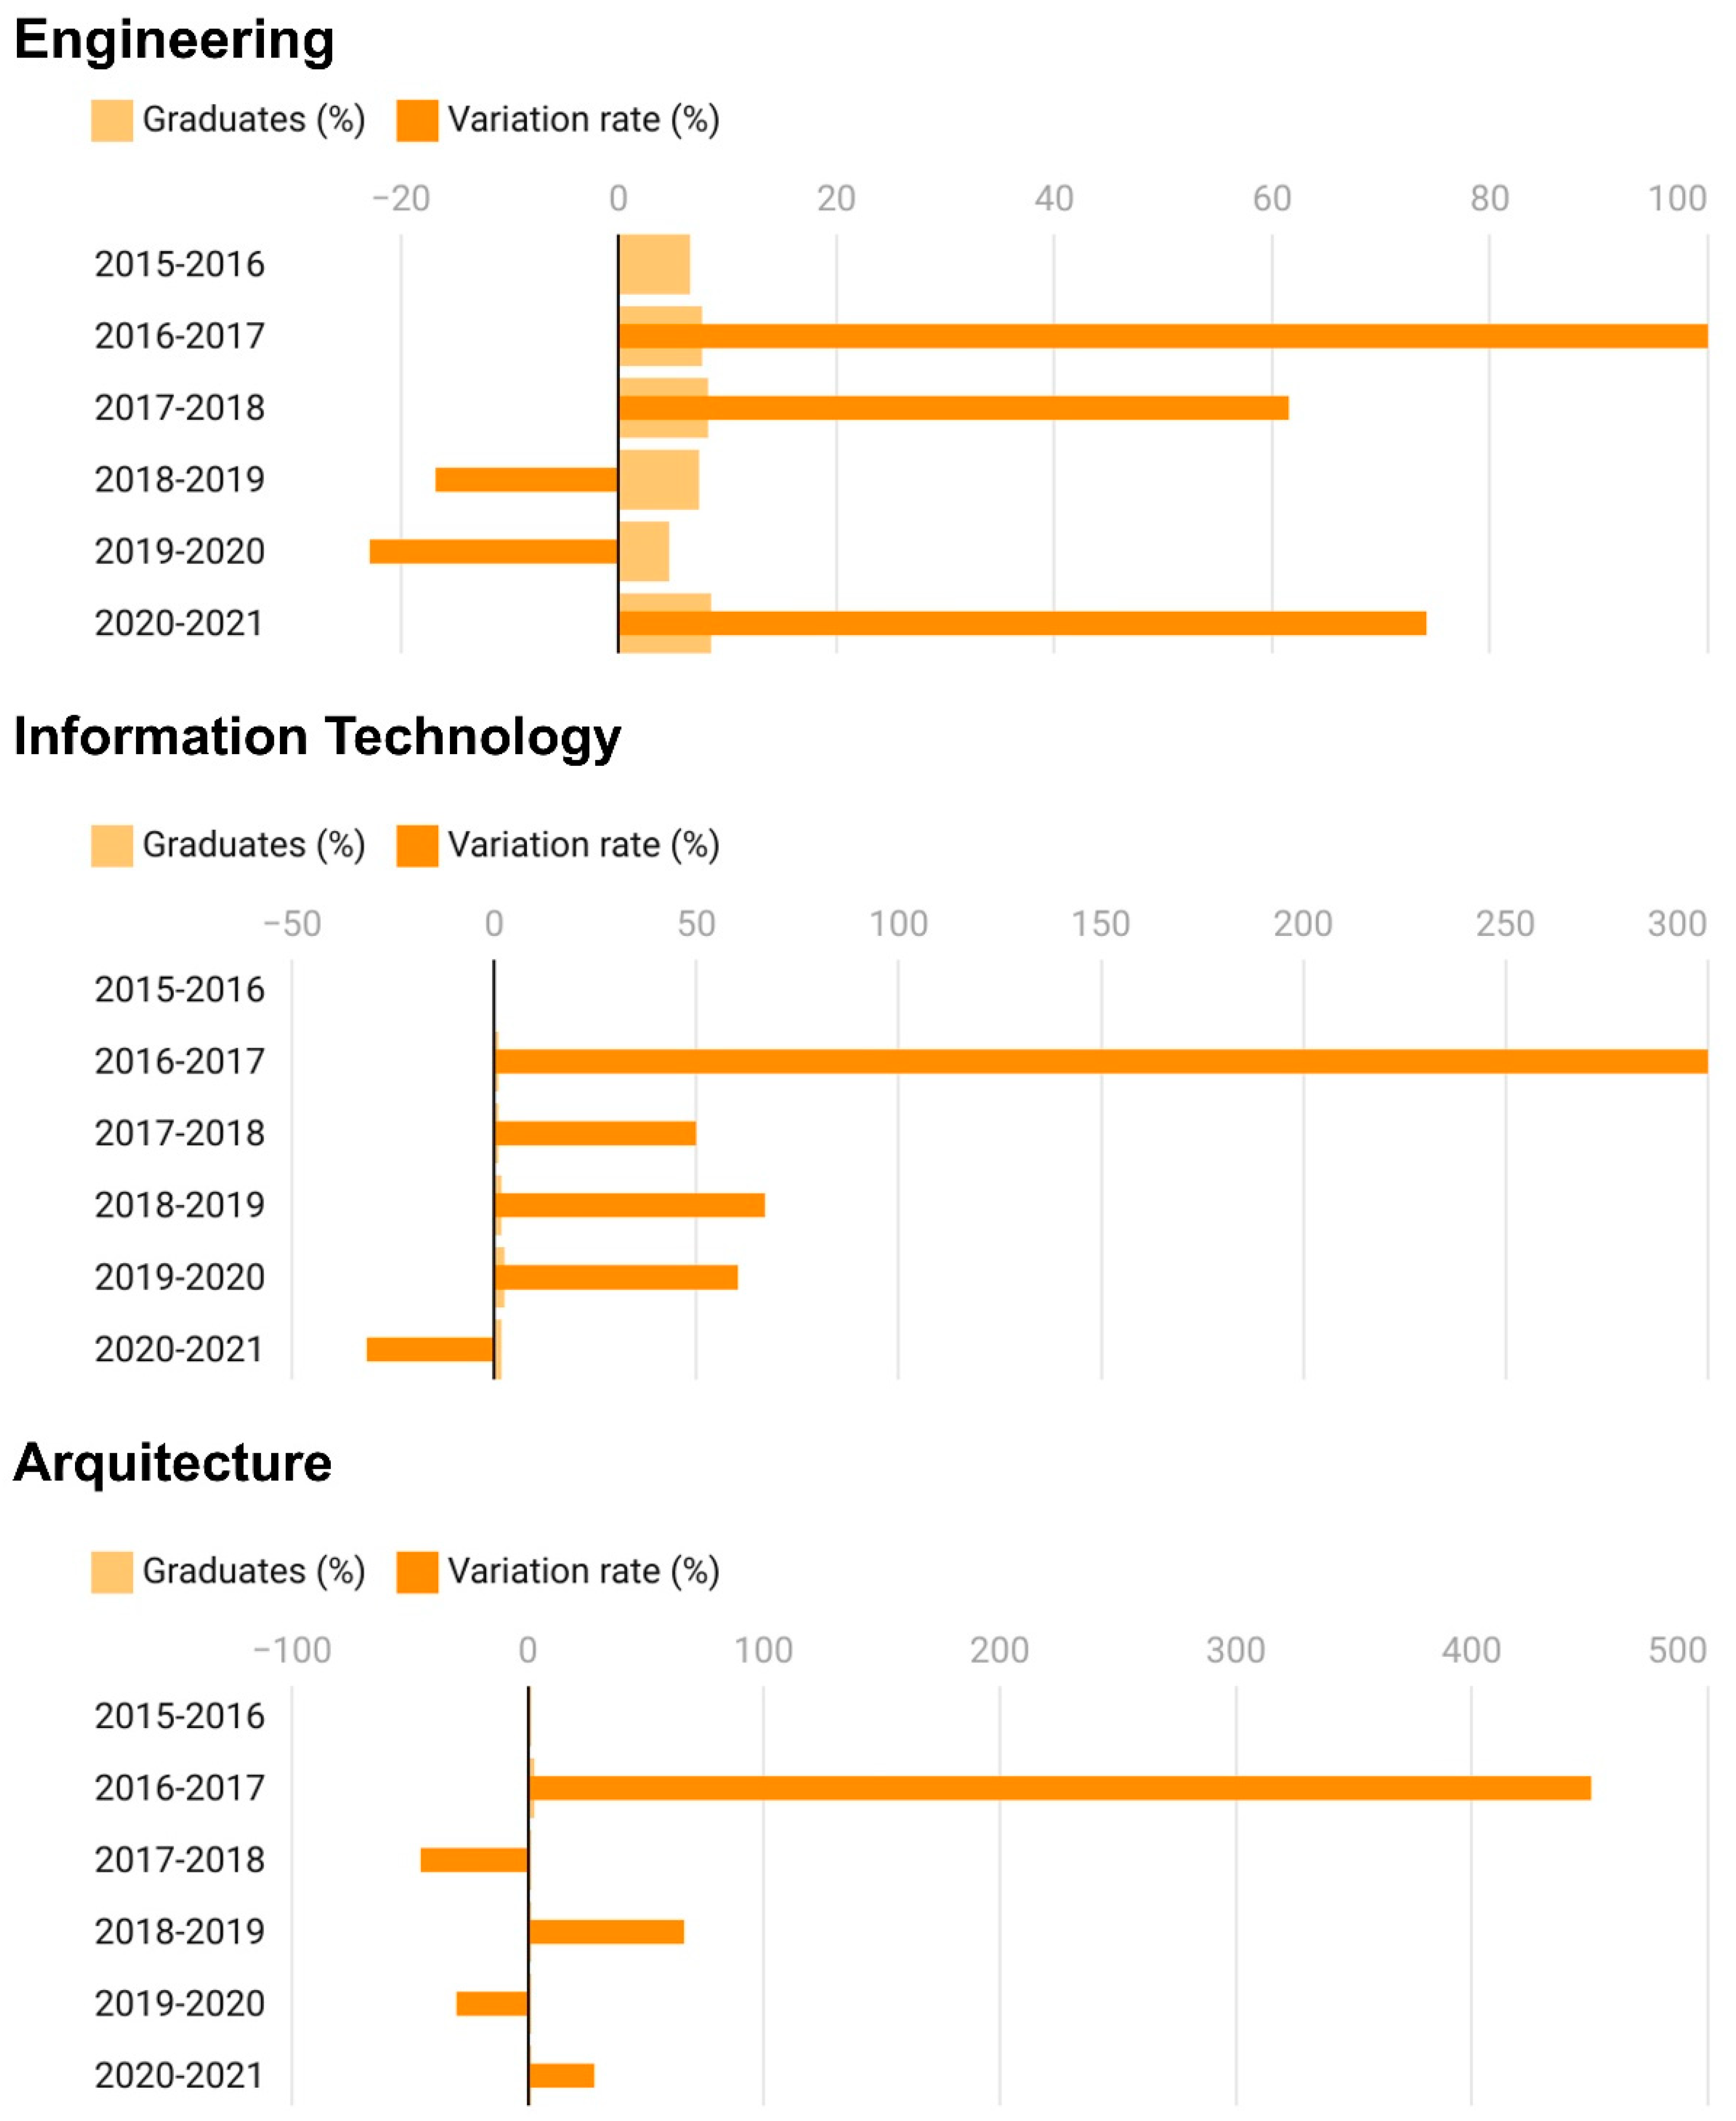
Finally, regarding graduates in the university system of Castilla y León, both in undergraduate degrees and Ph.D. programs, the results are shown in Figure 11 and Figure 12. The data on graduates in Engineering and Architecture from 2015 to 2021 reflect a negative rate of variation, which means a continuous annual decrease in the number of graduates. Only Information Technology had positive variation rates between the years 2107 and 2018, implying growth in the number of graduates in these degrees. However, the percentage of students graduating in Computer Science, in comparison with the rest of the areas of knowledge, is less than 3%, which in absolute numbers means around 300 Computer Science students graduate annually in Castilla y León.
Finally, in terms of Ph.D. program graduates in Castilla y León, the results in the different disciplines analyzed (Figure 12) from 2015 to 2021 reflect a complex scenario in which the number of graduates was very low. In the case of Engineering, in the last six consolidated academic years, the average number of students graduating in Ph.D. programs was less than 40 students, having slightly exceeded this figure in only two of these six academic years.
Regarding the variation rate, the results obtained showed a different situation in which several academic years had a growth in terms of the number of graduating students, highlighting the academic year 2016–2017, when the number of graduates was 26, which doubled the number of students in the previous academic year.
In the case of Engineering, the situation is even more critical as far as the number of Ph.D. graduates is concerned, obtaining an average value in the last six academic years, from 2015 to 2021, of less than ten students, which means a percentage of graduates with respect to the total number of graduates in the different specialties of less than 2%. However, it is possible to observe a progressive growth in its rate of variation, in constant growth.
Finally, in Architecture, the situation is similar to that analyzed above in Engineering in terms of the specific weight of graduates in Ph.D. programs, obtaining an average value in the last six academic years, from 2015 to 2021, in terms of graduates, less than 10, which means a percentage of graduates with respect to the total number of graduates in the different specialties of less than 2%. However, unlike Computer Science, Architecture accumulated from 2015 to 2021 several academic years in which the variation rate was negative, so the discipline did not have the progressive growth that Engineering and Information Technology had in terms of the variation rate.
Finally, it is worth clarifying the unusually high rate of variation suffered in Engineering, Information Technology, and Architecture in the 2016–2017 academic year of 100%, 300%, and 450%, respectively. This exponential increase in the annual variation rate was due to a change in national legislation, which forced the cancellation of existing Ph.D. programs in Spain by September 30, 2017, in order to create new Ph.D. programs adapted to international regulations. This situation meant an increase in the number of students who must defend their Ph.D. Thesis before the end of the 2016–2017 academic year in order not to be forced to start their studies again in a different Ph.D. program [67].
Given this complex scenario, it is difficult to ensure the incorporation into the labor market of enough professionals in STEAM degrees, such as Engineering, Information Technology, and Architecture. A recent report by the Engineering Observatory of Spain [68] has stated that Spain will need 200,000 engineers in the next ten years to meet the current business demand. Currently, there are 750,000 engineers in Spain, of which 3.7% are retired, and the rest are active. In view of the results obtained in this research, in which Spain had in the last six consolidated academic years an annual average of 31,000 graduates in Engineering, Information Technology, and Architecture, it is possible to state that the country will take around seven years to provide the labor market with the STEAM technical graduates that Spain needs, taking into account that this time may increase if the drain of talent to other countries of the European Union or the rest of the world is taken into account. This is a significant figure when compared with the situation in the EU since the number of engineers per inhabitant is 15.7 in Spain, a ratio that exceeds those of France (14.4) and Italy (11), although it is quite far from the number of professionals in Germany (20.4) [68].
In the case of ICT specialists, some reports identify that Spain should create 1.3 million ICT specialists by 2030 [69]. Considering the current rate of graduates in Computer Science in Castilla y León and Spain, with an average of 5000 and 400 graduates respectively in recent years, it is very difficult to achieve this goal.
Following the trend of the current data on engineering degrees (Table 2 and Figure 9), it can be estimated that in the year 2030 in Spain, there will be around 120,000 students enrolled, while in Castilla y León, there will be around 5000. However, the number of engineering graduates in 2030 will be less than 800 students in Castilla y León and 16,000 in Spain. On the other hand, based on the trend reflected in the Ph.D. programs in Engineering (Table 6 and Figure 10), it can be predicted that in 2030 there will be close to 9000 Ph.D. students in Engineering in Spain, while in Castilla y León, there will be around 300.
As for Computer Science, current data (Table 2 and Figure 9) suggest that in the year 2030, there will be around 56,000 students enrolled in these degrees in Spain, while in Castilla y León, there will be around 3500. However, based on the data in Table 3, the number of graduates is expected to be 420 students in Castilla y León and 6177 in Spain.
In the case of Ph.D. programs in Computer Science (Table 6 and Figure 10), it can be estimated that in the year 2030, in Spain, there will be around 2200 students enrolled in these degrees, while in Castilla y León, there will be less than 80 students. Furthermore, the number of graduates in these Ph.D. programs will be 12 students in Castilla y León and 300 in Spain.
Finally, it can be said that Architecture, if it follows the current trend shown in Table 2 and Figure 9, will have the most complicated situation of the three areas of knowledge analyzed in 2030, both in Castilla y León and in Spain. In fact, in Spain it is predicted that in 2030 there will be less than 10,000 students enrolled in Architecture degrees and less than 1000 students in the case of Castilla y León. As for Ph.D. programs in Architecture (Table 6 and Figure 10), the data predict an even more complicated situation in Castilla y León. If the trend shown in Table 6 and Figure 10 continues, by the year 2030 the number of students enrolled in these Ph.D. programs in Spain will be very low and in Castilla y León there will be practically no students enrolled. It should be emphasized that in view of this shortage of architects, who are the most suitable STEAM professionals to be able to tackle the rehabilitation and improvement of energy efficiency in the residential sector, it is very difficult for Spain to achieve the objectives of improving energy efficiency in the residential sector defined by the European Union for the coming years [70].
As far as the gender gap is concerned, the number of women enrolled in the universities of Castilla y León exceeds that of men: 57% are women in undergraduate studies and 54% in Master’s studies [66]. However, this trend is not maintained globally within university degrees in Engineering, Computer Science, and Architecture, where of the almost 10,000 students enrolled, less than 3000 are women. Therefore, less than one in three students enrolled in STEAM degrees in Castilla y León is a woman. This gender gap is even worse in the current labor market, where two out of ten engineering workers are women [68].
However, in terms of the gender gap in students enrolled in STEAM degrees, there are two exceptions in Castilla y León. On the one hand, the number of women enrolled in Computer Science is increasing. On the other hand, in the case of Architecture, the gender gap will decrease as a result of a stable interest on the part of women and a progressive reduction in interest on the part of men.

5. Conclusions

Spain suffers a serious depopulation problem in large part of its territory, a phenomenon that has been called “empty Spain”. Castilla y León, with characteristics that differentiate it from the rest of the regions of the country: (i) large extension of its territory and (ii) very aged population, suffers notably from this phenomenon of depopulation. In order to face this progressive depopulation, STEAM degrees, such as Engineering, Information Technology, and Architecture, are positioned as an option for regional economic development and to increase technological development in this region and thus maintain the population still existing in its territory.
Although Castilla y León has a very varied university system in terms of academic offerings, with nine universities in its territory, four of them are public universities and five are private, with more than 80 undergraduate degrees and Ph.D. programs related to Engineering, Information Technology, and Architecture, the results obtained in this research showed a complicated situation in terms of the number of students enrolled in these degrees. In the last six academic years, Castilla y León has suffered a progressive decrease in the number of students enrolled. The problem of depopulation further accentuated this decline in the number of students enrolled, resulting in a greater progressive decline in the different specialties and programs. The Engineering area is, among the three considered in this research, the one with the highest number of students enrolled in university degrees; however, it suffers a progressive decline that will be more noticeable in the coming years, when the number of students enrolled will be even lower. However, as for the Engineering Ph.D. programs, the number of students enrolled and graduates is increasing every year.
As for Computer Science, in Castilla y León, the number of enrolled students and graduates showed a growing trend in both undergraduate and Ph.D. programs. Of the three specialties analyzed, it is the one with the best future prospects. On the other hand, Architecture is suffering a progressive decline at the global level, both in terms of enrolments and graduates in university degrees and Ph.D. programs. This situation is probably a consequence of the economic and real estate crisis that occurred in Spain in 2007. However, Architecture is the specialty where the gender gap is the smallest, and, as in Information Technology, it follows a decreasing trend. Even so, the presence of women in the different STEAM degrees in the region is less than 30%, with the majority being men.
In view of the results obtained, it is difficult to affirm that both Spain and Castilla y León will be able to meet the demand for engineers and ICT specialists that will exist in the labor market in the coming years. To this situation must be added a progressive reduction of the active population, as a consequence of the retirement of the Baby Boomers, the majority of the active population in Spain today, born during the sixties in the twentieth century and who will retire before 2030.
Castilla y León, like other regions of Spain such as Extremadura, Galicia, or Asturias, as well as European countries such as Sweden, Finland, Estonia, or Latvia, must face a progressive decrease and aging of its population. Given this reality, the trend shown in this paper for Castilla y León—which reflects a lack of technical professionals in the coming years—can serve as an example to the rest of the depopulated regions in Europe to encourage the creation of a regulatory framework that encourages young people to pursue undergraduate and Ph.D. programs related to Engineering, Information Technology, and Architecture in the coming years. The training of future STEAM professionals with high digital skills will be one of the mechanisms to foster 2030 the economic and technological development of depopulated European regions, thereby slowing down the trend toward critical depopulation.
As future lines of research, it could be considered to analyze the real effect of the pandemic in the coming years with respect to graduates. Unfortunately, this task cannot be fully accomplished at this time because undergraduate and Ph.D. programs have a minimum duration of four years in Spain. Hence, all graduates considered in this study entered the corresponding studies before the pandemic, and there are still no data on graduates who entered during the pandemic. In addition, it would be important to study the influence of other factors, such as the state of the labor market, the salary gap that may exist between graduates and PhDs, which may affect hiring, or, in the case of females, how work-life balance affects their professional and academic choices. It would also be useful to study the proportions of students who are foreigners and who remain after completing their studies or who return to their respective countries because this may affect the impact of the number of graduates on local and regional development parameters.

Author Contributions

Conceptualization, P.F.-A., Á.A.-S. and D.V.; methodology, P.F.-A., Á.A.-S. and D.V.; validation, P.F.-A., M.S.-J., Á.A.-S. and D.V.; formal analysis, P.F.-A., M.S.-J., Á.A.-S. and D.V.; writing—original draft preparation, P.F.-A., M.S.-J., Á.A.-S. and D.V.; writing—review and editing, P.F.-A., M.S.-J., Á.A.-S. and D.V.; Supervision, P.F.-A., M.S.-J., Á.A.-S. and D.V. All authors have read and agreed to the published version of the manuscript.

Funding

This research received no external funding.

Institutional Review Board Statement

Not applicable.

Informed Consent Statement

Not applicable.

Data Availability Statement

The data analyzed in the study are public.

Conflicts of Interest

The authors declare no conflict of interest.

References

  1. Croak, M. The Effects of STEM Education on Economic Growth. Honors Theses, 1705, Union College, Schenectady, NY, USA. 2018. Available online: https://digitalworks.union.edu/theses/1705 (accessed on 6 January 2023).
  2. Winters, J.V. STEM graduates, human capital externalities, and wages in the U.S. Reg. Sci. Urban Econ. 2014, 48, 190–198. [Google Scholar] [CrossRef] [Green Version]
  3. Stewart, F.; Yeom, M.; Stewart, A. STEM and soft occupational competencies: Analyzing the value of strategic regional human capital. Econ. Dev. Q. 2020, 34, 356–371. [Google Scholar] [CrossRef]
  4. Freeman, C. The Role of Technical Change in National Economic Development; Routledge: London, UK, 1986. [Google Scholar]
  5. McCauley, S.M.; Stephens, J.C. Green energy clusters and socio-technical transitions: Analysis of a sustainable energy cluster for regional economic development in Central Massachusetts, USA. Sustain. Sci. 2012, 7, 213–225. [Google Scholar] [CrossRef]
  6. Bee, E. Knowledge networks and technical invention in America’s metropolitan areas: A paradigm for high-technology economic development. Econ. Dev. Q. 2003, 17, 115–131. [Google Scholar] [CrossRef]
  7. Dosi, G.; Riccio, F.; Enrica-Virgillito, M. Varieties of deindustrialization and patterns of diversification: Why microchips are not potato chips. Struct. Chan. Econ. Dyn. 2021, 57, 182–202. [Google Scholar] [CrossRef]
  8. Paniagua, A. Smart villages in depopulated areas. In Smart Village Technology. Modeling and Optimization in Science and Technologies; Patnaik, S., Sen, S., Mahmoud, M., Eds.; Springer: Cham, Switzerland, 2020; Volume 17. [Google Scholar] [CrossRef]
  9. Westhoek, H.J.; van-den-Berg, M.; Bakkes, J.A. Scenario development to explore the future of Europe’s rural areas. Agric. Ecosyst. Environ. 2006, 114, 7–20. [Google Scholar] [CrossRef]
  10. Collantes, F.; Pinilla, V. Extreme depopulation in the Spanish rural mountain areas: A case study of Aragon in the nineteenth and twentieth centuries. Rural Hist. 2004, 15, 149–166. [Google Scholar] [CrossRef]
  11. Cáceres-Feria, R.; Hernández-Ramírez, M.; Ruiz-Ballesteros, E. Depopulation, community-based tourism, and community resilience in southwest Spain. J. Rural Stud. 2021, 88, 108–116. [Google Scholar] [CrossRef]
  12. Rosario, P.M.; Carolina, P.R.; Montserrat, N.C.; Elena, M.M. Determinant factors of individuals’ decision to emigrate in rural Spain: The role of ICT-based public policies. Technol. Soc. 2021, 67, 101777. [Google Scholar] [CrossRef]
  13. Alamá-Sabater, L.; Budí, V.; Roig-Tierno, N.; García-Álvarez-Coque, J.M. Drivers of depopulation and spatial interdependence in a regional context. Cities 2021, 114, 103217. [Google Scholar] [CrossRef]
  14. García-Arias, M.A.; Tolón-Becerra, A.; Lastra-Bravo, X.; Torres-Parejo, Ú. The out-migration of young people from a region of the “Empty Spain”: Between a constant slump cycle and a pending innovation spiral. J. Rural Stud. 2021, 87, 314–326. [Google Scholar] [CrossRef]
  15. Escudero, L.A.; García, J.A.; Martínez, J.M. Medium-sized Cities in Spain and Their Urban Areas within National Network. Urban Sci. 2019, 3, 5. [Google Scholar] [CrossRef] [Green Version]
  16. Merino, F.; Prats, M.A. Why do some areas depopulate? The role of economic factors and local governments. Cities 2020, 97, 102506. [Google Scholar] [CrossRef]
  17. Pontones-Rosa, C.; Pérez, R.; Santos-Peñalver, J.F. ICT-based public policies and depopulation in hollowed-out Spain: A survey analysis on the digital divide and citizen satisfaction. Technol. Forecast. Soc. Change 2021, 169, 120811. [Google Scholar] [CrossRef]
  18. Martínez-Abraín, A.; Jiménez, J.; Jiménez, I.; Ferrer, X.; Llaneza, L.; Ferrer, M.; Oro, D. Ecological consequences of human depopulation of rural areas on wildlife: A unifying perspective. Biol. Conserv. 2020, 252, 108860. [Google Scholar] [CrossRef]
  19. Pinilla, V.; Sáez, L.A. What do public policies teach us about rural depopulation: The case study of Spain. Eur. Countrys. 2021, 13, 330–351. [Google Scholar] [CrossRef]
  20. Burholt, V.; Dobbs, C. Research on rural ageing: Where have we got to and where are we going in Europe? J. Rural Stud. 2012, 28, 432–446. [Google Scholar] [CrossRef] [Green Version]
  21. Laborda, A.A.; Aliaga, A.C.; Vidal-Sánchez, M.I. Depopulation in Spain and violation of occupational rights. J. Occup. Sci. 2021, 28, 71–80. [Google Scholar] [CrossRef]
  22. Adam-Hernández, A.; Harteisen, U. A Proposed Framework for Rural Resilience—How can peripheral village communities in Europe shape change? J. Depop. Rural Dev. Stud. 2019, 28, 7–42. [Google Scholar] [CrossRef]
  23. Llorent-Bedmar, V.; Cobano-Delgado, C.; Navarro-Granados, M. The rural exodus of young people from empty Spain. J. Rural Stud. 2021, 82, 303–314. [Google Scholar] [CrossRef]
  24. Pinilla, V.; Ayuda, M.I.; Sáez, L.A. Rural depopulation and the migration turnaround in Mediterranean Western Europe: A case study of Aragon. J Rural Dev. 2008, 3, 1–22. [Google Scholar]
  25. Nieto, A.; Cárdenas, G.; Alonso; Engelmo, A. Moriche Spatial Analysis of the Rural-Urban Structure of the Spanish Municipalities. ISPRS Int. J. Geo-Inf. 2020, 9, 213. [Google Scholar] [CrossRef] [Green Version]
  26. National Statistics Institute. Available online: https://www.ine.es/ (accessed on 16 November 2022).
  27. Junta de Castilla y León. Available online: https://conocecastillayleon.jcyl.es/web/es/geografia-poblacion/geografia.html (accessed on 16 November 2022).
  28. Rodríguez-Rodríguez, D.; Larrubia, R. Protected Areas and Rural Depopulation in Spain: A Multi-Stakeholder Perceptual Study. Land 2022, 11, 384. [Google Scholar] [CrossRef]
  29. García, A.; Stillwell, J. Inter-Provincial Migration in Spain: Temporal Trends and Age-Specific Patterns. Int. J. Popul. Geogr. 1999, 5, 97–115. [Google Scholar] [CrossRef]
  30. Collantes, F.; Pinilla, V.; Sáez, L.A.; Silvestre, J. Reducing depopulation in rural Spain: The impact of immigration. Popul. Space Place 2014, 20, 606–621. [Google Scholar] [CrossRef]
  31. Ayuda, M.I.; Collantes, F.; Pinilla, V. From locational fundamentals to increasing returns: The spatial concentration of population in Spain, 1787–2000. J. Geogr. Syst. 2010, 12, 25–50. [Google Scholar] [CrossRef]
  32. Tania, F.G.; Vicente, L.; Blanca, P.G.; Fernando, R.M. Measuring the territorial effort in research, development, and innovation from a multiple criteria approach: Application to the Spanish regions case. Technol. Soc. 2022, 70, 101975. [Google Scholar] [CrossRef]
  33. Markman, G.D.; Siegel, D.S.; Wright, M. Research and technology commercialization. J. Manag. Stud. 2008, 45, 1401–1423. [Google Scholar] [CrossRef]
  34. Graham, M.A. Deconstructing the bright future of STEAM and design thinking. Art Educ. 2020, 73, 6–12. [Google Scholar] [CrossRef]
  35. Wang, X.; Xu, W.; Guo, L. The status quo and ways of STEAM education promoting China’s future social sustainable development. Sustainability 2018, 10, 4417. [Google Scholar] [CrossRef]
  36. Zhang, Q.; Chia, H.M.; Chen, K. Examining Students’ Perceptions of STEM Subjects and Career Interests: An Exploratory Study among Secondary Students in Hong Kong. J. Technol. Educ. 2022, 33, 4–19. [Google Scholar] [CrossRef]
  37. Hobbs, L. STEAM: Powering the Digital Revolution. In The STEAM Revolution; De la Garza, A., Travis, C., Eds.; Springer: Cham, Switzerland, 2019; pp. 237–246. [Google Scholar] [CrossRef]
  38. Ching-Chiang, L.C.; Fernández-Cárdenas, J.M. Analysing dialogue in STEM classrooms in Ecuador: A dual Socioeconomic context in a high school. J. New Approaches Educ. Res. 2020, 9, 194–215. [Google Scholar] [CrossRef]
  39. Hall, C.; Dickerson, J.; Batts, D.; Kauffmann, P.; Bosse, M. Are we missing opportunities to encourage interest in STEM fields? J. Technol. Educ. 2011, 23, 33–46. [Google Scholar] [CrossRef]
  40. Ministerio de Educación y Formación Profesional. Available online: https://www.educacionyfp.gob.es/portada.html (accessed on 16 November 2022).
  41. Pérez-Pérez, M.P.; Gómez, E.; Sebastián, M.A. Delphi Prospection on Additive Manufacturing in 2030: Implications for Education and Employment in Spain. Materials 2018, 11, 1500. [Google Scholar] [CrossRef] [Green Version]
  42. Epuran, G.; Gardan, I.P.; Gardan, D.A.; Tescașiu, B. Modernisation of Higher Education in the Context of European Integration? A Comparative Analysis, Amfiteatru. Econ. J. 2016, 18, 351–368. [Google Scholar]
  43. Bertrand, M.G.; Namukasa, I.K. STEAM education: Student learning and transferable skills. J. Res. Sci. Teach. Learn. 2020, 13, 43–56. [Google Scholar] [CrossRef]
  44. Arévalo, M.J.; Cantera, M.A.; García-Marina, V.; Alves-Castro, M. Analysis of University STEM Students’ Mathematical, Linguistic, Rhetorical–Organizational Assignment Errors. Educ. Sci. 2021, 11, 173. [Google Scholar] [CrossRef]
  45. Kier, M.W.; Blanchard, M.R.; Osborne, J.W.; Albert, J.L. The development of the STEM Career Interest Survey (STEM-CIS). Res. Sci. Educ. 2014, 44, 461–481. [Google Scholar] [CrossRef]
  46. Heilbronner, N.N. Stepping onto the STEM pathway: Factors affecting talented students’ declaration of STEM majors in college. J. Educ. Gift. 2011, 34, 876–899. [Google Scholar] [CrossRef]
  47. Ketenci, T.; Leroux, A.; Renken, M. Beyond student factors: A study of the impact on STEM career attainment. J. STEM Educ. 2020, 3, 368–386. [Google Scholar] [CrossRef]
  48. Blickenstaff, J.C. Women and science careers: Leaky pipeline or gender filter? Gend Educ. 2006, 17, 369–386. [Google Scholar] [CrossRef]
  49. Makarova, E.; Aeschlimann, B.; Herzog, W. The gender gap in STEM fields: The impact of the gender stereotype of math and science on secondary students’ career aspirations. Front. Educ. Res. 2019, 4, 287–297. [Google Scholar] [CrossRef]
  50. Beddoes, K.; Borrego, M. Feminist theory in three engineering education journals: 1995–2008. J. Eng. Educ. 2011, 100, 281–303. [Google Scholar] [CrossRef]
  51. Beyer, S. Why are women underrepresented in Computer Science? Gender differences in stereotypes, self-efficacy, values, and interests and predictors of future CS course-taking and grades. Comput. Sci. Educ. 2014, 24, 153–192. [Google Scholar] [CrossRef]
  52. Cronin, C.; Roger, A. Theorizing progress: Women in science, engineering, and technology in higher education. J. Res. Sci. Teach. 1999, 36, 637–661. [Google Scholar] [CrossRef]
  53. Jackson, A.; Mentzer, N.; Kramer-Bottiglio, R. Increasing gender diversity in engineering using soft robotics. J. Eng. Educ. 2021, 110, 143–160. [Google Scholar] [CrossRef]
  54. Moote, J.; Archer, L.; DeWitt, J.; MacLeod, E. Comparing students’ engineering and science aspirations from age 10 to 16: Investigating the role of gender, ethnicity, cultural capital, and attitudinal factors. J. Eng. Educ. 2020, 109, 34–51. [Google Scholar] [CrossRef]
  55. Million Women Mentors. Advancing Women and Girls in STEM Careers Through Mentoring. Available online: https://mwm.stemconnector.com/ (accessed on 31 August 2022).
  56. UNESCO. Descifrar el Código: La Educación de las Niñas y las Mujeres en Ciencias, Tecnología, Ingeniería y Matemáticas (STEM); UNESCO: Paris, France; Available online: https://unesdoc.unesco.org/ark:/48223/pf0000366649 (accessed on 31 August 2022).
  57. Valla, J.M.; Williams, W.M. Increasing achievement and higher-education representation of under-represented groups in science, technology, engineering, and mathematics fields: A review of current K-12 intervention programs. J. Women Minor. Sci. Eng. 2012, 18, 21–53. [Google Scholar] [CrossRef] [Green Version]
  58. Benavent, X.; de Ves, E.; Forte, A.; Botella-Mascarell, C.; López-Iñesta, E.; Rueda, S.; Roger, S.; Perez, J.; Portales, C.; Dura, E. Girls4STEM: Gender diversity in STEM for a sustainable future. Sustainability 2020, 12, 6051. [Google Scholar] [CrossRef]
  59. Cheryan, S.; Ziegler, S.A.; Montoya, A.K.; Jiang, L. Why are some STEM fields more gender balanced than others? Psychol. Bull. 2017, 143, 1–35. [Google Scholar] [CrossRef]
  60. FECYT, Spain. Indicadores del Sistema Español de Ciencia, Tecnología e Innovación. Edición 2020. Available online: https://www.fecyt.es/es/publicacion/indicadores-del-sistema-espanol-de-ciencia-tecnologia-e-innovacion-2020 (accessed on 25 November 2022).
  61. Carchano, M.; Carrasco, I.; Castillo, S.; García-Cortijo, M.C. The social economy as a factor of economic development and resilience of population in rural areas. A study of mediating effects in Castilla-La Mancha (Spain). Sustainability 2021, 13, 5544. [Google Scholar] [CrossRef]
  62. Escardíbul, J.O.; Afcha, S. Determinants of the job satisfaction of PhD holders: An analysis by gender, employment sector, and type of satisfaction in Spain. High Educ. 2017, 74, 855–875. [Google Scholar] [CrossRef]
  63. Ministerio de Universidades. Estadística de Estudiantes; Ministerio de Universidades: Madrid, Spain, 2022; Available online: https://www.universidades.gob.es/portal/site/universidades/menuitem.a9621cf716a24d251662c810026041a0/?vgnextoid=42d6372673680710VgnVCM1000001d04140aRCRD (accessed on 16 November 2022).
  64. Fundación Conocimiento y Desarrollo. Las Universidades Españolas. Una Perspectiva Autonómica; Fundación CYD: Madrid, Spain, 2018; Available online: https://www.fundacioncyd.org/publicaciones-cyd/universidades-espanolas-en-perspectiva-autonomica-2018/ (accessed on 20 January 2023).
  65. Ministerio de Universidades. Datos y Cifras del Sistema Universitario Español; Publicación 2019–2020; Ministerio de Universidades: Madrid, Spain, 2020. [Google Scholar]
  66. Consejo Económico y Social de Castilla y León. Situación Económica y Social de Castilla y León 2021; Consejo Económico y Social de Castilla y León: Valladolid, Spain, 2022. [Google Scholar]
  67. Real Decreto 99/2011, de 28 de Enero, por el Que se Regulan las Enseñanzas Oficiales de Doctorado. Available online: https://www.boe.es/buscar/act.php?id=BOE-A-2011-2541 (accessed on 15 December 2022).
  68. Observatorio de la Ingeniería de España. Observatorio de la Ingeniería de España 2022; Fundación Caja de Ingenieros: Barcelona, Spain, 2022. [Google Scholar]
  69. Fundación Universidad Autónoma de Madrid. Índice de Talento Digital IV Edición, Empleabilidad y Talento Digital; Fundación Universidad Autónoma de Madrid: Madrid, Spain, 2022. [Google Scholar]
  70. European Union. Energy Efficiency Directive. Directive 2012/27/EU. 2012. Available online: https://eur-lex.europa.eu/legal-content/EN/TXT/?qid=1399375464230&uri=CELEX:32012L0027 (accessed on 15 December 2022).
Figure 1. Technical degrees within STEAM areas.
Higheredu 02 00006 g001
Figure 2. Population density in Spain.
Higheredu 02 00006 g002
Figure 3. Areas of Castilla y León at risk of depopulation.
Higheredu 02 00006 g003
Figure 4. Research objectives and variables.
Higheredu 02 00006 g004
Figure 5. Research methodology phases.
Higheredu 02 00006 g005
Figure 6. Age distribution of undergraduate students in the 2017-2018 academic year [64]: (a) enrolled; (b) graduates.
Higheredu 02 00006 g006
Figure 7. Distribution of universities in Castilla y León offering undergraduate degrees in Engineering, Information Technology and Architecture.
Higheredu 02 00006 g007
Figure 8. Distribution of undergraduate degrees in Engineering, Information Technology and Architecture by type of university.
Higheredu 02 00006 g008
Figure 9. Variation of students enrolled in university degrees in Engineering, Information Technology, and Architecture in Castilla y León (data from [63]).
Higheredu 02 00006 g009
Figure 10. Variation of students enrolled in Ph.D. programs in Engineering, Information Technology and Architecture in Castilla y León (data from [63]).
Higheredu 02 00006 g010
Figure 11. Variation of graduates in university degrees in Engineering, Information Technology and Architecture in Castilla y León (data from [63]).
Higheredu 02 00006 g011
Figure 12. Variation in the number of students graduating from Ph.D. programs in Engineering, Information Technology and Architecture in Castilla y León (data from [63]).
Higheredu 02 00006 g012
Table 1. Evolution of new students entering Engineering and Architecture degrees (data compiled from [63]).
Academic YearCastilla y LeónSpain
Enrolled
(n)
Enrolled
(%) 1
Female
(%)
Male
(%)
Enrolled
(n)
Enrolled
(%) 1
Female
(%)
Male
(%)
2015–2016306816.024.175.955,23515.922.677.4
2016–2017266313.622.677.453,09115.622.877.2
2017–2018276813.723.676.451,96815.423.276.8
2018–2019275614.523.576.553,19915.823.576.5
2019–2020246313.125.674.453,02215.524.575.5
2020–2021259513.427.172.953,21514.825.974.1
1 % students enrolled with respect to the total amount of students.
Table 2. Evolution of students enrolled in Engineering and Architecture (data compiled from [63]).
Academic YearCastilla y LeónSpain
Enrolled
(n)
Enrolled
(%) 1
Female
(%)
Male
(%)
Enrolled
(n)
Enrolled
(%)
Female
(%)
Male
(%)
2015–201612,50517.527.772.3241,01318.225.474.6
2016–201711,25815.827.572.5228,81717.625.174.9
2017–201810,68714.826.773.3216,72716.824.975.1
2018–201910,16414.325.774.3214,92316.624.975.1
2019–2020985713.925.974.1213,67216.525.274.8
2020–2021987613.625.974.1216,91116.225.574.4
1 % students enrolled with respect to the total amount of students.
Table 3. Evolution of Engineering and Architecture graduates (data compiled from [63]).
Academic YearCastilla y LeónSpain
Graduates
(n)
Graduates
(%) 1
Female
(%)
Male
(%)
Graduates
(n)
Graduates
(n)
Female
(%)
Male
(%)
2015–2016267418.227.572.537,78018.628.971.1
2016–2017208314.230.769.334,96517.628.271.8
2017–2018179912.932.267.829,15815.228.471.6
2018–2019165913.029.670.428,23514.927.572.5
2019–2020165812.229.370.729,32114.127.772.3
2020–2021151411.328.971.128,72013.827.372.7
1 % students graduate with respect to the total amount of graduates.
Table 4. Students enrolled vs. graduates in Engineering and Architecture degrees (data prepared from [63]).
Academic YearCastilla y LeónSpain
Enrolled
(n)
Graduates
(n)
Graduates
/Enrolled
(%)
Enrolled
(n)
Graduates
(n)
Graduates
/Enrolled
(%)
2015–201612,505267421.4241,01337,78015.7
2016–201711,258208318.5228,81734,96515.3
2017–201810,687179916.8216,72729,15813.5
2018–201910,164165916.3214,92328,23513.1
2019–20209857165816.8213,67229,32113.7
2020–20219876151415.3216,91128,72013.2
Table 5. Engineering and Architecture dropout rate (data compiled from [63,64]).
Academic YearCastilla y LeónSpain
Female Dropout after 1st. Year
(%)
Male Dropout after 1st. Year
(%)
Dropout Rate (%)Female Dropout after 1st. Year
(%)
Male Dropout after 1st. Year
(%)
Dropout Rate (%)
2015–201610.114.520.119.826.625.1
Table 6. Evolution of students enrolled in Engineering and Architecture Ph.D. programs (data elaborated from [63]).
Academic YearCastilla y LeónSpain
Enrolled
(n)
Enrolled
(%) 1
Female
(%)
Male
(%)
Enrolled
(n)
Enrolled
(%) 1
Female
(%)
Male
(%)
2015–201644711.930.969.1880215.829.370.7
2016–201748111.029.970.011,16115.629.470.6
2017–201849810.329.570.513,35015.629.570.5
2018–20195009.928.471.613,76615.229.470.6
2019–20205099.729.970.113,92815.029.670.4
2020–202154610.528.971.114,61715.329.770.3
1 % students enrolled in the area of knowledge with respect to the total number of enrolled students.
Table 7. Evolution of graduates from Ph.D. programs in Engineering and Architecture (data from [63]).
Academic YearCastilla y LeónSpain
Graduates
(n)
Graduates
(%) 1
Female
(%)
Male
(%)
Graduates
(n)
Graduates
(%) 1
Female
(%)
Male
(%)
2015–2016168.256.243.743822.033.666.4
2016–20174112.141.558.570416.530.070.0
2017–20185410.725.974.1129217.730.070.0
2018–20195511.529.170.9163917.531.268.8
2019–2020508.830.070.0153916.428.971.1
2020–20216712.322.477.6172915.529.770.3
1 % graduate students with respect to total number of graduate students.
Table 8. Students enrolled vs. graduates in Engineering and Architecture Ph.D. programs (data from [63]).
Academic YearCastilla y LeónSpain
Enrolled
(n)
Graduates
(n)
Graduates/
Enrolled
(%)
Enrolled
(n)
Graduates
(n)
Graduates/
Enrolled
(%)
2015–2016447163.688024385.0
2016–2017481418.511,1617046.3
2017–20184985410.813,35012929.7
2018–20195005511.013,766163911.9
2019–2020509509.813,928153911.0
2020–20215466712.314,617172911.8
Disclaimer/Publisher’s Note: The statements, opinions and data contained in all publications are solely those of the individual author(s) and contributor(s) and not of MDPI and/or the editor(s). MDPI and/or the editor(s) disclaim responsibility for any injury to people or property resulting from any ideas, methods, instructions or products referred to in the content.