Article

Numerical Evaluation of Aerosol Propagation in Wind Instruments Using Computational Fluid Dynamics

1
ANDHEO, Centre ONERA, 29 Avenue de la Division Leclerc, 92322 Châtillon, France
2
Institut Technologique Européen des Métiers de la Musique—ITEMM, 72000 Le Mans, France
3
LAUM—Laboratoire d’Acoustique de l’Université du Mans, UMR CNRS 6613, Avenue Olivier MESSIAEN, 72085 Le Mans, France
4
Buffet Crampon, 5 Rue Maurice Berteaux, 78711 Mantes-La-Ville, France
*
Author to whom correspondence should be addressed.
These authors contributed equally to this work.
Air 2024, 2(3), 292-310; https://doi.org/10.3390/air2030017
Submission received: 19 March 2024 / Revised: 17 July 2024 / Accepted: 12 August 2024 / Published: 27 August 2024

Abstract

:
This paper examines aerosol propagation in wind instruments through numerical analysis, focusing on particle trajectories within five types of wind instruments: saxophone, clarinet, flute, oboe, and trumpet. Using a computational fluid dynamics approach, it is found that larger particles are deposited within the instruments, while smaller micron-sized particles predominantly exit through the bell. The impact of the instrument’s geometry on aerosol dynamics is quantified; cylindrical instruments (clarinet, flute) show an increased rate of small droplet deposition or escape through tone holes compared to conical instruments (saxophone, oboe). Instruments with steep turnings, such as the trumpet, exhibited significant particle deposition. The study suggests that deposited particles are likely to move towards re-emission points, driven by gravity and airflow, especially in straight-shaped instruments. Integrating computational fluid dynamics (CFD) as a complementary approach to traditional experimental methods provides insights into aerosol transmission mechanisms in musical settings. This methodology not only aids in understanding aerosol behavior but also supports the development of safer musical and educational environments, contributing to the field.

1. Introduction

During the COVID-19 outbreak, the world witnessed growing concern over aerosol-mediated disease transmission, particularly in settings where people engage in activities involving close proximity and the sharing of respiratory emissions. Among these activities, playing wind instruments stood out as an intriguing and complex phenomenon with limited information from the scientific literature on the specifics of airflows and droplet emissions generated by playing. Indeed, like any activity, such as speaking or breathing, the act of playing a wind instrument involves the emission of a continuous flow of expelled air and, therefore, aerosol particles of different sizes, which would potentially carry pathogens and contribute to the spread of airborne diseases in confined spaces, such as classrooms, performance venues, or rehearsal spaces [1].
Generally, two main types of respiratory particles are distinguished, characterized by their size. Droplets are larger than 5 to 10 μ m [2] and follow a ballistic trajectory depending on their mass, which includes a risk of transmission in close proximity to the emitter. Aerosols refer to finer droplets that have the ability to remain in the air for a few minutes to a few hours depending on relative humidity [3,4]. This implies a potential accumulation of aerosols in confined and/or poorly ventilated rooms, which follow the surrounding airflows.
Therefore, studies attempting to characterize wind instruments have had two main objects. The first was the study of the propagation of airflows leaving wind instruments while they are played, relying on experimental setups involving tracer gases or particle visualization such as Particle Image Velocimetry (PIV) [5] or schlieren imaging [6]. These qualitative methods have provided some valuable observations of the thermal plume around the instrument and musician, as well as an approximation of the distance crossed by the airflow. The second type of study consists of measuring the concentration of droplets and aerosols in the air (expressed as particles (P) per liter, P/m3 or P/s), collected using sampling tubes at a precise point on the exit of the instrument or eventually with a funnel. They generally use Aerosol Particle Sizer (APS) and focus on size ranges starting at 500 nm [6,7,8,9] or 300 nm [10,11] and with a maximal size of 20 μ m. Comparison of absolute numbers resulting from these experiments is made difficult by the accumulation of variations in measurements protocols from one study to another: size range considered, placement and flow rate of the sampling tube (which, respectively, influence the rate of particles captured by the tubes and the evaporation of droplets, and therefore, their size when they reach the measurement cells), dynamics of the play (long notes vs. full musical phrases), fingerings, etc. The main observation from all these studies is the high level of both inter-individual and intra-individual variability. This variability can be explained by factors linked to the emission parameters and the measurement methods. In [7], it was shown that one musician playing one note for 10 s with the exact same protocol and setup can have a ratio of 1 to 50. High variability is also observed for other actions such as breathing and speaking. These results and their variability make it difficult to quantitatively evaluate particle emissions. In particular, the hierarchy of the instruments emitting the most aerosols varies depending on the studies, leading [8,9] to consider playing any instrument as one similar activity.
The studies [10,11,12,13,14] have attempted to rank instruments or singers by emission rates, but no significant trends emerged from these studies. For example, in [14], the trumpet emits about 6 times more than the clarinet and oboe, while in [13], the oboe emits 2 to 3 times more than the trumpet. In this context, replicable numerical methods can be a first step in assessing trends and promoting a sampling method based on airflow trajectory simulations. One of the main issues with the current literature is the low number of instruments and/or players in each study, and the lack of focus on the inner part of the instruments, whose study may provide key elements for understanding the discrepancies and variability. To this end, the authors measured in a prior study [7] the particle concentration at the bell of a clarinet in controlled conditions, and numerically simulated the propagation of aerosols inside the bore of the clarinet for different diameters, comparing the ratio of particles exiting the clarinet. In the present paper, the authors focus on the effects of instrument geometries (cones, cylinders, bells) and playing (lateral tone holes) using numerical techniques only to address the instrument’s point of view in aerosol dispersion.
Finally, all of the cited studies found that the size of the emitted particles is mostly in the submicron range. Ref. [9] states that 70 to 80% of the measured particles are between 0.25 and 0.8 μ m; ref. [7] reports a median size between 200 and 300 nm; ref. [8] finds that aerosols emitted while playing wind instruments have a size distribution close to breathing, centered around 0.57 μ m, and differing from speaking or singing [15,16]. Nevertheless, the measurement methods vary, and the size of the measured particles depends on the measurement conditions and setup. Therefore, the measured particles are not only linked to their initial size right after their generation from the instrument or person.
While these approaches have provided valuable insights, they are often limited by challenges in accurately representing the intricate interplay of fluid dynamics, instrument design, and player behavior, which are assumed to impact the amount of aerosols generated and their size. The literature has highlighted little agreement between studies in terms of particle size and distribution. The characteristics of the player or the instruments need to be considered, but the position and characteristics of the sampling devices also play a crucial role. It is possible that the flow of particles may differ according to the input velocity of the air, and the fingerings in the case of woodwind instruments might cause particles to deviate and drive them away from the sampler. While previous studies have attempted to characterize these emissions through experimental setups using tracer gases or particle visualization techniques, there has been a notable absence of numerical studies focusing on the internal dynamics of aerosol propagation within wind instruments.
Though some works exist on the dispersion of emitted particles inside a room using the numerical tool of computational fluid dynamics (CFD) [13], their dispersion inside wind instruments has not been published until now. The propagation of airflows escaping wind instruments has been studied qualitatively using Particle Image Velocimetry [17] or schlieren imaging [18,19,20], showing that airflows can escape through tone holes for woodwinds or leak at the mouthpiece but mainly exit through the bell. Flow visualizations by [19], as well as anemometer measurements by [10,19], indicated that airflows escaping the bell of wind instruments (except for air jet instruments like the flute or piccolo) have low velocities and therefore quickly reach the velocity of ambient airflows in the room. In this context, computational fluid dynamics (CFD) emerges as a powerful tool that can significantly advance our understanding of aerosol propagation in wind instruments. This can not only facilitate the investigation of aerosol dispersion patterns but also provide insights into the factors that influence particle transport and deposition within the instrument and its immediate surroundings. However, it is crucial to note that while CFD provides significant insights, the results derived from these simulations require experimental validation to ensure their accuracy and reliability. The primary objective of this study is to employ computational fluid dynamics to assess the influence of wind instrument bore shapes, fingerings, and tone hole configurations on particle emission rates across various particle size ranges. We aim to quantify the proportion of particles exiting through the instrument’s bell, tone holes, and those deposited on the inner bore wall relative to the particles introduced at the tube’s inlet. This research seeks to provide a comparative analysis of the impact of geometric features on wind instrument aerosol emission behavior, without making definitive recommendations in a pandemic context.

2. Materials and Methods

2.1. Solver

Fluid computations are performed using the Siemens 2020 FloEFD solver [21] within the Dassault Systèmes SolidWorks CAD environment. This solver is based on a finite volume approach to solve the Navier–Stokes equations for compressible fluids within the framework of Favre averaging. It utilizes Cartesian meshing technology with Octree refinement to decrease cell size and increase mesh density where necessary. Only a k ϵ -type turbulence model is available in the software; it is widely used in the industry and other codes and has proven to be relevant in such airflow applications. To model the boundary layer at the walls, a technology of so-called “partial/smart cells” is used; in a partial cell, several control volumes are considered, with a minimum of two (one fluid and one solid) separated by plane faces associated with the geometry. A specific wall law is applied on those faces to simulate the boundary layer, known as the Modified Wall Functions approach. This approach uses a Van Driest profile instead of a logarithmic profile. If the mesh cell size near the wall is larger than the boundary layer thickness, the integral boundary layer technology is used. Convergence of steady computations is controlled by predefined goals, primarily the flow rate at the inlet/outlet, the mean and maximum velocities in the computational domain, and the amount of travel of flow particles in the fluid domain.
In addition to computing the fluid flow, the software enables solving the motion of dilute spherical liquid particles (droplets) of constant mass in a steady-state flow field. The particle resistance coefficient (drag coefficient C D ) follows Henderson’s formula [22]. This general formulation covers regimes from continuum to rarefied flows at Mach numbers up to 6 and Reynolds numbers Re up to the laminar–turbulent transition. It simplifies to the Stokes–Oseen equation C D = 24 Re 1 + 4.5 at Reynolds numbers high enough to ensure continuum but low enough to avoid inertial effects.
This approach provides a reliable estimation for the drag force acting on spherical particles across a range of Reynolds numbers typical of conditions within wind instruments. This is particularly relevant for our simulations, where particles of various sizes (0.5, 5, and 50 µm) are transported within airflow fields that vary in velocity and turbulence due to the instrument’s geometry and the musician’s playing technique. The Reynolds number to consider is based on the particle diameter, the relative velocity between the particle and gas Δ v , and the free stream density and viscosity. For 0.5, 5, and 50 µm particles, Re is approximately Δ v / 30 , Δ v / 3 , and 10 Δ v / 3 , respectively.
The Weber number was considered primarily to understand the behavior of droplets within the airflow, particularly their stability against breakup. It is defined as:
W e = ρ v 2 d σ
where ρ and v are the free stream density and velocity, d is the droplet diameter, and σ is the surface tension of the fluid. Considering the surface tension of saliva of 60 mN/m [23] and a maximum velocity of 20 m/s, the Weber number for 50 µm droplets reaches 0.4. For a velocity of 2 m/s, the Weber number for 5 µm droplets is 1000 times less. This indicates that droplet breakup is not prevalent under the simulated conditions. This aligns with observed behavior in wind instruments, where droplet coalescence and deposition are more critical than breakup. It was assumed that droplets, including those 50 microns in diameter, remain spherical and do not undergo internal oscillations or deformations during their trajectory. This assumption is supported by the low Weber numbers calculated in the simulations. A Weber number below 1 indicates that the inertial forces due to airflow are not sufficient to overcome the surface tension that maintains the droplet’s spherical shape. This suggests that significant deformations or internal oscillations of these droplets are unlikely under the simulated conditions. Such low Weber numbers typically indicate that the droplets will not break up or deform significantly, supporting the validity of modeling assumptions in the context of airflow within musical instruments.
We primarily focused on the aerodynamic behavior of droplets, considering forces such as drag and gravitational forces. The decision to neglect Brownian motion for 500 nm droplets was based on the assumption that these droplets, due to their relatively larger size compared to truly nanoscale particles (e.g., those smaller than 100 nm), would be more influenced by inertial and aerodynamic forces than by Brownian motion. However, around 500 nm, Brownian motion can still play a significant role, especially in conditions where airflow velocities are low and the surrounding medium is quiescent. The Brownian force, driven by the random thermal motion of air molecules, can indeed be comparable in magnitude to the inertial forces acting on such small particles.
F Brownian k B T 3 π μ d k B T τ
where k B is the Boltzmann constant, T is the absolute temperature, μ is the dynamic viscosity of air, d is the particle diameter, and τ is the relaxation time. This simplification may omit an aspect of particle dynamics in specific settings. This simplification was implemented to maintain computational tractability and focus on the primary transmission vectors in musical instrument environments, where airflow and mechanical forces are often dominant. Gravity is accounted for, assuming the mass particle is constant. Particles cooled or heated by the surrounding fluid change their size; however, evaporation, particle rotation, their interaction with each other, and Brownian motion are not considered.
In the present study, we considered liquid particles with constant properties (diameter and temperature) along their journey through musical instruments. In reality, these properties may change due to heat transfer with air and evaporation. Evaporation is influenced by temperature, relative humidity, relative speed, and the concentration of nonvolatile solutes. Indeed, droplets of saliva are composed of water and nonvolatile substances (about 1.8% of the mass), among them salt (about 1%). As a consequence, a droplet of saliva will not fully evaporate, since dry residues always remain. Measurements of the diameter of the resulting particles [24] or calculations considering the conservation of mass of nonvolatile substances [24,25,26] have been performed. They indicate a shrinkage of diameter by a factor of 2 to 5. The evaporation time of pure water droplets can be estimated using the d 2 law (diameter squared) as provided in [27], involving Sherwood and Spalding numbers. The application of such a law for a temperature of 26 °C and 50% relative humidity (RH) leads to evaporation times of 10 ms and 400 ms for diameters of 5 and 50 µm, respectively. Nonvolatile solutes affect droplets’ evaporation time, especially as water concentration decreases. Ref. [28] measured the evaporation time of 30 µm sodium chloride droplets ranging from 750 ms to 2 s for 20% to 40% RH, respectively. They also found that the final diameter is 20% of the initial one, corresponding to a shrinkage of 5.
The majority of published studies measuring aerosols emitted when playing wind instruments use APS or FIDAS [8,10,13,16,29,30,31]. The measurement is then not performed in situ. Air containing aerosols is instead sampled, and droplets travel into sampling tubes before reaching the measuring optical cell. The residence time of the particle in the tube is generally 1 s for a flow rate of 1.4 L/min, through a 6 mm diameter and 90 cm length tube. Therefore, full evaporation may be reached. The measured particles are then dry residuals of the initially emitted particles. All these studies report particles smaller than 2.5 µm, with a median diameter below 1 µm. We can then expect that particles expelled through wind instruments have diameters below 12.5 µm, with a median diameter around 2.5 µm. In our study, we considered 3 diameters of particles (0.5, 5, and 50 µm), differing from one another by a factor of 10, which is greater than the maximum expected shrinkage ratio due to evaporation. The value of 0.5 µm is chosen because it is smaller than the expected median diameter, while 50 µm is largely above the maximum expected size. The chosen range of diameters is then assumed to be large enough to explore possible trajectories of droplets traveling into wind instruments. Moreover, when the liquid particles impact a surface, full absorption is assumed in our simulations.

2.2. Computation Set-Up

The airflow is computed using a time-averaged approach. As already discussed in [7], such an averaged airflow may not correspond to any instantaneous picture of realistic flows in wind music instruments, since it is unsteady by nature. The sources for unsteadiness are multiple: the vibrations of the exciter that produces the sound (the reed in the case of woodwind instruments), the propagating pressure waves, thermal effects, and the movements of the musician and the keys while playing. Considering more sophisticated numerical approaches such as unsteady resolution, LES turbulence model, aeroelastic modeling of the reed, and acoustic coupling would drastically increase the complexity and computation time, while no validation can be performed since no measurement of airflows inside wind instruments using experimental techniques such as Particle Image Velocimetry is currently available in the literature. The steady approach used here is supposed to be a sufficiently good approximation, although not demonstrated, to start investigating how particles emitted by the player are transported inside the instrument and transferred from the instrument to the direct environment.
The boundary conditions are set as follows. The mean airflow rate, as measured using a Gallus gas meter (see Appendix A), is specified at the inlet of the tube (i) downstream of the mouthpiece for single-reed instruments, (ii) downstream of the reeds for double-reed ones, (iii) at the inlet of the mouthpiece for brass instruments, and (iv) on a circular opening on the mouth in the particular case of the flautist. In all cases, the air velocity is uniform over the section. A large volume of air surrounding the isolated instrument is included, at the border of which the environmental pressure with zero velocity is applied. Thermal effects are neglected. Indeed, the residence time inside instruments is rather short compared to the characteristic time for heat transfer. For celerity equal to 2 m/s, the residence time is lower than 1 s for most instruments. The temperature difference between air escaping from the mouth and the environment may affect fluid flow distribution close to tone holes and the bell due to buoyancy effects; however, many other parameters may affect the mixing of inside and outside air, such as ventilation, movements of the musician, hands acting as obstacles to the flow, and heat sources. We have then considered, in a first attempt to model flow inside wind instruments and focus on particle trajectories, to generally neglect these thermal effects. In the case of the saxophone, however, since the material (brass) is thermally conductive and the distance from the air inlet to the first tone holes is short, thermal effects are introduced in the simulation. Hence, for this instrument, air is blown at a temperature of 37 °C and thermal exchange is forced on the internal walls of the neck to reach the environmental temperature (25 °C) at the inlet of the body.
The particles are emitted from the same location as where air is blown. Particles with diameters of 0.5, 5, and 50 µm are considered. Hereafter, they are referred to as the smallest, intermediate, and largest particles or droplets, respectively. The number density of particles specified at the inlet is meaningless in the present numerical approach since no interaction between particles nor feedback effect of particles on airflow are considered; as a consequence, only the ratio of number density with respect to the inlet is of interest. Only one direction of gravity with respect to the instrument is considered. It is aligned with the vertical part of the saxophone body, makes an angle of 45° with the clarinet and oboe bodies, while the flute and trumpet bell are fully horizontal, and therefore perpendicular to the direction of gravity (Figure 1).
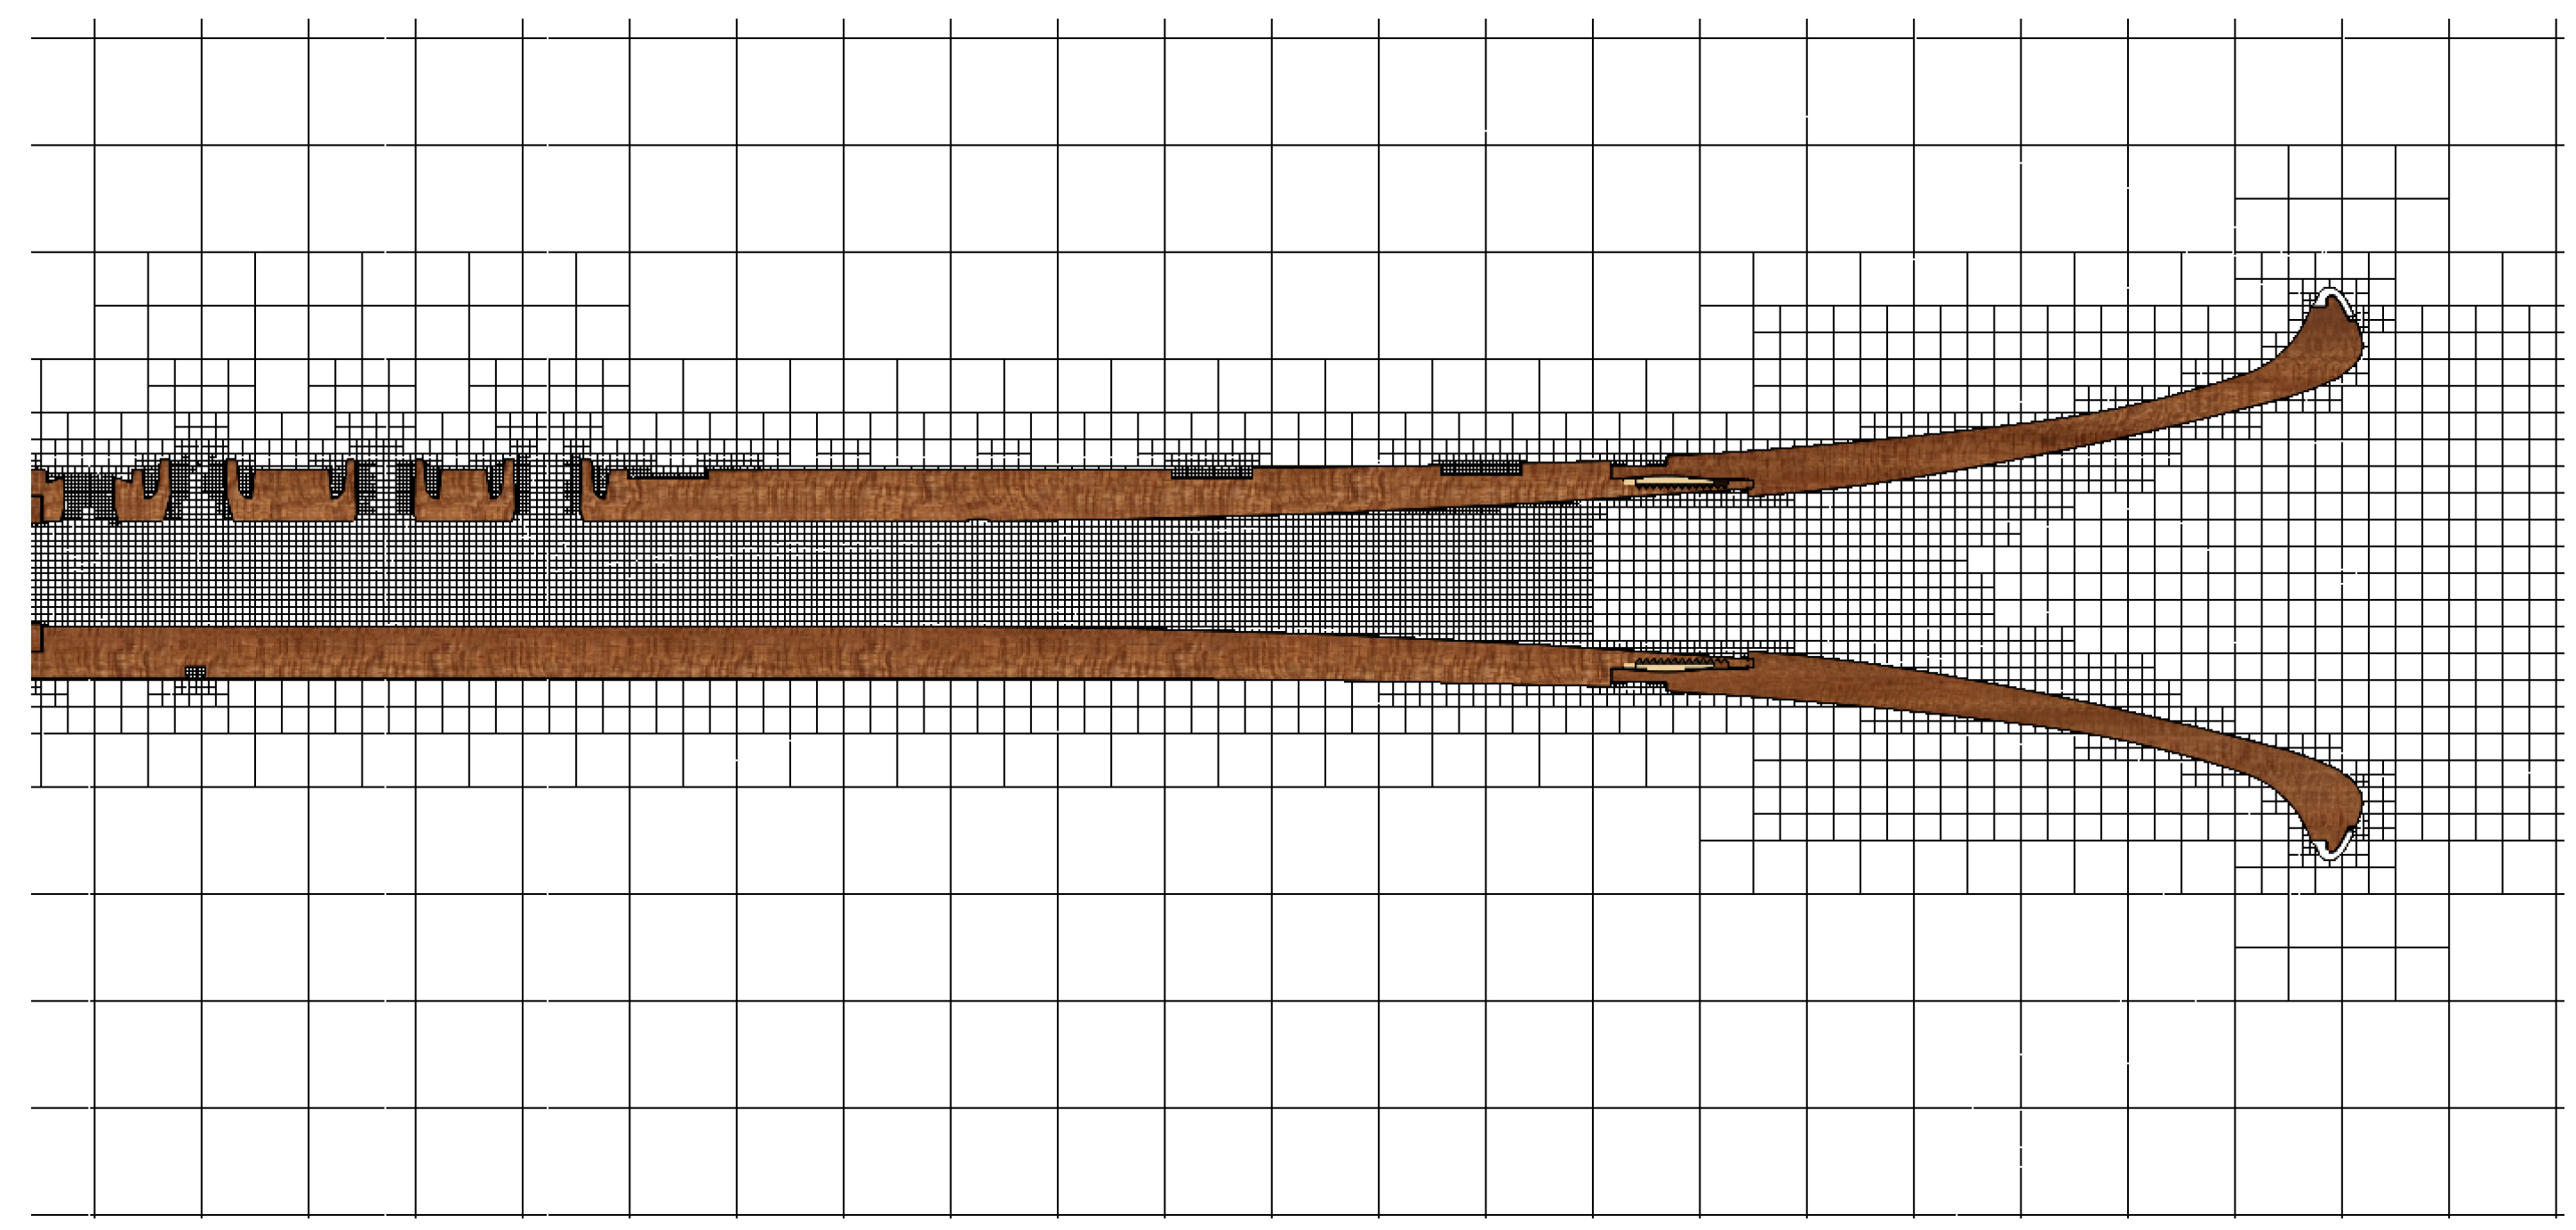
The meshes contain about 0.5 to 1 million cells. The basic cell size, far from the walls, is 15 mm. It is refined up to 5 times close to the walls, reaching 0.5 mm (Figure 2). For the considered flow rate, the y + ranges from 4 close to the injection plane to 0.5 at the bell inlet. Meshes contain at least 10 cells in the cross-section of the tube and of the tone holes. Details regarding numerical validation and mesh convergence checks were provided in the previous study [7].

2.3. Computation Cases

The airflow and particle emissions are computed for five wind instruments, with various types of mouthpieces at the origin of the production of sound: alto saxophone and B♭ clarinet (single reed), oboe (capped double reed), transverse flute (fipple), and B♭ trumpet (brass-type).
The CADs (Figure 1) have been provided by the Buffet-Crampon instrument manufacturer. The pads that cover some tone holes of woodwind instruments are not included, except for the ones on the saxophone bow (i.e., the lowest part). Indeed, these keys are in the axis of the main air jet and a large amount of flow rate may pass through them. When opened, the distance from the edge of the tone hole to the pad is set to 7 mm. The absence of pads, as well as fingertips that stay close during play to open pad-free tone holes (but with rings instead), may change the direction taken by the airflow and the particles after passing through them. However, the trajectories in the free environment are not addressed here, and it is assumed that the rate of flow exchange between the inside and the outside is not influenced by the pad or finger when the tone hole is left open.
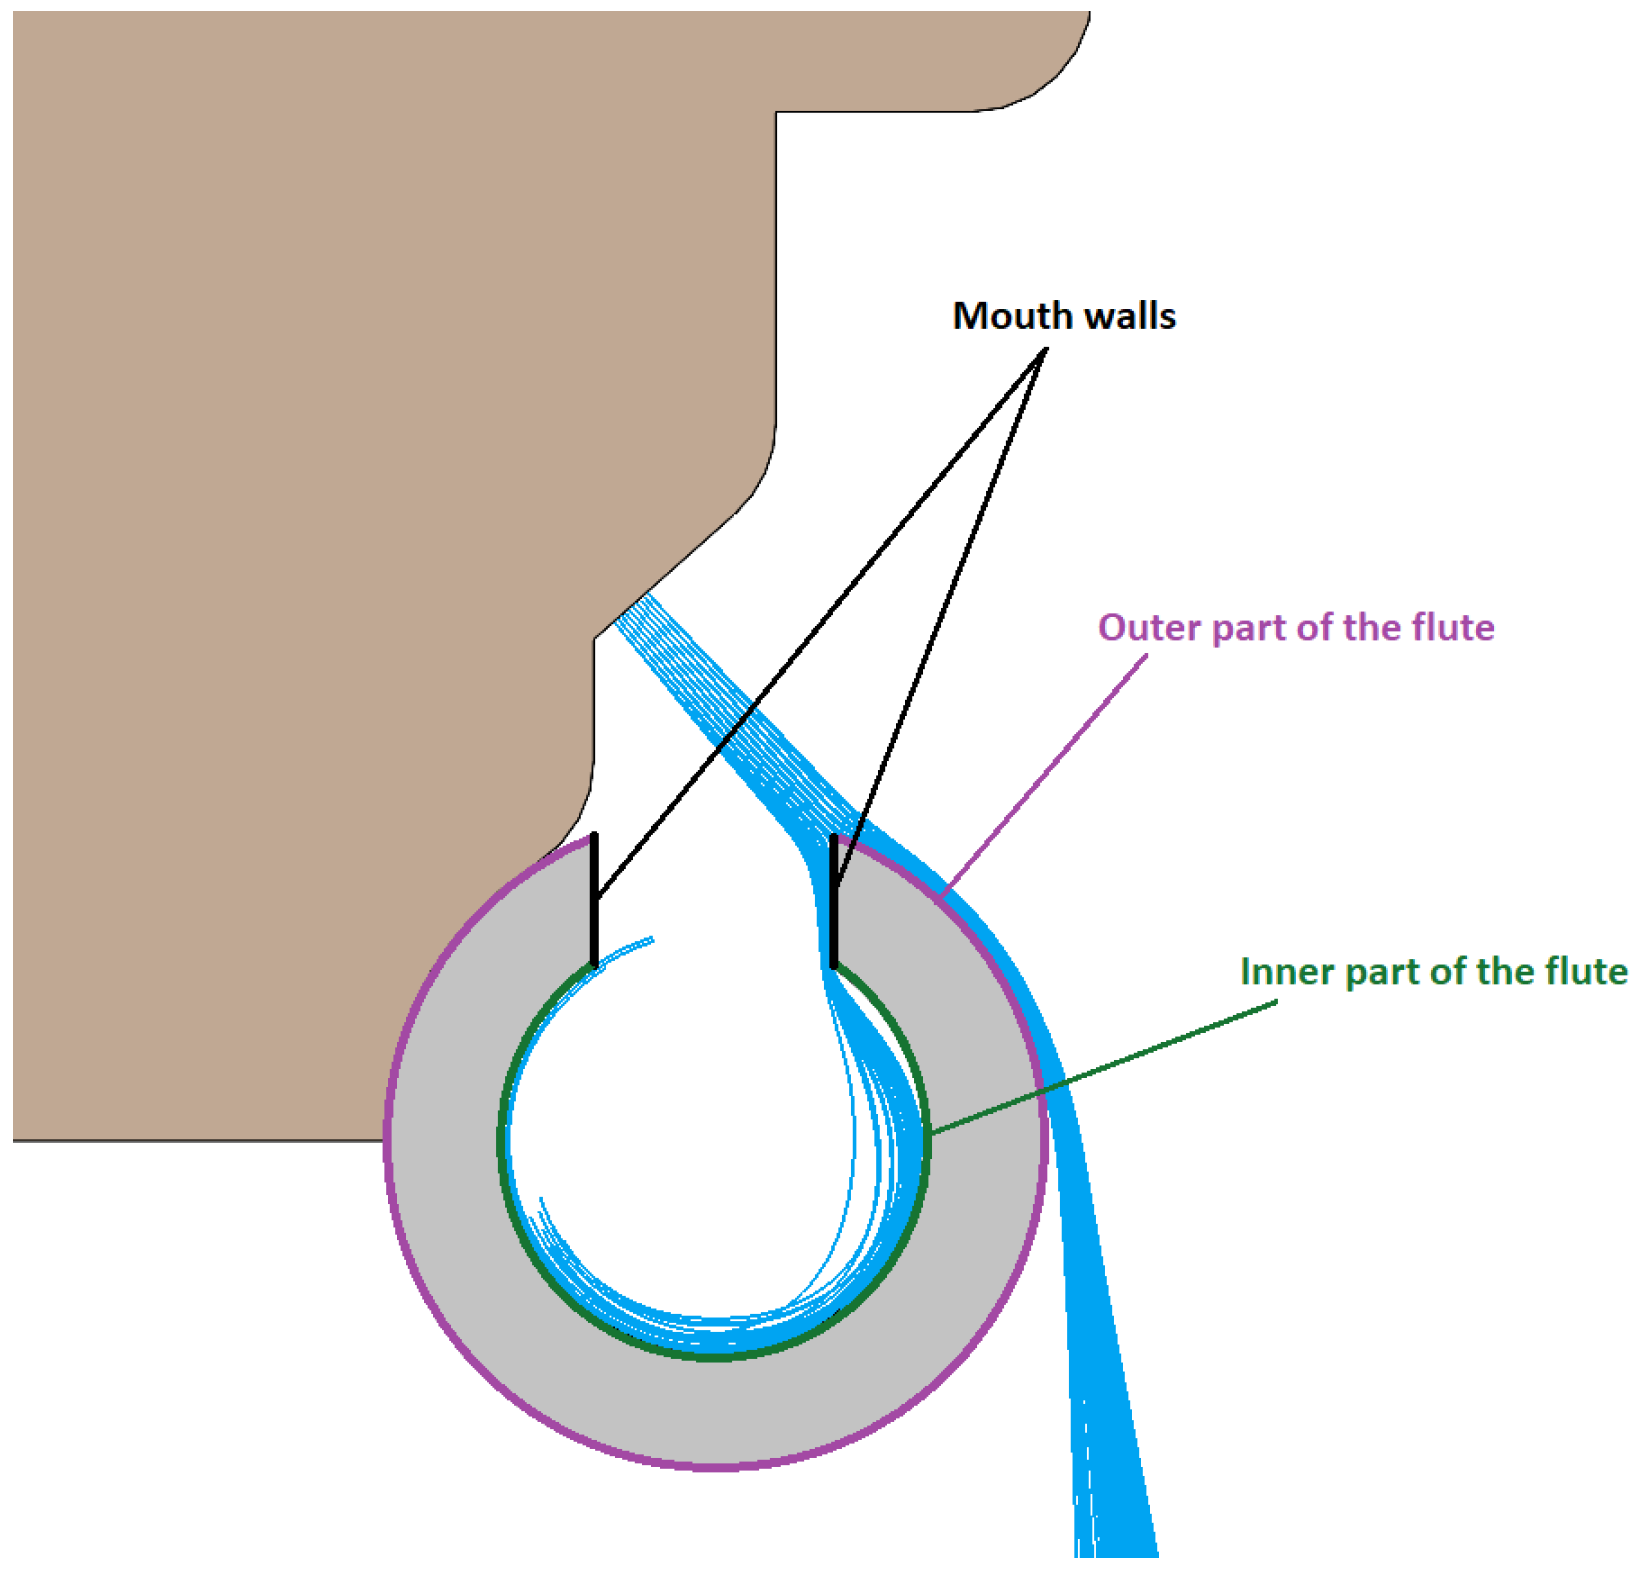
In the case of the flute, the musician’s head is modeled with a mouth as a circular opening of 4 mm2 (Figure 3). The center axis of the jet is set in the direction of the edge, so that half of the air goes inside the flute while the other half is blown outwards. The angle with the vertical axis is then 42°. The distance from lips to mouthpiece is about 1 cm. The flute has no mouthpiece plate.
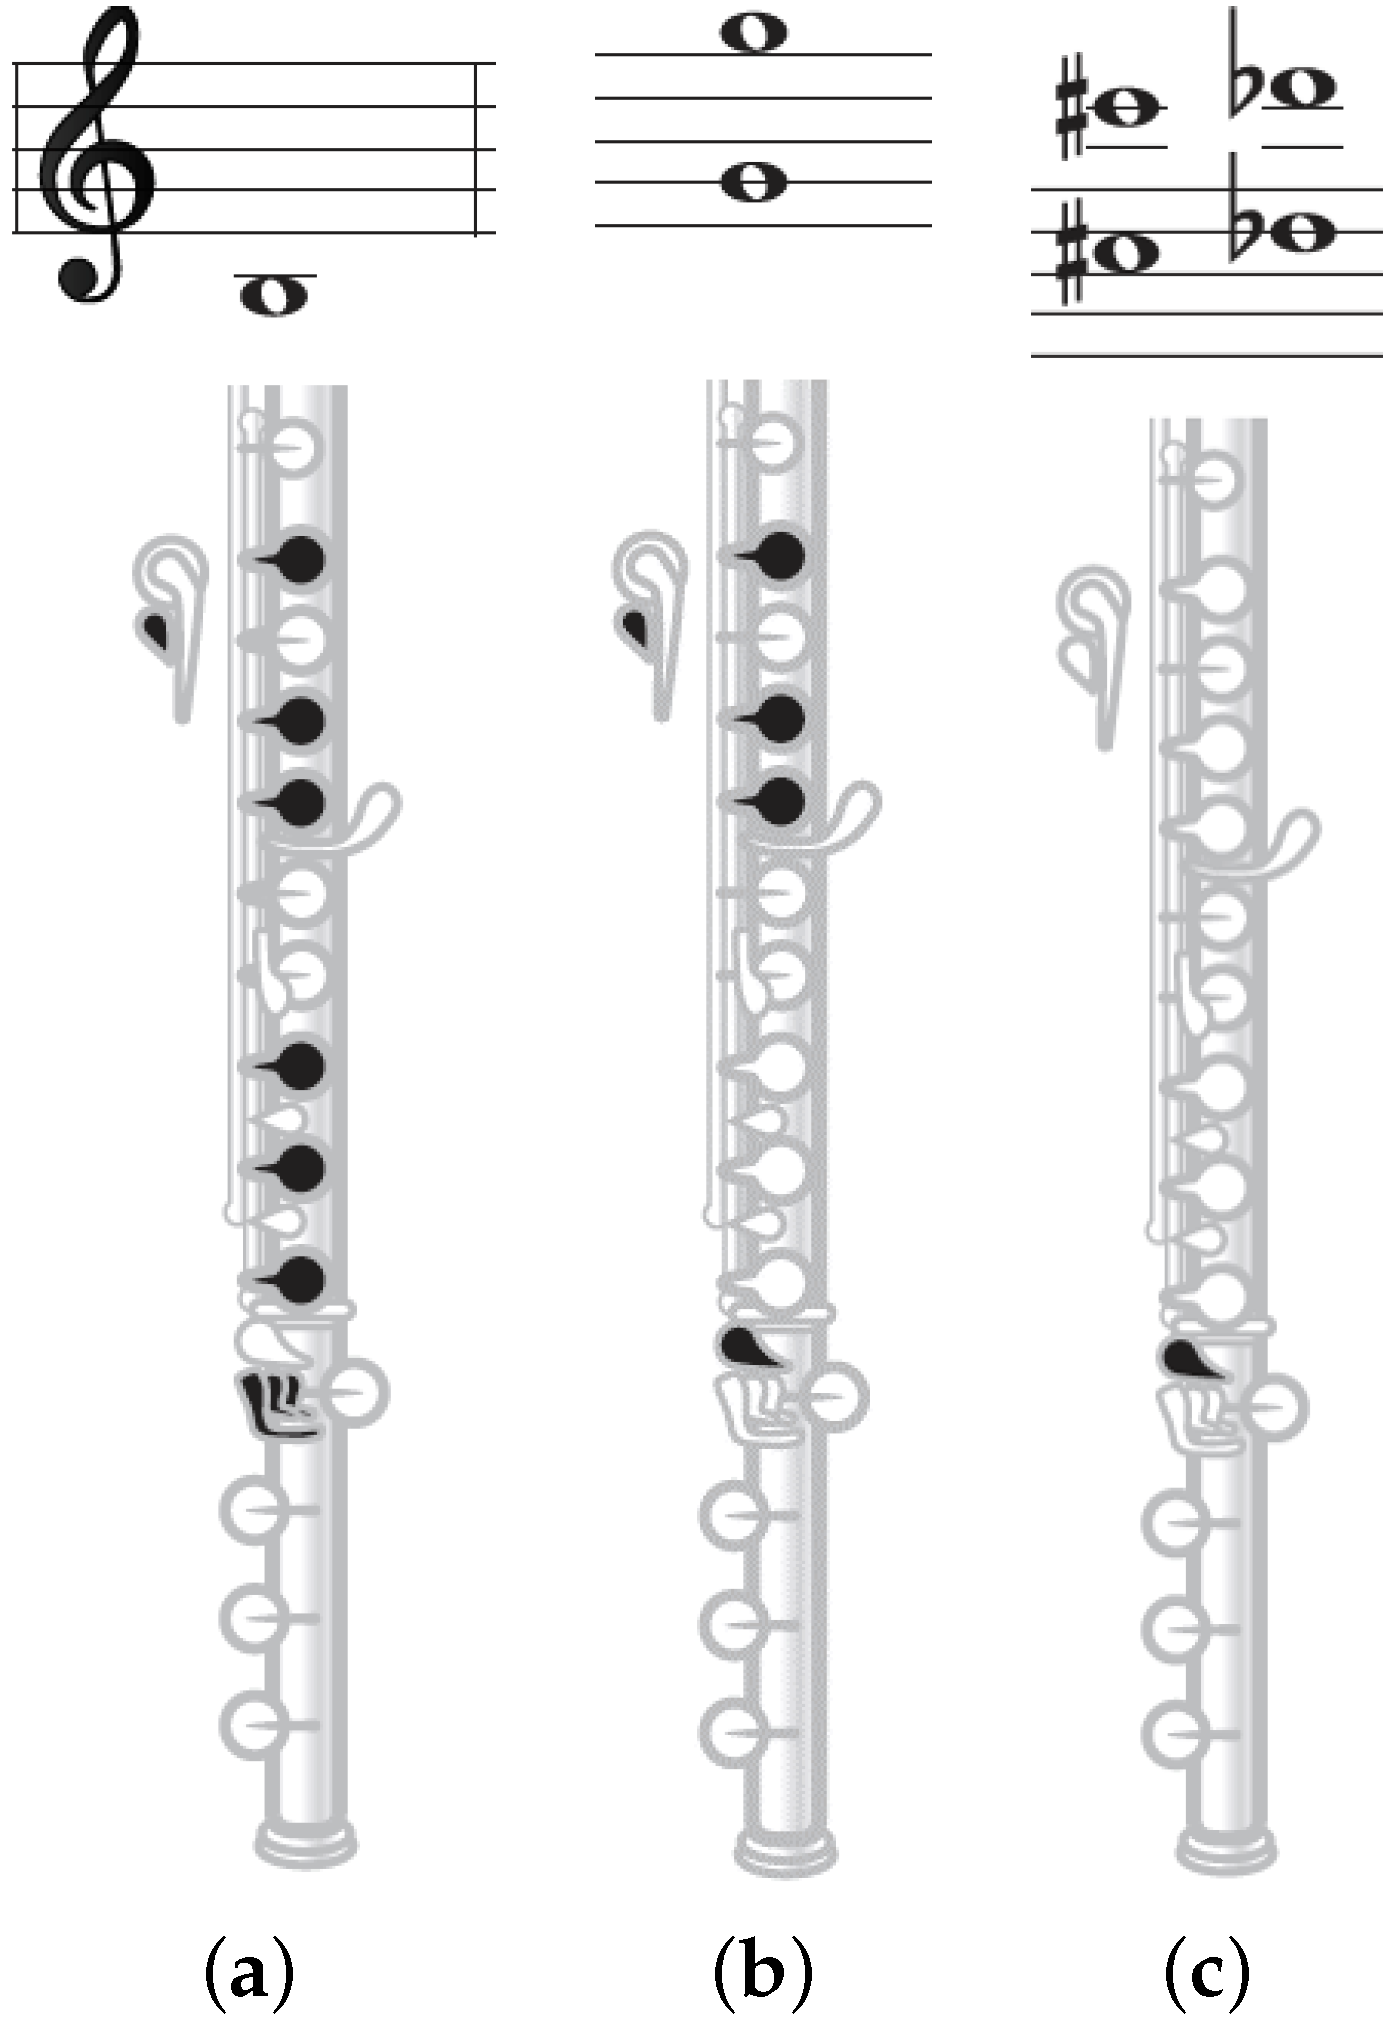
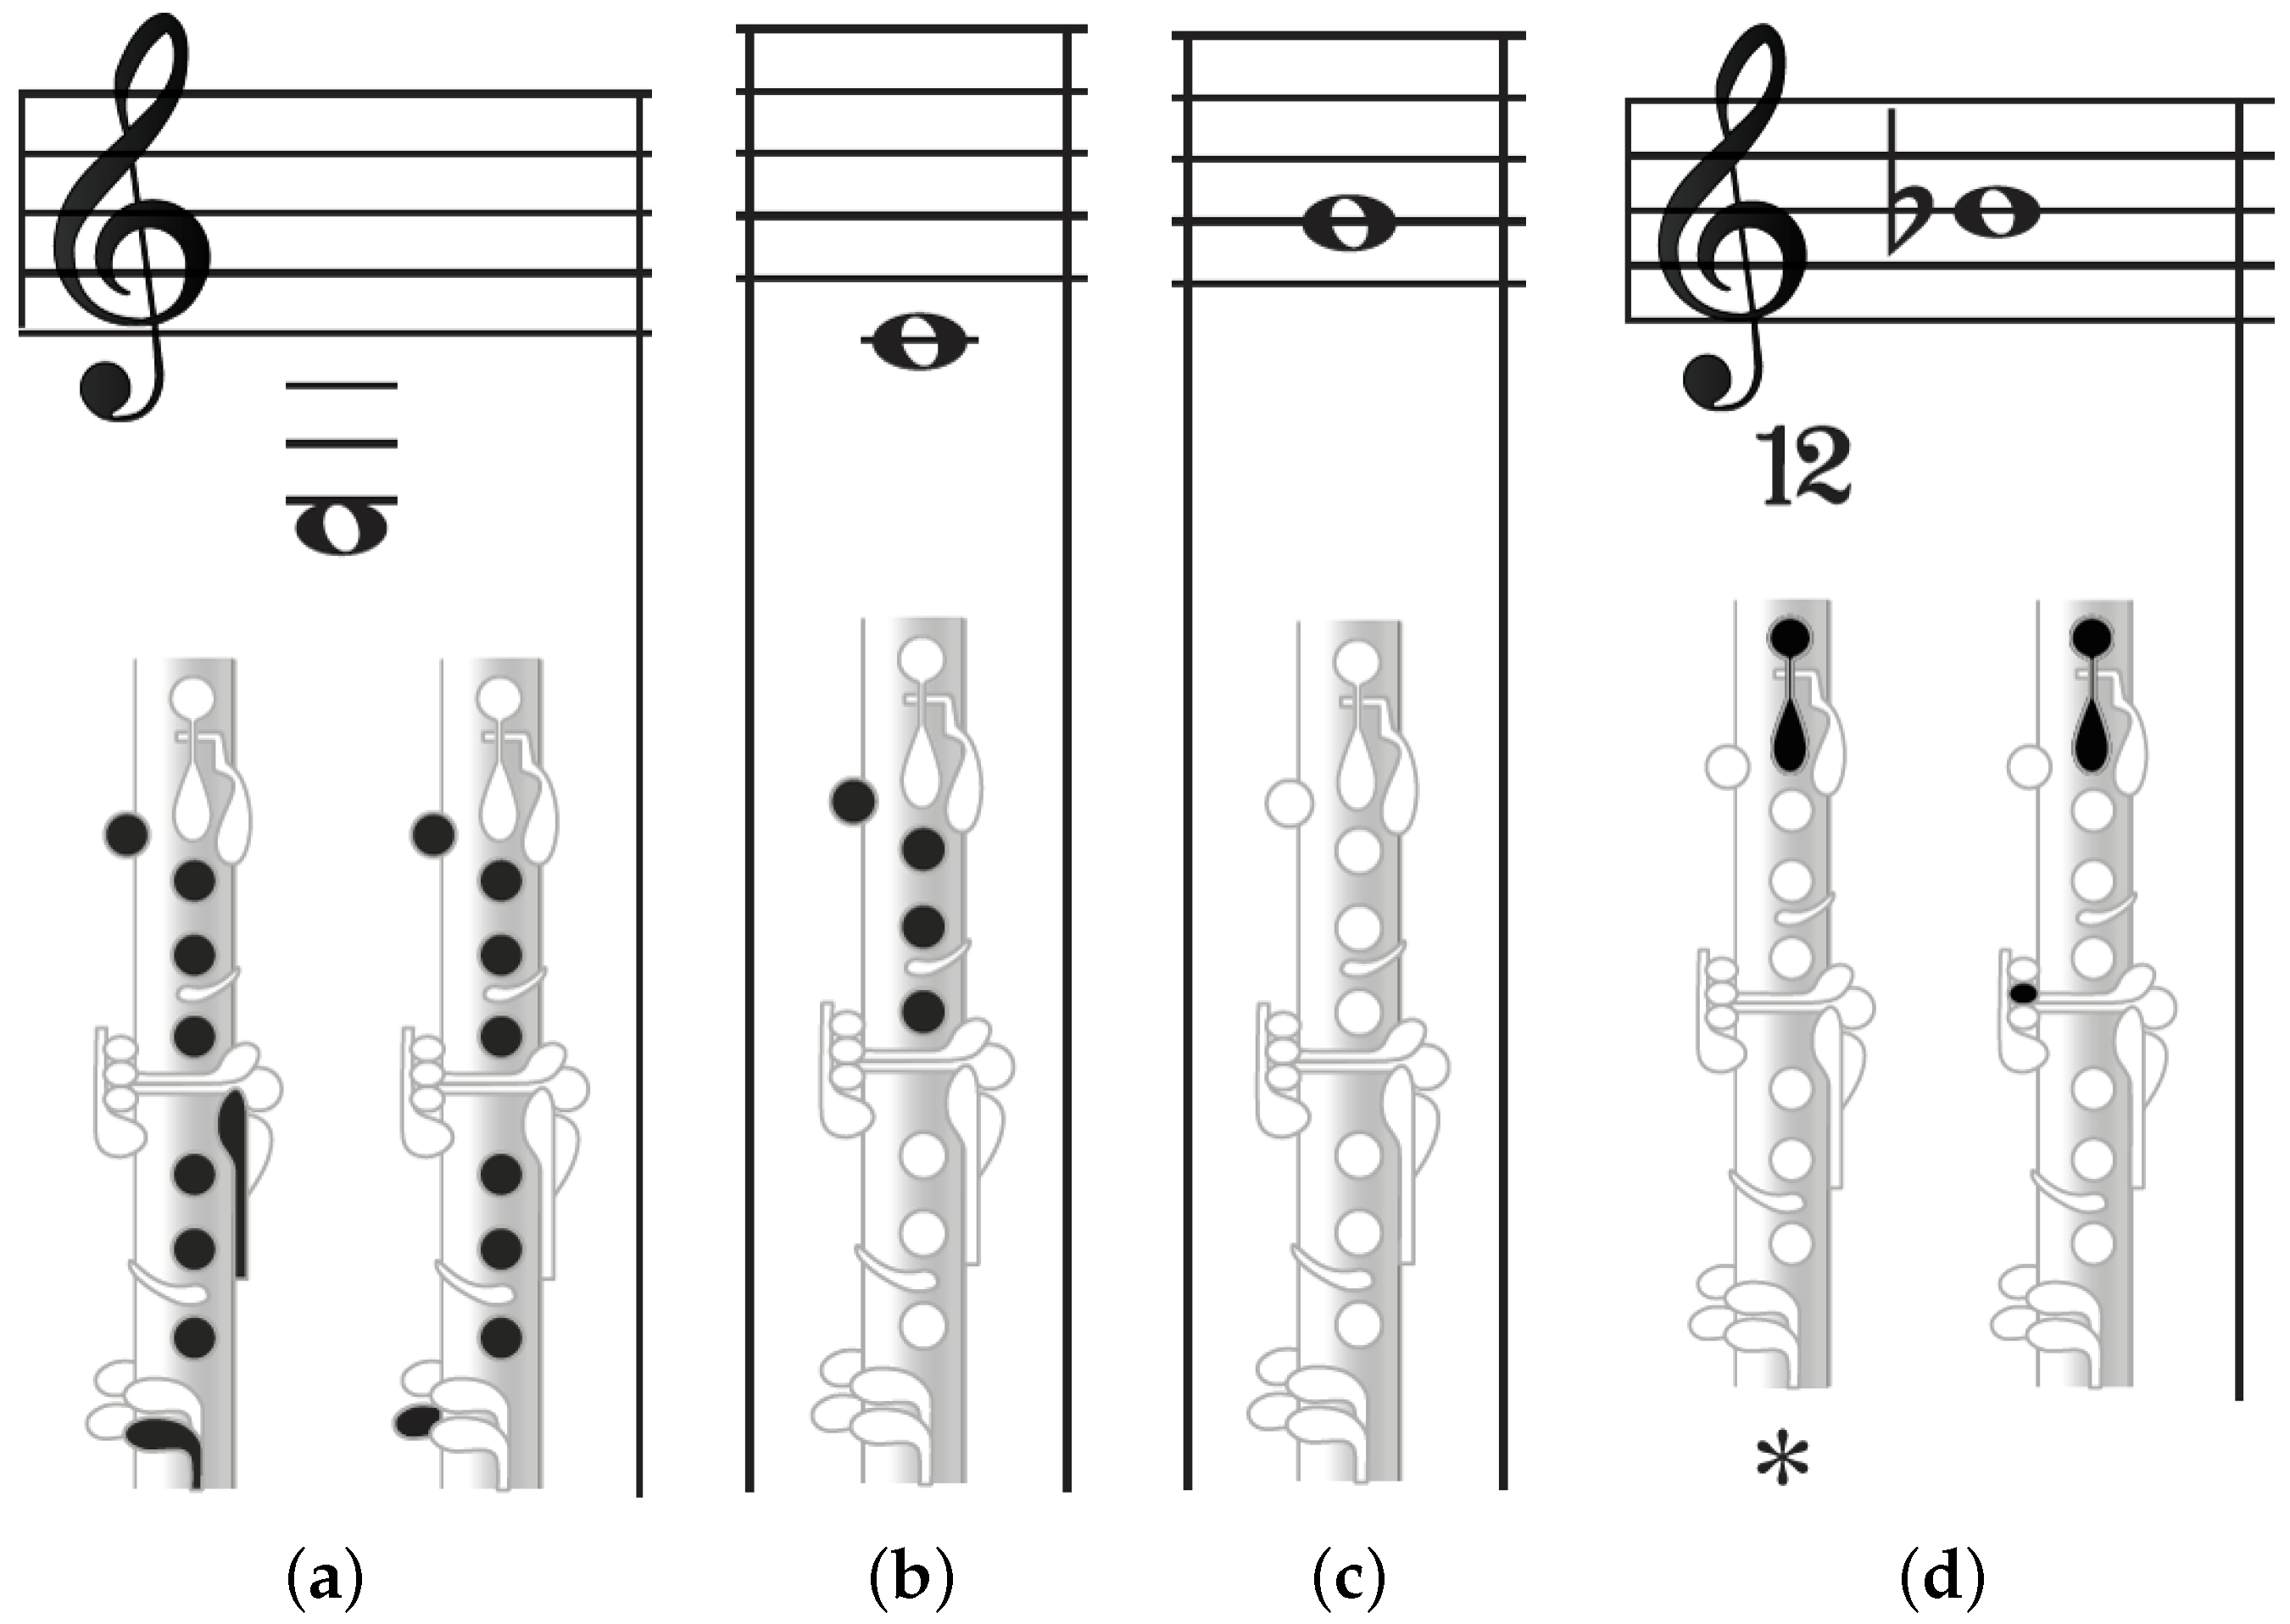
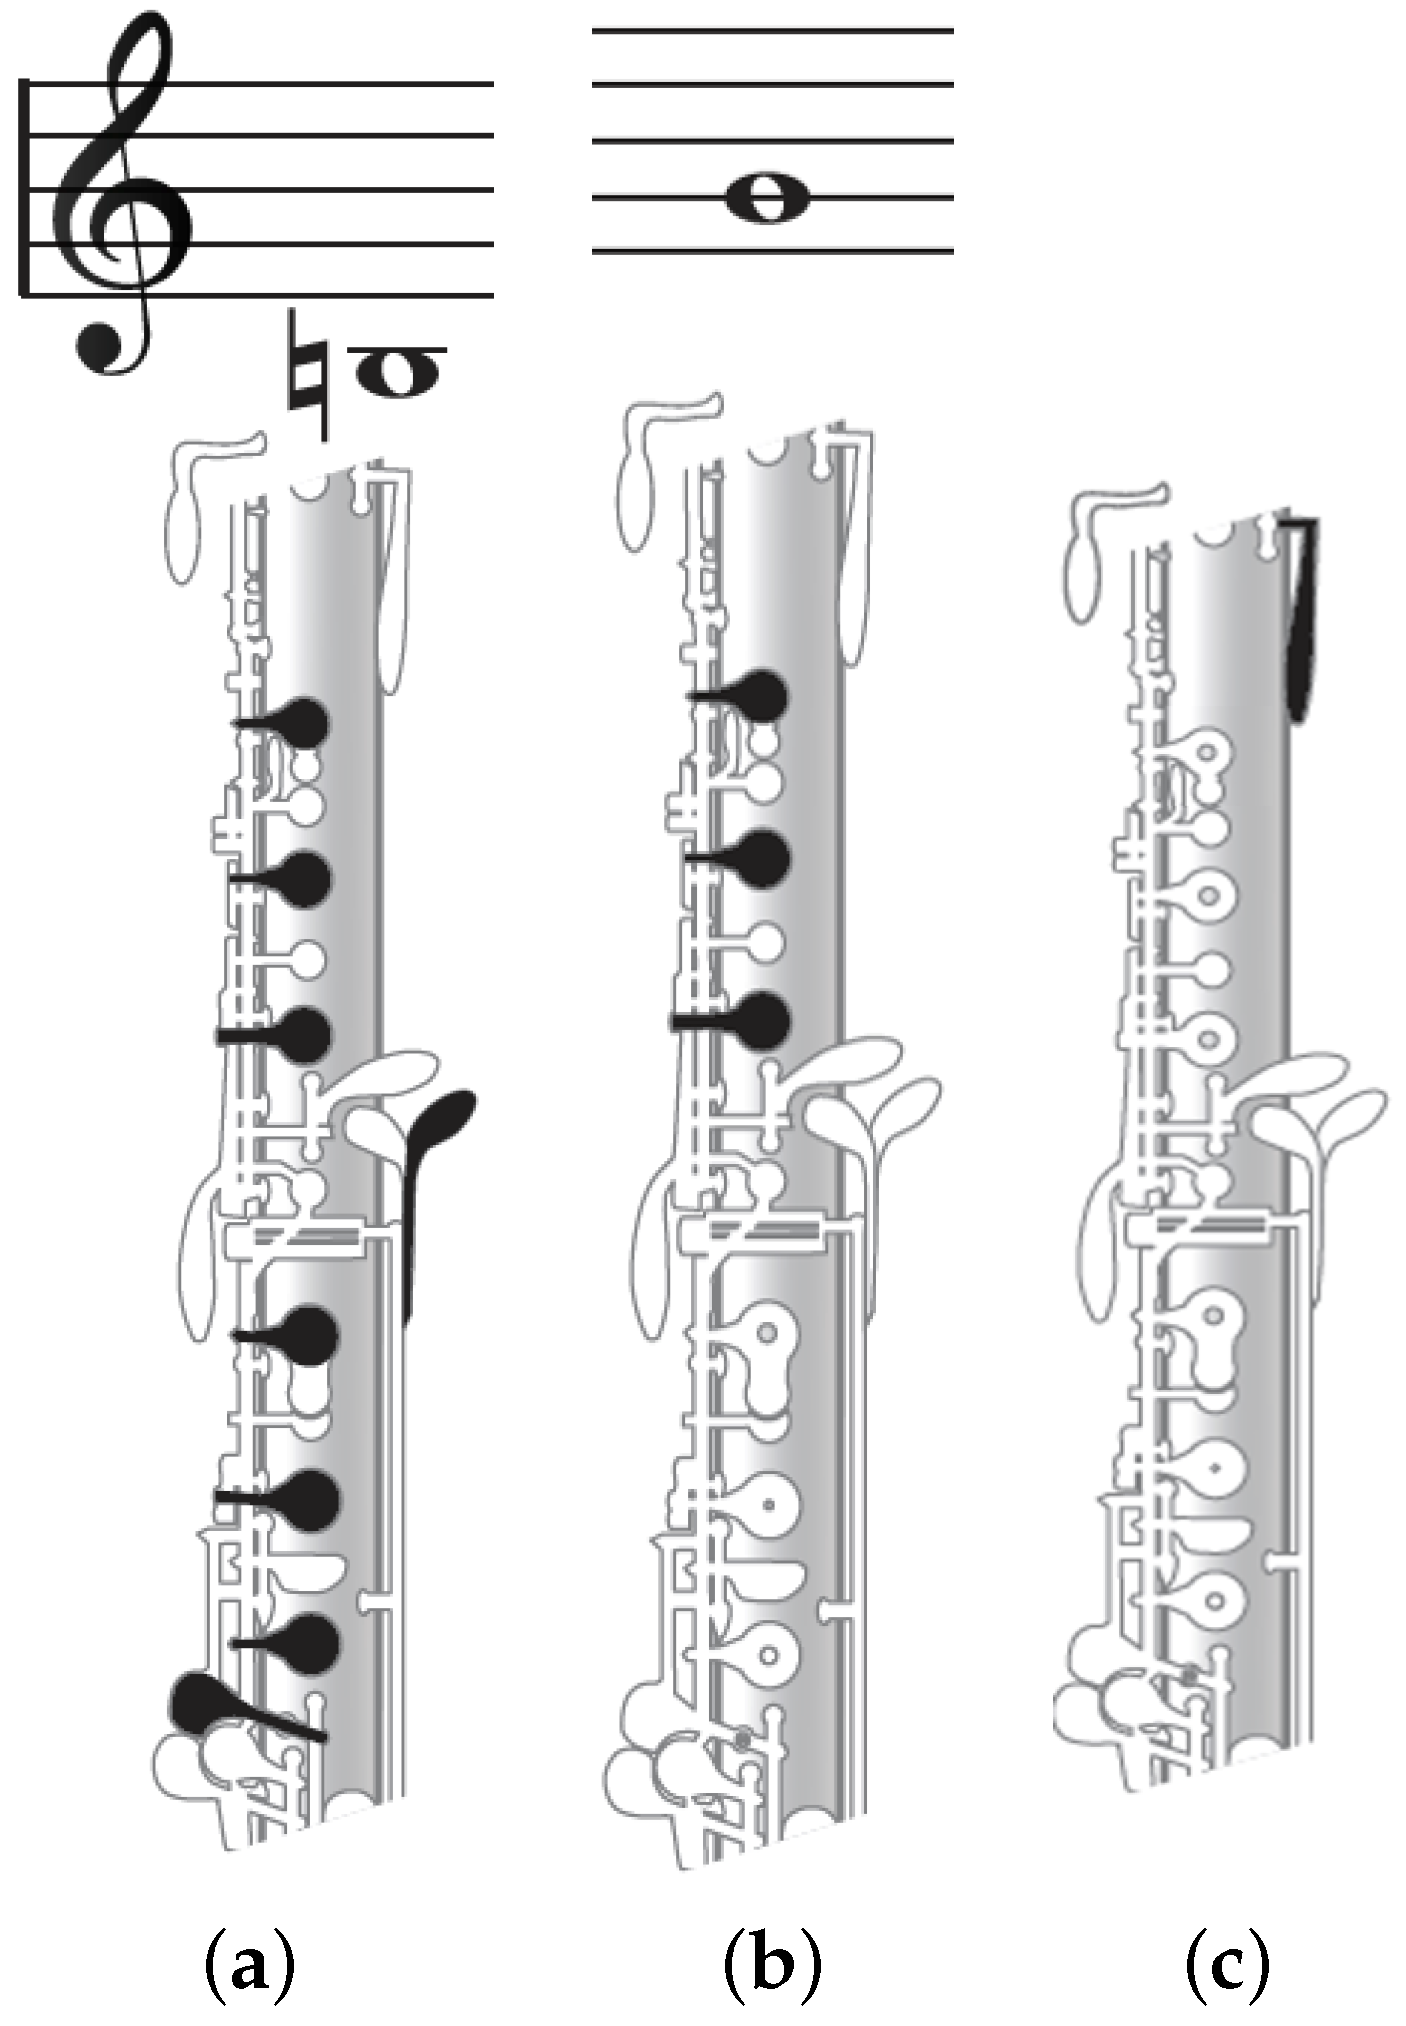
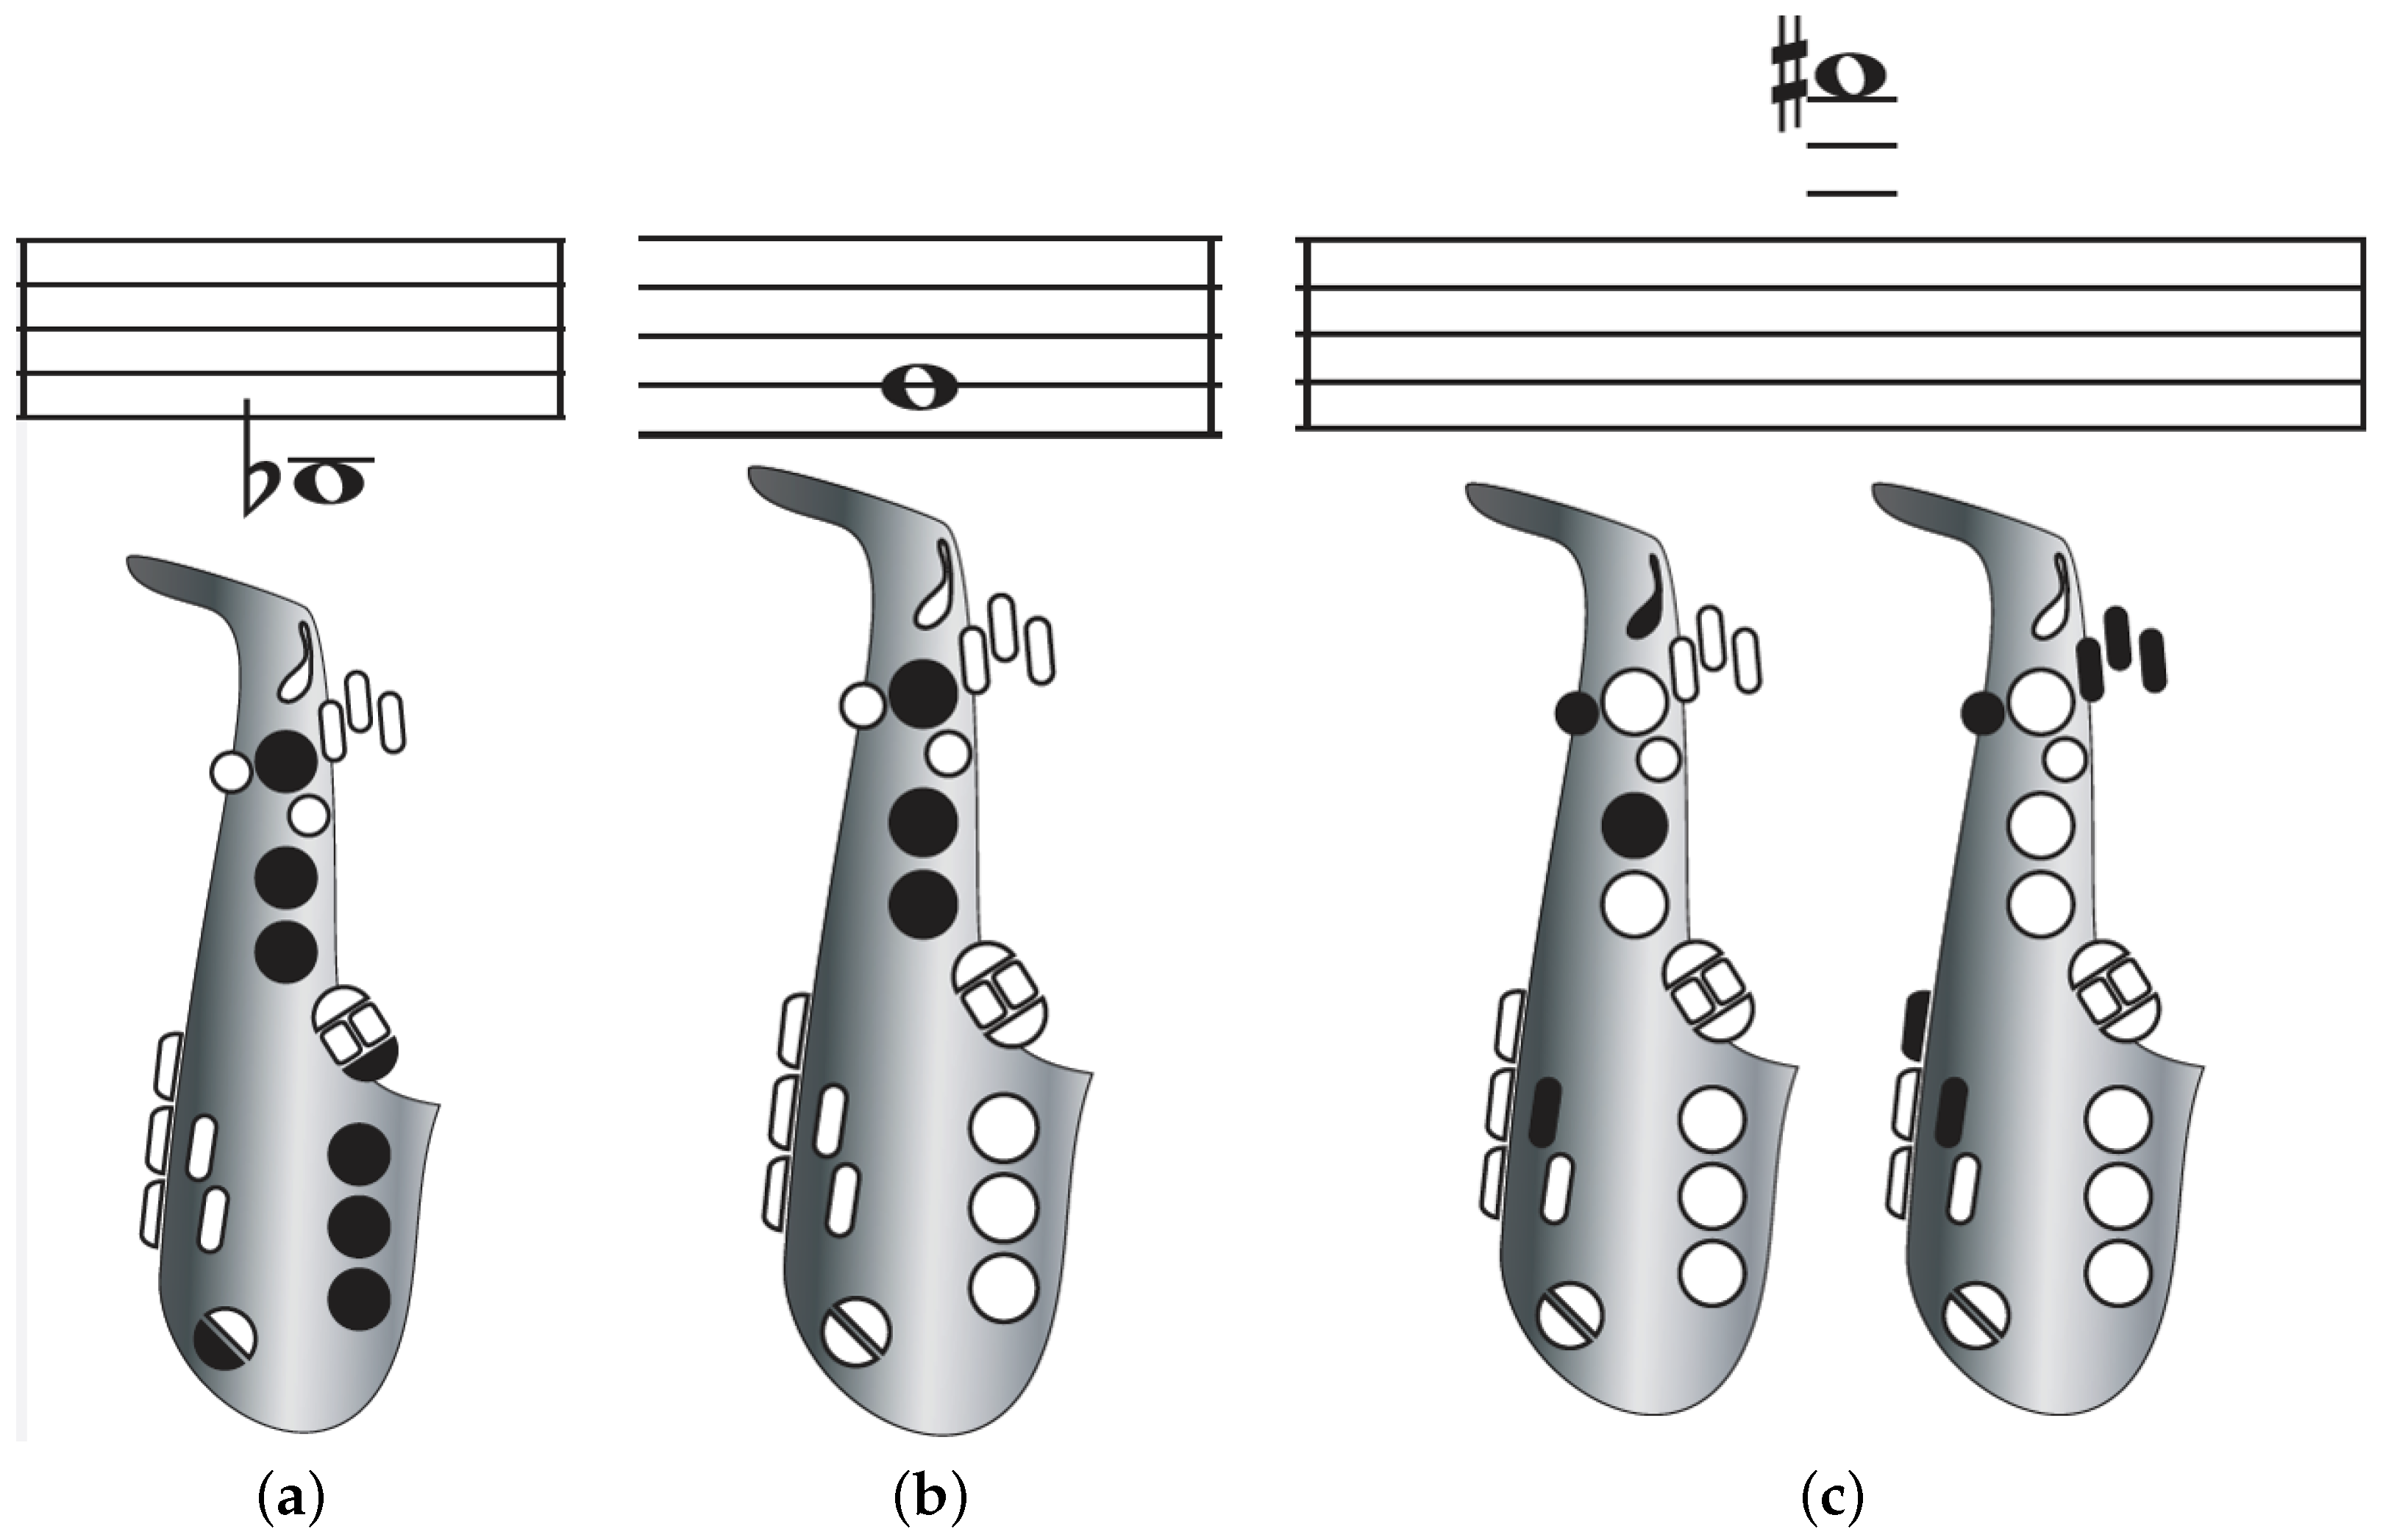
For each instrument, at least 3 notes have been simulated; the highest note corresponds to all opened keys, the lowest note to all closed keys, the latter forcing all the air to blow out the bell. An intermediate note is chosen in between. Table 1 summarizes the notes used in the simulations for each instrument, while Figure A1, Figure A2, Figure A3 and Figure A4 in Appendix A show the corresponding fingerings and note drawn on a musical score, respectively, for flute, clarinet, oboe, and saxophone.
The airflow rate prescribed at the inlet is also given in Table 1; it is 10 L/min except for the saxophone (14 L/min) and for the oboe (3 L/min). The inlet turbulent rate is set to 10–20%, with a turbulent length of 10–20% the hydraulic diameter. Note that for the single-reed woodwind instruments, the considered hydraulic diameter is the typical distance from the reed to the mouthpiece, namely 1.2 mm.

3. Results

3.1. Airflow in the Instrument

We describe hereafter for each instrument the computed stationary airflow topology.
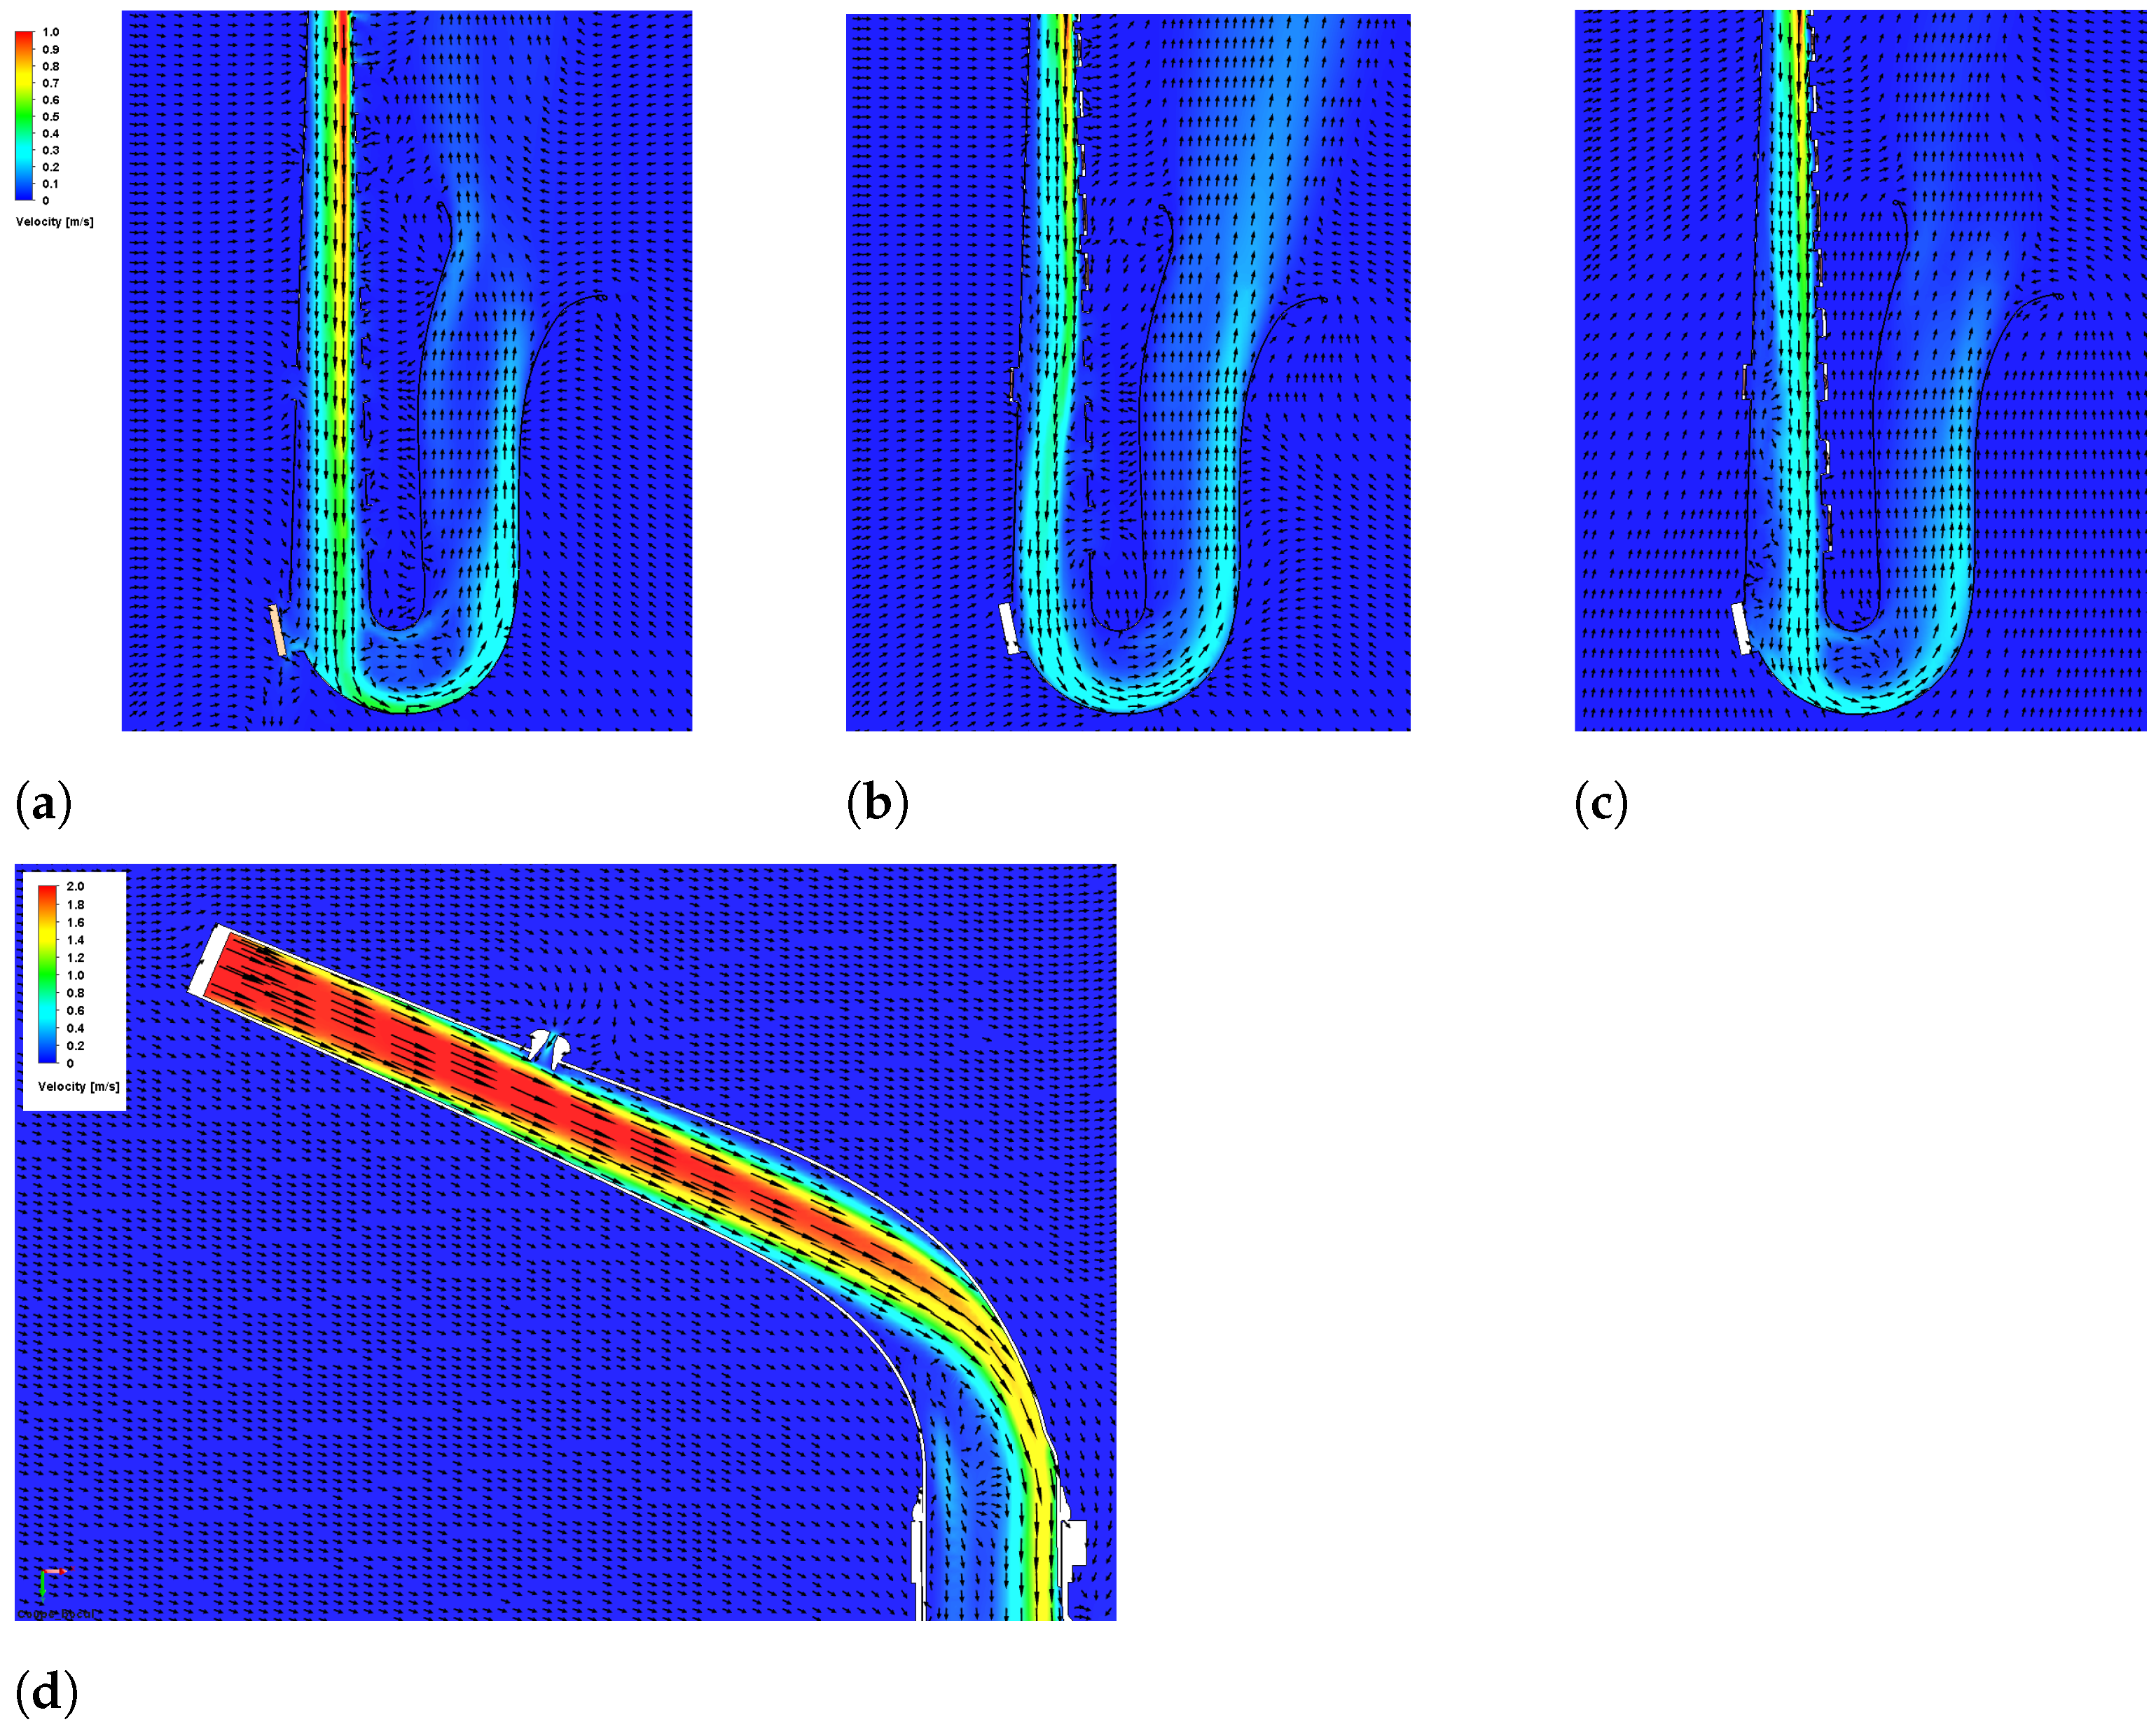
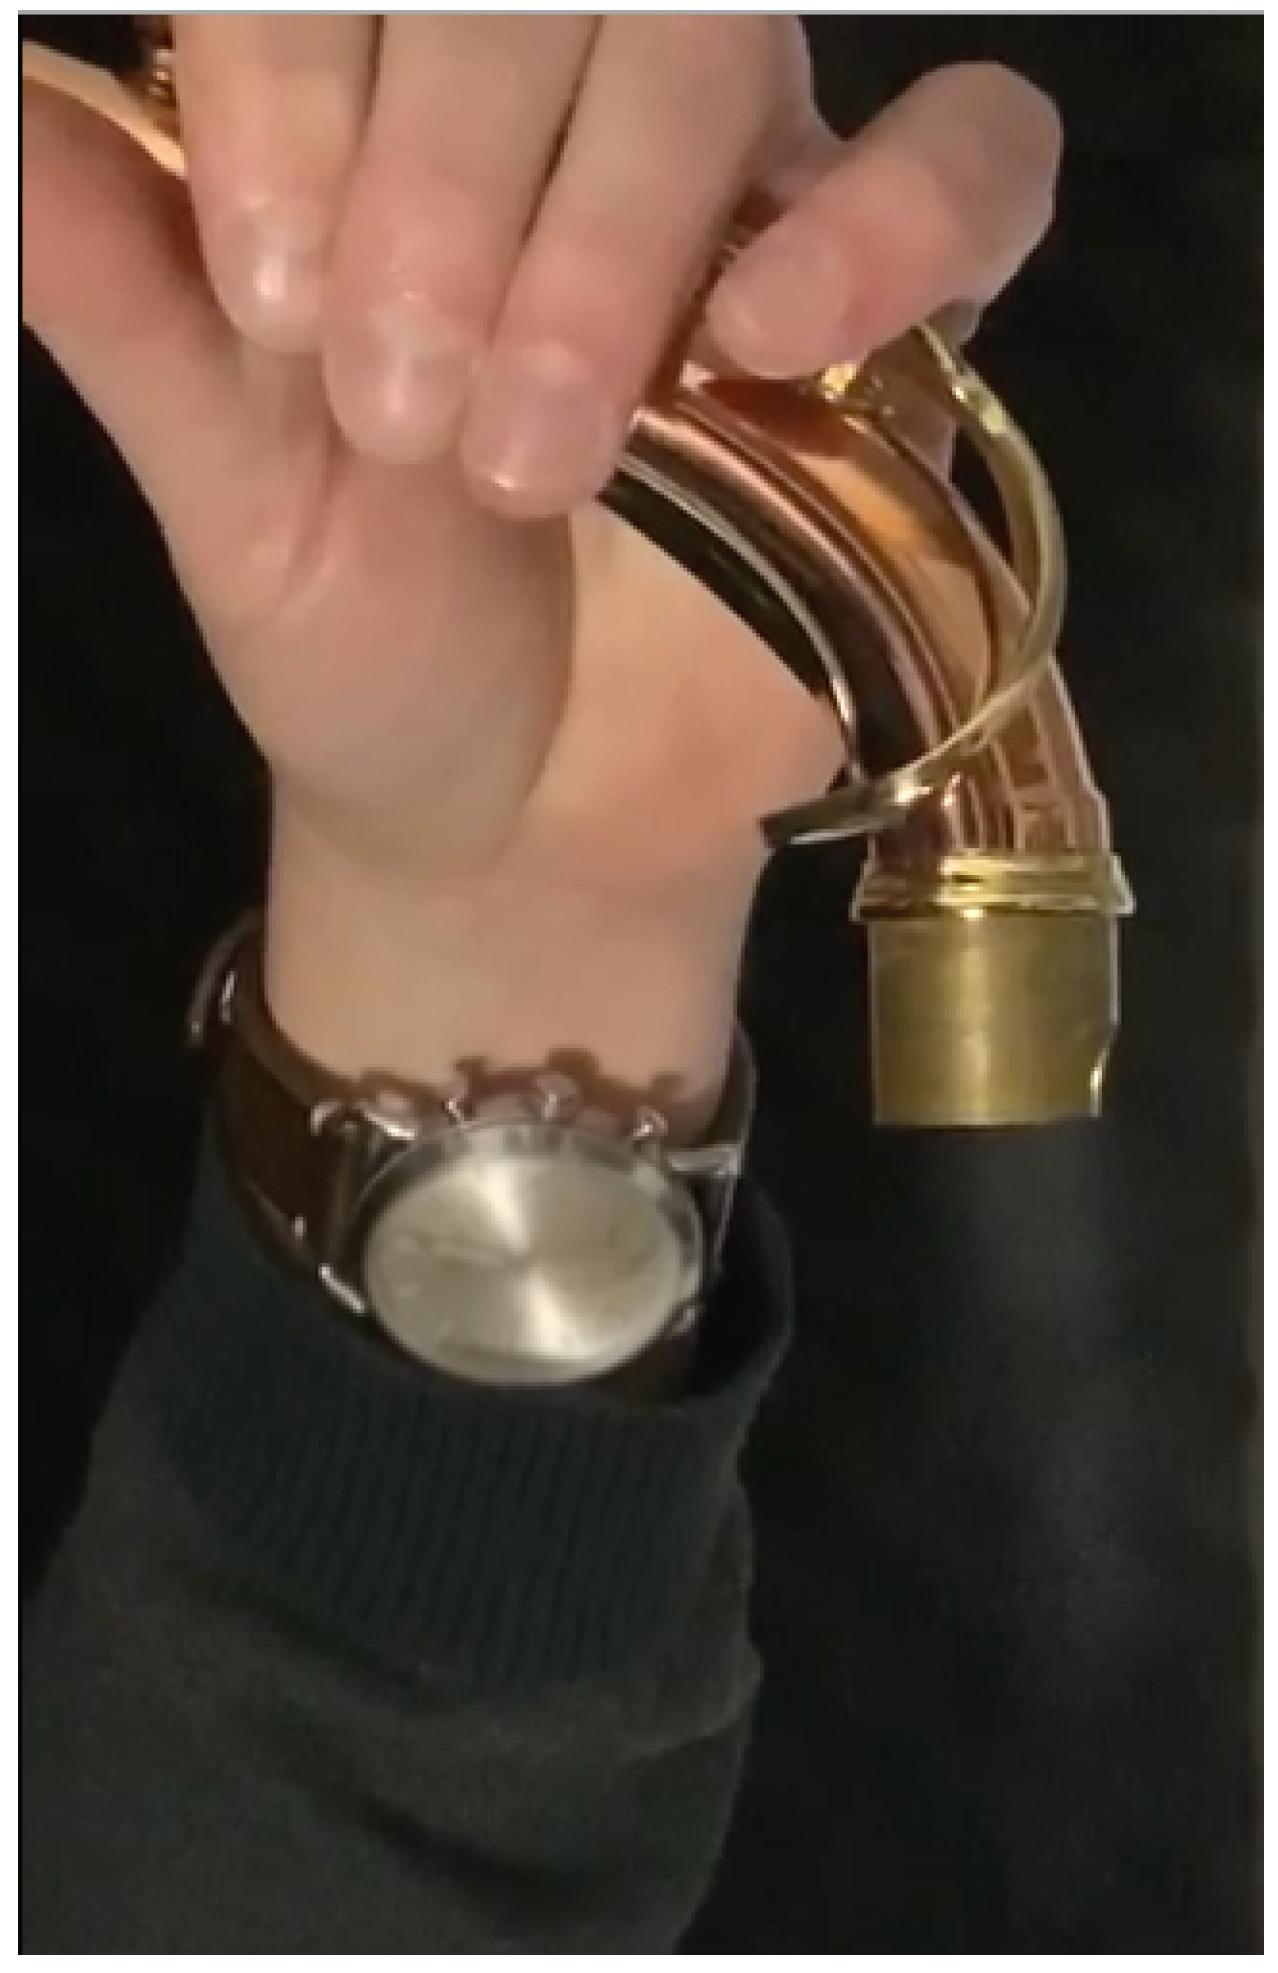
Saxophone: When opened, the air exits the body through a few keys: the one just below the neck screw, and the first two on the bow. This is shown in Figure 4, which plots the streamlines emitted from the neck inlet. The major part of the flow goes up to the bell. By plotting streamlines passing through the bell outlet (Figure 4), we show that surrounding air may enter the body through other keys, but also through the bell since the outgoing jet remains concentrated and does not enlarge with the bell’s cross-section. The jet is indeed a low-pressure zone due to high velocity (up to 1 m/s in the body), lower than the environmental one. The presence of opened keys may also change the center axis of the jet in the tube, by pushing it towards the wall on the opposite side of the holes, due to this incoming additional air. It is obvious for the half-opened keys case when looking at the air velocity contours and vectors plotted in Figure 5b. In the neck (Figure 5d) and bow (Figure 5a–c), the air jet impacts the opposite wall before changing direction to follow the tube. The same behavior is highlighted in Figure 6, showing smoke blown in an isolated neck. In the computation, blown air does not exit through the octave key located on the neck; on the contrary, air from outside enters due to lower pressure inside. This result is questionable; indeed, simple tests with smoke prove that air might be expelled from inside to outside, at least at the attack of the note. Whether this behavior is unsteady has not been explored.
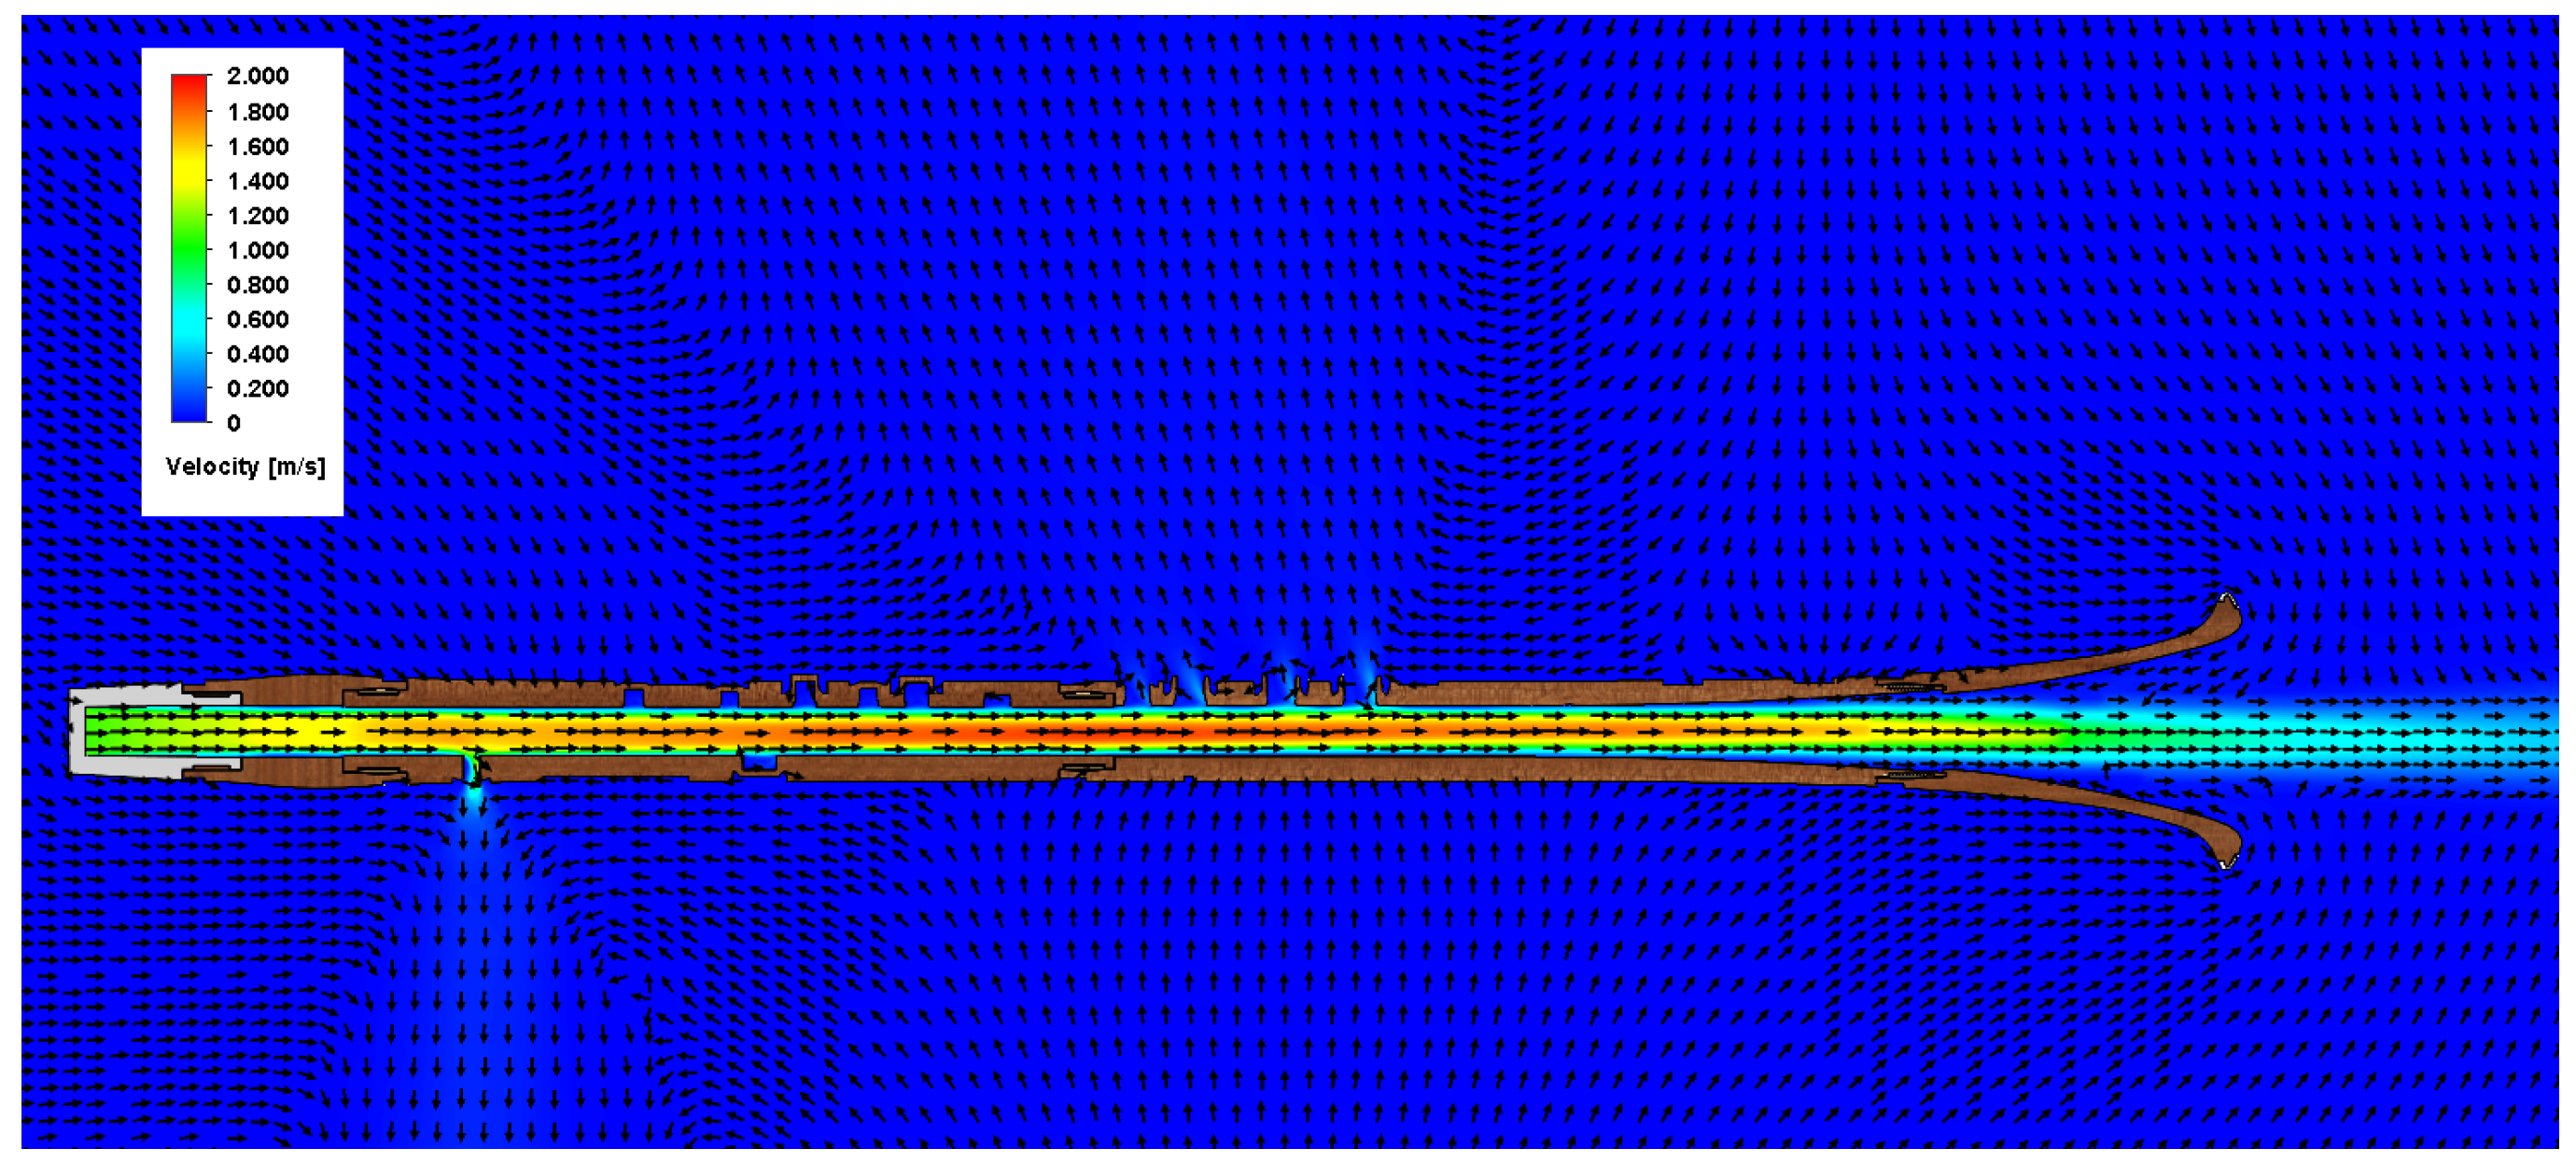
Oboe: The jet remains concentrated up to the bell, as shown by velocity contours in Figure 7. The velocity vectors plotted on a zoomed-in section near the tone holes indicate that no air comes out through the holes. On the contrary, environmental air comes in. The jet’s central axis is progressively shifted to the opposite side of the opened key holes along the tube.
Clarinet: Air tends to exit the tube through a major part of the opened keys, as shown in Figure 8. Contrary to the saxophone and oboe, the tube of the clarinet is cylindrical, not conical. It does not enlarge, thus fostering the exit of air through the holes. The air jet remains concentrated in the bell, surrounded by vortices at the outlet.
Flute: Figure 9 shows the velocity contours and vectors in two views: a cross-sectional view passing through the mouth, showing how the flow is half-separated by the mouthpiece edge, and a median plane of the tube. Inside the flute, the flow tends to swirl for one-third of the distance to the exit, corresponding roughly to the unpierced part. Downwards, it becomes fully axial. As with the clarinet, the air exits through a major part of the opened keys, and the flow rate and velocity are then reduced at the main outlet.
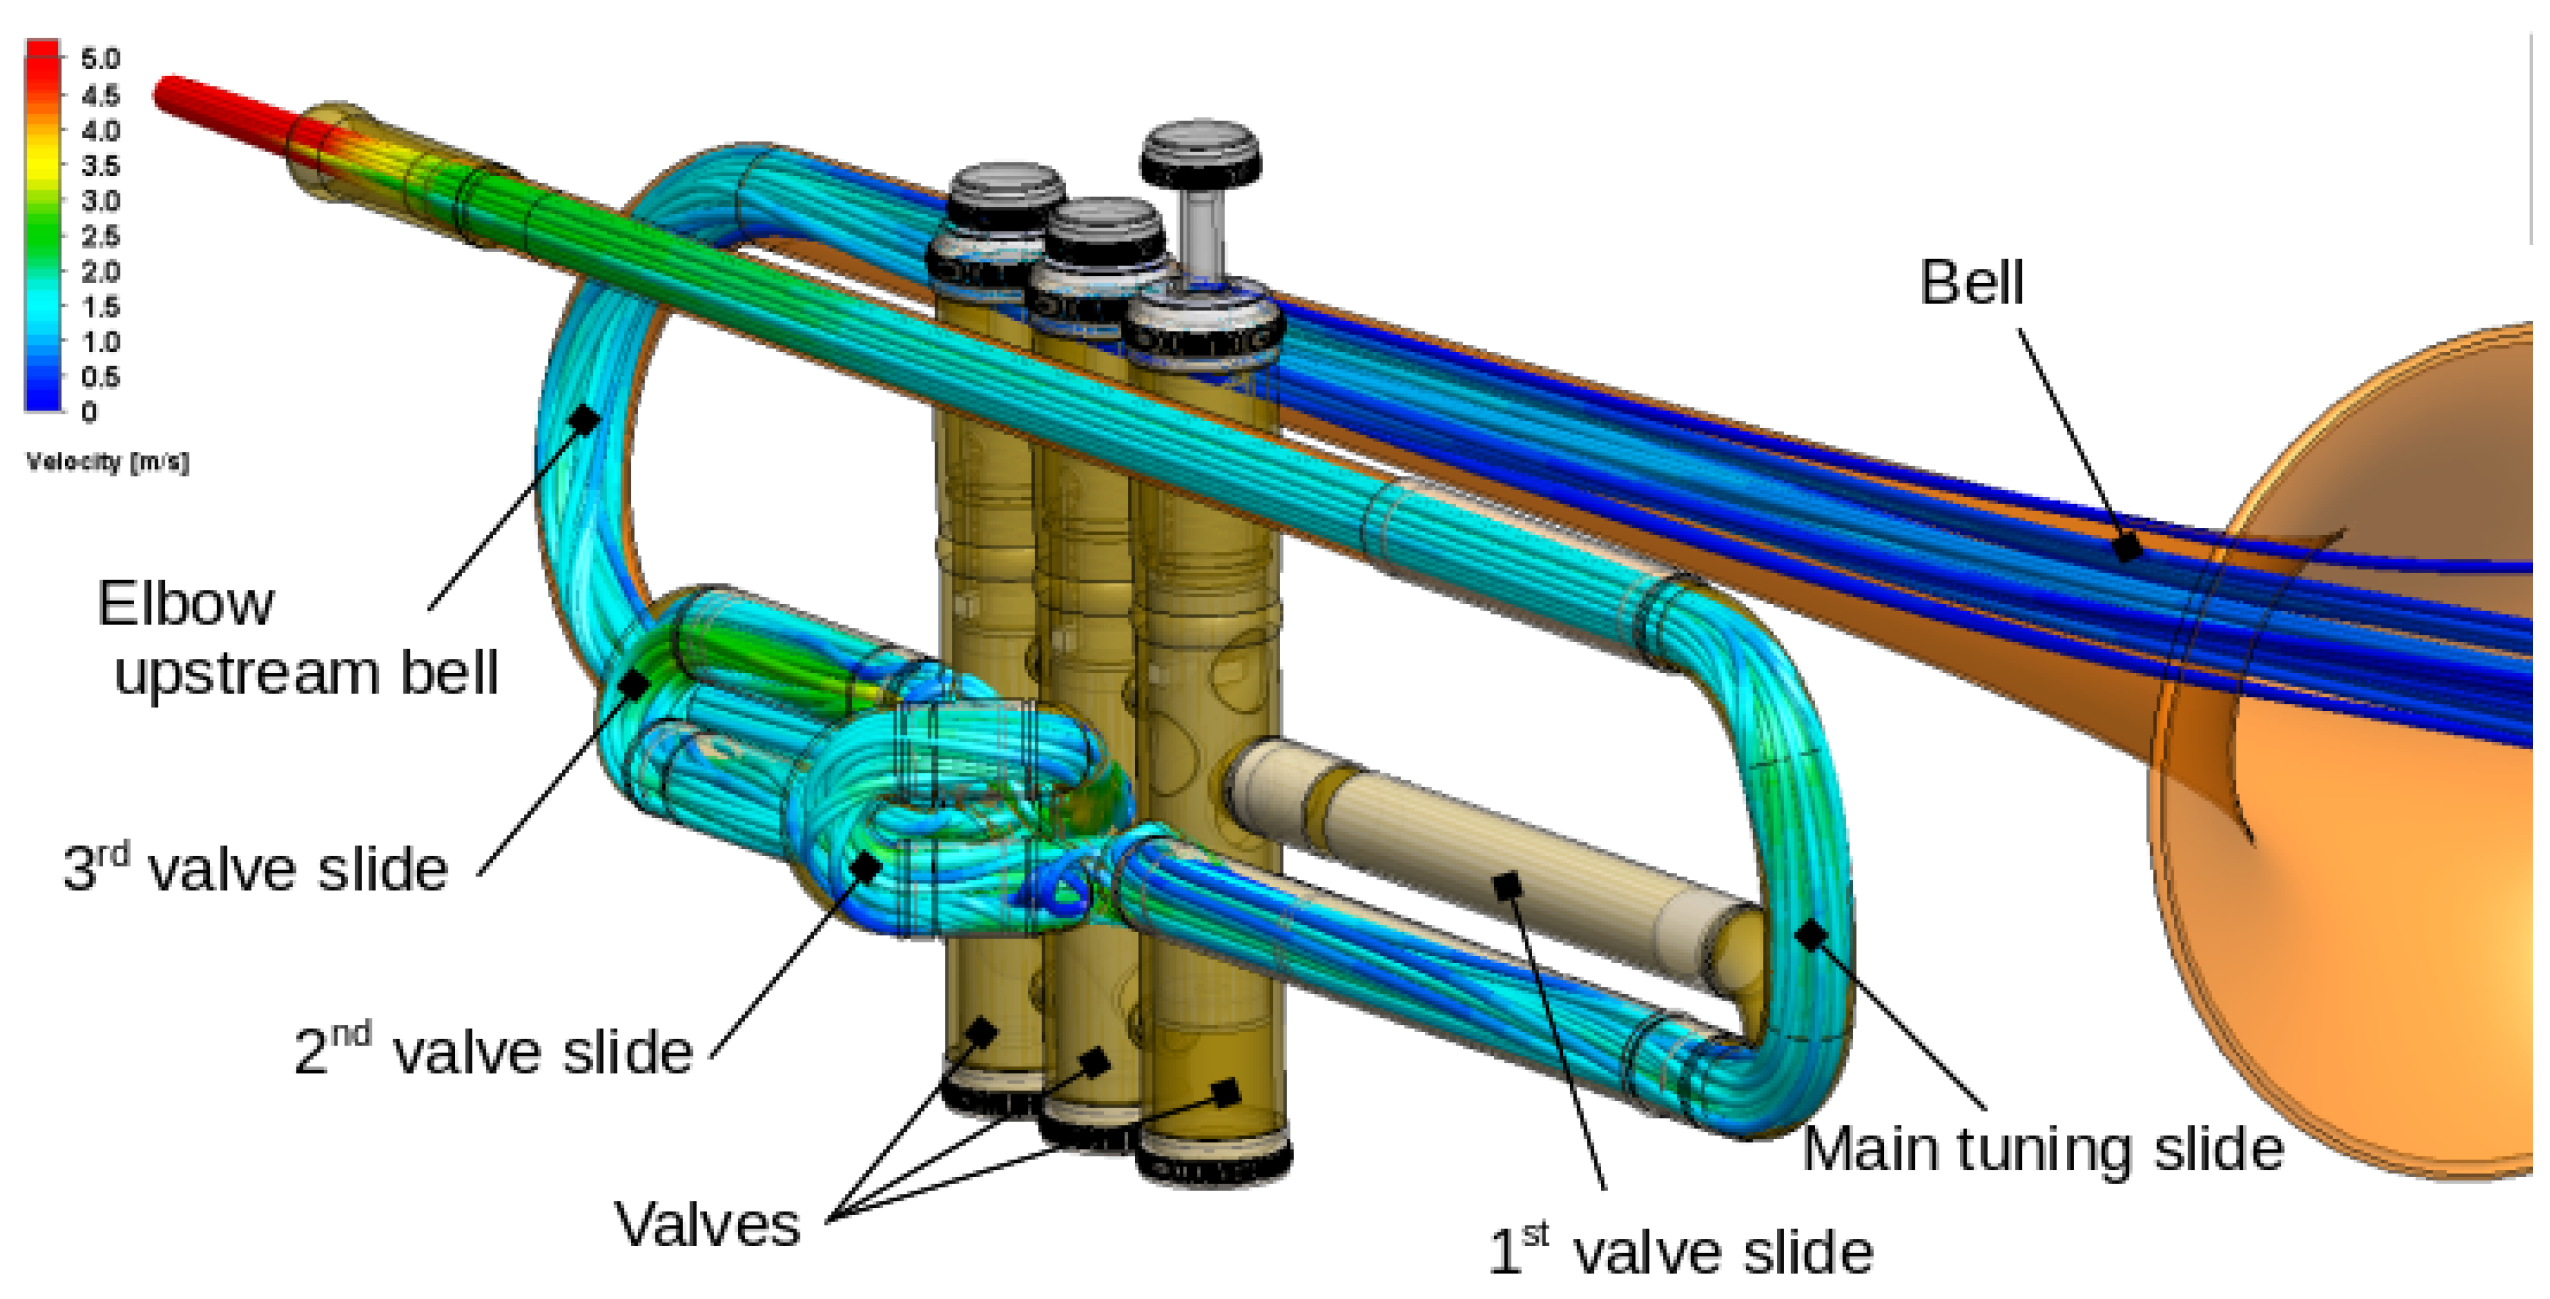
Trumpet: As shown by the streamlines plotted in Figure 10, the flow axis is offset when passing the two 90° angles of the main tuning slide. Then, it spins when passing through the valves but becomes axial again in the final slide or even upstream. It is again partially offset in the last angle upstream of the bell and remains concentrated up to the outlet.
Note that the flow at the bell, as computed here for each instrument, is not realistic. In reality, the mixing layer at the boundary of the outgoing jet would lead to eddies that cannot be numerically captured by solving averaged flow equations as performed here. Such eddies are clearly shown in schlieren imaging in [19], for example. Moreover, the outgoing flow may be influenced and modified by numerous parameters, such as temperature, external air velocity due to ventilation, or even human body thermal plumes and turbulent unsteadiness. Therefore, it is not worth paying too much attention to this part of the flow, since it does not have a major influence on the particle trajectories we are examining.

3.2. Particle Trajectories

We now describe the particle transportation for each instrument. The fractions of deposits, exits through keys, and exits through the bell with respect to the played note and particle size are summarized in Table 2.
Saxophone: Larger droplets all drop off in the instrument, mainly in the neck (68%) and in the elbow (8%). Remember that in the simulation, once deposited, droplets are not tracked anymore. In reality, they will stream down to the bow by gravity or accumulate upstream on tone hole chimneys. New droplets might be emitted through shedding, with a specific size that remains unknown. It also happens that the musician intentionally blows on sharp tone keys he has previously opened to expel the liquid deposit (and/or condensation).
For smaller droplets, results are similar for 5 μ m and 0.5 μ m. The larger the number of closed tone holes, the lower both the deposit and the exit through keys, respectively, from 26% and 0% for the E♭, to 35% and 13% with all keys opened. The difference is transferred to the fraction that exits through the bell, increasing from 53% when keys are opened to 74% when all are closed. The deposit is located mainly in the neck (11%) and the elbow, where it is higher for the all-opened-keys case (21%, with 4% on the key pads) than for the all-closed-keys case (11%).
Oboe: The particles behave the same regardless of the fingering. Larger droplets all drop off, while medium and small droplets all reach the bell.
Clarinet: Contrary to the oboe, due to the cylindrical rather than conical shape of the tube, there is a deposit of small and medium droplets on internal walls, ranging from 1% to 10%, and exit through tone holes of up to 22%. A large majority, 68% to 99%, reaches the bell. Larger droplets still all drop off, similar to previous instruments.
Flute: For this particular instrument, as shown in Figure 11, droplets might (i) be ejected directly into ambient air without penetrating inside the instrument, (ii) deposit on the external walls of the mouthpiece, (iii) penetrate inside the flute and deposit on internal walls, or exit the flute through (iv) keys or (v) the main hole on the side opposite to the mouthpiece. It appears that the majority is either emitted toward the outside or deposited. Only a small portion (4%) of the smallest droplets reaches the outlets, either the main hole or keys. Three different notes have been simulated, but their comparison has shown that fingering had no impact on particle trajectory.
To study the influence of the emission angle, two values of this parameter (with respect to the vertical line) have been used: 42°, aligned with the air flux and the edge on the mouthpiece, and 20°, which is oriented more toward the mouthpiece hole. The choice of the latter angle is not based on any realistic or documented condition but is given for comparison. The smallest particles are not influenced by this angle and follow the air flux. On the contrary, the largest ones have the highest rate of deposit, and the location where they drop off depends significantly on the emission angle: inside the flute at a low angle, or on the internal and external walls of the mouthpiece at 42°. Droplets of 5 µm behave in between.
Trumpet: For the trumpet, as for all brass instruments, the only outlet is the bell (not considering the water key which is not used during musical play). A total of 69% of the smallest droplets reach the bell in the case of the shortest travel (no valve pushed down). The deposit is distributed in the different parts of the instrument, mainly the main tuning slide (6%), valves (13%), following pipe (4%), and last elbow upstream of the bell (4%). Due to additional deposit in the valve slides, the concentration at the outlet is reduced to 50% for the longest travel (all valves pushed down). The deposit is larger in the first and third valve slides, since the second one is notably shorter. For intermediate particles, the deposit is larger, mainly in the valves but not just there. The concentration at the outlet is reduced to a range from 32% to 53%. Largest particles all drop off in the instrument. The deposit is 7% in the main tuning slide, but the majority is deposited upstream, since no droplets reach the valves. This is why the water key is located on that slide, on the outer diameter at the elbow exit; indeed, the purpose of this small key is to enable the player to expel liquid from inside the instrument.

4. Discussion

As previously mentioned in the introduction, we have not found other numerical investigations of the transportation of droplets by airflow in wind instruments in the literature. However, a few published articles report measurements of aerosol concentrations that can be used to compare with our computations. Among them, almost none report measurements near the keys of woodwind instruments, the latter being generally measured at the bell. For flute play, the aerosol concentrations measured near the mouthpiece hole and main outlet are 51 particles/L and 44 particles/L, respectively, therefore in proportions of 54% and 46% [10]. In the same study, the authors reported a probability density function of the aerosol size (raw data) centered on 1.2 µm. Considering that this corresponds to dry residues, since it has traveled through a collection tube before reaching the measuring cell and fully evaporated during that travel, we might expect original wet aerosols centered on no more than 5 µm [24,32]. From our computations, if we assume that all particles deposited on the external faces of the mouthpiece are re-emitted near the mouthpiece hole, and that all particles deposited on the internal walls of the flute stream up to the main outlet where they are re-emitted, the proportion in aerosol concentrations would be 50% near the mouthpiece hole and 50% near the main outlet considering a diameter of 5 µm. For smaller particles, the corresponding rates are 52% and 48%, respectively. These figures are in good agreement with measurements in [10].
In our computations, regardless of the wind instrument, droplets with a diameter of 50 µm that are blown inside the instrument all drop off on internal walls. No large particle reaches any outlet, neither key nor bell. This is in agreement with all published measurements; none of them report particles with diameters over a few microns.
For smaller particles, the classification of wind instruments with regard to the rate exiting through the bell is, in decreasing order, (1) oboe, (2) clarinet, (3) saxophone, (4) trumpet, (5) flute. For the same instruments (except saxophone, which might, however, be compared to bass clarinet, since both have a neck and bow), a classification with regard to the aerosol concentration is reported in [10] as follows: (1) trumpet, 2000 particles/L; (2) oboe, 400 particles/L; (3) clarinet, 200 particles/L; (4) bass clarinet, 60 particles/L; (5) flute, 50 particles/L. The two classifications only differ by the trumpet. However, the study in [13] reports the following classification: (1) oboe, 1500–4000 particles/L; (2) clarinet, 500–3000 particles/L; (3) trumpet, 500–1800 particles/L; (4) saxophone, 70 particles/L; and flute, <100 particles/L. There is, therefore, a disagreement on the position of the trumpet in the classification between the two measurement campaigns, but also a large discrepancy in the concentration level.
However, numerical and experimental approaches agree on the fact that instruments with a straight structure, like the oboe and clarinet, are more likely to expel aerosols than instruments with steep turnings, like the saxophone or trumpet. In addition, our numerical approach provides further insights. It shows that the cylindrical shape of the clarinet tends to facilitate both the deposition on internal walls and the exit through opened keys compared to the conical shape of the oboe. It is nevertheless insufficient to conclude that this is the reason why the aerosol concentration is higher in the case of the oboe compared to the clarinet, since they do not have the same types of mouthpieces (single-reed for clarinet, double-reed for oboe). Therefore, the aerosol concentrations, and also their sizes, could differ as early as right downstream from the mouthpiece.
One of the significant contributions of this study is its potential to optimize aerosol measurement techniques. Aerosol measurements in wind instruments have predominantly been conducted at the bell. This study demonstrates the importance of considering internal dynamics and multiple measurement points within the instrument to obtain a comprehensive understanding of aerosol propagation, which can be anticipated with CFD.
By employing CFD, we have identified specific zones within the instruments where particle deposition and exit occur. This insight allows for the optimization of measurement instruments by informing the placement of sensors and the selection of appropriate particle sizes to measure. Consequently, future experimental setups can be designed to capture a more accurate representation of aerosol behavior, leading to more reliable data.
Finally, the approach is based on aerodynamics. An interesting perspective would be to take into account the acoustical pressure (and therefore velocities) when the instrument is played in the computations, to evaluate the possibility of modifying air propagation.

5. Conclusions

This study has shown that the numerical investigation of particle trajectories as carried by a steady-state averaged flow inside wind instruments leads to observations that are in agreement with the few experimental measurements published on the topic. Large particles are deposited in the instrument, and only small particles in the range of microns reach the outlets, predominantly through the bell. Cylindrical shapes of tubes (clarinet, flute) tend to increase the amount of small droplets deposited or exiting through tone holes compared to conical shapes (saxophone, oboe). Steep turnings, as found on brass instruments such as the trumpet, also lead to a large number of deposits (over 30%).
The behavior of deposited particles has not been addressed, but it can be assumed that they stream down the internal walls. For curved instruments such as the saxophone or brass instruments, it is quite unlikely that they will reach openings. However, for straight instruments like the oboe, clarinet, or flute, both the airflow and gravity tend to guide droplets towards the bell or tone holes, where re-emission through tearing may occur.
In summary, while the CFD simulations provide valuable insights into aerosol propagation in wind instruments, they also highlight the need for optimized aerosol measurement techniques. Future experimental studies should incorporate multiple measurement points within the instrument and utilize sensors capable of detecting a range of particle sizes. The proposed approach will help increase the accuracy of aerosol data measurements by optimizing sensor position and ranges. This study demonstrates the importance of considering internal dynamics and multiple measurement points within the instrument. While the CFD simulations have provided significant insights into aerosol propagation in wind instruments, future experimental investigations are essential to validate these results. Such validation will strengthen the reliability of CFD as a tool for studying aerosol behavior in the context of musical instruments.

Author Contributions

Conceptualization, T.S., M.J. and R.V.; methodology, T.S., M.J. and R.V.; software, T.S.; validation, T.S., R.V. and M.J.; formal analysis, T.S.; investigation, T.S., J.N.;resources, T.S.; data curation, T.S. and J.N. writing—original draft preparation, T.S., R.V. and M.C.; writing—review and editing, T.S., R.V. and M.C.; visualization, T.S. and J.N.; supervision, T.S., project administration, M.J.; funding acquisition, M.J. All authors have read and agreed to the published version of the manuscript.

Funding

This research received no external funding.

Institutional Review Board Statement

Not applicable.

Informed Consent Statement

Not applicable.

Data Availability Statement

The raw data supporting the conclusions of this article will be made available by the authors on request.

Acknowledgments

Authors acknowledge the following funders and support for this study, performed in the frame of the project PIC/PIV (Protocoles pour les Instruments face au Coronavirus/Pratique Instrumentale et Vocale): Chambre Syndicale de la facture instrumentale—CSFI, Les forces musicales, Fondation Bettencourt Schueller, Ministère de la culture, Direction Générale des Entreprises, Région Pays de la Loire, Audiens, Région Ile de France, La Direccte.

Conflicts of Interest

The authors declare no conflicts of interest.

Appendix A

Figure A1. Considered fingerings for flute: (a), note B; (b), note G; (c), note C♯.
Air 02 00017 g0a1
Figure A2. Considered fingerings for clarinet: (a), note E; (b), note C, (c), note G, (d), note B♭, * refers to possible alternate fingerings.
Air 02 00017 g0a2
Figure A3. Considered fingerings for oboe: (a), note B, (b), note G, (c) all opened.
Air 02 00017 g0a3
Figure A4. Considered fingerings for saxophone: (a), note B♭; (b), note G, (c), note F♯.
Air 02 00017 g0a4

Appendix B

Table A1. Lifetime of water liquid droplets at 26 °C and 50% relative humidity.
Droplet diameter [µm]520305080100
Evaporation time [ms]107015041010501640

Appendix C

Further numerical analysis is proposed here to demonstrate the attention paid to numerical quality. It is applied on the case of the clarinet. Regarding the mesh, it is automatically computed, although manually tuned to achieve targeted cell sizes. It uses a Cartesian meshing technology, meaning that cells are cubic. Local refinement is achieved by progressively cutting cells by two in all directions up to the targeted cell sizes (octree technique). The nominal mesh contains 0.6 million cells. The basic cell size is 15 mm. It is increased by a factor of 3 in the farfield. On the opposite, it is refined so that the mesh contains at least 10 cells in all cross-sections (tube, tone holes). It is also refined up to 5 times close to walls, reaching 0.5 mm at the wall. For the considered flow rate, the y + ranges from 4 close to the injection plane to 0.5 at the bell inlet. It is therefore below 5, allowing for the resolution of the viscous sub-layer instead of its modelling through the use of wall laws.
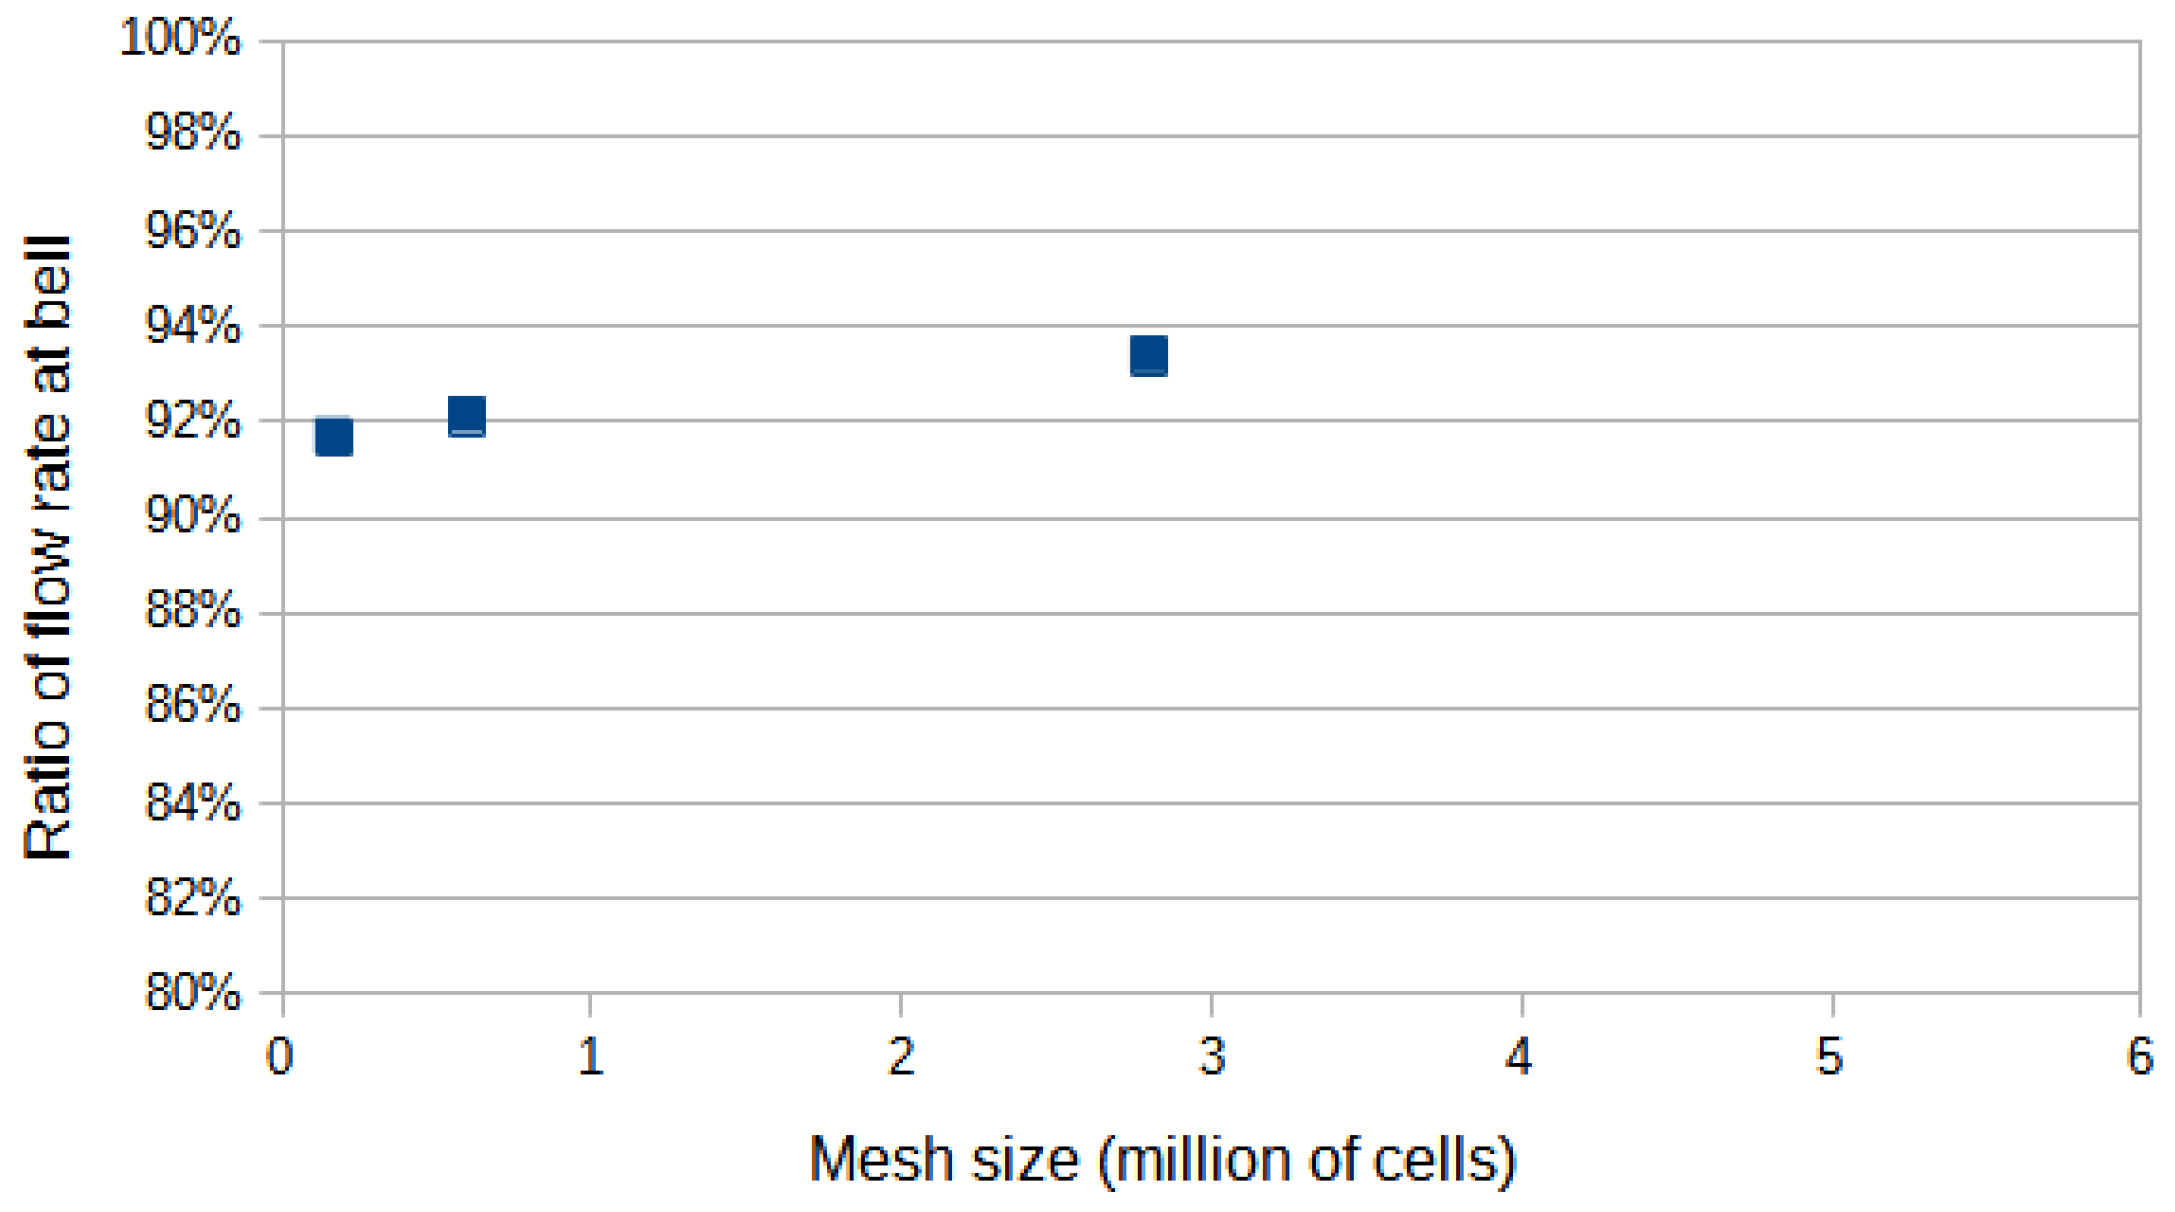
Two other meshes have been investigated for mesh convergence analysis: a coarser mesh and a finer one. They are basically obtained by multiplying or dividing, respectively, the basic cell size by a factor of 2. For the coarse mesh, however, cell size is maintained at walls to the same level as in the basic mesh, in order to ensure satisfactory y + . Figure A5 shows how the ratio of air coming out through the bell varies with respect to the mesh. Since the discrepancy between the nominal mesh and the fine mesh is low, the set-up corresponding to the nominal mesh is applied for all instruments.
Regarding the convergence toward a steady state, about 250 iterations are necessary to reach the stabilization of physical quantities defined as goals in the simulation. These quantities are chosen by the user. In the present study, we monitored the convergence for the following quantities:
  • average and maximum velocity for each component in the computational domain;
  • min, max, and average pressure in the computational domain;
  • flow rate and average total pressure through bell exit.
The levels of convergence are below 0.001 Pa for pressures, below 0.004 m/s (0.7%) for velocities, and 0.01 L/min (0.1%) for flow rate. The solver does not provide the monitoring of residuals. Furthermore, the time step is automatically chosen, in order to fulfill internal stability criteria such as Courant number while enabling the fastest convergence.
Table A2. Mesh characteristics.
LevelTotal Number of CellsNumber of Partial Fluid/Solid CellsCell Size at WallRange of y +
Coarse170,00090,0000.50 mm[0.50–4]
Nominal600,000180,0000.50 mm[0.50–4]
Fine2,800,000470,0000.25 mm[0.25–2]
Figure A5. Clarinet: flow rate at the bell with respect to mesh size.
Air 02 00017 g0a5

References

  1. Gralton, J.; Tovey, E.; McLaws, M.L.; Rawlinson, W.D. The role of particle size in aerosolised pathogen transmission: A review. J. Infect. 2011, 62, 1–13. [Google Scholar] [CrossRef] [PubMed]
  2. Drossinos, Y.; Weber, T.P.; Stilianakis, N.I. Droplets and aerosols: An artificial dichotomy in respiratory virus transmission. Health Sci. Rep. 2021, 4, e275. [Google Scholar] [CrossRef] [PubMed]
  3. Yang, W.; Marr, L.C. Dynamics of Airborne influenza A viruses indoors and dependence on humidity. PLoS ONE 2011, 6, e21481. [Google Scholar] [CrossRef]
  4. Lieber, C.; Melekidis, S.; Koch, R.; Bauer, H.J. Insights into the evaporation characteristics of saliva droplets and aerosols: Levitation experiments and numerical modeling. J. Aerosol Sci. 2021, 154, 105760. [Google Scholar] [CrossRef]
  5. Kähler, C.J.; Hain, R. Singing in Choirs and Making Music with Wind Instruments—Is That Safe during the SARS-CoV-2 Pandemic? University of the Bundeswehr Munich: Neubiberg, Germany, 2020; p. 9. [Google Scholar] [CrossRef]
  6. Becher, L.; Gena, A.W.; Voelker, C. Risk Assessment of the Spread of Breathing Air from Wind Instruments and Singers during the COVID-19 Pandemic. 2020. Available online: https://www.researchgate.net/profile/Lia-Benetas/publication/343021382_1st_update_Risk_assessment_of_the_spread_of_breathing_air_from_wind_instruments_and_singers_during_the_COVID-19_pandemic_1_Update_Risikoeinschatzung_zur_Ausbreitung_der_Atemluft_beim_Spielen_von_Blasi/links/5f197996a6fdcc9626aa43ca/1st-update-Risk-assessment-of-the-spread-of-breathing-air-from-wind-instruments-and-singers-during-the-COVID-19-pandemic-1-Update-Risikoeinschaetzung-zur-Ausbreitung-der-Atemluft-beim-Spielen-von-B.pdf (accessed on 15 August 2024).
  7. Viala, R.; Creton, M.; Jousserand, M.; Soubrié, T.; Néchab, J.; Crenn, V.; Léglise, J. Experimental and numerical investigation on aerosols emission in musical practice and efficiency of reduction means. J. Aerosol Sci. 2022, 166, 1–46. [Google Scholar] [CrossRef]
  8. McCarthy, L.P.; Orton, C.M.; Watson, N.A.; Gregson, F.K.A.; Haddrell, A.E.; Browne, W.J.; Calder, J.D.; Costello, D.; Reid, J.P.; Shah, P.L.; et al. Aerosol and Droplet Generation from Performing with Woodwind and Brass Instruments. Aerosol Sci. Technol. 2021, 55, 1277–1287. [Google Scholar] [CrossRef]
  9. Firle, C.; Steinmetz, A.; Stier, O.; Stengel, D.; Ekkernkamp, A. Aerosol emission from playing wind instruments and related COVID-19 infection risk during music performance. Sci. Rep. 2022, 12, 8598. [Google Scholar] [CrossRef]
  10. Abraham, A.; He, R.; Shao, S.; Kumar, S.S.; Wang, C.; Guo, B.; Trifonov, M.; Placucci, R.G.; Willis, M.; Hong, J. Risk Assessment and Mitigation of Airborne Disease Transmission in Orchestral Wind Instrument Performance Risk Assessment and Mitigation of Airborne Disease Transmission in Orchestral Wind Instrument Performance. J. Aerosol Sci. 2020. [Google Scholar] [CrossRef]
  11. Good, N.; Fedak, K.M.; Goble, D.; Keisling, A.; L’Orange, C.; Morton, E.; Phillips, R.; Tanner, K.; Volckens, J. Respiratory Aerosol Emissions from Vocalization: Age and Sex Differences Are Explained by Volume and Exhaled CO2. Environ. Sci. Technol. Lett. 2021, 8, 1071–1076. [Google Scholar] [CrossRef]
  12. He, R.; Gao, L.; Trifonov, M.; Hong, J. Aerosol Generation from Different Wind Instruments. J. Aerosol Sci. 2020, 151, 105669. [Google Scholar] [CrossRef] [PubMed]
  13. Stockman, T.; Zhu, S.; Kumar, A.; Wang, L.; Patel, S.; Weaver, J.; Spede, M.; Milton, D.; Hertzberg, J.; Toohey, D.; et al. Measurements and Simulations of Aerosol Released while Singing and Playing Wind Instruments. ACS Environ. 2021, 1, 71–84. [Google Scholar] [CrossRef]
  14. Volckens, J.; Good, K.M.; Goble, D.; Good, N.; Keller, J.P.; Keisling, A.; L’Orange, C.; Morton, E.; Phillips, R.; Tanner, K. Aerosol emissions from wind instruments: Effects of performer age, sex, sound pressure level, and bell covers. Sci. Rep. 2022, 12, 11303. [Google Scholar] [CrossRef]
  15. Archer, J.; McCarthy, L.P.; Symons, H.E.; Watson, N.A.; Orton, C.M.; Browne, W.J.; Harrison, J.; Moseley, B.; Philip, K.E.; Calder, J.D.; et al. Comparing aerosol number and mass exhalation rates from children and adults during breathing, speaking and singing. Interface Focus 2022, 12, 20210078. [Google Scholar] [CrossRef] [PubMed]
  16. Gregson, F.K.A.; Watson, N.A.; Orton, C.M.; Haddrell, A.E.; Mccarthy, L.P.; Finnie, T.J.R.; Gent, N.; Donaldson, G.C.; Shah, P.L. Comparing the Respirable Aerosol Concentrations and Particle Size Distributions Generated by Singing, Speaking and Breathing. Aerosol Sci. Technol. 2021, 55, 681–691. [Google Scholar] [CrossRef]
  17. Kähler, C.J.; Fuchs, T.; Hain, R. Can mobile indoor air cleaners effectively reduce an indirect risk of SARS-CoV-2 infection by aerosols? Can mobile indoor air cleaners effectively reduce an indirect risk of SARS-CoV-2 infection by aerosols? MMWR 2020, 70, 972–976. [Google Scholar] [CrossRef]
  18. De La Cuadra, P.; Vergez, C.; Fabre, B. Visualization and analysis of jet oscillation under transverse acoustic perturbation. J. Flow Vis. Image Process. 2007, 14, 355–374. [Google Scholar] [CrossRef]
  19. Becher, L.; Gena, A.W.; Alsaad, H.; Richter, B.; Spahn, C.; Voelker, C. The spread of breathing air from wind instruments and singers using schlieren techniques. Indoor Air 2021, 31, 1798–1814. [Google Scholar] [CrossRef] [PubMed]
  20. Viola, I.M.; Peterson, B.; Pisetta, G.; Pavar, G.; Akhtar, H.; Menoloascina, F.; Mangano, E.; Dunn, K.E.; Gabl, R.; Nila, A.; et al. Face Coverings, Aerosol Dispersion and Mitigation of Virus Transmission Risk. IEEE Open J. Eng. Med. Biol. 2020, 2, 26–35. [Google Scholar] [CrossRef] [PubMed]
  21. Simcenter. Simcenter FLOEFD Technical Reference, Software version 2020.2; Siemens: Munich, Germany, 2020. [Google Scholar]
  22. Henderson, C.B. Drag coefficients of spheres in continuum and rarefied flows. AIAA J. 1976, 14, 707–708. [Google Scholar] [CrossRef]
  23. Gittings, S.; Turnbull, N.; Henry, B.; Roberts, C.J.; Gershkovich, P. Characterisation of human saliva as a platform for oral dissolution medium development. Eur. J. Pharm. Biopharm. 2015, 91, 16–24. [Google Scholar] [CrossRef]
  24. Duguid, J.P. The Size and Duration of Air-Carriage of Respiratory Droplets and Droplet-Nuclei. J. Hyg. 1946, 44, 471–480. [Google Scholar] [CrossRef] [PubMed]
  25. Nicas, M.; Nazaroff, W.W.; Hubbard, A. Toward understanding the risk of secondary airborne infection: Emission of respirable pathogens. J. Occup. Environ. Hyg. 2005, 2, 143–154. [Google Scholar] [CrossRef] [PubMed]
  26. Wei, J.; Li, Y. Enhanced spread of expiratory droplets by turbulence in a cough jet. Build. Environ. 2015, 93, 86–96. [Google Scholar] [CrossRef]
  27. Laurent, C. Développement et Validation de Modèles d’évaporation Multi-Composant. Ph.D. Thesis, Université de Toulouse, Toulouse, France, 2008. [Google Scholar]
  28. Hardy, D.A.; Archer, J.; Lemaitre, P.; Vehring, R.; Reid, J.P.; Walker, J.S. High time resolution measurements of droplet evaporation kinetics and particle crystallisation. Phys. Chem. Chem. Phys. 2021, 23, 18568–18579. [Google Scholar] [CrossRef] [PubMed]
  29. Alsved, M.; Matamis, A.; Bohlin, R.; Richter, M.; Bengtsson, P.E.; Fraenkel, C.J.; Medstrand, P.; Löndahl, J. Exhaled respiratory particles during singing and talking. Aerosol Sci. Technol. 2020, 54, 1245–1248. [Google Scholar] [CrossRef]
  30. Mürbe, D.; Fleischer, M.; Lange, J.; Rotheudt, H.; Kriegel, M. Aerosol Emission Is Increased in Professional Singing. OSF Preprints. 2020, pp. 1–10. Available online: https://osf.io/preprints/osf/znjeh (accessed on 15 August 2024).
  31. Mürbe, D.; Kriegel, M.; Lange, J.; Schumann, L.; Hartmann, A.; Fleischer, M. Aerosol emission of adolescents voices during speaking, singing and shouting. PLoS ONE 2021, 16, e0246819. [Google Scholar] [CrossRef] [PubMed]
  32. Gao, X.; Wei, J.; Lei, H.; Xu, P.; Cowling, B.J.; Li, Y. Building ventilation as an effective disease intervention strategy in a dense indoor contact network in an Ideal City. PLoS ONE 2016, 11, e0162481. [Google Scholar] [CrossRef] [PubMed]
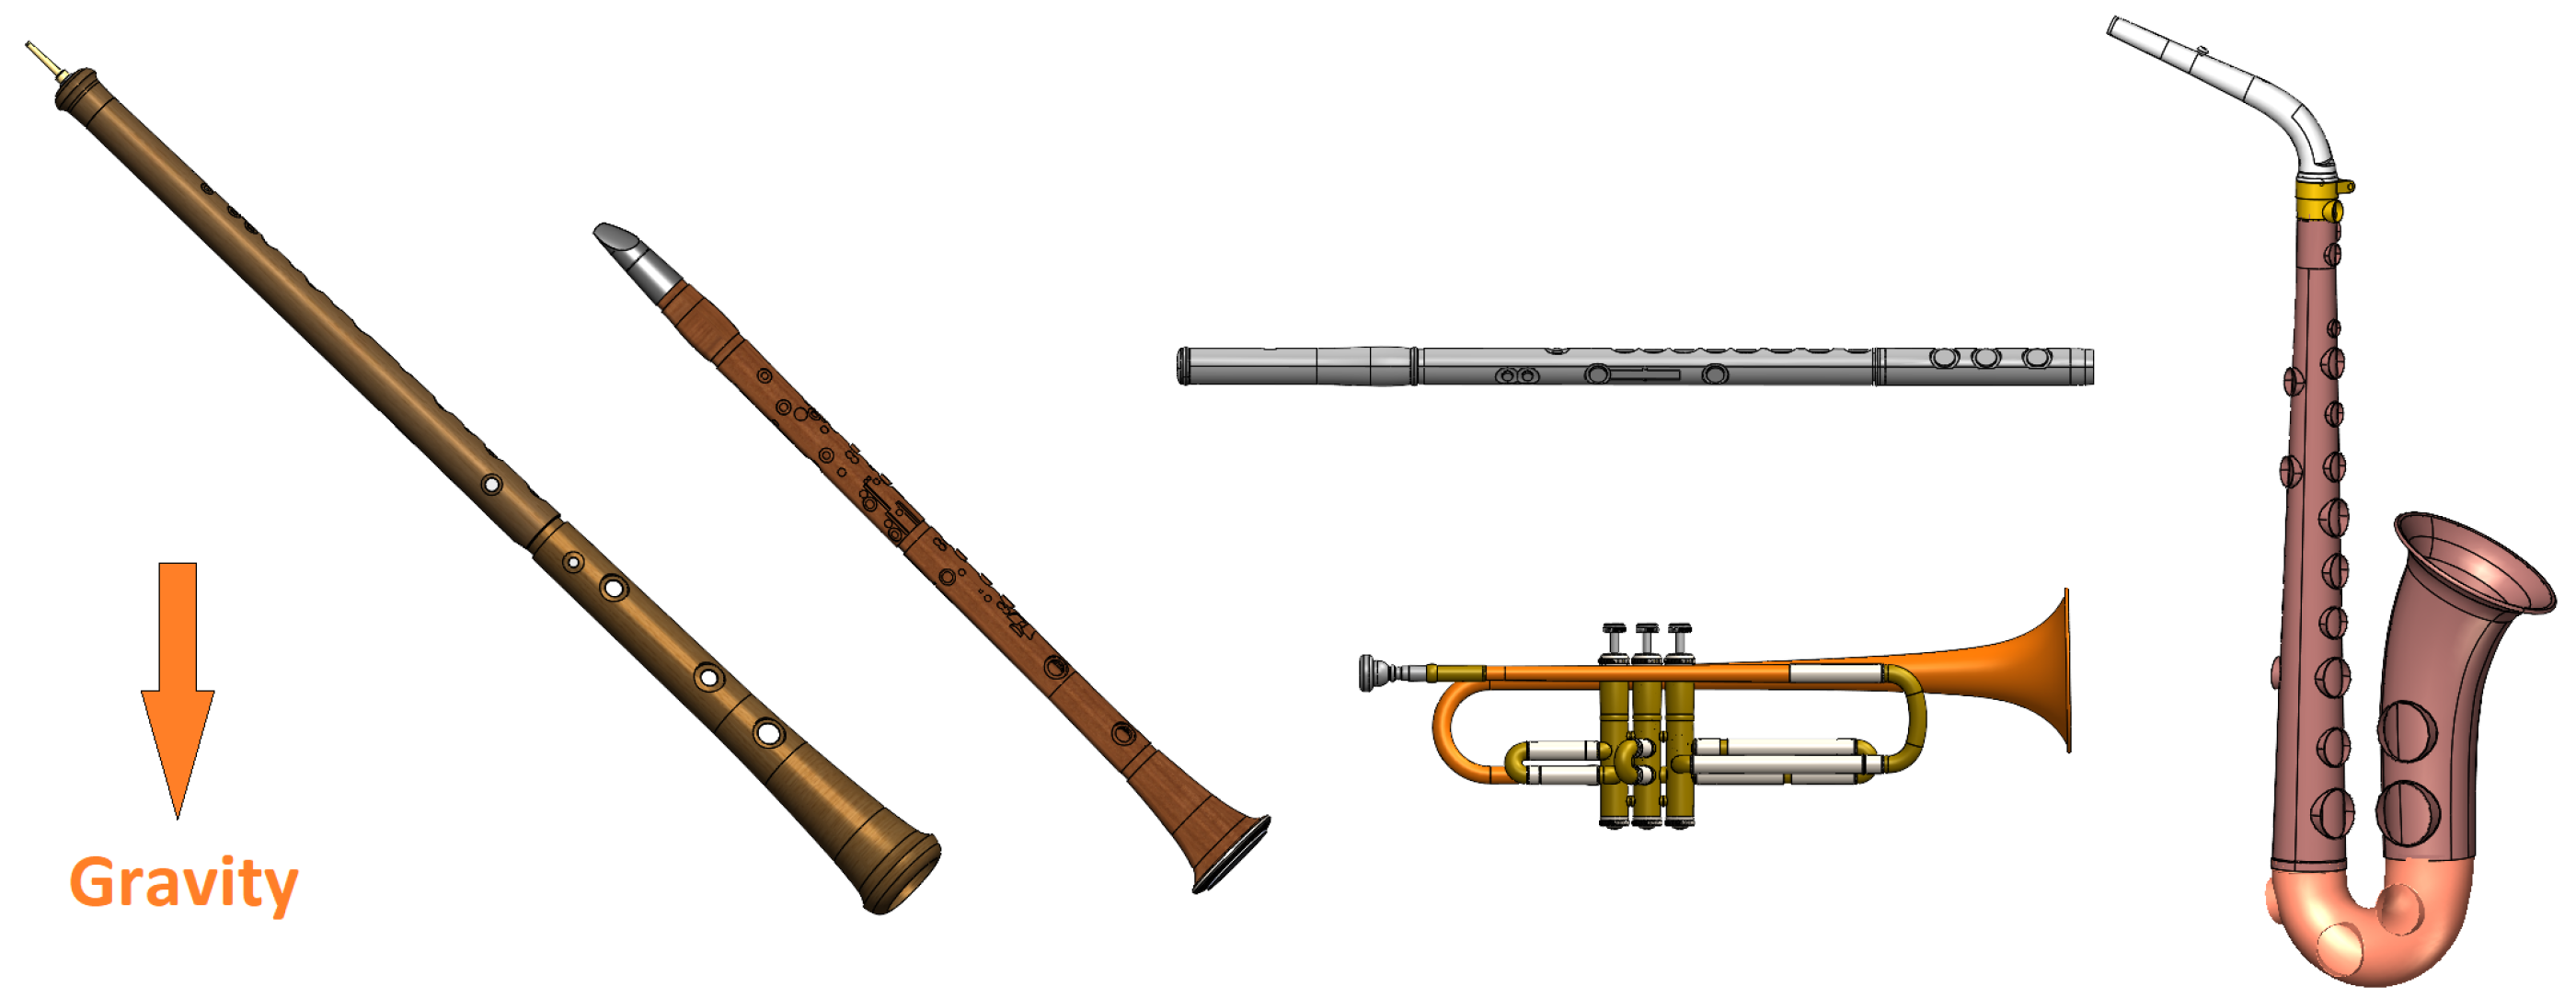
Figure 1. Direction of gravity with respect to instruments.
Air 02 00017 g001
Figure 2. Clarinet: mesh in a median plane through tone holes.
Air 02 00017 g002
Figure 3. Model of flutist’s head, highlighting the circular opening at the mouth location (center) and the direction of the exhaled air jet defined by the arrow (right).
Air 02 00017 g003
Figure 4. Saxophone: streamlines of air, flowing downstream from the neck (left, red lines), and crossing the bell outlet section (right, blue lines), in the case of all opened keys.
Air 02 00017 g004
Figure 5. Saxophone: air velocity contours and vectors in median plane near the bow and in the neck, for different played notes. (a) Near the bow, all opened keys; (b) near the bow, half-opened keys; (c) near the bow, all closed keys; (d) zoom-in the neck, all opened keys.
Air 02 00017 g005
Figure 6. Smoke blown in alto saxophone mouthpiece and neck.
Air 02 00017 g006
Figure 7. Oboe: air velocity contours and vectors in a global view (left) and close-up of tone holes (right), all opened keys.
Air 02 00017 g007
Figure 8. Clarinet: air velocity contours and vectors, half-opened keys (G).
Air 02 00017 g008
Figure 9. Flute: air velocity contours and vectors for all closed keys in cross-sectional view passing through the mouth (left) and in median plane (center), as well as for all opened keys (right).
Air 02 00017 g009
Figure 10. Trumpet: air streamlines colored by velocity, first two pistons pushed down.
Air 02 00017 g010
Figure 11. Identification of the deposit zones for the flute.
Air 02 00017 g011
Table 1. Airflow rate and notes used in the simulations with respect to the instrument. The symbols # and ♭ refer to sharp and flat, an increase or decrease of one semi tone respectively.
InstrumentRate (L/min)Holes ClosedIntermediate Note (s)Holes Opened
Saxophone14B♭GF#
Clarinet10E      CGB♭
Oboe3BGC#
Flute10BGC#
Trumpet10all pistons downpistons 1 and 2 down, 3 upall pistons up
Table 2. Computed rates of droplet behaviors for each instrument with respect to the played music note, droplet diameter, and particles’ initial angle formed with the vertical axis (flute only).
a Saxophone
Instrument fingeringsAll closedHalf closedAll opened
Droplet diameter0.5 μ m5 μ m50 μ m0.5 μ m5 μ m50 μ m0.5 μ m5 μ m50 μ m
Deposit in neck11%12%68%11%12%68%11%12%68%
Deposit in bow10%11%8%11%13%8%16%18%8%
Deposit on bow keys0%0%0%1%1%0%4%3%0%
Total deposit26%26%100%27%30%99%33%36%100%
Exit through keys0009%9%1%13%12%0%
Exit through bell74%74%0%64%62%0%54%52%0%
b Oboe
Instrument fingeringsWhatever
Droplet diameter0.5–5 μ m50 μ m
Total deposit0%100%
Exit through keys0%0%
Exit through bell100%0%
c Clarinet
Instrument fingeringsAll closedIntermediate 1Intermediate 2All openedWhatever
Droplet diameter0.5–5 μ m0.5–5 μ m0.5–5 μ m0.5–5 μ m50 μ m
Total deposit1%6%10%11%100%
Exit through keys05%16%21%0%
Exit through bell99%89%74%68%0%
d Flute (instrument fingerings only have influence on exits through keys and main hole)
Initial angleWhatever42°20°42°20°
Droplet diameter0.5 μ m5 μ m50 μ m
Deposit on the internal mouthpiece wall21%50%63%47%0%
Deposit inside flute24%0%29%0%100%
Total internal deposit45%50%92%47%100%
Exit through keys 2%0%0%0%0%
Exit through main hole2%0%0%0%0%
Direct to environment44%31%0%11%0%
External deposit7%19%8%42%0%
e Trumpet
Instrument fingeringsNone pushedHalf pushedAll pushedWhatever
Droplet diameter0.5 μ m5 μ m0.5 μ m5 μ m0.5 μ m5 μ m50 μ m
Deposit in main tuning slide6%9%7%9%6%9%7%
Deposit in valves13%25%16%24%8%14%0%
Deposit in 1st valve slide0010%13%11%14%0%
Deposit in 2nd valve slide004%5%4%4%0%
Deposit in 3rd valve slide000010%14%0%
Deposit in tube just downstream valves4%4%0%0%0%0%0%
Deposit in elbow upstream bell4%7%1%2%2%2%0%
Total deposit31%47%40%56%50%68%100%
Exit through bell69%53%60%44%50%32%0%
Disclaimer/Publisher’s Note: The statements, opinions and data contained in all publications are solely those of the individual author(s) and contributor(s) and not of MDPI and/or the editor(s). MDPI and/or the editor(s) disclaim responsibility for any injury to people or property resulting from any ideas, methods, instructions or products referred to in the content.