Article

Diagnosing Early Establishment of Hybrid Sorghum in Response to Seeding Rates Using UAV-Based Remote Sensing and Soil ECa Analysis


by
Gonçalo Tavares Póvoas
1,
Luís Silva
2,3,*,
Susana Dias
3,4,
Paola D’Antonio
5,
Fernando Cebola Lidon
2,6,
João Serrano
1 and
Luís Alcino Conceição
3,4,7
1
MED-Mediterranean Institute for Agriculture, Environment and Development, CHANGE—Global Change and Sustainability Institute, University of Évora, Pólo da Mitra, Ap. 94, 7006-554 Évora, Portugal
2
Earth Sciences Department, NOVA School of Science & Technology, Campus of Caparica, NOVA University Lisbon, 2829-516 Caparica, Portugal
3
VALORIZA—Research Center for Endogenous Resource Valorization, Polytechnic Institute of Portalegre, 7300-110 Portalegre, Portugal
4
Elvas School of BioSciences, Polytechnic Institute of Portalegre, Train Headquarters Building 14th of January Avenue n°21, 7350-092 Elvas, Portugal
5
School of Agricultural, Forestry, Environmental and Food Sciences, University of Basilicata, 85100 Potenza, Italy
6
GeoBioTec Research Center, NOVA School of Science & Technology, Campus of Caparica, NOVA University Lisbon, 2829-516 Caparica, Portugal
7
InovTechAgro—National Skills Center for Technological Innovation in the Agroforestry Sector, 7300-110 Portalegre, Portugal
*
Author to whom correspondence should be addressed.
Grasses 2026, 5(1), 12; https://doi.org/10.3390/grasses5010012
Submission received: 14 January 2026 / Revised: 27 February 2026 / Accepted: 2 March 2026 / Published: 7 March 2026

Abstract

Sorghum is a resilient crop important for sustainable intensification in semi-arid regions, yet the impact of variable seeding rates on its early development remains under-researched. This research investigated the early establishment of hybrid sorghum under three seeding strategies, ”Uniformise” (medium density across all zones), “Optimise” (increased density in low-soil apparent Electrical Conductivity (ECa)), and “Maximise” (increased density in high-soil ECa), at the Herdade da Comenda (Innovation Center—Elvas, Portugal). Crop performance was monitored over 33 days, the established window for safe direct grazing, using Unmanned Aerial Vehicle (UAV) multispectral imagery to derive the Normalised Difference Vegetation Index (NDVI) and Canopy Cover (Cveg), alongside physical sampling of plant height and biomass. Statistical analysis revealed that both the seeding strategy and soil variability significantly affected early growth. The “Uniformise” strategy recorded the highest plant height, NDVI, and Cveg values, whereas the “Optimise” strategy performed the poorest. Additionally, an accumulation of 407.5 Growing Degree-Days (GDDs; °C) accelerated the phenological cycle by five days relative to the climatological normal. Despite differences in vegetative vigour, no statistically significant variations were observed in final biomass across the strategies. These results indicate that while the “Uniformise” approach provided a more balanced environment for early establishment under these specific Mediterranean conditions, the lack of biomass differentiation highlights the potential for resource optimisation. The study demonstrates that UAV-based remote sensing is a useful diagnostic tool to identify these spatial limitations, providing the data to refine variable-rate seeding (VRS) algorithms and improve the economic efficiency of precision sowing.

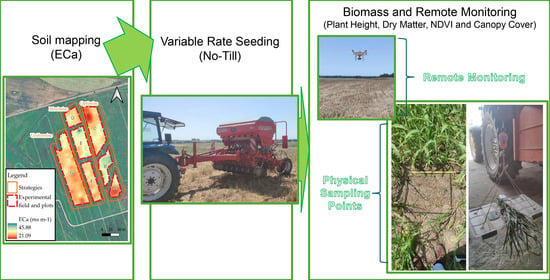
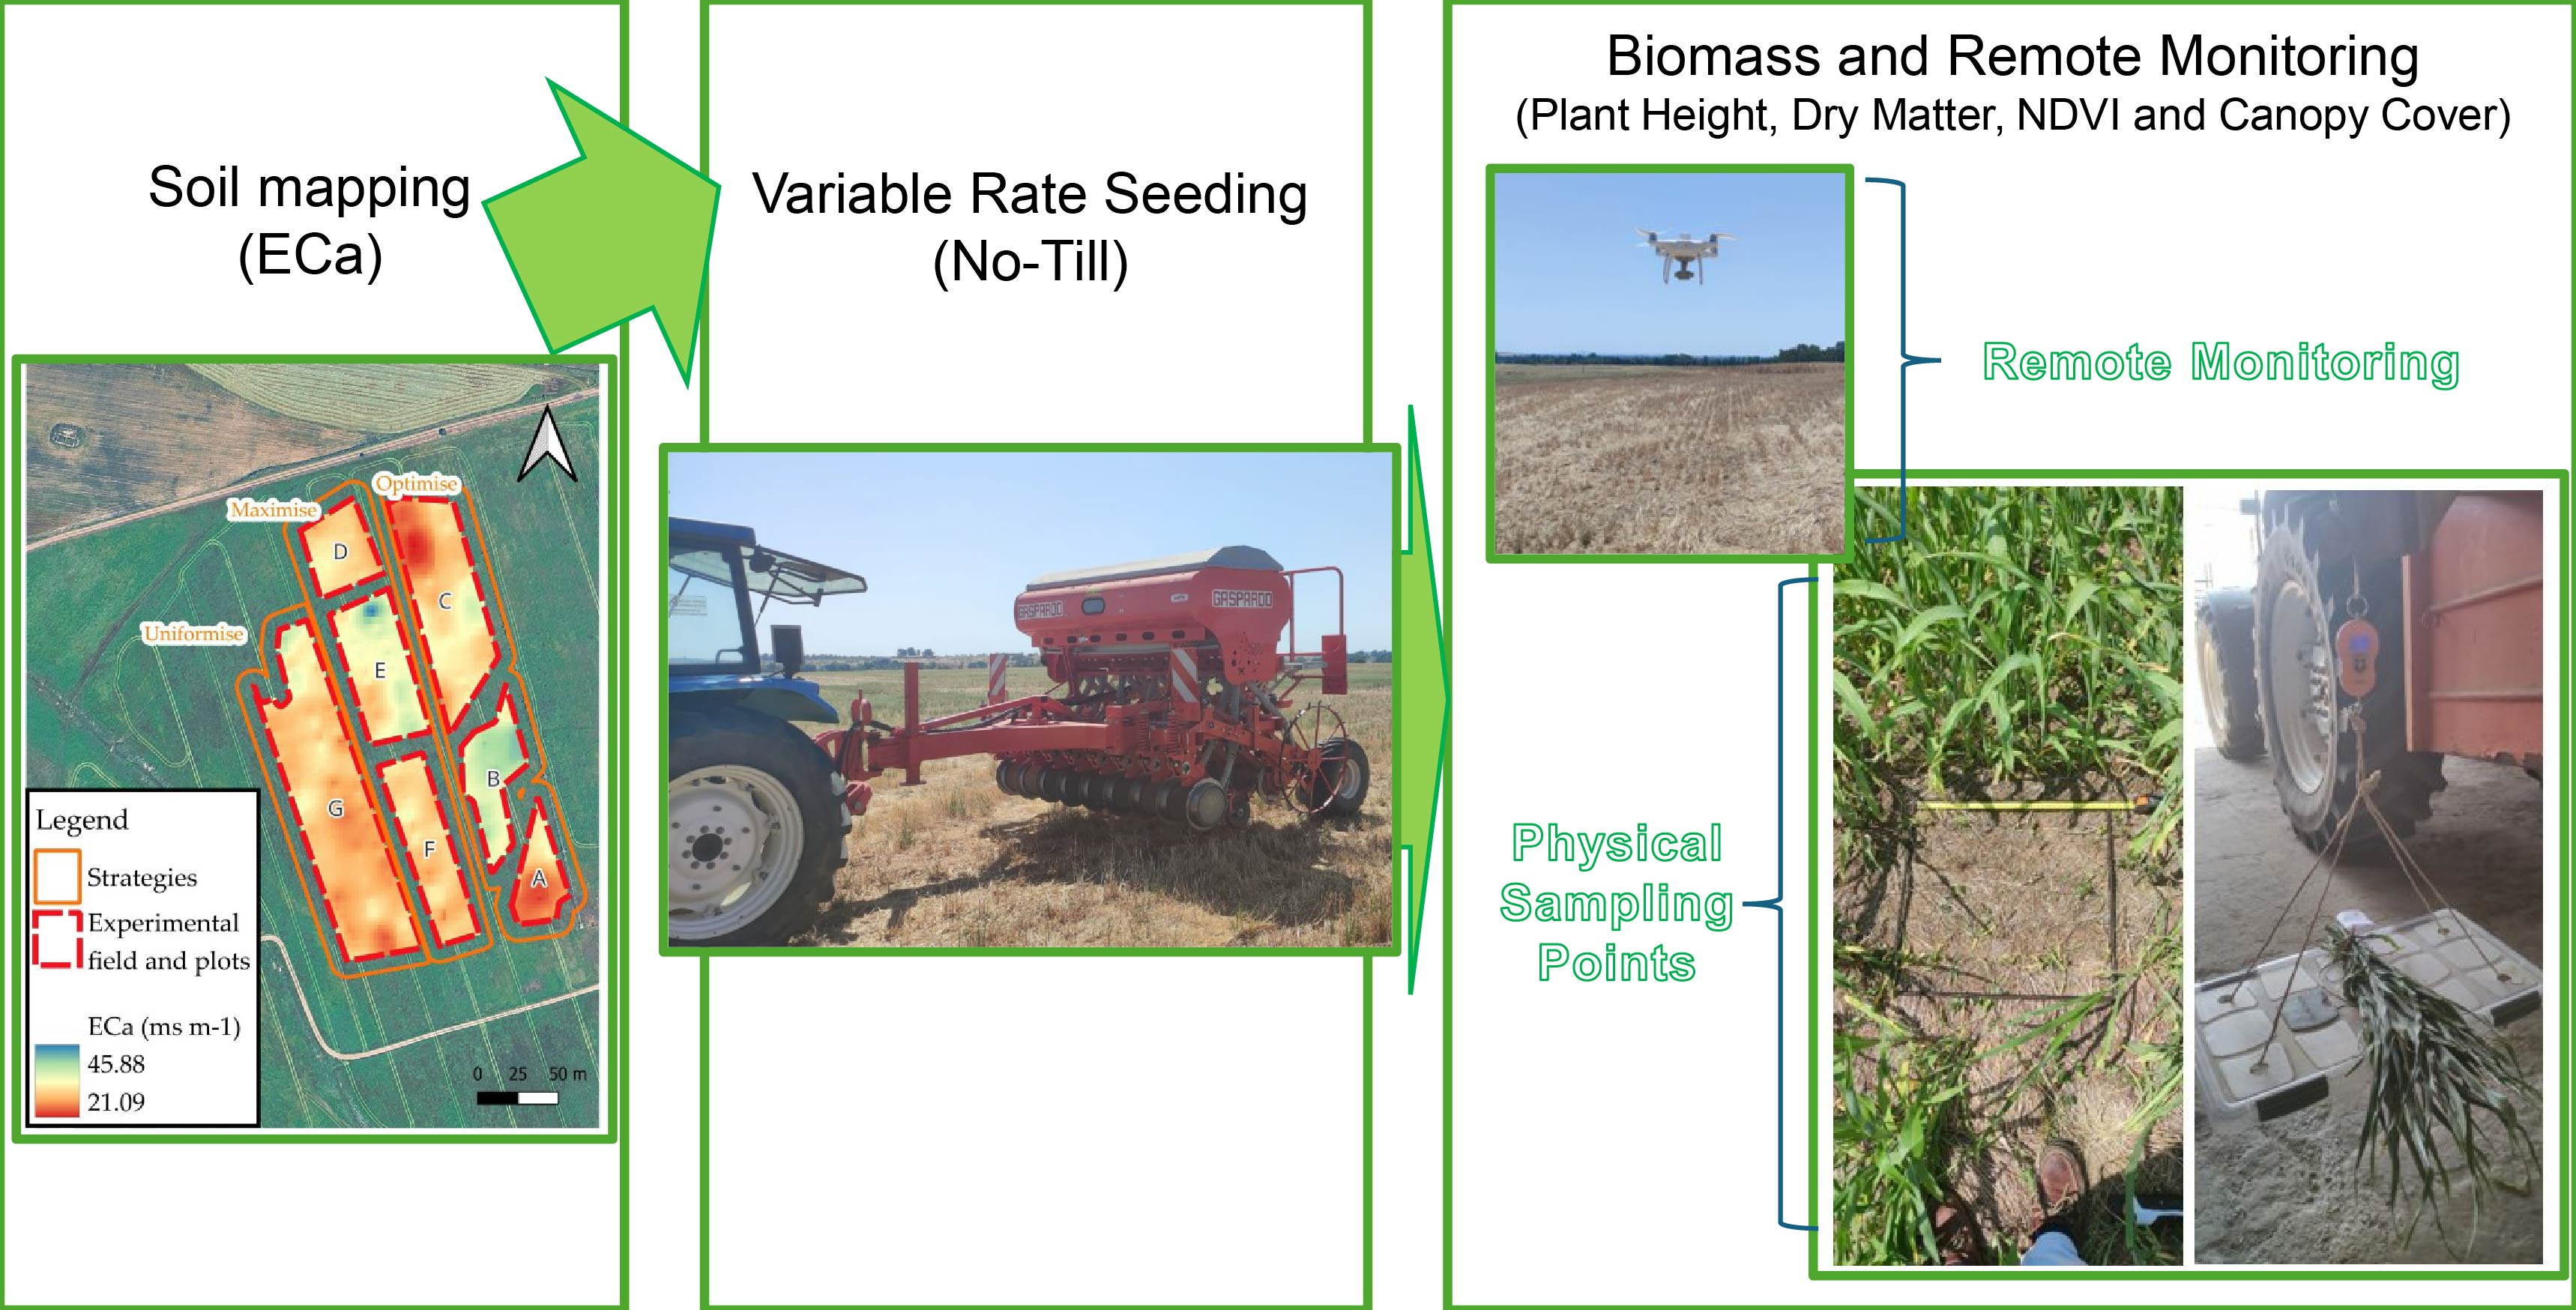
Graphical Abstract

1. Introduction

Sorghum (Sorghum bicolor L.) and Sudan grass (Sorghum sudanense) are globally significant crops, valued for their resilience to drought and versatility in providing food, fodder, and biofuel. In these systems, plant population density is a primary determinant of resource competition and canopy architecture, directly influencing light interception and water-use efficiency. The management of forage sorghum is strictly dictated by safety standards for livestock consumption. A critical constraint is the high concentration of cyanogenic glycosides in young plants, which can be toxic to animals. Consequently, grazing or harvesting can only commence once the crop reaches a minimum height of approximately 50–60 cm (the ‘knee-high’ stage), at which point the toxicity levels significantly decline. Monitoring this phase is, therefore, essential, as it defines the window for safe forage availability and the initial success of the seeding strategy in providing early-season feed. In the face of increasing climatic volatility and the need for sustainable intensification, precision agriculture has emerged as a critical framework for enhancing resource-use efficiency. One of the most promising precision agriculture techniques is variable-rate seeding (VRS), which allows farmers to adjust plant populations according to the spatial variability of soil properties, thereby aligning crop demand with local yield potential [1].
The effectiveness of VRS strategies relies heavily on the accurate delineation of management zones. Soil apparent Electrical Conductivity (ECa), a measure of the soil’s ability to conduct an electrical current, has become a primary proxy for this purpose, as it integrates various soil physical and chemical properties, including texture, moisture content, and cation exchange capacity [2]. Research indicates that zones with higher ECa often correlate with superior soil fertility and water-holding capacity, theoretically supporting higher plant densities. Conversely, in areas with lower ECa, reducing seeding rates can mitigate intra-specific competition for limited resources, ensuring more robust early development [3].
While the theoretical benefits of VRS are well-documented for crops such as maize and wheat, empirical data on hybrid sorghum remains relatively scarce, particularly regarding early-stage development in Mediterranean environments [4]. Monitoring these early growth phases is vital, as initial plant establishment and vigour are strong predictors of final biomass and grain yield. In this context, remote sensing technology (specifically the use of Unmanned Aircraft Vehicles (UAVs)) offers a non-destructive and high-resolution means of assessing crop performance. Vegetation indices, such as the Normalised Difference Vegetation Index (NDVI) and Canopy Cover (Cveg), provide real-time insights into the physiological status and spatial distribution of the crop [5], allowing for corrective management before irreversible yield loss occurs.
Integrating soil ECa mapping with remote sensing allows for a comprehensive evaluation of how different seeding strategies influence the crop’s “biological response” to soil variability. However, there is a need to validate whether uniform, optimised, or maximised seeding rates based on ECa zones actually lead to significant improvements in vegetative vigour and productivity under field conditions [6].
This study addresses the need to validate whether ECa-based prescriptions truly improve early vigour. We hypothesize that VRS strategies based on ECa will enhance crop uniformity during the establishment phase and that UAV monitoring can detect subtle density-dependent responses that are often missed by final harvest metrics. By integrating ECa-based management zones with multi-temporal UAV monitoring and Growing–Degree Days (GDDs) analysis, the research aims to: (i) evaluate the impact of three distinct seeding strategies (“Uniformise”, “Optimise”, and “Maximise”) on plant establishment, vegetative vigour, and final biomass yield; (ii) assess the efficacy of automatic high-resolution remote sensing (NDVI and Canopy Cover) in corroborating the influence of seeding strategies and field location on crop performance; and (iii) determine the correlation between soil ECa and early growth metrics to establish guidelines for precision seeding in semi-arid environments. Through this approach, the study seeks to ascertain whether differentiated seeding rates translate into measurable gains in crop uniformity and productivity, providing a baseline for refining precision agriculture programmes in Mediterranean environments under semi-arid conditions.

2. Materials and Methods

2.1. Experiment Location

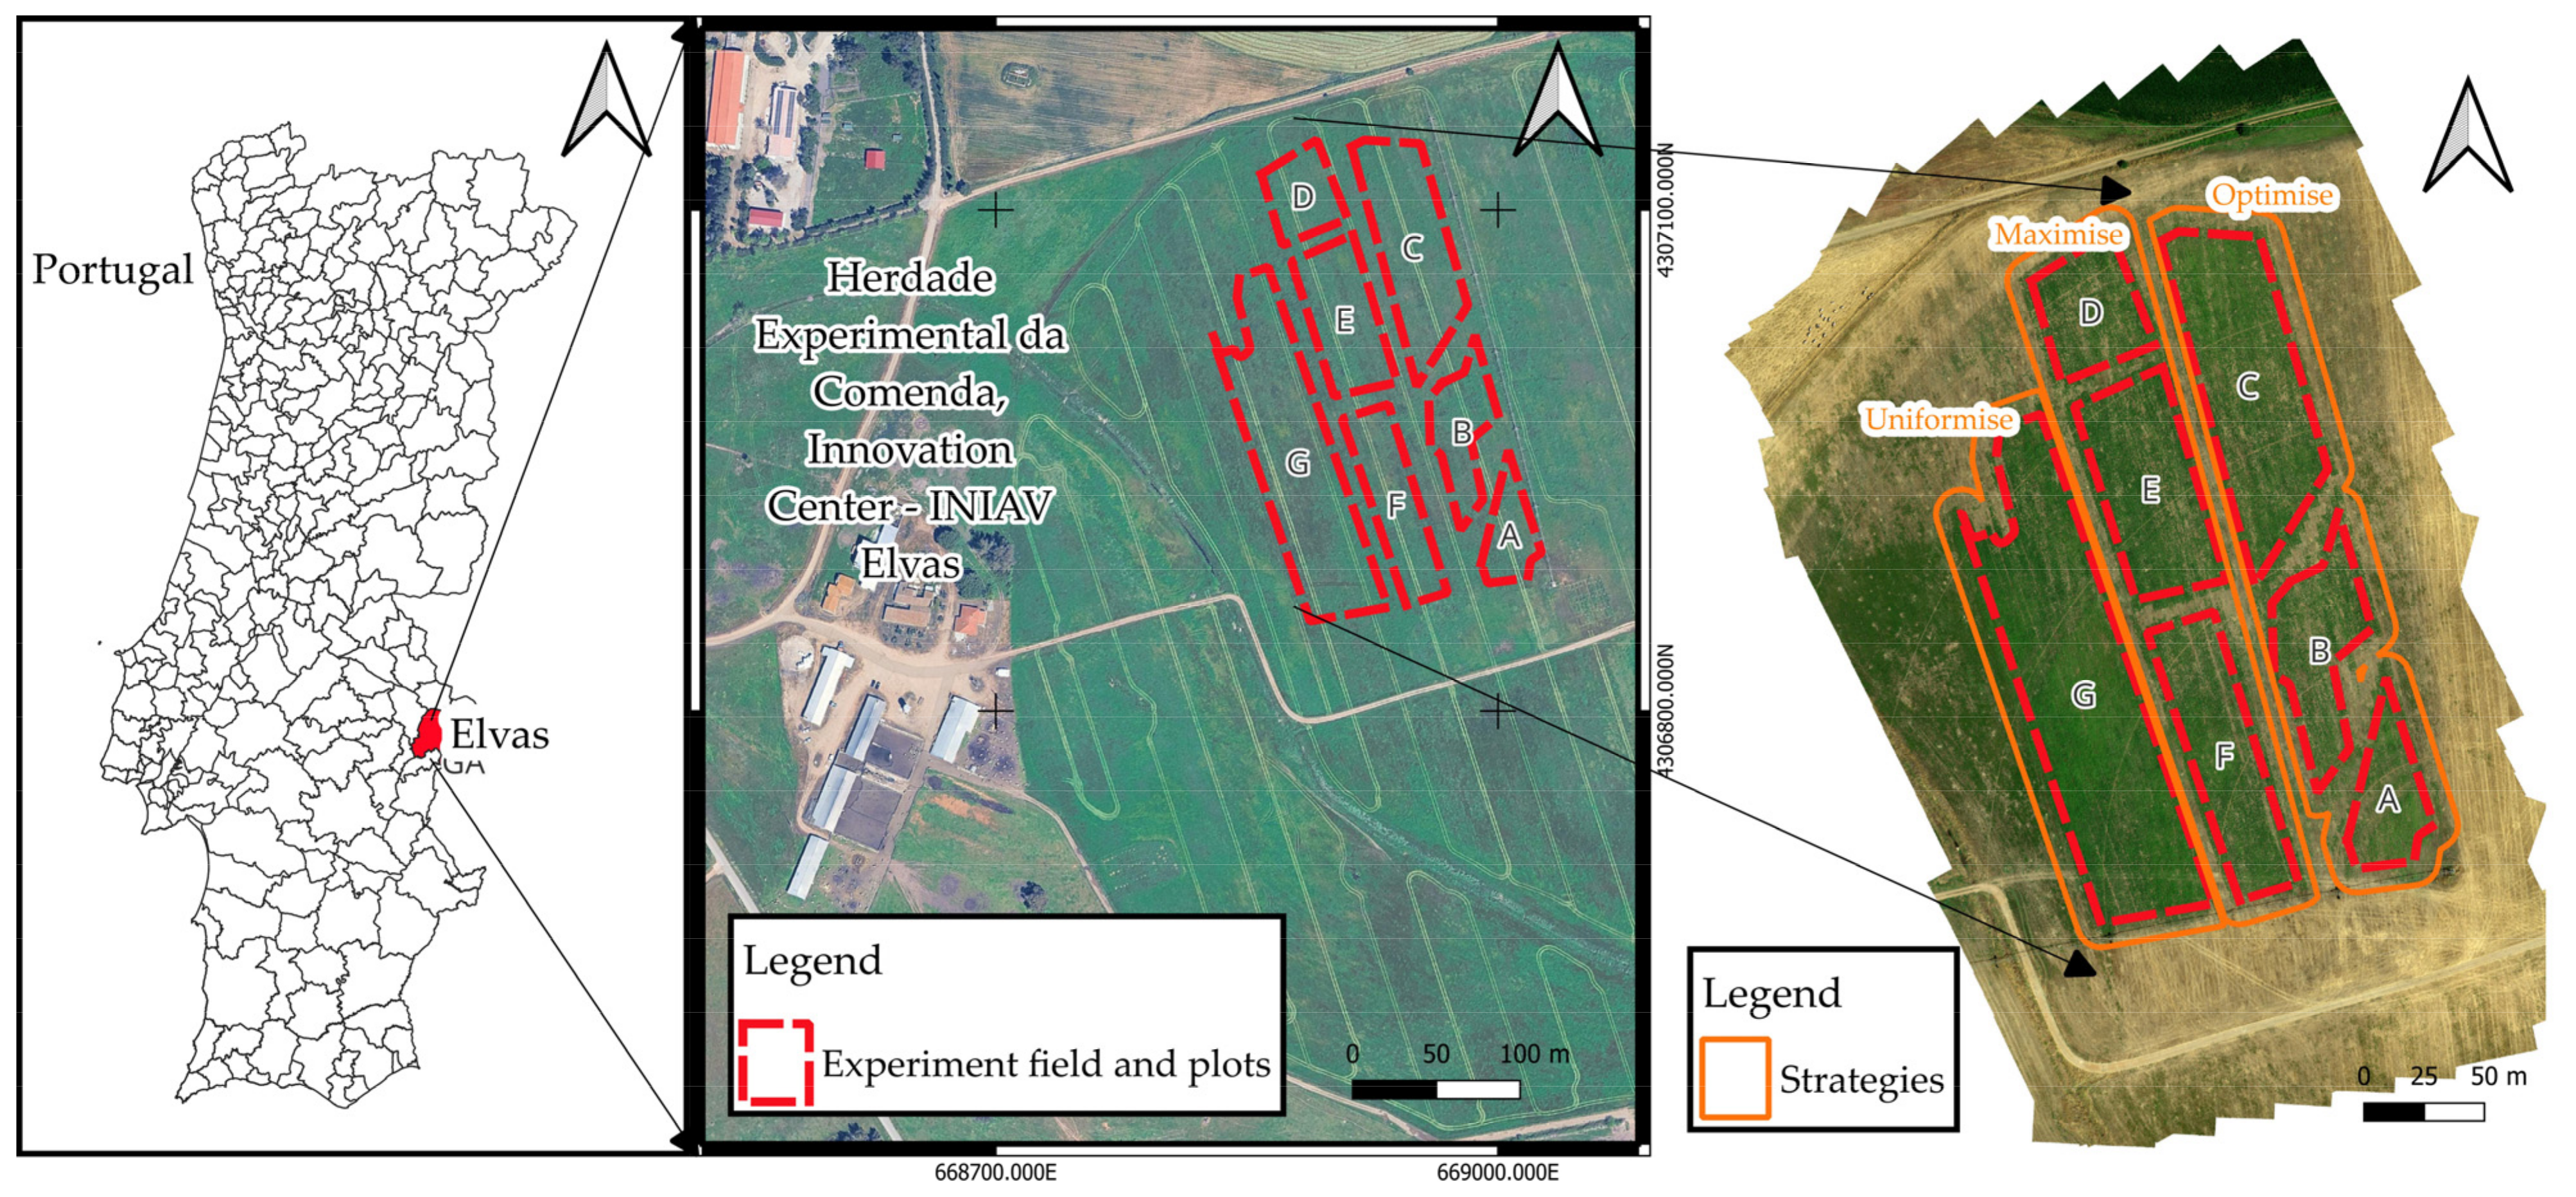
The study focused on the early development of hybrid sorghum (Sorghum bicolor L. × Sorghum sudanense) cv. Gardavan over a 33-day experimental period, commencing with sowing on 26 June 2025, to biomass sampling on 29 July 2025. As this study focused on the methodological validation of integrating soil ECa with high-resolution UAV monitoring, the high spatial density of data points provided by remote sensing offers a robust statistical basis for evaluating the crop’s immediate response to seeding strategies, even within a single season. The field experiment was conducted at the Herdade da Comenda, INIAV Elvas Innovation Centre, located in Caia, Portugal (38°53′38.52″ N; 7°3′19.01″ W). The experimental area at Herdade da Comenda has had a history of no-tillage farming since 2015, typically integrated into a rotation of winter small mixed forage crops (grasses and legumes) and summer forages (typically sudan grass). This historical management, combined with the ECa data, provided a stable baseline for the delineation of management strategies [7]. The experimental area was subdivided into seven distinct plots, designated A through G, as illustrated in the spatial layout and location map (Figure 1). The predominant soil at the experiment site, according to the FAO classification, is a Luvisol, which corresponds to Mediterranean soils Pag and Sr [8].
The soil ranges from a sandy loam texture with 15% clay to a loam texture with 21.5% clay. This gradient in clay content and bulk density (ranging from 1.3 to 1.4 g cm−3) directly influences soil water holding capacity and electrical conductivity, validating the delineation of management zones based on ECa (Table 1).
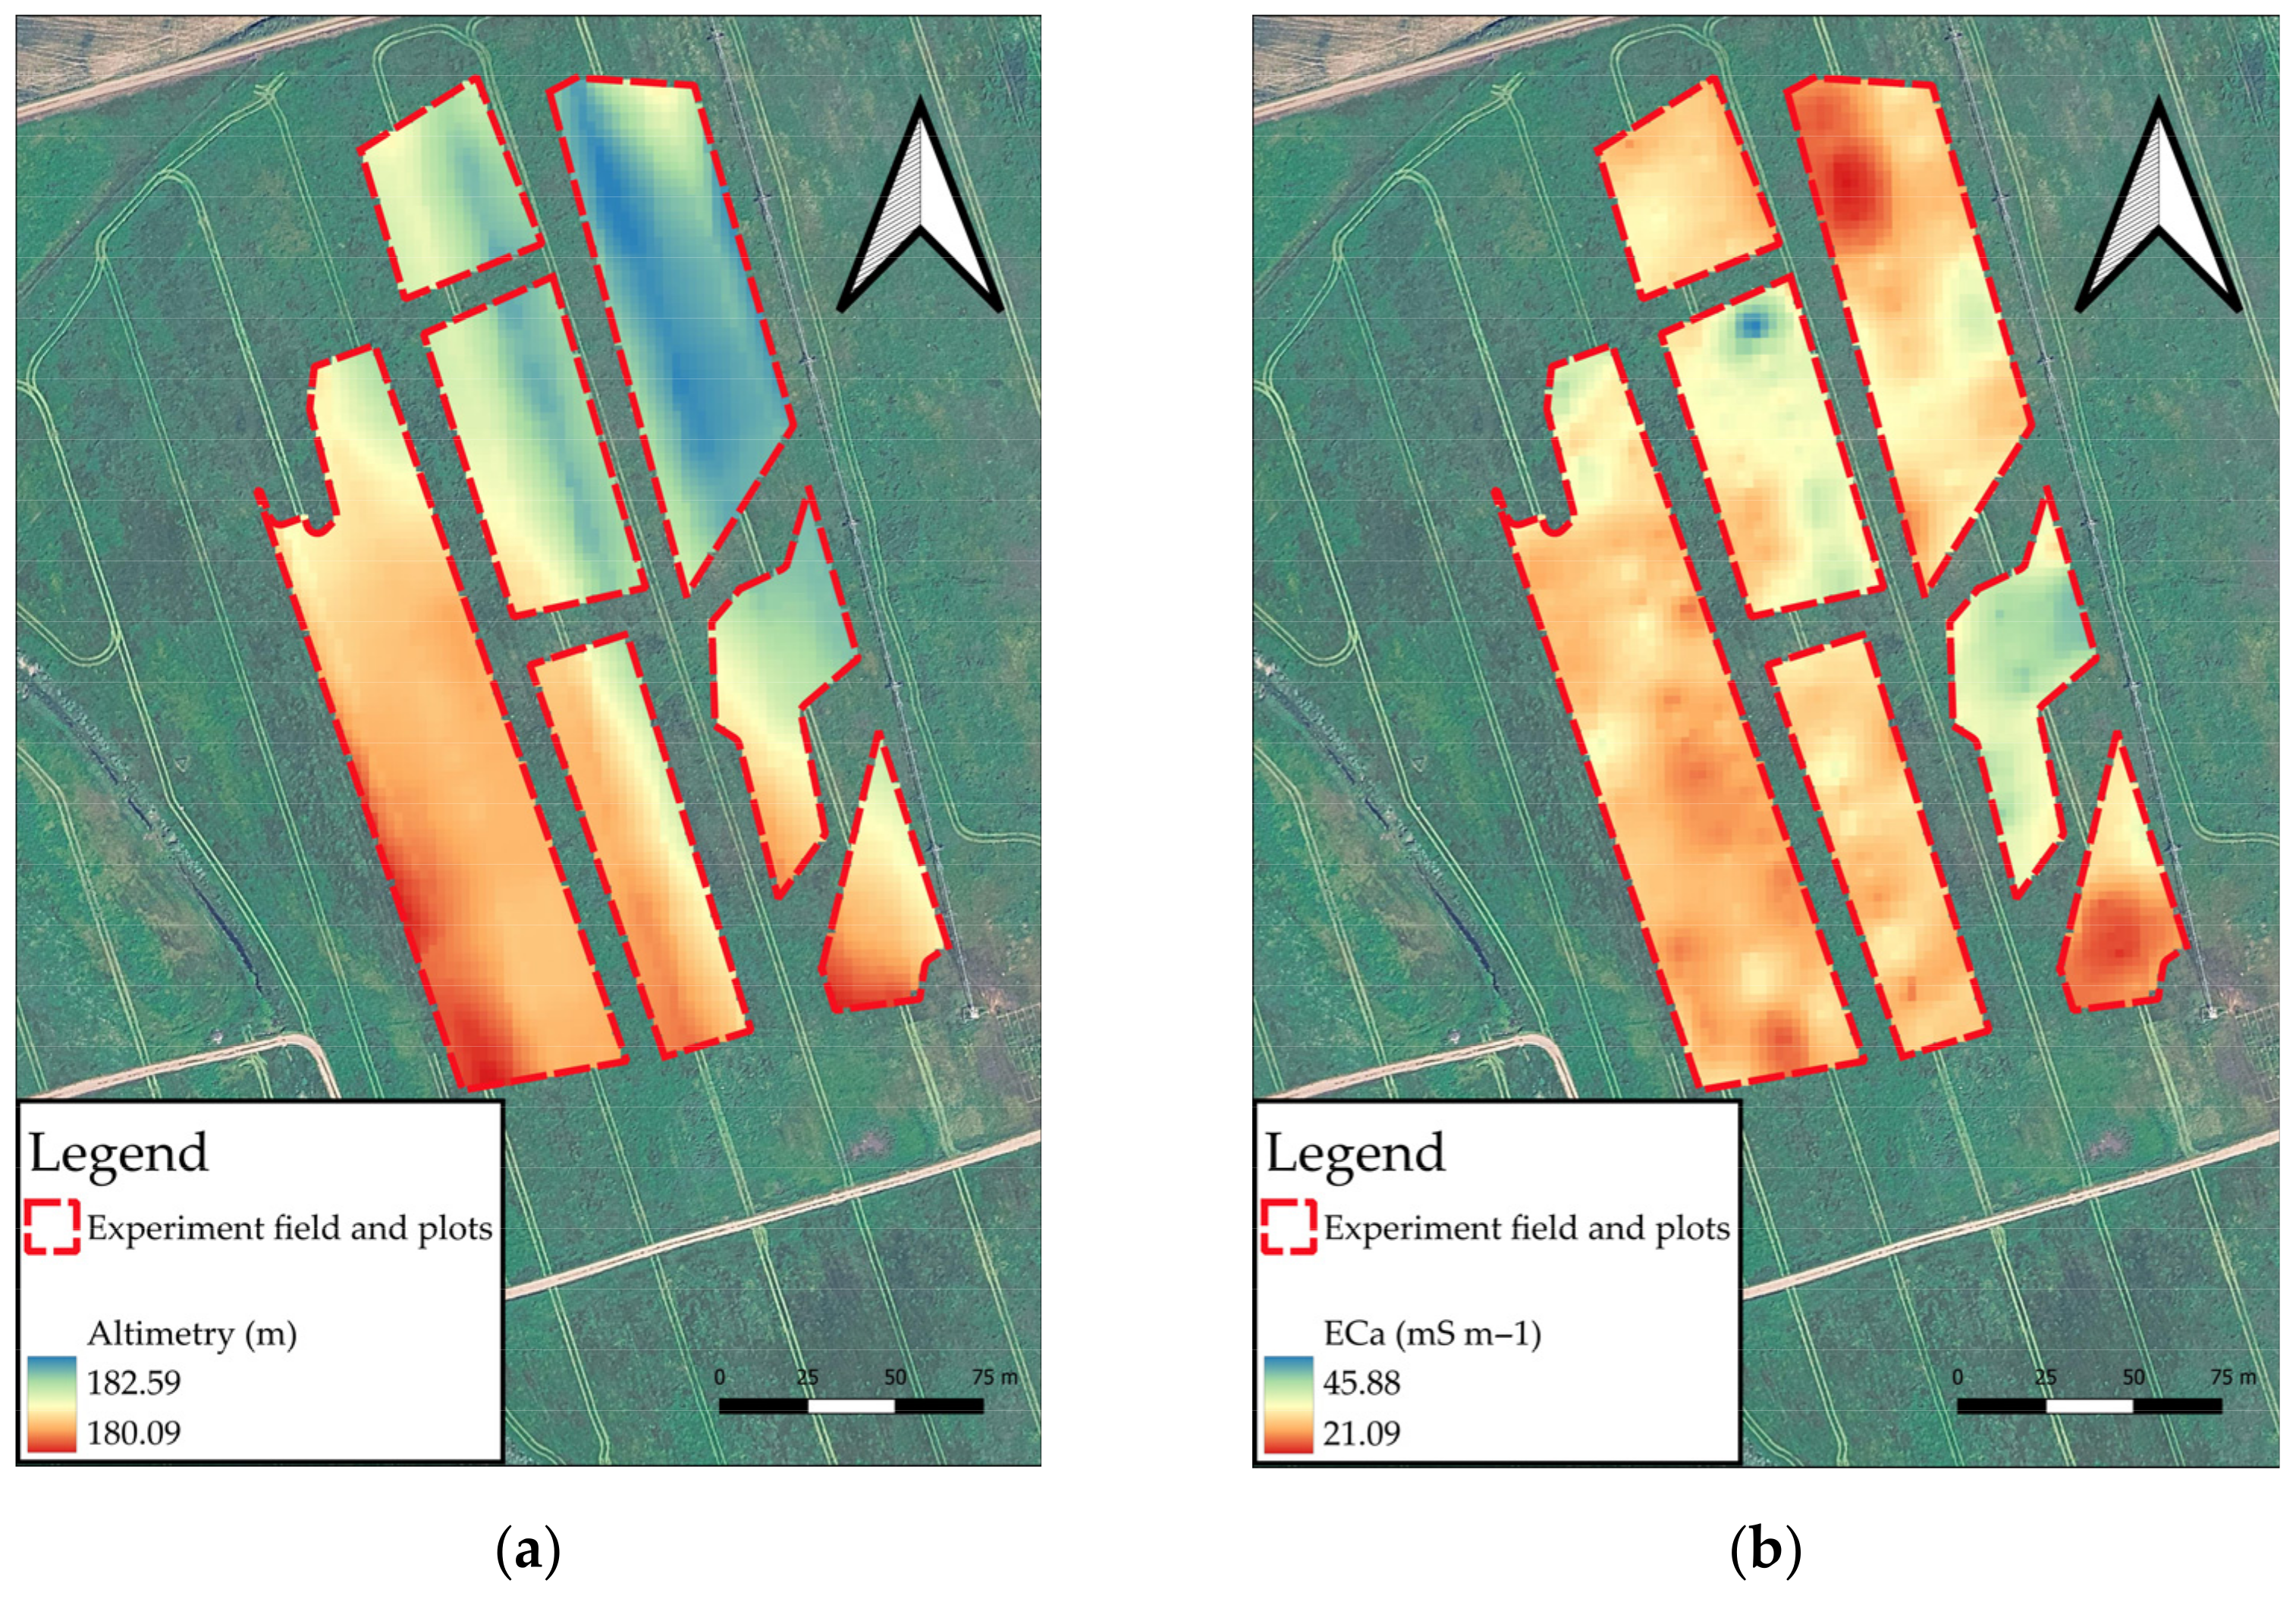
The experimental field is characterised by a nearly flat topography (Figure 2a) and spatial variations in soil ECa (Figure 2b), which provided the rationale for implementing VRS strategies. Altimetry within the experiment area ranges between 180.09 and 182.59 m, representing a maximum vertical variation of only 2.50 m. Similarly, soil ECa values ranged from 21.09 to 45.88 mS m−1 across the site, defining the spatial heterogeneity used to establish the differentiated seeding prescriptions. Soil ECa was mapped in a single survey prior to the trial, using the equipment and methodology detailed by Conceição et al. [7]. The ECa data was classified into two management zones (Low and High potential) using the Natural Breaks (Jenks) algorithm in QGIS. The thresholds were set at: Low (<33.48 mS/m) and High (>33.48 mS/m).
The spatial variability of soil ECa was used as the primary proxy for defining management strategies and prescribing differentiated seeding rates. As shown in Figure 2b, the ECa values across the experimental field ranged from 21.09 to 45.88 mS m−1. Based on this spatial heterogeneity, the plots were classified into “Low ECa” and “High ECa” zones to facilitate the implementation of three distinct seeding strategies:
  • Uniformise (Control): This strategy served as the experimental baseline. A constant seeding rate of 32.5 kg ha−1 (the intermediate dose) was applied throughout Plot G, regardless of internal soil variability, providing a reference for standard field management.
  • Optimise: Applied in Plots A, B, and C, this approach focused on compensating for lower soil potential. Higher seeding rates (40.0 kg ha−1) were allocated to “Low ECa” zones, while the rate was reduced (25.0 kg ha−1) in “High ECa” areas to prevent excessive competition in higher-potential zones.
  • Maximise: Implemented in Plots D, E, and F, this strategy followed an intensive logic by “pushing” the crop where soil conditions were most favourable. Consequently, the maximum seeding rate (40.0 kg ha−1) was applied in “High ECa” zones, and the minimum rate (25.0 kg ha−1) was used in “Low ECa” zones.
This methodological framework, summarised in Table 1, allowed for a systematic comparison of how different density prescriptions interact with soil potential to influence the early development and final biomass of the sorghum crop. To systematically evaluate the performance of the three seeding strategies—”Uniformise”, “Optimise”, and “Maximise”—each plot was assigned specific operational parameters according to the management strategies. A detailed summary of these independent variables, including the individual plot areas, prescribed seeding doses (kg ha−1), and their corresponding soil ECa classifications, is presented in Table 2. This experimental design ensured that each strategy was tested across different soil conditions to assess its impact on crop development. In accordance with the supplier’s guidelines, which recommend a seeding rate between 25 and 40 kg ha−1, the seed drill was calibrated to three distinct levels: 25 kg ha−1 (minimum rate), 32.5 kg ha−1 (intermediate rate), and 40 kg ha−1 (maximum rate).
Sowing was performed using a no–till seed drill (Diretta 300, Maschio Gaspardo, Campodarsego, Italy) featuring 19 rows spaced at 17.5 cm. The equipment was towed at an average speed of 7 km h−1 by a 72 kW (98 hp) four–wheel drive tractor (TL100, New Holland, Turin, Italy). Operational precision was maintained by a Global Navigation Satellite System (GNSS) guidance system (Ti5, Hexagon AB, Stockholm, Sweden). This setup allowed for the accurate implementation of the variable seeding rates across the management strategies defined for the trial area. The seeding rates were implemented using a static variable rate approach. Before sowing, the seed drill’s volumetric metering device was independently calibrated for each of the seeding doses (Table 1). Each experimental plot was sown individually after adjusting the metering roller to the pre-calibrated setting. This procedure ensured that the target seed dose was uniformly applied across the entire area of each specific experimental plot, eliminating longitudinal transition errors typically associated with automated dynamic systems.

2.2. Meteorological Data and Crop Development

Local meteorological data were obtained from the INIAV weather station. Daily precipitation (mm) and air temperature (°C) were recorded to determine the environmental conditions during the trial. To assess the cumulative heat units required for crop development, GDD (°C) were calculated using a base temperature (Tb) of 15 °C, as established for sorghum cultivation in the region [9].
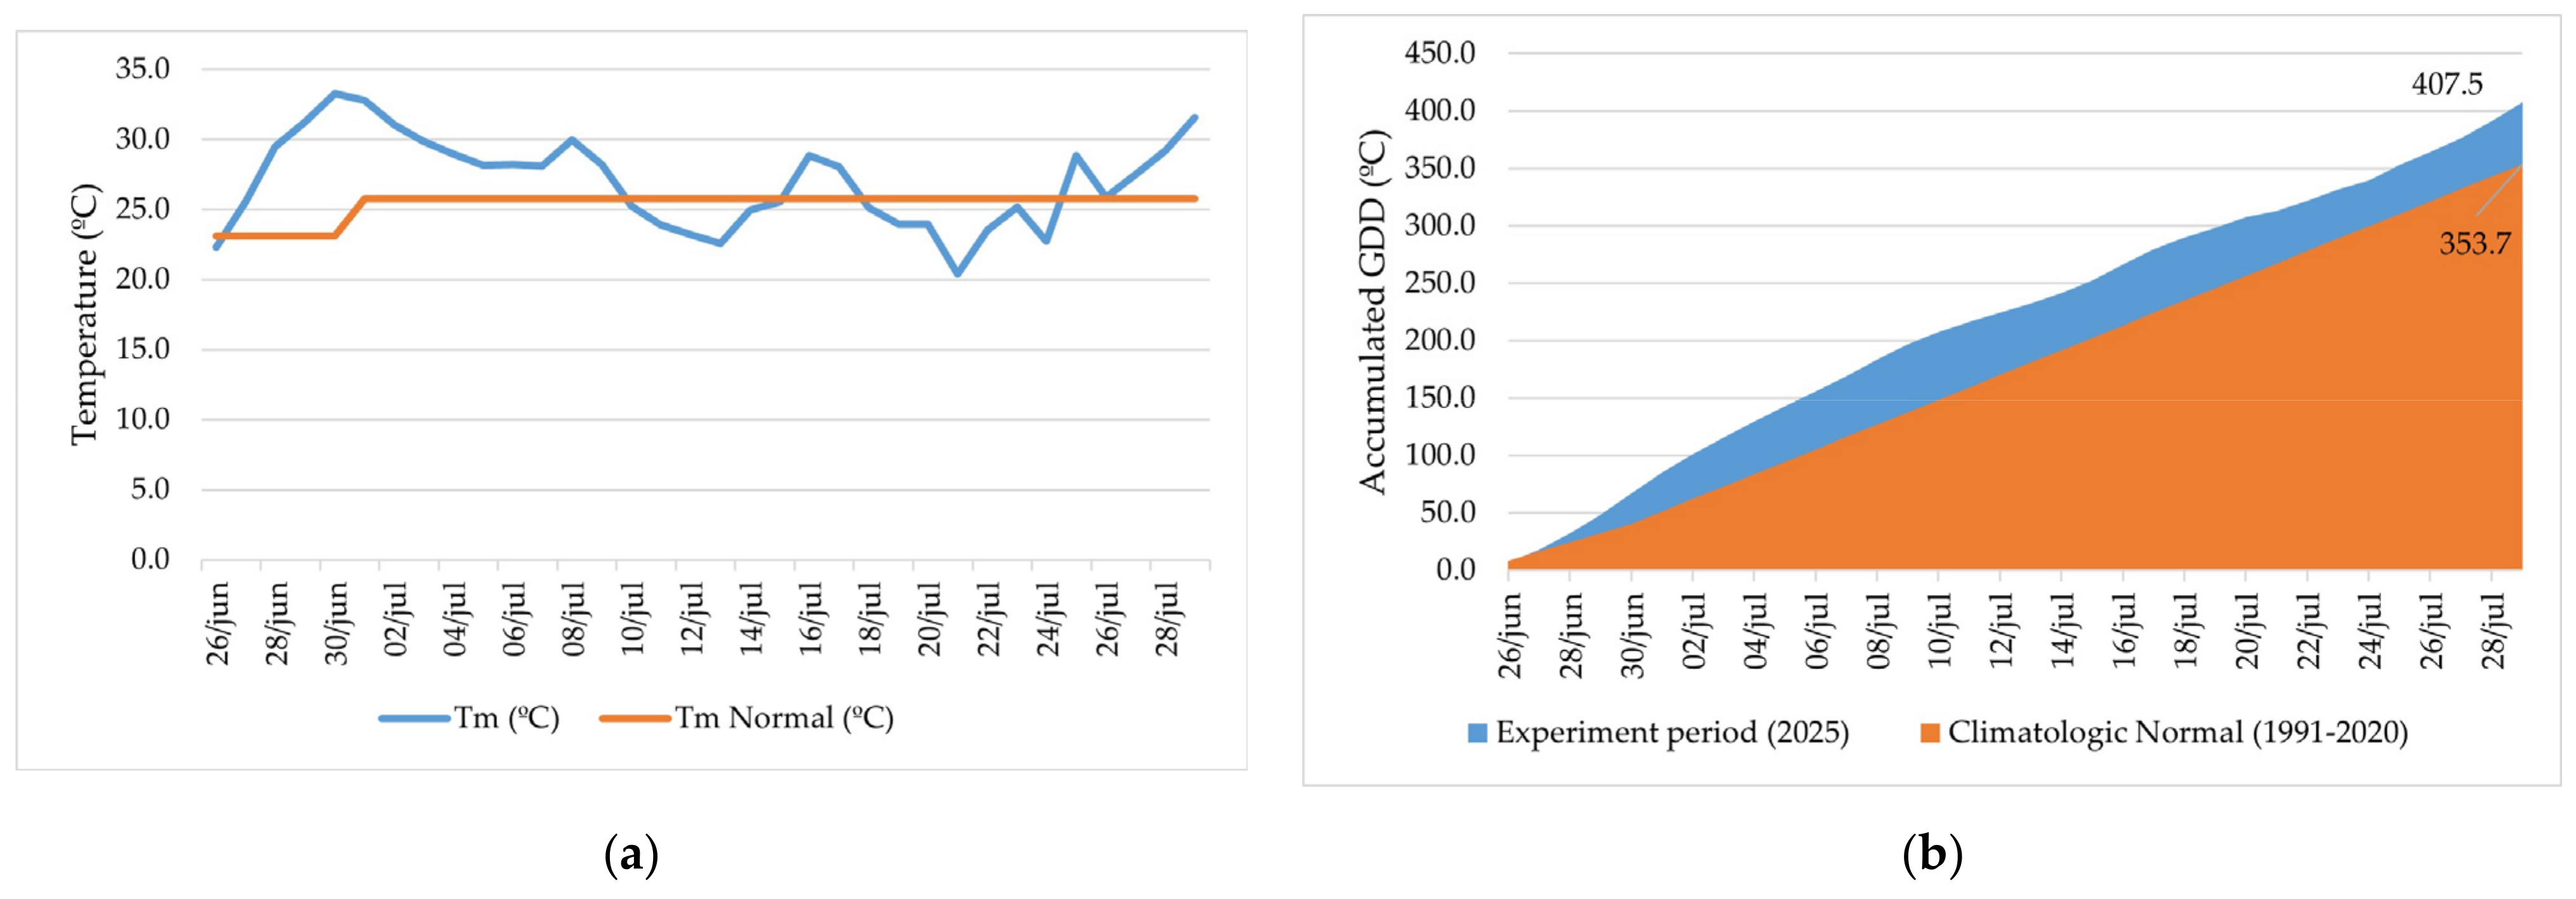
The meteorological conditions during the 33-day trial period were characterised by significant thermal instability, as illustrated in Figure 3a. Although the daily average temperatures (Tm) were initially much higher than the 1991–2020 climatologic normal, the subsequent period was marked by notable fluctuations, with Tm frequently oscillating above and below the historical average. Despite these intermittent periods of lower temperatures, the initial heat surplus was dominant enough to drive a high cumulative thermal accumulation. As shown in Figure 3b, the total accumulation reached 407.5 GDD (calculated with a Tb of 15 °C), which represents a surplus of 53.8 °C compared to the 353.7 GDD expected for a typical year. Consequently, even with the observed thermal variability, the crop’s development was accelerated by approximately five days relative to the climatologic normal.
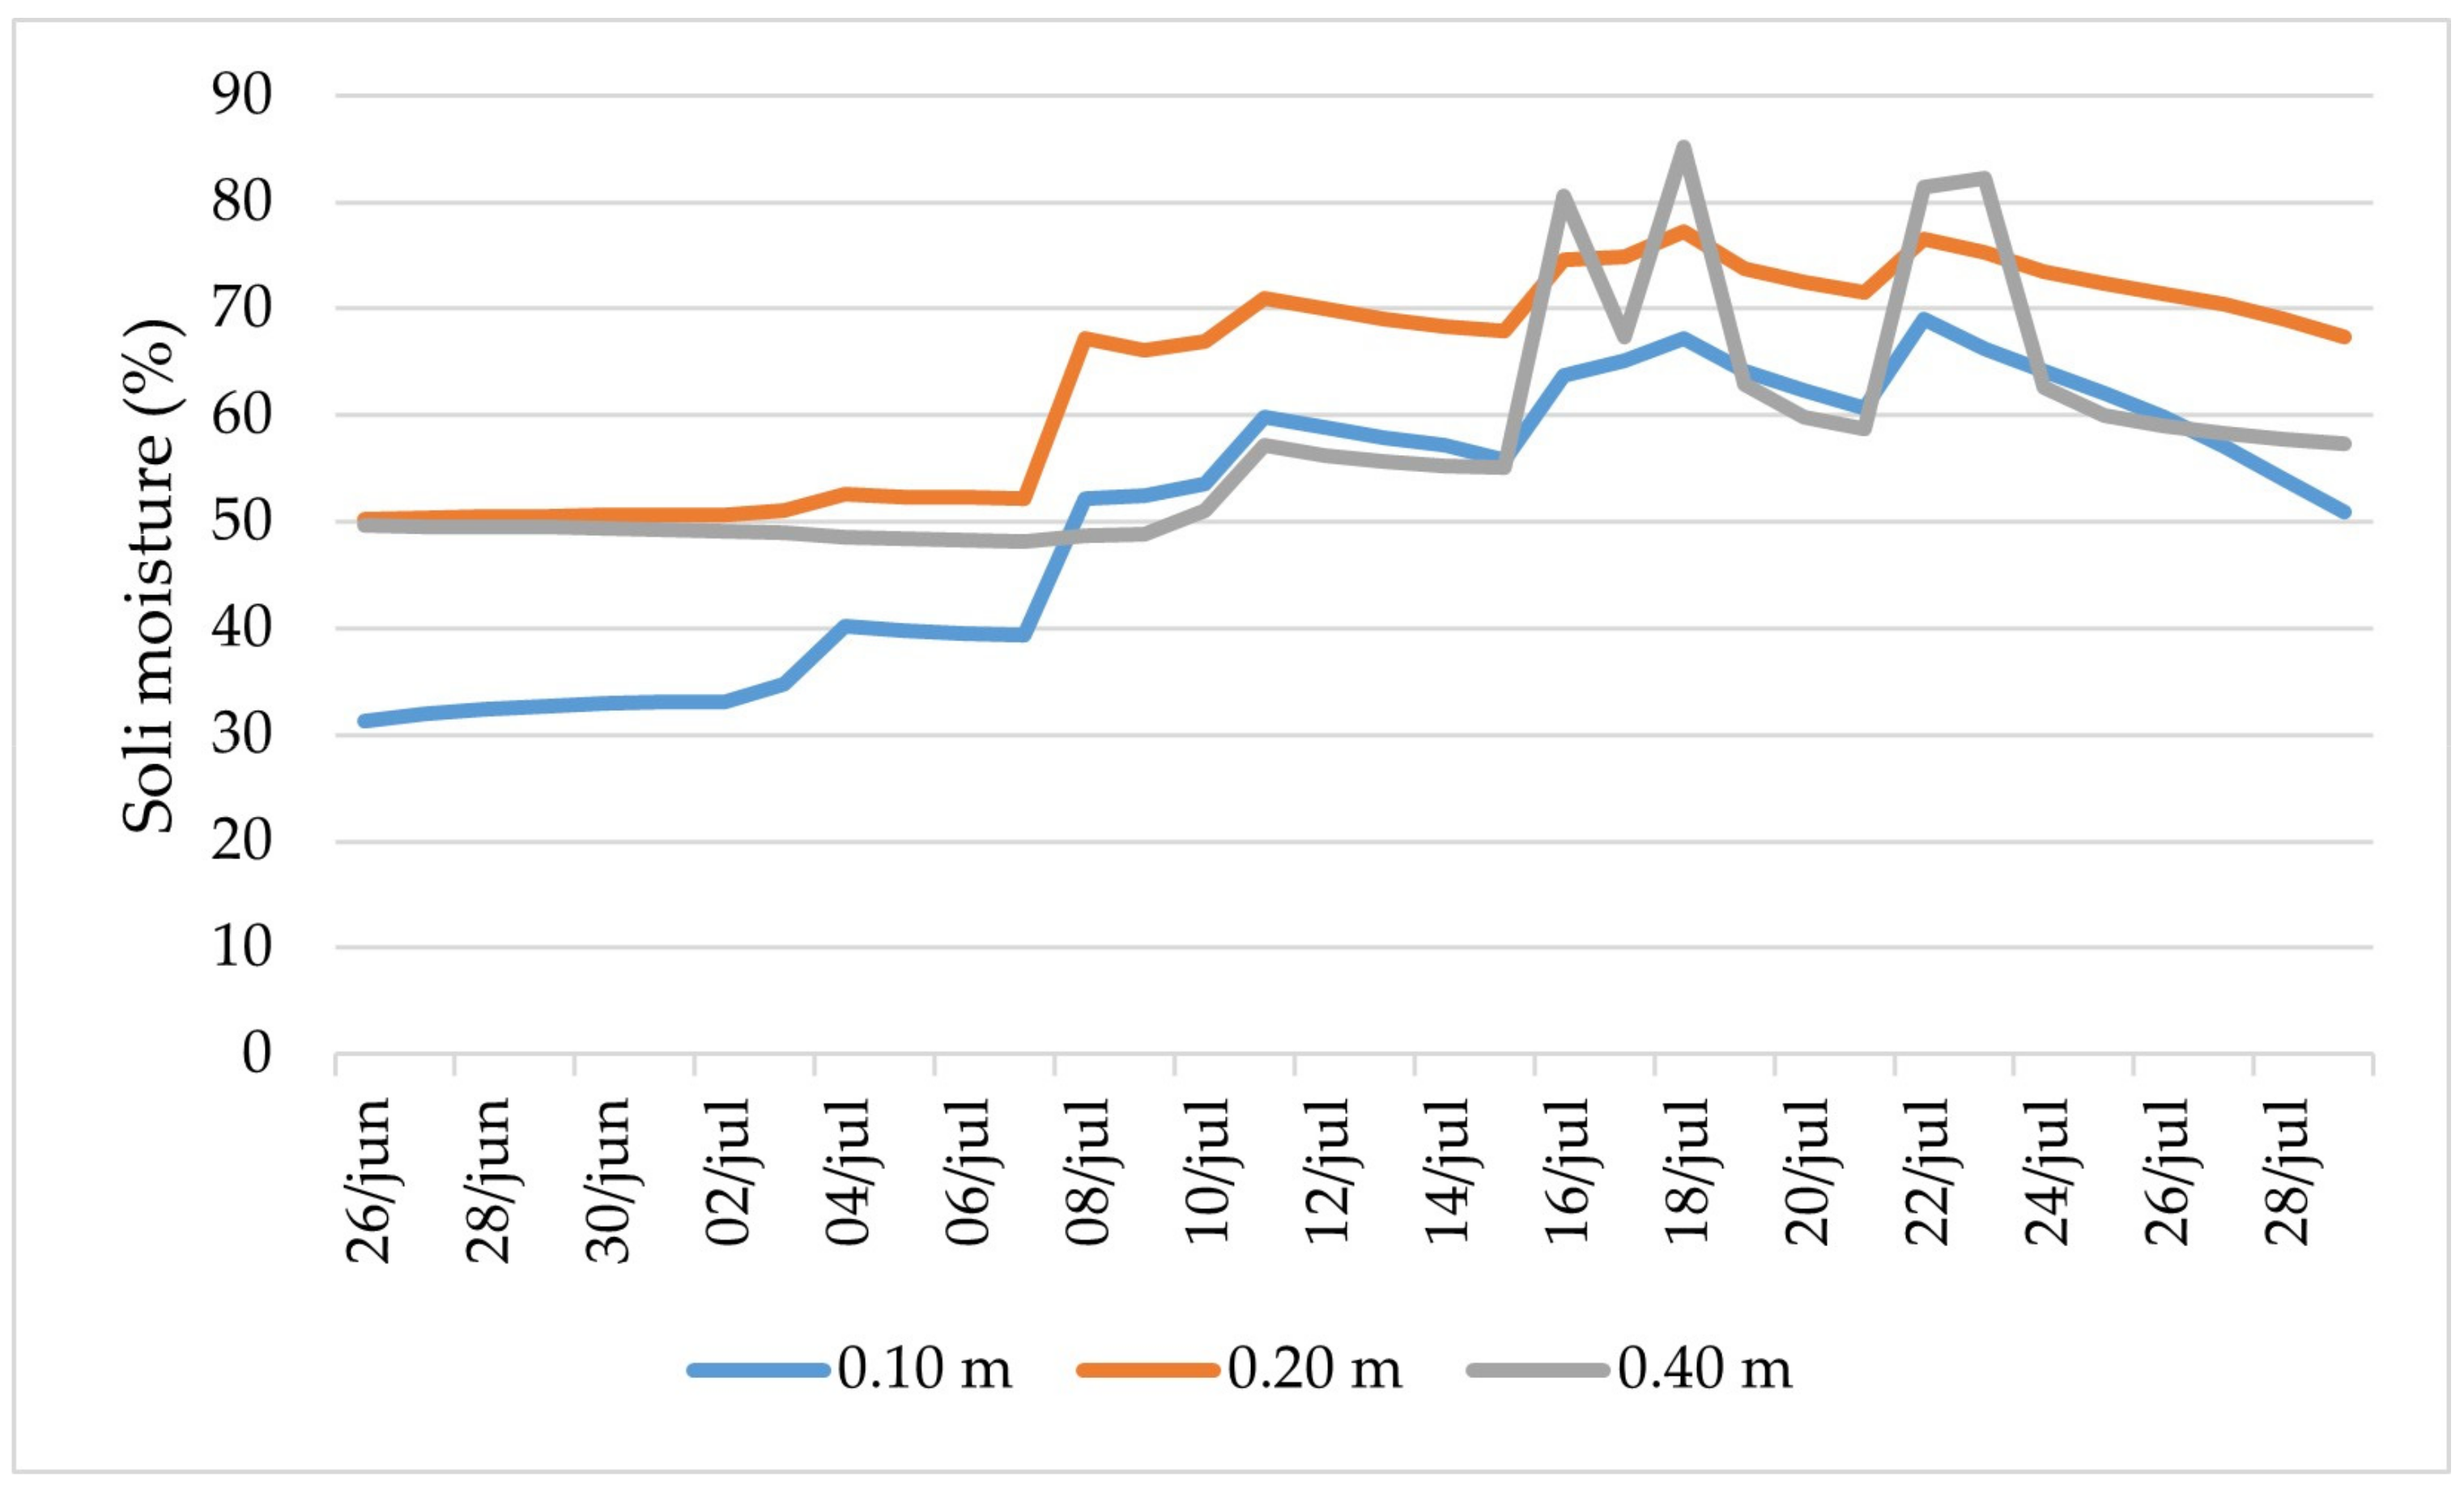
Irrigation measurement and monitoring were performed using a soil moisture and temperature profile probe and with the aid of uSENS software 2015 [10]. During the test, this probe provided information on the relative soil moisture content at depths 0.10, 0.20 and 0.40 m. Irrigation was performed with the aim of maintaining the soil at field capacity.
Soil water content was monitored throughout the trial to assess the moisture availability across the soil profile, as illustrated in Figure 4.
The data reveals a consistent stratification of Volumetric Water Content (VWC), with higher moisture levels maintained at deeper layers (40 cm), whereas the surface layers (10–20 cm) exhibited greater fluctuations. These variations in the upper profile correspond to the periods of highest evaporative demand and crop water uptake during the early vegetative stages.
The experimental timeline and the sequence of agricultural operations performed during the study are summarised in Table 3. The harvest date for the crop was set when the crop reached the “knee” stage. The trial was concluded at 33 days because, for forage sorghum, this represents the operational maturity for grazing (safety threshold regarding cyanogenic toxicity). In this production system, the “final yield” is effectively the biomass available at this stage. Obtaining grain yield data was beyond the scope of this study, as the crop was managed and terminated for grazing purposes.
Regarding crop management, a total systemic herbicide (glyphosate, 360 g L−1) was applied as a pre-seeding treatment (3 L ha−1) to ensure a weed-free environment for crop establishment. No chemical inputs or herbicides were applied postemergence. Furthermore, no mineral fertilization (basal or top-dressing) was performed during the trial. The crop relied on the residual nitrogen and soil nutrient bank resulting from a consistent history of grass–legume crop mixtures cultivated in the plot since 2015, ensuring a uniform nutrient baseline across all management strategies.

2.3. Crop Monitoring and Data Collection

Crop monitoring was conducted through three distinct UAV missions performed on 14 July (Moment I), 23 July (Moment II), and 29 July 2025 (Moment III). These dates were strategically selected to align with key phenological stages: Moment I corresponded to crop emergence, Moment II to the onset of tillering, and Moment III to the beginning of stem elongation (jointing). The intervals (9 and 6 days) were adjusted to account for the high thermal accumulation (GDD) during the July period, ensuring the capture of the most dynamic phase of canopy establishment before the targeted harvest at day 33. The surveys utilised a DJI Phantom 4 RTK UAV equipped with a multispectral camera (SZ DJI Technology Co., Shenzhen, China). This sensor integrates six individual bands: a standard RGB composite, three panchromatic bands—blue (B), green (G), and red (R)—and two multispectral bands—red-edge (RE) and near-infrared (NIR). Each 2 MP sensor features a global shutter and is mounted on a 3-axis stabilised gimbal, ensuring high-quality spectral data acquisition across different ranges of the light spectrum. DJI P4 Multispectral utilizes an integrated sunshine sensor for real-time irradiance compensation, which automatically converts digital numbers to reflectance values. All UAV missions were conducted between 11:00 AM and 1:00 PM local time to ensure maximum solar elevation and minimize the impact of shadows on the multispectral data. This timing, combined with the integrated sunshine sensor, ensured optimal and consistent irradiance conditions across all monitoring dates.
Flight missions were designed using the DJI Ground Station Pro v. 2.0 application on an iPad 13, with a set altitude of 60 m above ground level, resulting in a ground sampling distance and spatial resolution of 3.2 cm pixel−1. A 9 m2 grid was implemented to facilitate high-resolution data extraction from orthomosaics generated by a Phantom 4 Multispectral RTK UAV. By integrating Pix4Dfields and QGIS software v.3.28, this grid served as the basis for the accurate estimation of the NDVI and Cveg, ensuring a standardised and granular assessment of crop vigour throughout the study period.
No additional radiometric or geometric calibrations were performed during image acquisition. However, internal measurement consistency was ensured by using the same multispectral sensor for all spectral bands. According to the manufacturer, the aircraft is equipped with an integrated sunshine sensor that provides real-time irradiance calibration, automatically adjusting for variations in light intensity and atmospheric conditions between flights. This methodological approach ensured spectral coherence across the different monitoring dates, allowing for valid multi-temporal comparisons. By minimising external variability, radiometric consistency was maintained throughout the study, ensuring the reliability of the reflectance values used for spectral analysis without requiring further post-processing.
Image processing was executed using Pix4Dfields v. 2.7.2 software [11] to generate high-resolution orthomosaics. These outputs were subsequently integrated into the open-source software QGIS v. 3.28 [12], where the NDVI and Cveg were estimated within the predefined sampling grid.
A specialised automated Python v.3.9 workflow was developed within QGIS to streamline the calculation of Cveg. The script processed the initial orthomosaic by extracting the necessary spectral bands to calculate the Excess Green Index (ExG), defined as 2G-R-B. Subsequently, an automatic Otsu thresholding method was applied to the ExG imagery. This non-supervised approach is particularly efficient for rapid screening and binary classification in homogenous agricultural scenes, allowing for the creation of a binary mask where vegetation is distinguished from soil and shadows [13,14]. The script then automatically calculated the vegetation percentage for each grid cell, exporting the results to a CSV format and generating a shapefile of the 9 m2 grid populated with Cveg values.
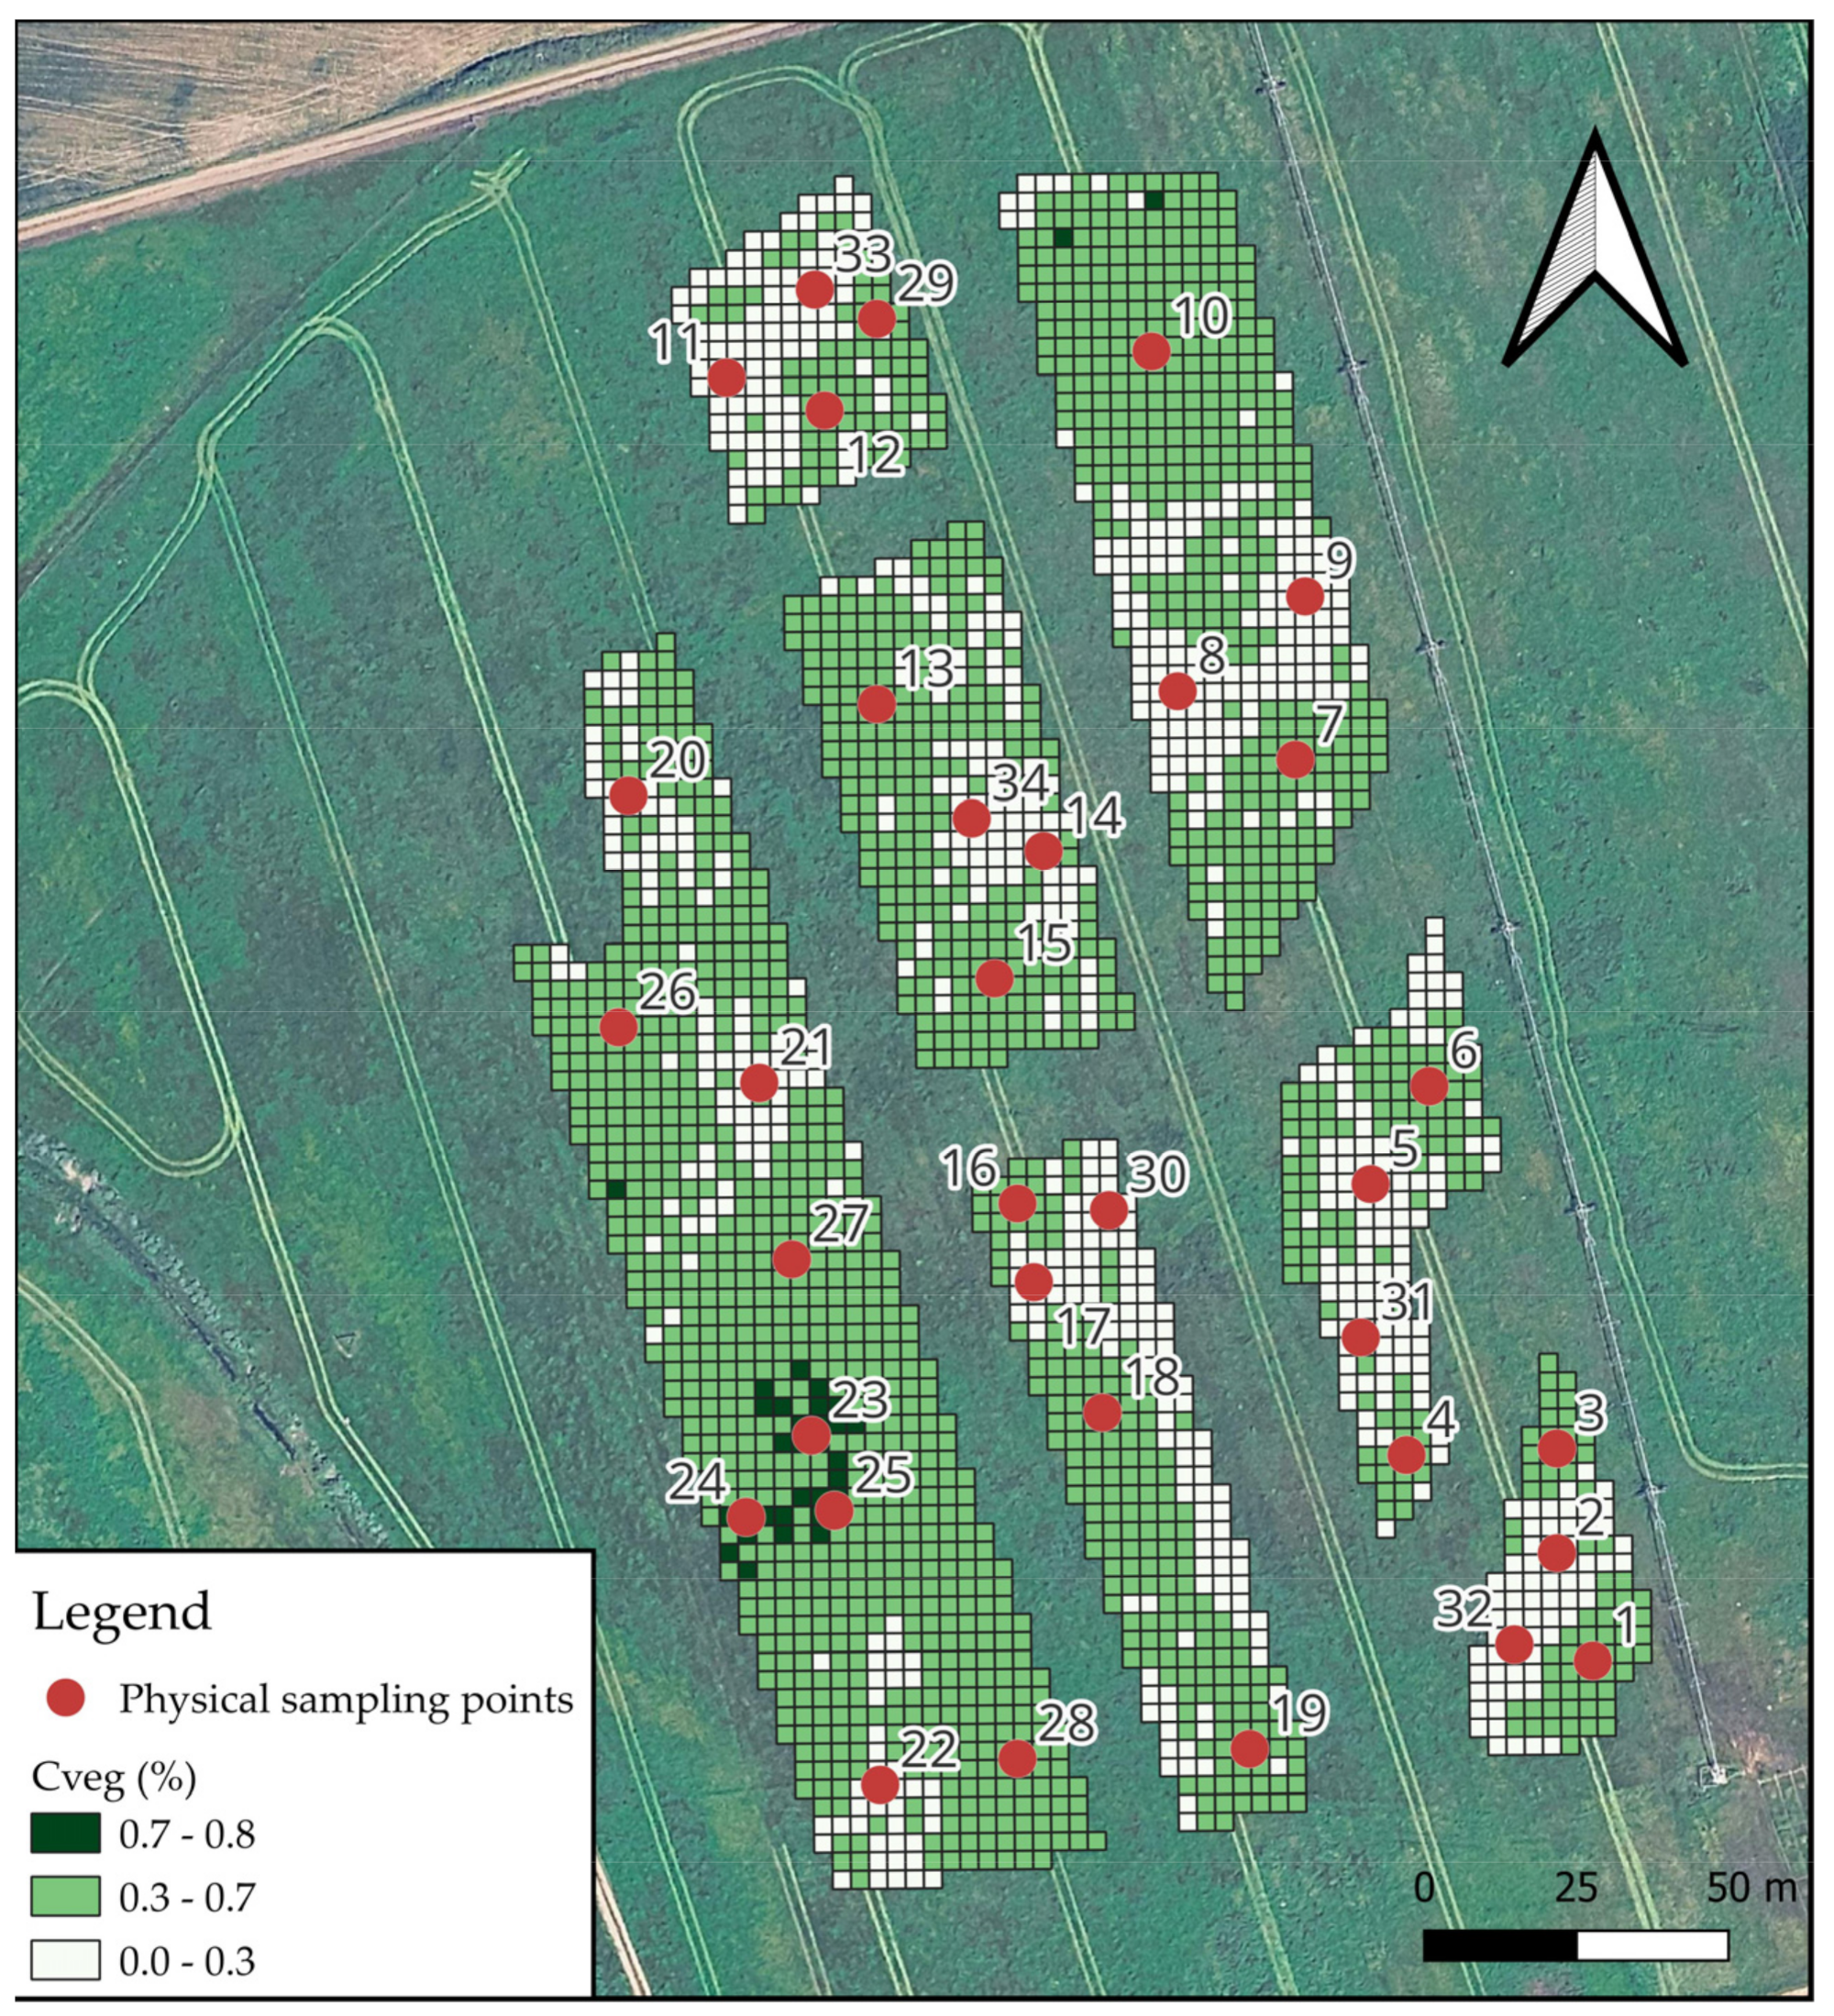
Ground-truthing and physical biomass collection were directed by the spatial distribution of Cveg at Moment III. Using QGIS, the field was stratified into homogeneous zones, and a stratified random sampling approach was employed to generate 33 sampling points. As illustrated in Figure 5, a minimum of two points per homogeneous zone was established for each experimental area to ensure representative data. The 33 sampling points were strategically distributed to capture the maximum field heterogeneity. The total area was divided into 7 experimental plots, and within each plot, the Cveg index (Moment III) was used to delineate three cover strata (Low, Medium, and High). By establishing a minimum of two points per stratum within each plot, we maintained a high degree of spatial representativeness. This stratified approach allowed for a more precise estimation of biomass by accounting for the specific soil ECa and physical variability mapped prior to the trial, thereby mitigating the limitations typically associated with lower sample sizes in large-scale on-farm research.
At each point, a 0.5 × 0.5 m metallic quadrat (0.25 m2) was used to record key agronomic parameters. The number of plants (NP) was determined by direct counting of all individuals within the quadrat. Plant height (PH) was measured from the soil surface to the highest leaf ligule using a graduated ruler. All vegetative material above the cutting height within the quadrat was harvested to estimate the fresh weight. These samples were then conditioned in a forced-air oven at 60 °C until a constant dry mass was attained (approximately 24–48 h) for PDM determination. All primary measurements were subsequently extrapolated to a per-hectare equivalent to facilitate a comparative analysis of yield across the different seeding strategies.

2.4. Statistical Analysis

Statistical and inferential analyses were performed to evaluate the sampling point dataset, including the calculation of the coefficient of variation, standard deviation, and interquartile range. These procedures were executed in RStudio© v.2023.4.3.2 using the R© psych package v.2.4.3 from the CRAN Repository [15,16]. Data were categorised according to Plot, Seeding Dose, Strategy, ECa, and dependent variables, namely: NP, PH, PFM, PDM, Cveg and NDVI.
The Shapiro–Wilk test was applied to each dependent variable to assess normality. Variables exhibiting a non-normal distribution were analysed using the Kruskal–Wallis test, while those with a normal distribution were subjected to Analysis of Variance (ANOVA).
Post hoc analyses following the Kruskal–Wallis test were conducted using Dunn’s test in RStudio© v.2023.4.3.2 with the R© dunn.test package v.1.3.6 [15,17]. For post hoc analyses following ANOVA, Tukey’s Honestly Significant Difference test was employed. Finally, a correlation matrix was constructed to identify significant relationships between the dependent variables.

3. Results

3.1. Statistical and Inferential Analysis

A preliminary descriptive analysis was conducted to characterise the dataset, with the results summarised in Table 4. This table provides a comprehensive overview of the dependent variables—NP, PH, PFM, PDM, Cveg and NDVI—including their respective means, standard deviations (SD), and coefficients of variation (CV).
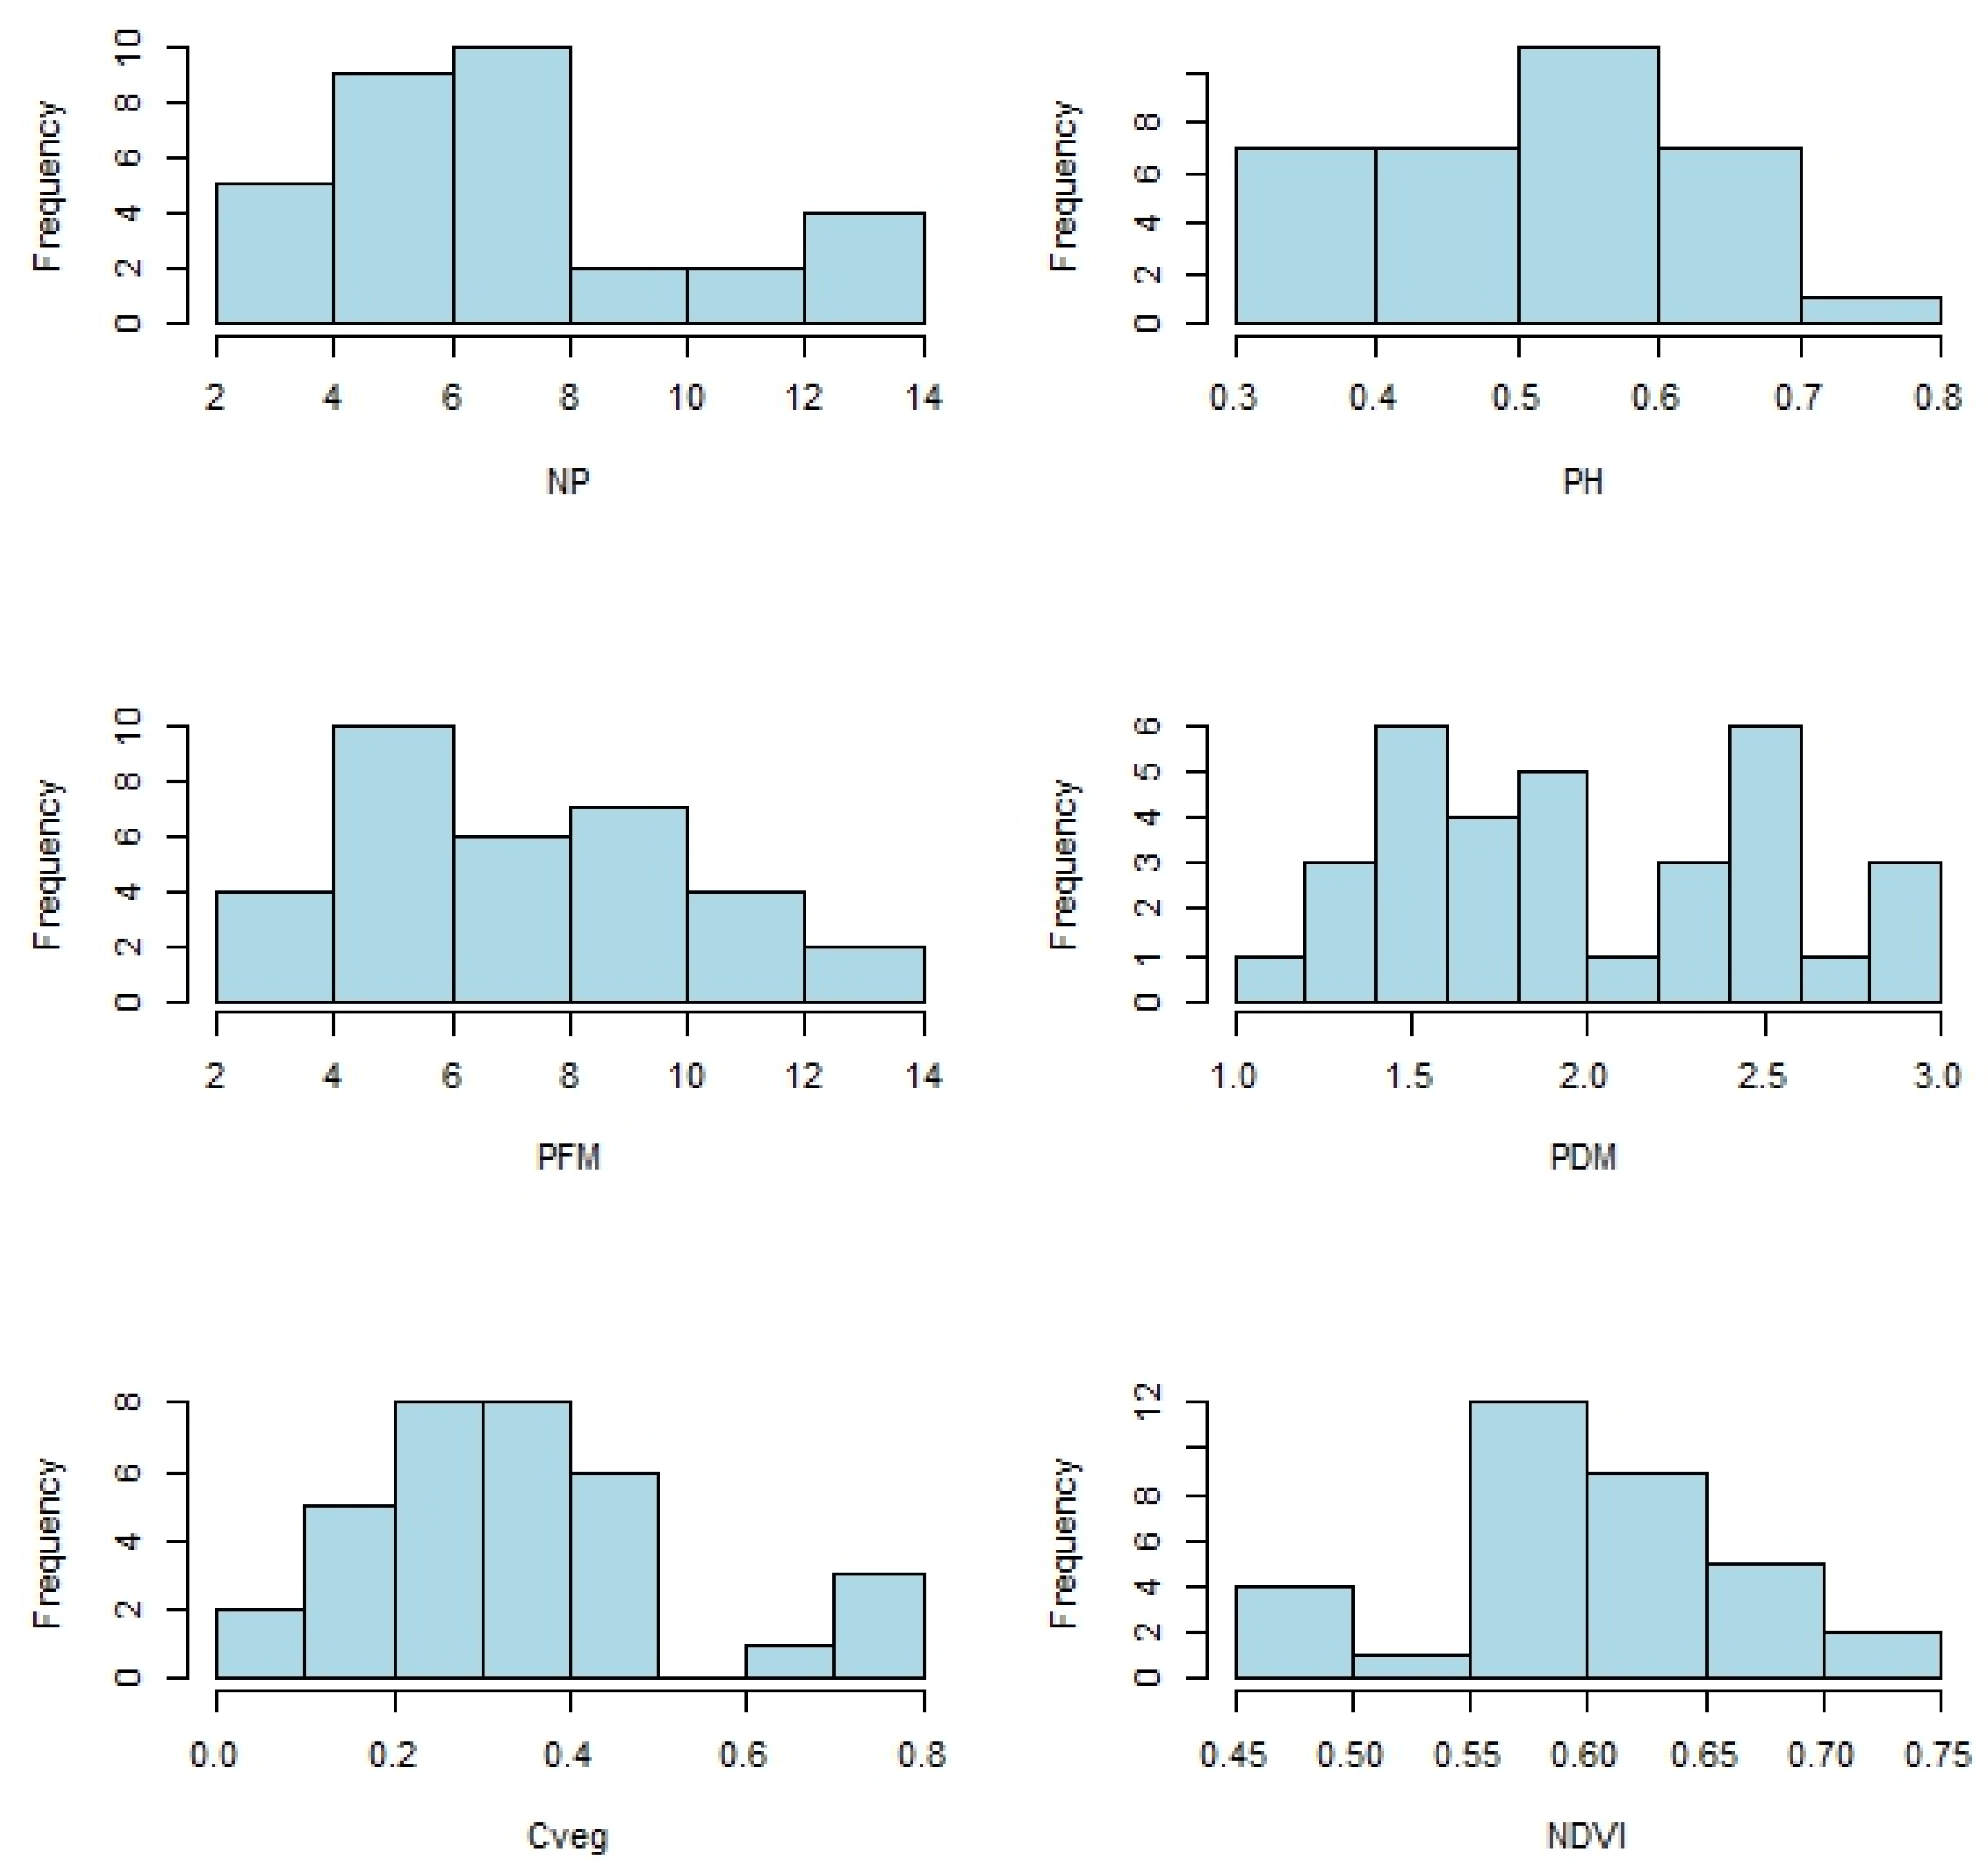
Furthermore, the Shapiro–Wilk test results presented in Table 3 were used to determine the distribution of each variable. While the NP did not follow a normal distribution, all other studied variables exhibited a normal distribution. Following these results, the Kruskal–Wallis test was applied for NP and ANOVA for the remaining parameters. The descriptive metrics show the spatial variability of the trial across the seeding strategies and soil ECa zones. To further examine the internal structure of the dataset and identify potential trends or biases, the frequency distribution of each dependent variable was visualised through a series of histograms (Figure 6).
These graphical representations complement the Shapiro–Wilk findings regarding data dispersion and the range of values observed for plant metrics (NP, PH, PFM, and PDM) and remote sensing indices (Cveg and NDVI) across the experimental area. This visual assessment shows the variability in crop establishment and vigour.
Due to its non-normal distribution, the NP was analysed using the Kruskal–Wallis test to identify significant differences across the experimental factors. The results of this non-parametric analysis, including the Chi-squared statistics and associated p-values, are presented in Table 5. This analysis evaluates the relationship between soil ECa and seeding strategies with plant establishment.
For the remaining dependent variables—PH, PFM, PDM, NDVI, and Cveg—which exhibited a normal distribution, an Analysis of Variance (ANOVA) was performed. The results, including the F-statistics and significance levels for the factors “Strategy”, “Plot”, “ECa”, and “Seeding Rate”, are detailed in Table 6. This analysis reports the variance associated with the experimental treatments and soil ECa regarding the physiological development and biomass accumulation of the sorghum crop.
A statistically significant difference was observed for the NP variable between the ECa groups (A and B). Since the Kruskal–Wallis test identified significant variations, multiple comparisons were performed using Dunn’s test to further delineate these differences.
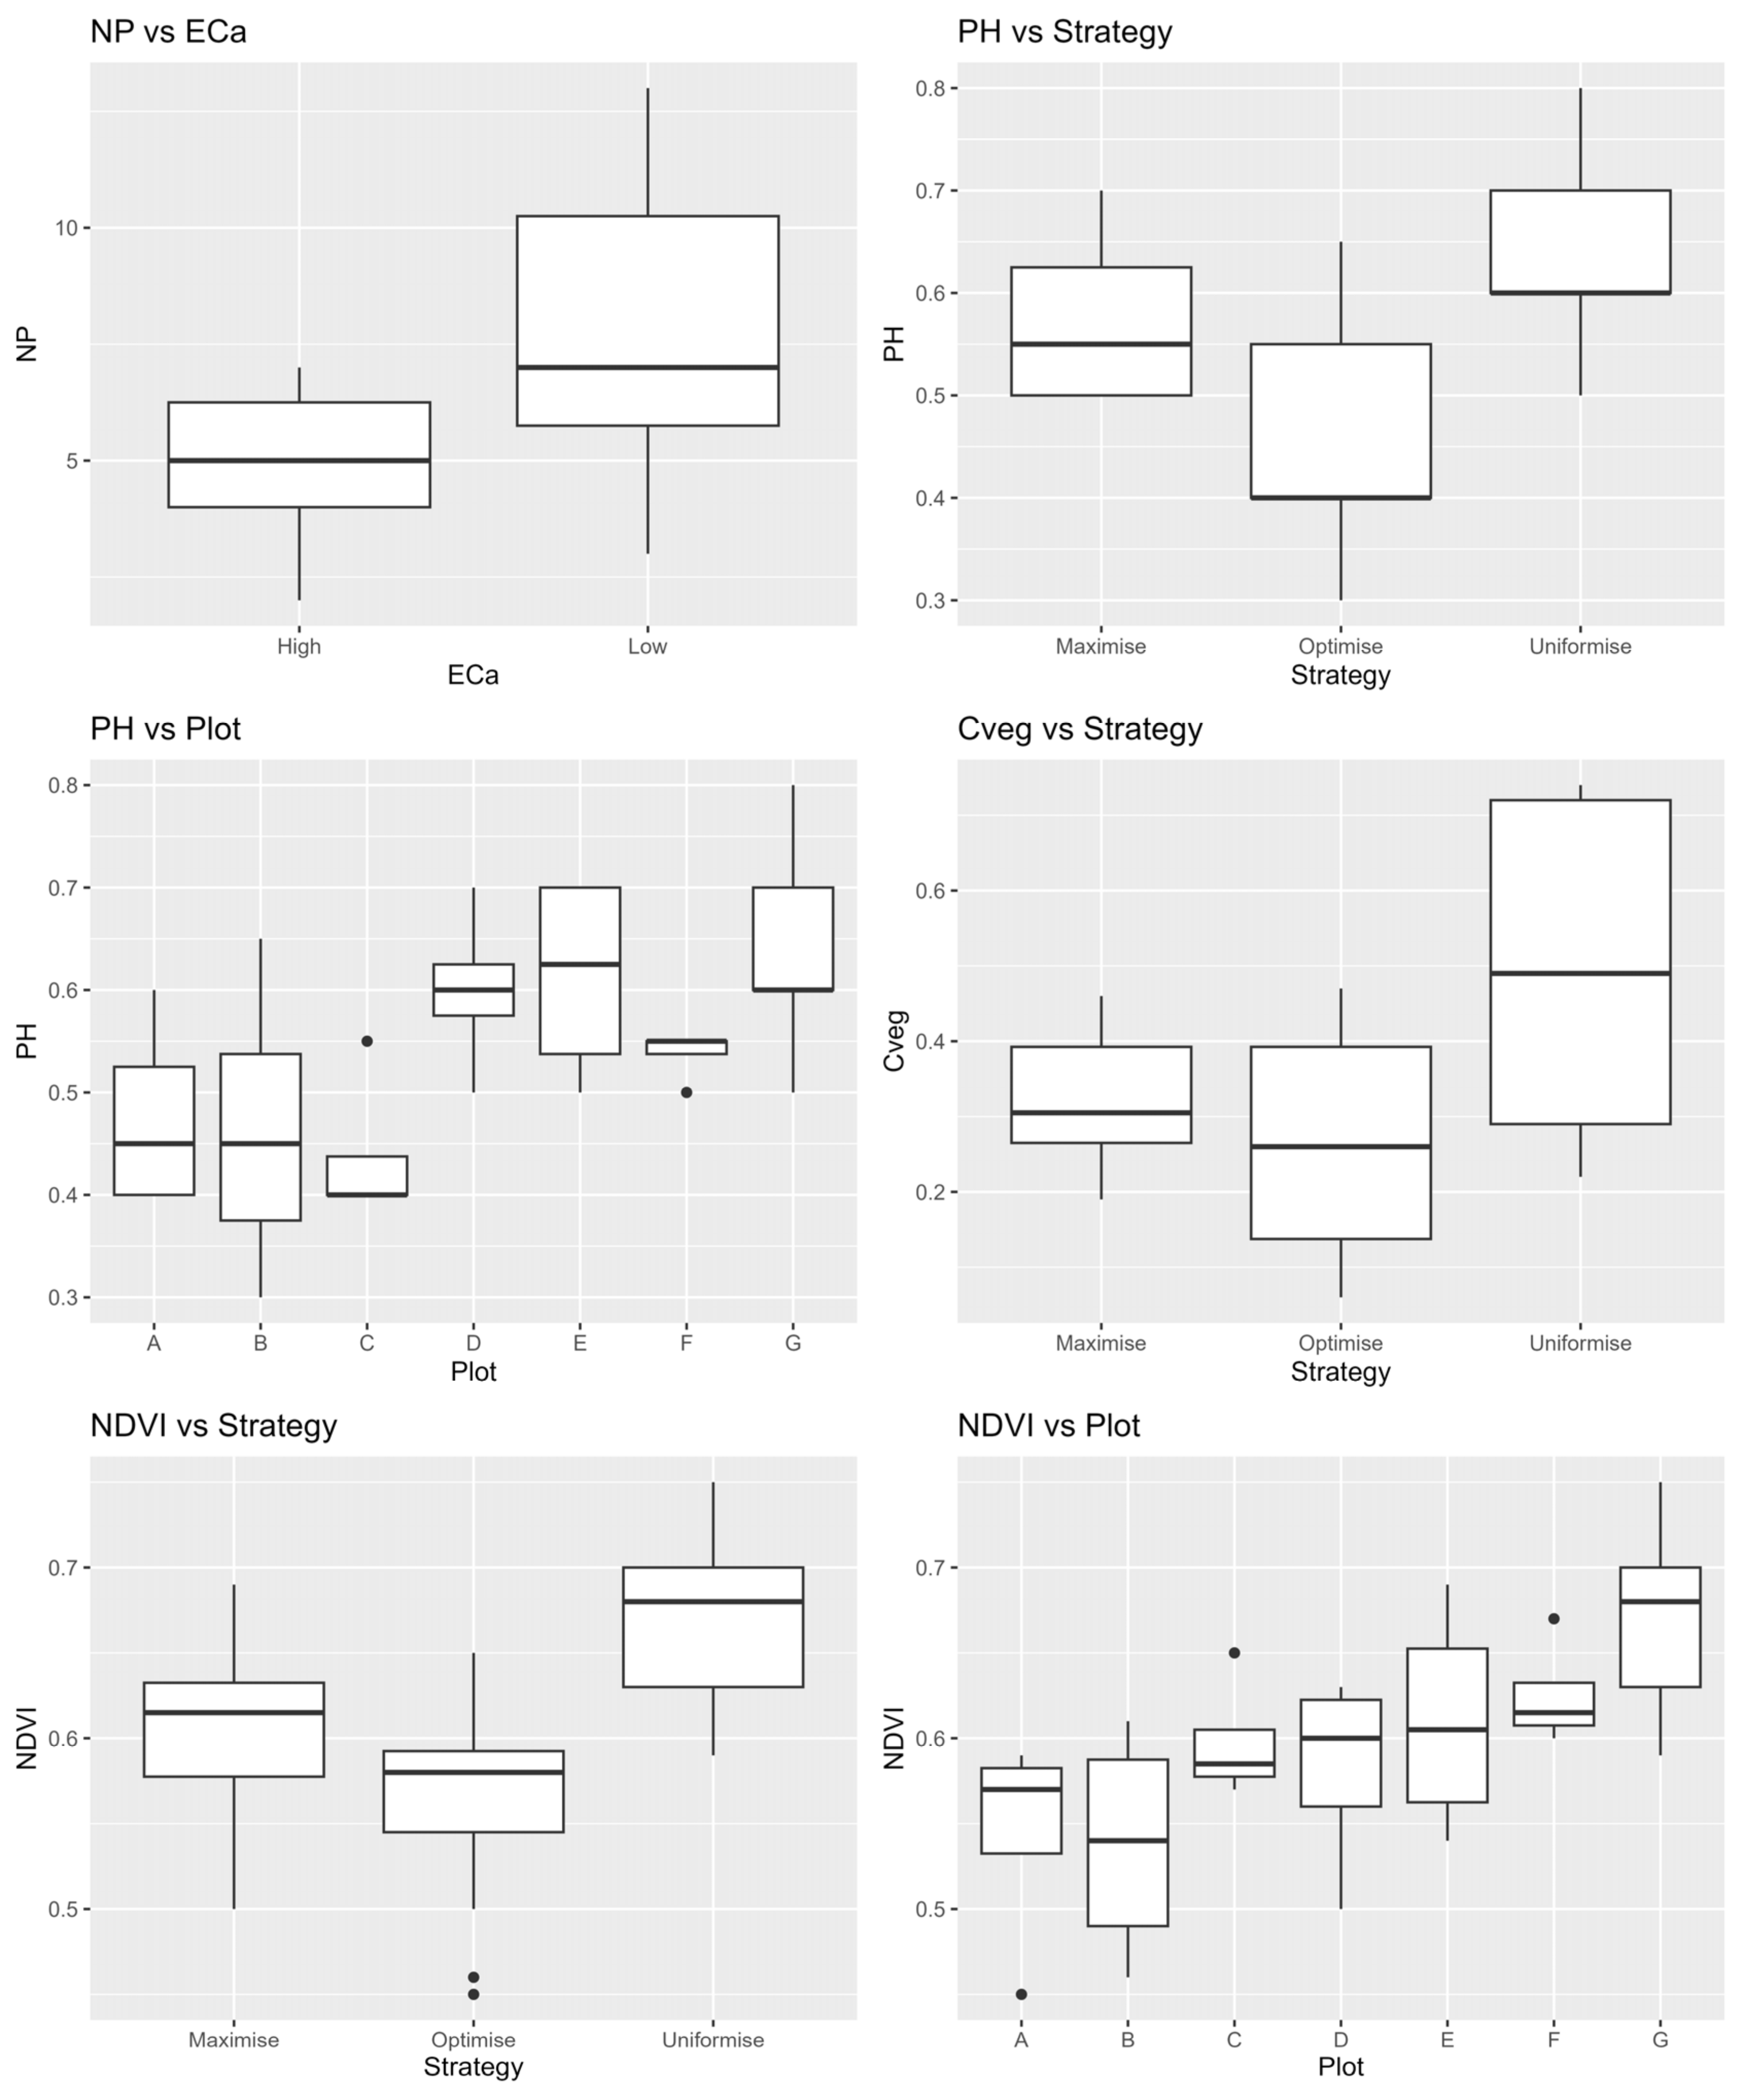
Regarding the variables with a normal distribution that showed significant responses to the factors under study, the Tukey HSD test results are presented in Table 7. These analyses report the differences related to “Strategy” and “Plot” on PH and NDVI, as well as the effect of “Strategy” on Cveg. These post hoc comparisons identify specific seeding strategies or field locations that diverged in terms of crop vigour and early development.
Figure 7 shows boxplots that allow us to visualize the differences between the dependent variables and the groups analysed in this study.
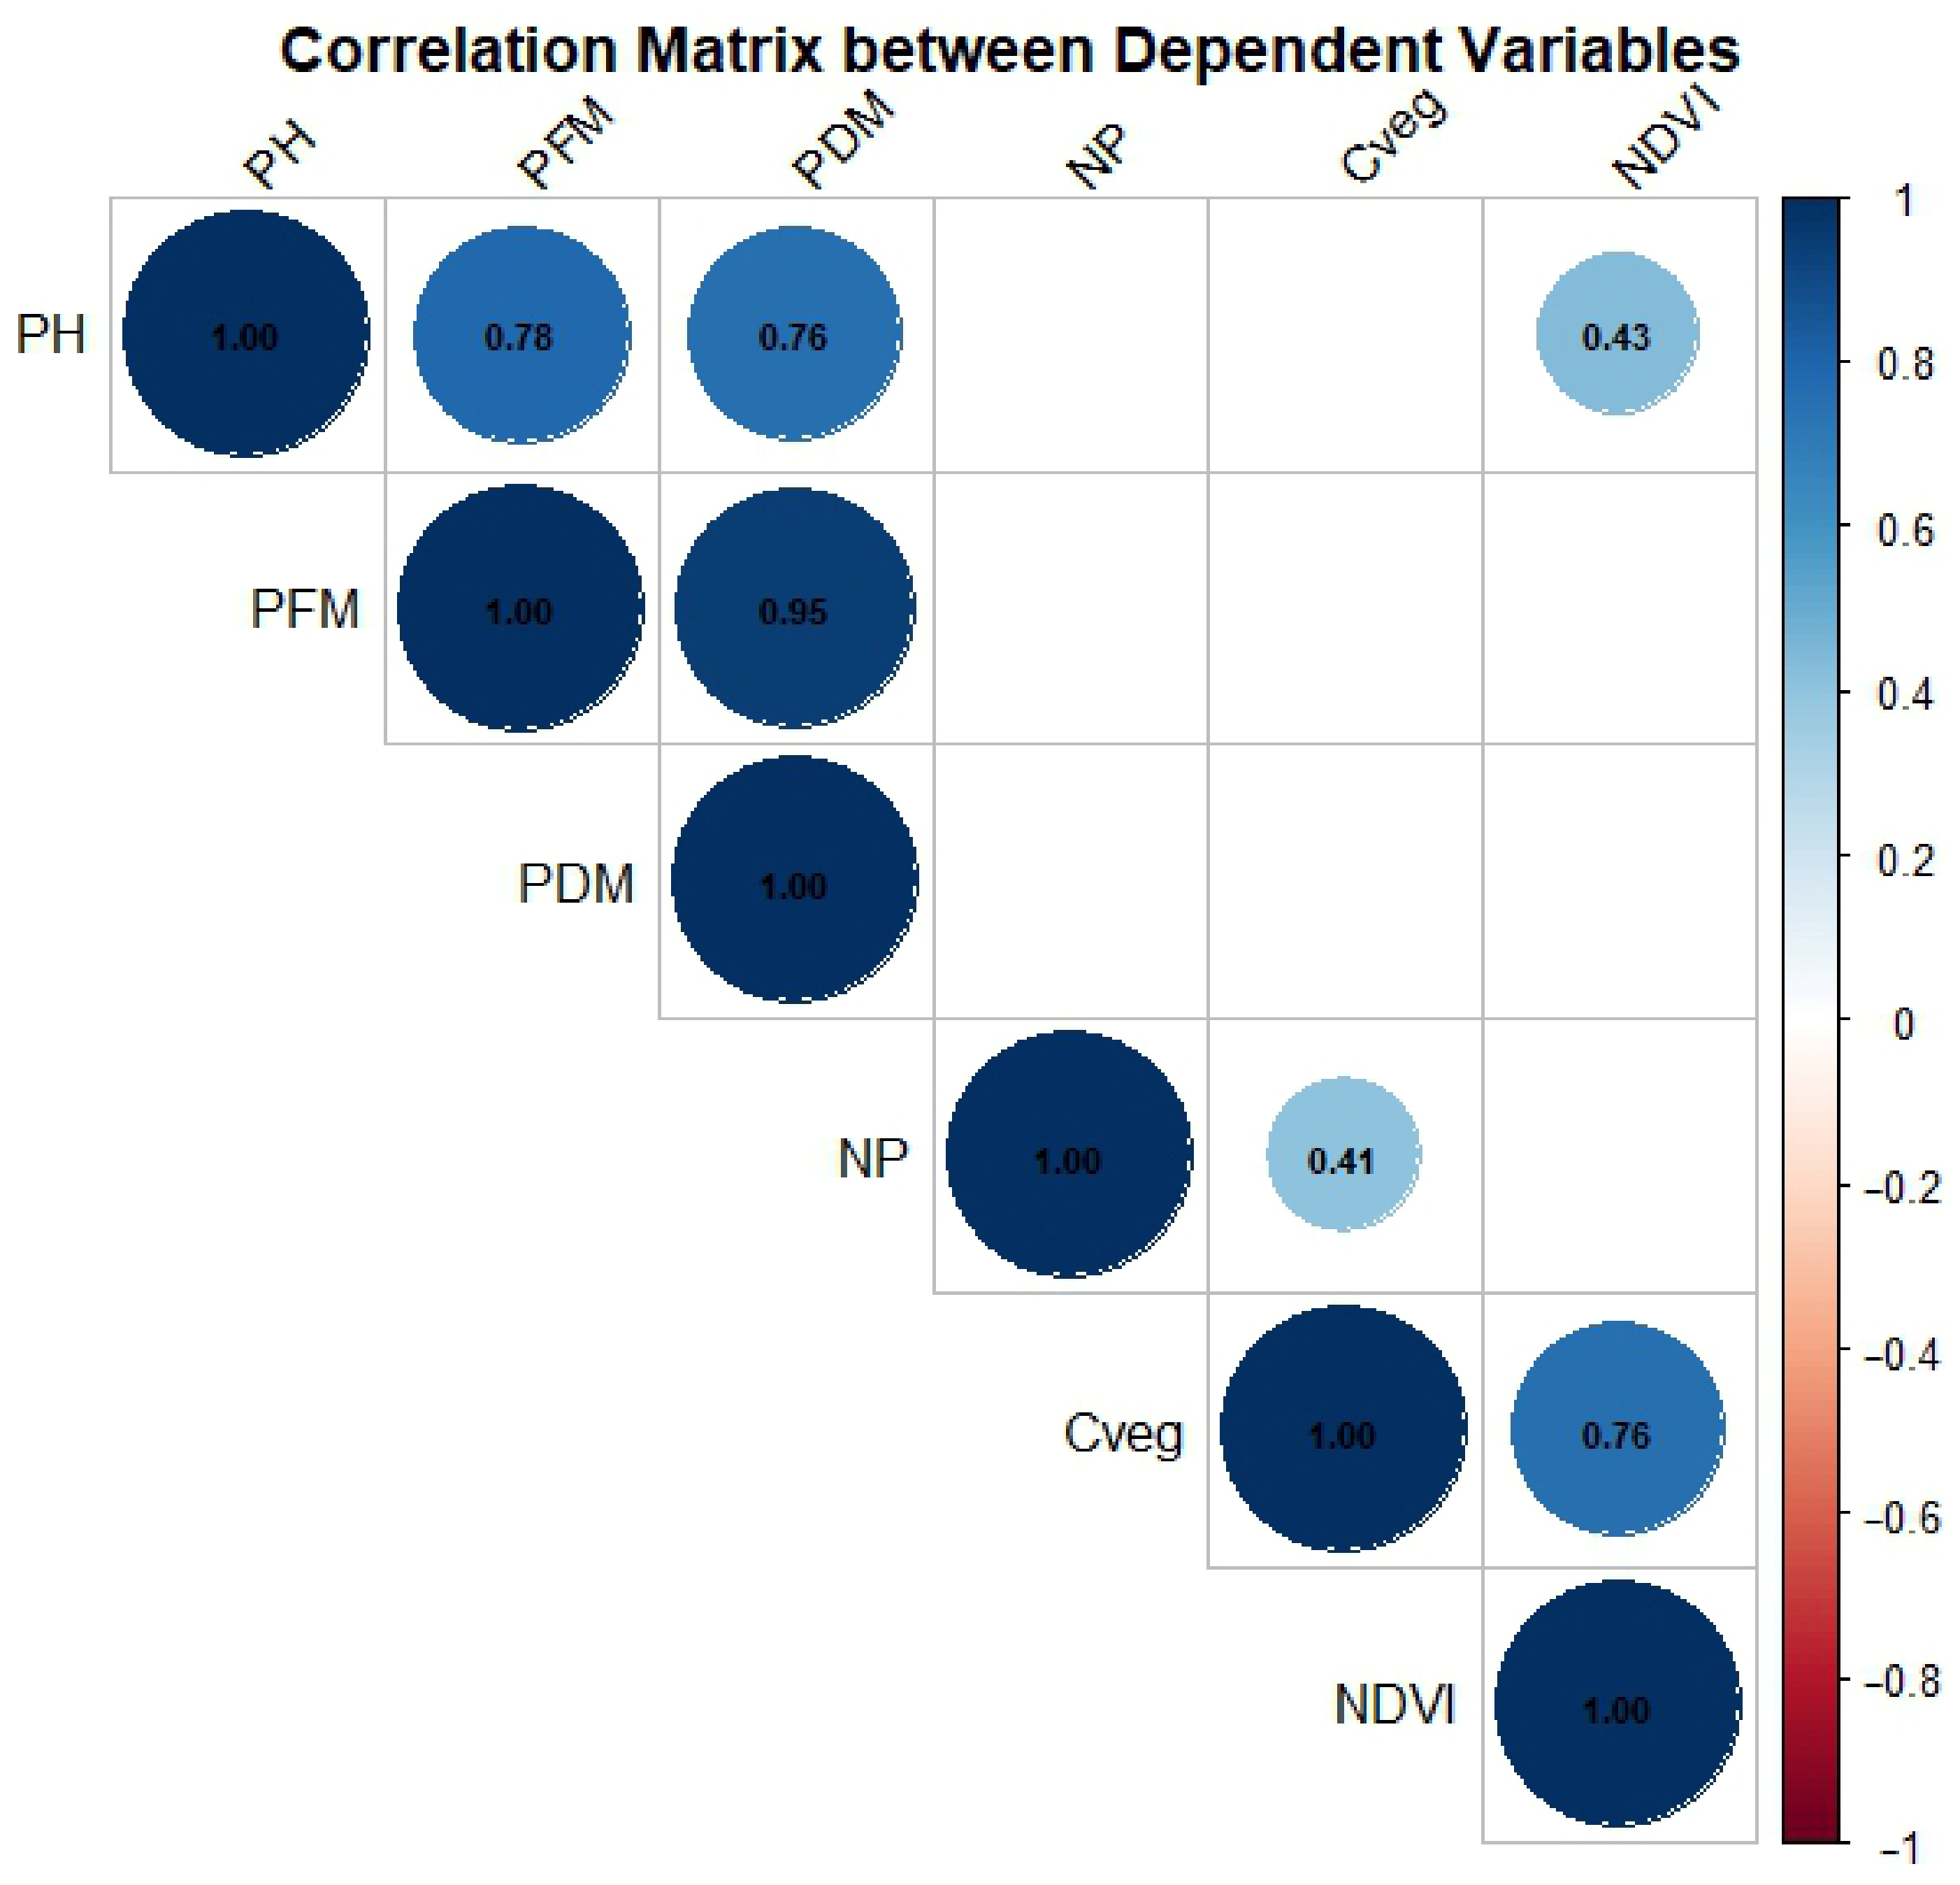
To explore the relationships between the studied variables, a Pearson correlation matrix was constructed, as shown in Figure 8. The analysis shows a strong positive correlation between Cveg and NDVI (r = 0.76), confirming that these remote sensing metrics are complementary in assessing the crop’s spatial establishment. Regarding the physical parameters, PH showed a moderate correlation with NDVI (r = 0.43), while the NP exhibited a similar association with Canopy Cover (r = 0.41).
The strongest relationships were observed between plant structural development and biomass. Specifically, PH was highly correlated with PFM (r = 0.78) and significantly associated with PDM (r = 0.76), although the latter was less pronounced.

3.2. Crop Vigour and Development Remote Sensing

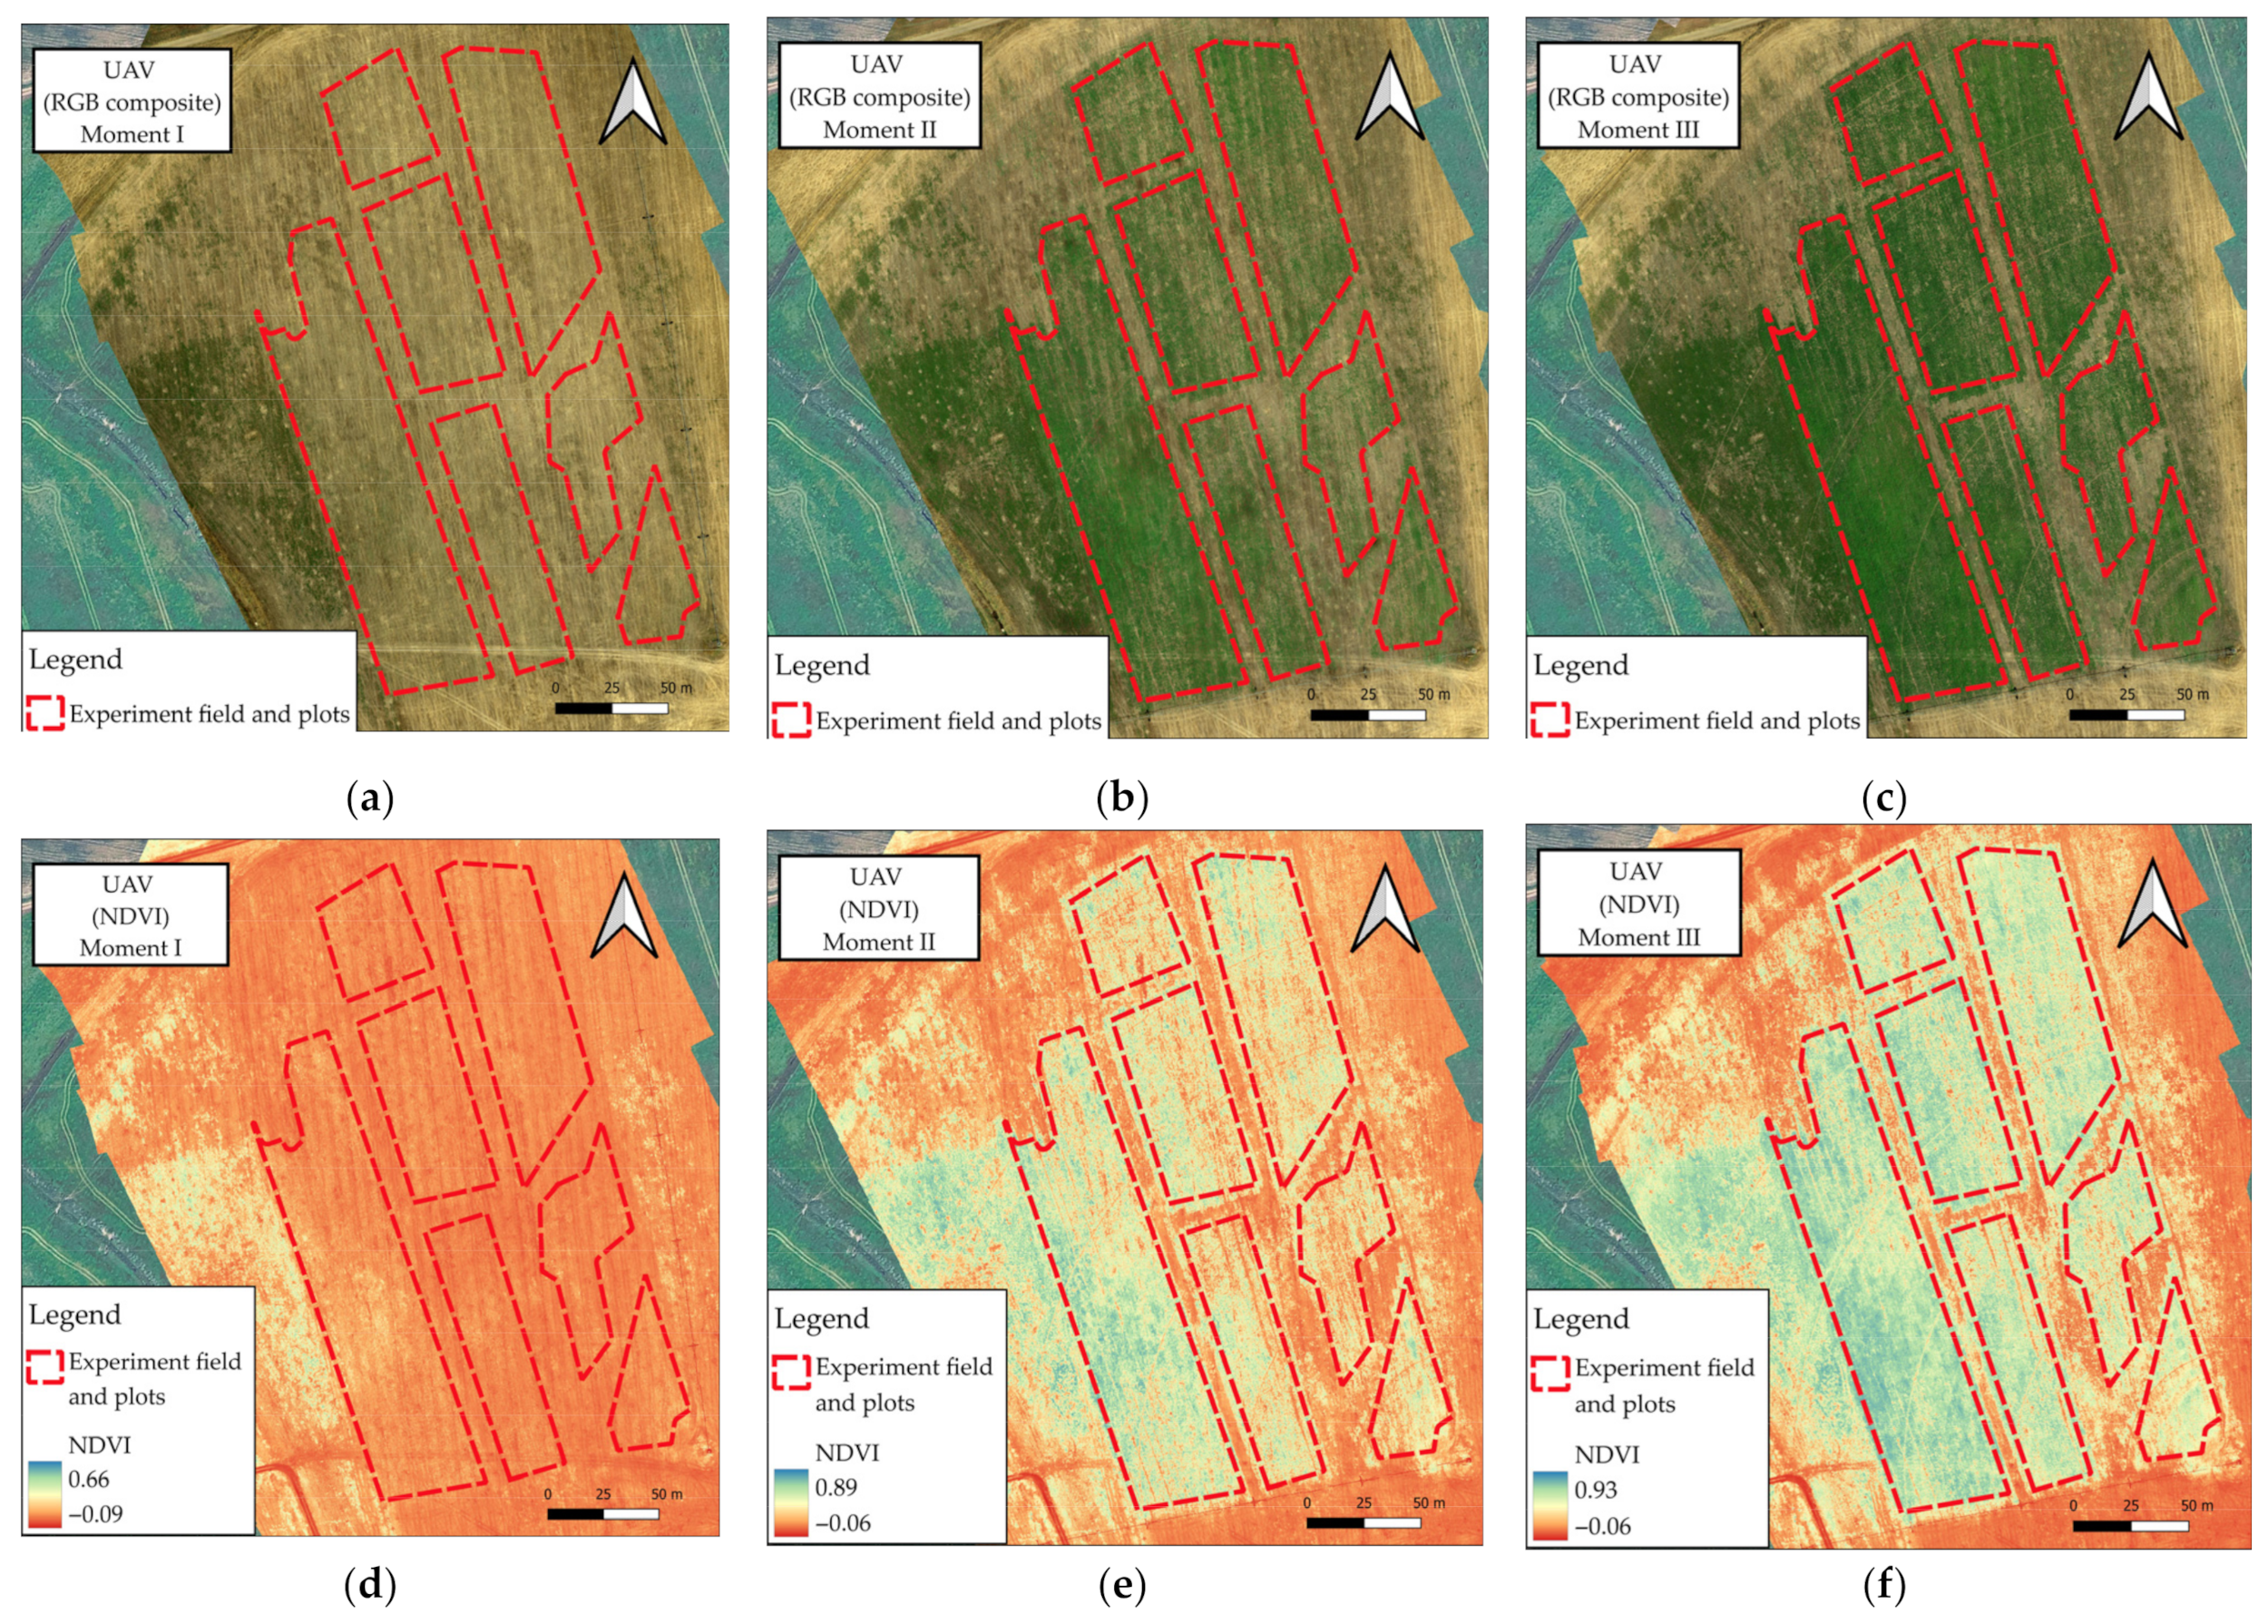
The temporal evolution of the hybrid sorghum’s establishment and vegetative vigour was monitored through high-resolution UAV imagery at three key moments. Figure 9 presents the visual record of this progression, including RGB orthomosaics—reflecting the visible crop coverage—and the corresponding NDVI maps, which quantify the spatial distribution of photosynthetic activity across the experimental plots.
The multi-temporal analysis shows the increase in vegetation vigour from Moment I to Moment III. In the initial phase (Figure 9a,d), the field exhibited NDVI values below 0.66. By Moment II (Figure 9b,e), an expansion in canopy cover is recorded, particularly in the central plots, where the NDVI reached a maximum of 0.89. At the final monitoring stage prior to harvest (Figure 9c,f), the crop recorded NDVI values up to 0.93.
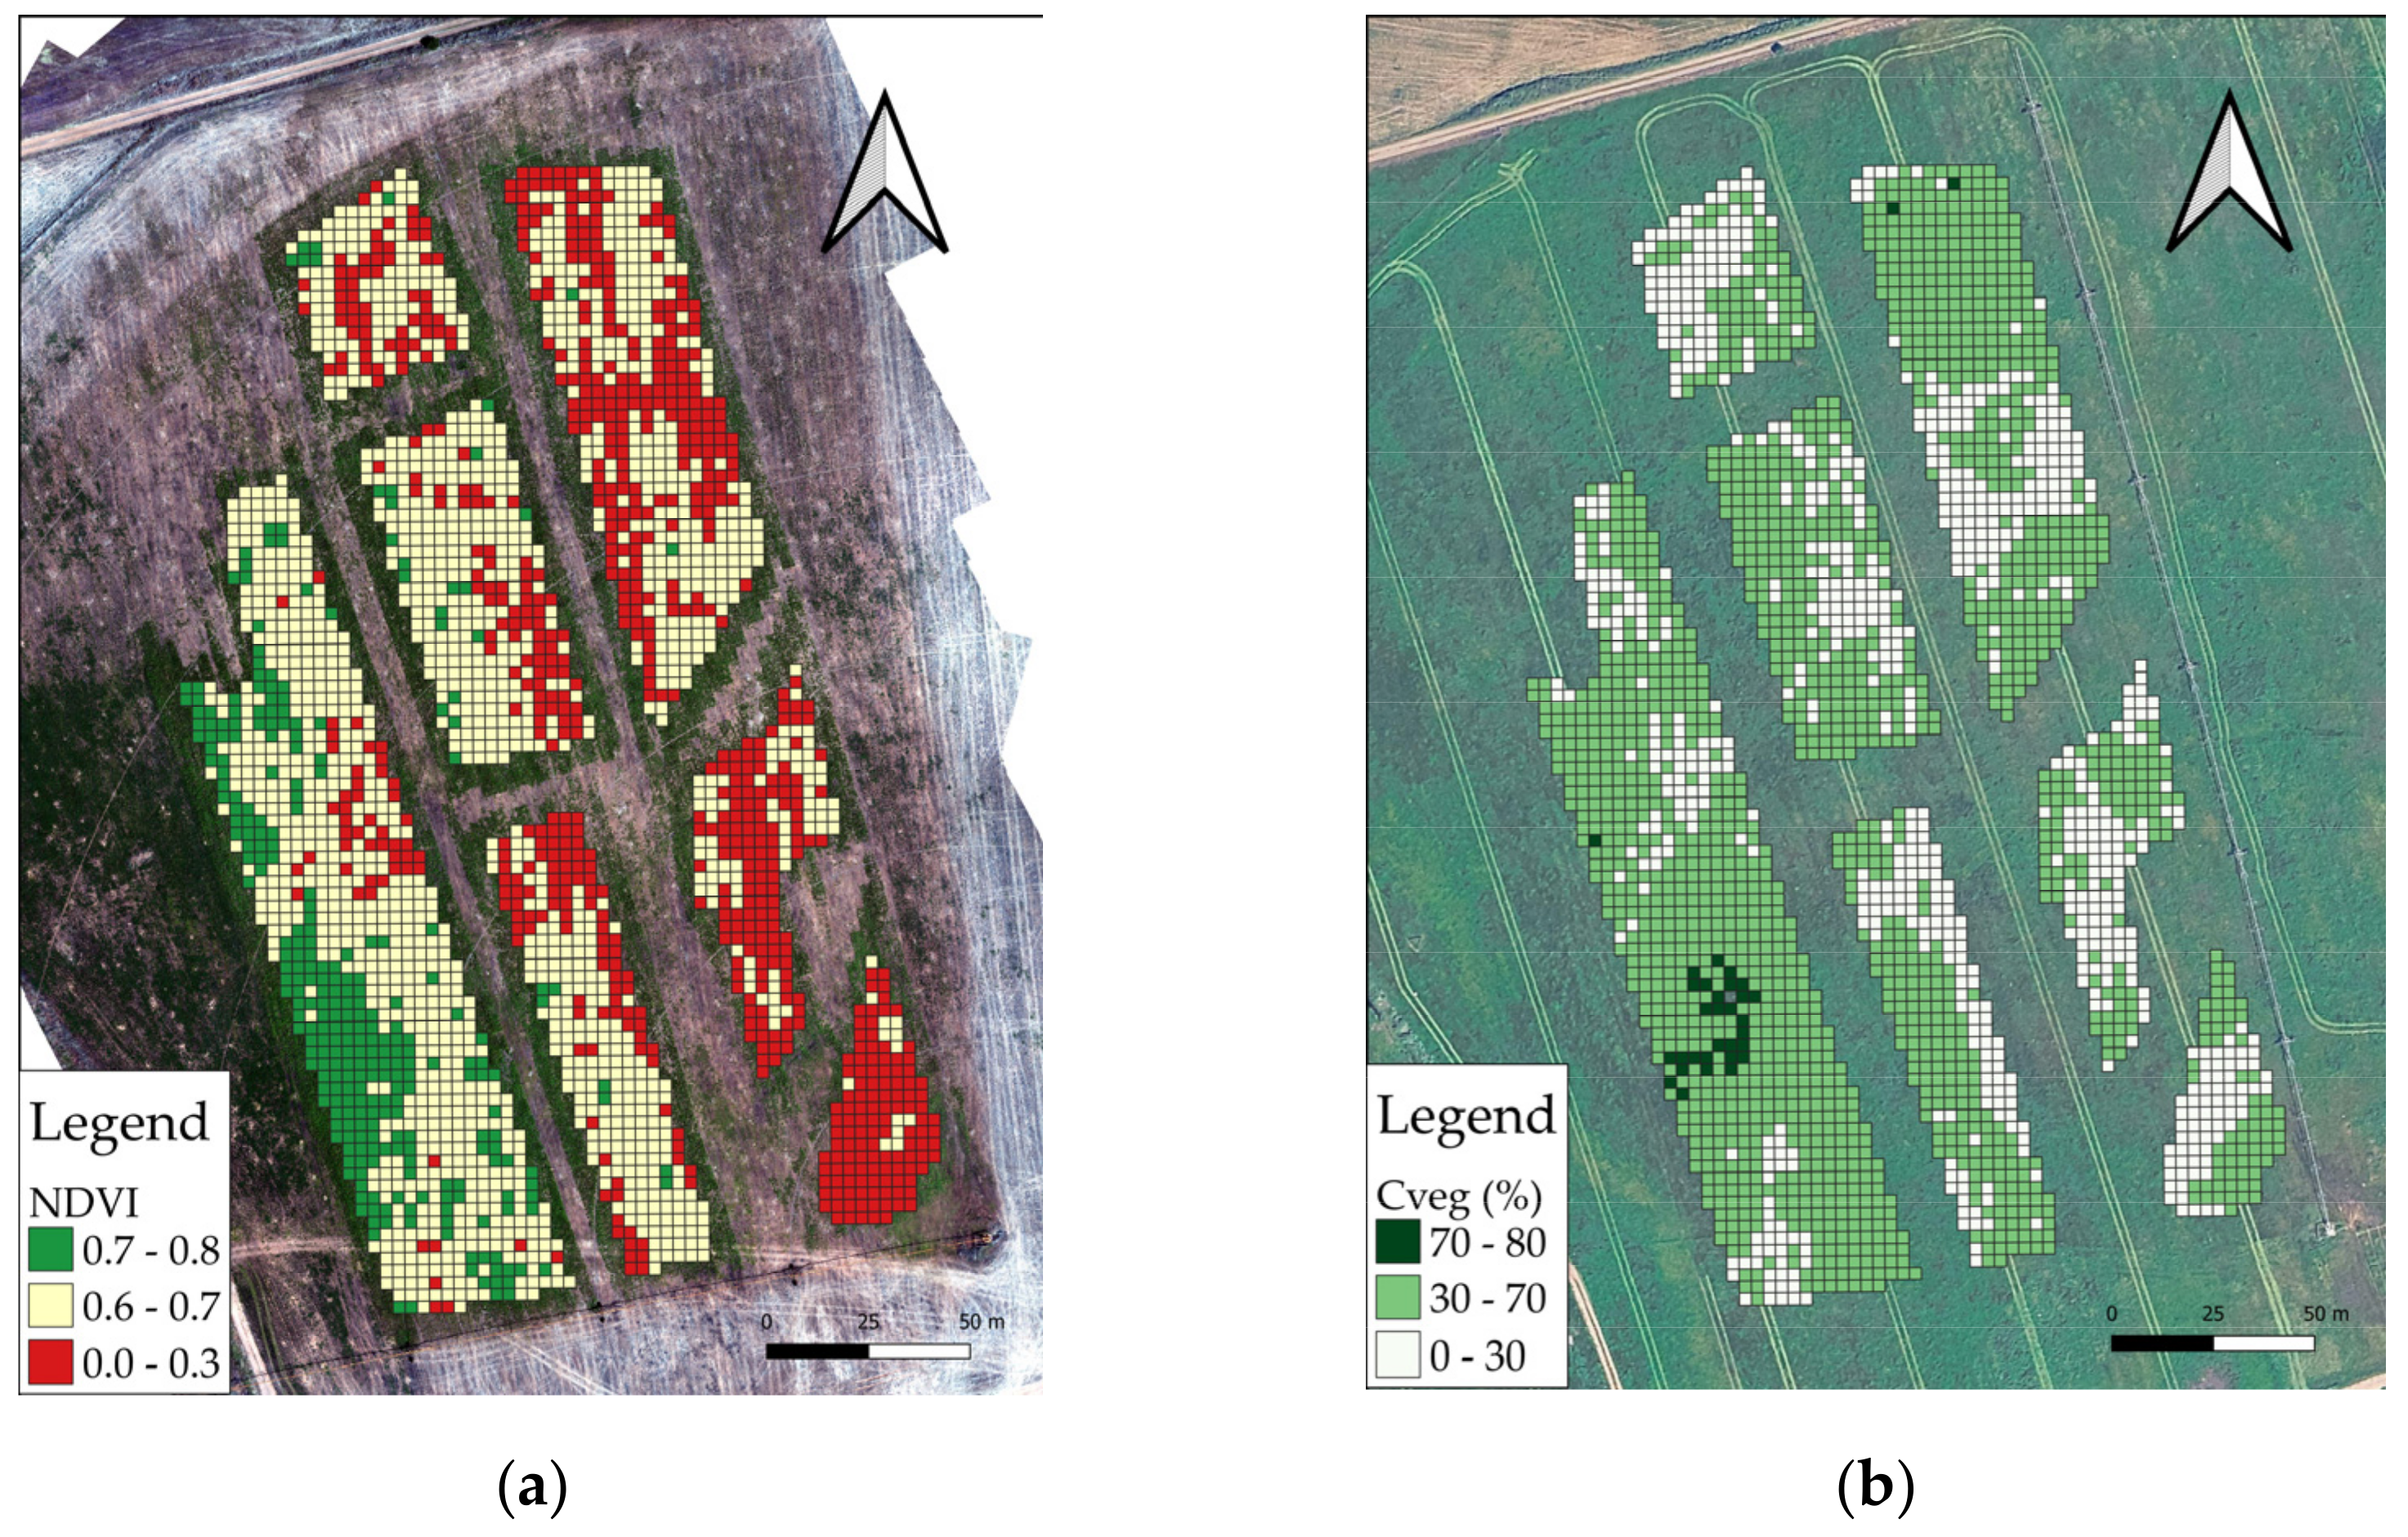
Following the generation of the orthomosaic from the final UAV flight, the spatial distribution of both the NDVI and Cveg was analysed to assess the field’s condition at the time of forage harvest. As illustrated in Figure 10a, the NDVI map shows a clear stratification of vegetative vigour, with zones (dark green) predominant in the western and central plots exceeding 0.7. Conversely, the Cveg map (Figure 10b) indicates that the trial area achieved a soil coverage between 30% and 70%, with specific high-density clusters above 80%.

3.3. Yield Indicators

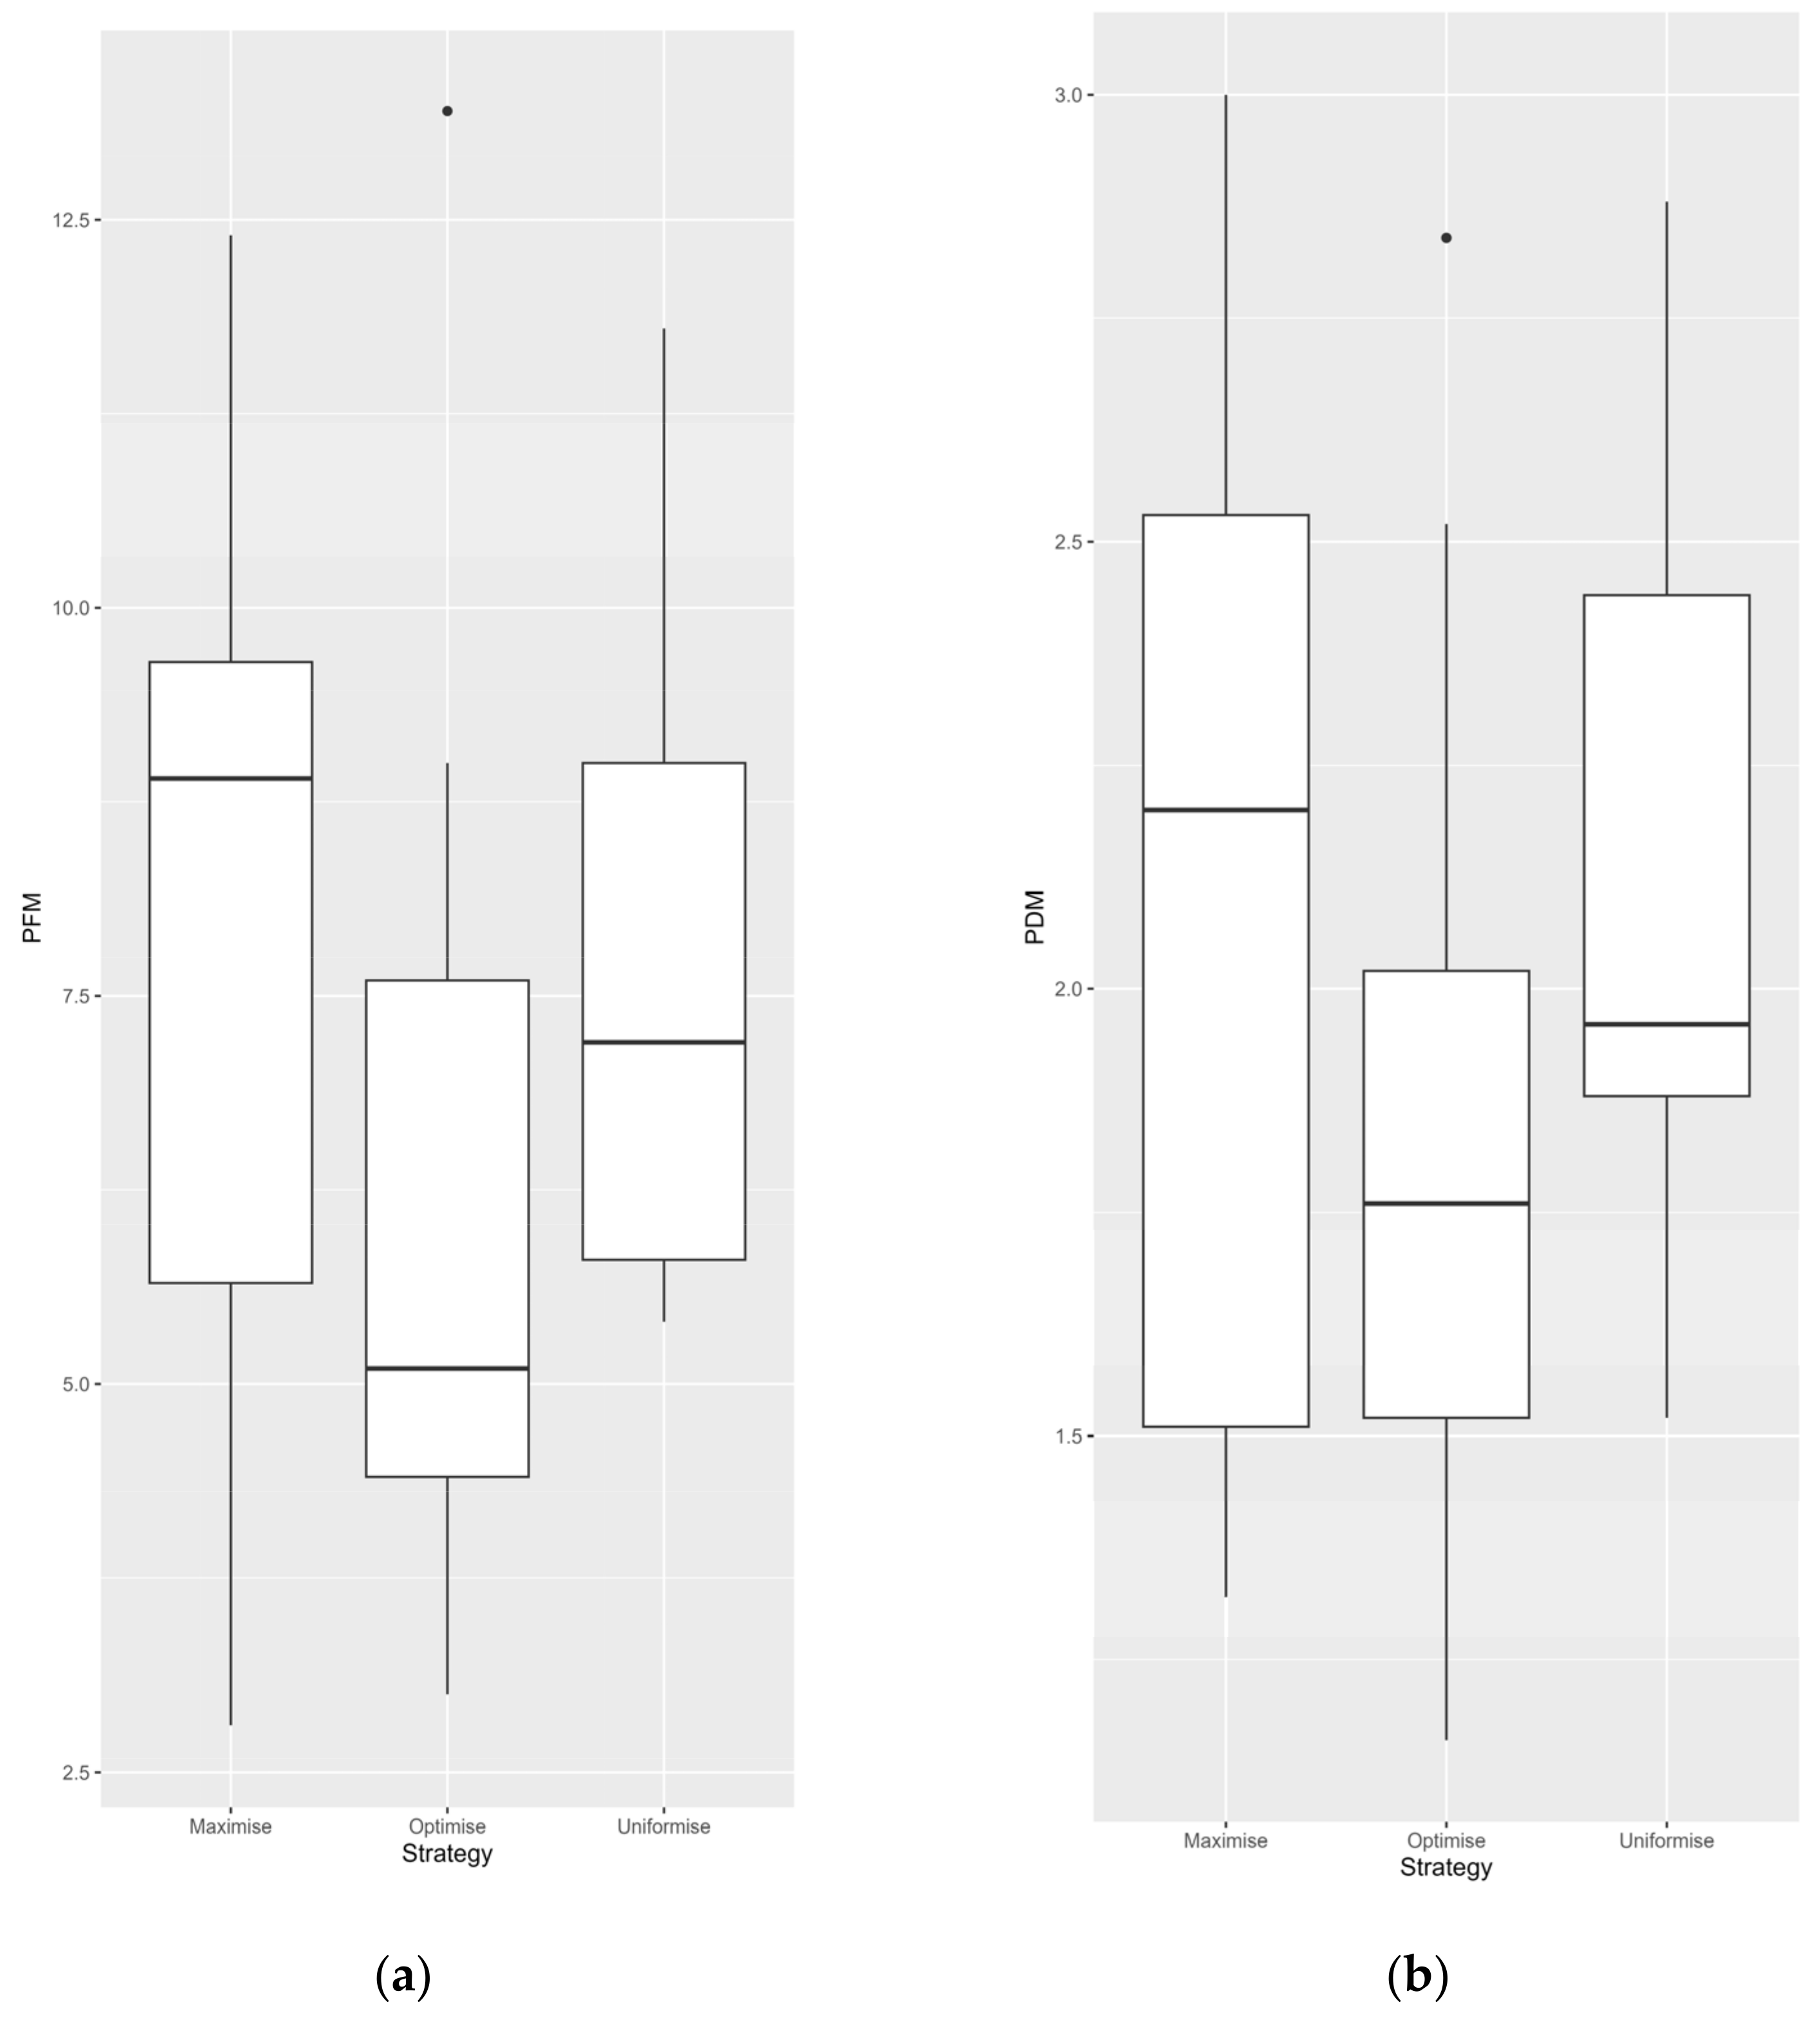
The analysis of biomass accumulation at the end of the 33-day trial period is summarised in Figure 11, which presents the boxplots for PFM (Figure 11a) and PDM (Figure 11b) across the three tested seeding strategies: “Maximise”, “Optimise”, and “Uniformise”.
The data distribution shows the variability in yield potential within each strategy, with the “Maximise” approach recording a tendency for higher median values in both fresh and dry biomass, and a broader range of dispersion compared to the “Uniformise” strategy.

4. Discussion

4.1. The Role of VRS Strategies in Early Crop Establishment

The superior performance of the “Uniformise” strategy across most vegetative indicators—namely, PH, NDVI, and Cveg—suggests that, during the initial 33 days of development, a stable and intermediate seeding density provides a more balanced environment for hybrid sorghum establishment. In contrast, the “Optimise” strategy consistently yielded the poorest results, likely because it allocates higher seed densities to “Low ECa” zones (areas of lower soil potential). At this early phenological stage, the inherent soil limitations in these zones appear to have outweighed any potential agronomic benefit that could be derived from increased plant density. Under the specific conditions of this trial, characterized by controlled irrigation and high thermal accumulation, the results indicate that increasing seeding rates in lower-potential zones does not necessarily translate into immediate gains in vegetative vigour. At this stage, the inherent soil limitations in these zones appear to have outweighed the biological potential provided by increased plant density, as evidenced by the spectral indices recorded at Moment III.
However, the evaluation of these strategies must also consider their economic and operational dimensions. While the “Uniformise” strategy showed better initial growth, the implementation of VRS is primarily driven by the goal of increasing input efficiency across heterogeneous fields. By reducing seed waste in over-performing areas and preventing over-competition in under-performing ones, VRS can significantly enhance farm profitability. Zhao et al. [18] presented economic analyses demonstrating that the adoption of VRS can result in net income increases ranging from $0.20 to $30.60 per hectare across various trials. Martins et al. [19] observe that the long-term advantages of precision agriculture, namely increased yields and cost efficiency, tend to justify the significant upfront investment in ECa technology. This supports the hypothesis that, even if a uniform strategy shows temporary advantages in a short 33-day period, the broader economic potential of VRS makes it a superior model for managing the inherent complexity of Mediterranean farming systems.

4.2. Soil ECa as an Indicator of Spatial Variability

The inferential analysis conducted in this study revealed that soil ECa had a significant impact on the NP, highlighting its role as a primary driver of crop emergence and initial stand establishment. The experimental design successfully created a wide gradient of plant densities, ranging from 80,000 to 520,000 plants/ha (Table 3). This range accurately reflects the three intended management intensities: Optimise, Uniformise, and Maximise. The successful establishment of up to 13 plants per linear meter was supported by the stable soil moisture levels (VWC) recorded during the emergence phase, particularly at the 0.20 m depth, which remained above 60% during the critical first two weeks. This robust establishment ensures that the variability observed in the yield indicators (Figure 11) is a direct result of the planned plant population levels. This corroborates the established principle that VRS technology allows for the precise adjustment of seeding rates based on soil variability to enhance resource utilisation, as previously indicated by other authors [1,6]. Interestingly, while ECa influenced the quantity of plants that emerged, its effect on individual development metrics—such as PH and NDVI—was less pronounced than the effect of the seeding strategy itself. This suggests that while soil variability dictates the success of the initial “strike” (emergence), subsequent growth during the first month is more sensitive to the competition dynamics and resource allocation defined by the seeding rate.
Šarauskis et al. [17] pointed out that the effectiveness of VRS applications is heavily influenced by site-specific environmental conditions, particularly soil type and moisture levels. By optimizing seeding rates according to soil fertility indicators, such as soil organic matter or texture, VRS can significantly influence yield outcomes [1,6]. Our findings align with research indicating that VRS can successfully adapt to site-specific data, including soil moisture availability, to optimize crop density [17]. Consistent with the findings of Mabasa et al. [20] regarding the benefits of optimal moisture during early planting, the integration of ECa data in this study served as a reliable indicator for moisture-holding capacity, facilitating a more targeted initial establishment.
The role of ECa in delineating management zones is a key mitigation tool against abiotic stress, as it ensures seeding rates align with the buffering capacity of each field zone. This approach is underscored by Kumar et al. [21] as a fundamental practice for enhancing crop resilience in the face of temperature fluctuations and drought conditions. Consequently, while the ECa did not dominate the later vigour metrics in this 33-day period, its role in defining the initial population density remains a cornerstone for the sustainability and efficiency of precision seeding programmes in Mediterranean environments.
It is also important to consider the nutritional context of the experimental site. The soil characterisation (Table 4) reveals levels of organic matter and available nutrients, typical of a well-managed innovation centre with a history of consistent fertilisation. This good fertility baseline may have exercised a ‘buffer effect’, satisfying the crop’s initial requirements across all ECa zones. Consequently, the spatial variability captured by the ECa mapping, while significant for plant establishment, might have been secondary to the overall nutrient availability regarding biomass accumulation during the short 33-day window.

4.3. Climate Fluctuations and Phenological Acceleration

The meteorological conditions during the trial were marked by “thermal instability”, where periods of heat were interspersed with significant cooling phases. This dynamic resulted in a cumulative surplus of 53.8 °C GDD, accelerating the sorghum’s phenological cycle by approximately five days relative to the climatological normal. This acceleration is a critical finding for precision management in semi-arid regions, as it substantially reduces the temporal window available for post-emergence interventions, such as fertilisation or weed control.
The importance of timing in conjunction with seeding management is well-documented; for instance, early sowing has been shown to improve seed vigour and germination rates, which are fundamental for establishing resilient stands [22]. In this study, the high thermal accumulation likely acted as a catalyst for the rapid growth observed in the “Uniformise” plots, where the intermediate density may have better buffered the plants against the high evaporative demand.
Furthermore, environmental stresses—specifically drought and the sharp temperature fluctuations recorded in our data—are known to severely impact sorghum development [21]. The use of VRS strategies can play a pivotal role in mitigating these abiotic stresses by ensuring that seeding rates are tailored to the specific buffering capacity of each field zone. By adjusting the plant population to match the soil’s potential (as defined by the ECa zones), VRS enhances the crop’s resilience against these erratic climate patterns [21]. In Mediterranean environments, where such fluctuations are becoming more frequent, the ability to monitor this rapid phenological progression via multi-temporal UAV missions becomes an indispensable component of precision agriculture programmes.
The maintenance of adequate moisture levels in the root zone, despite the high thermal accumulation (GDD) previously discussed, was a determining factor in ensuring the successful establishment of the sorghum plants across all tested seeding strategies.

4.4. Remote Sensing and Physical Sampling

The high-resolution temporal monitoring performed in this study demonstrates that remote sensing is a valuable tool for capturing rapid shifts in crop vigour, particularly when plants are subjected to high evaporative demands and fluctuating temperatures. The strong correlation observed between Cveg and NDVI (r = 0.76) validates the implementation of automated Python-based workflows for non-destructive crop monitoring. Such algorithmic approaches, which facilitate the automated estimation of morphological traits, are increasingly recognised as robust tools for high-throughput phenotyping in modern agriculture. Specifically, the use of automated “Otsu” thresholding for vegetation detection—as applied in our QGIS-Python script—aligns with advanced object-based methods that provide optimal separation between crop and soil background, even in complex UAV-derived imagery.
However, the fact that PH exhibited a stronger correlation with fresh biomass (r = 0.78) than the spectral indices suggests that, at 33 days, the physical structure of the sorghum is a more reliable predictor of yield than photosynthetic intensity alone. The finding that PH exhibited a stronger correlation with fresh biomass (r = 0.78) than the spectral indices indicates that, at 33 days, the physical structure of the sorghum is a more reliable predictor of yield than photosynthetic intensity alone. This suggests that for early-stage biomass estimation, integrating structural data (such as PH or canopy volume) with spectral data (NDVI) provides a more comprehensive model. The results suggest that during this specific window of the sorghum cycle, physical height serves as a more reliable indicator of fresh biomass accumulation, validating the importance of incorporating structural metrics in precision grazing management. The validation of these correlations is essential for interpreting how the different seeding strategies translated into physical crop performance and vegetative vigour.
The integration of these technologies, including GPS and multispectral remote sensing, is a cornerstone of effective VRS management, as it allows for a more granular mapping of field variability [23]. This technological advancement not only enhances real-time decision-making regarding seeding rates but is also crucial for maximising crop production while maintaining environmental sustainability, ensuring that inputs are precisely aligned with the crop’s actual development and needs. According to Figure 9, the final monitoring stage clearly illustrates the spatial heterogeneity within the trial, where the differentiated seeding strategies influenced the density and vigour of the canopy, as evidenced by the contrast between the high-vigour areas (dark green/blue) and the zones of slower development (red/yellow).

4.5. Practical Implications and Future Research

The absence of statistically significant differences in final biomass across the three strategies indicates a potential for VRS to be leveraged for input optimisation without a detectable compromise in early-stage productivity. While high experimental variability may have limited the statistical power to identify subtle differences, from a practical perspective, if a lower seeding rate—as implemented in specific zones of the “Maximise” or “Optimise” strategies—reaches a final yield comparable to the “Uniformise” approach, there is an operational incentive for seed saving. This aligns with the broader goals of sustainable intensification, where precision agriculture technologies are essential for improving nitrogen use efficiency and reducing the environmental footprint of farming, such as lowering greenhouse gas emissions associated with over-seeding and excessive input application. However, the absence of statistically significant differences in final biomass across the strategies requires a cautious interpretation. On one hand, this may suggest a biological parity in early development, where different seeding densities did not yet translate into divergent yield outcomes within 33 days. On the other hand, it is possible that the high experimental variability (CV), combined with the sample size (n = 33), reduced the statistical power of the tests, potentially masking subtle treatment effects. Therefore, while the results are promising for resource optimisation, they should be viewed as exploratory, requiring further validation in trials with higher sampling density or lower inherent spatial noise. The integration of advanced technologies, such as ECa mapping and automated UAV-based monitoring, provides a baseline for refining these precision programmes in Mediterranean conditions. Our results demonstrate that the combination of soil variability data and high-resolution spectral indices allows for a more granular understanding of field potential, enhancing the decision-making process regarding seeding rates and other critical inputs. As the agricultural sector faces increasing pressure from climate change and resource scarcity, the adoption of automated workflows—such as the Python-based algorithms used in this study to estimate Cveg—offers a scalable solution for high-throughput field management. The results of Cveg map provide a robust visual confirmation of the findings presented in the previous subchapters, highlighting the spatial heterogeneity of the sorghum crop at its peak vegetative development and its direct relationship with the implemented management strategies.
For future research, it is crucial to extend the monitoring period beyond the initial 33 days to determine if the observed vegetative differences equalise or diverge as the hybrid sorghum reaches full maturity. Multi-annual trials are also necessary to validate these strategies across varying climatic years, particularly to assess how VRS performs under different levels of thermal accumulation and water stress. As a multi-cut crop, further research should explore how the sorghum regrows and assesses if the various VRS strategies impact its recovery and long-term performance. Furthermore, incorporating root trait analysis through automated imaging packages could provide deeper insights into how seeding density influences below-ground competition and overall plant resilience. Ultimately, these findings contribute to a more sustainable and technologically integrated approach to sorghum cultivation in semi-arid environments.

5. Conclusions

This study evaluated the early response of forage sorghum to VRS strategies in a Mediterranean low-input grazing system. The results indicate that while different seeding densities established distinct vegetative patterns—with the highest initial vigour observed in the “Uniformise” plots—these differences did not result in statistically significant gains in final fresh or dry biomass within the 33-day trial period.
The lack of a significant yield response indicates that, for the purpose of direct grazing, lower-density strategies such as “Optimise” may offer a potential opportunity for efficient use of resources, which could be further explored to achieve comparable forage availability with reduced seed input under these specific conditions. Furthermore, the correlation found between soil ECa and early growth metrics suggests that ECa mapping provides a useful baseline for identifying soil variability, even if its direct impact on final biomass was buffered by the field’s high nutrient history. UAV-based remote sensing captured differentiated growth patterns during the establishment phase, demonstrating its utility for monitoring crop development at an on-farm scale.

Author Contributions

Conceptualization, G.T.P., L.S., S.D., P.D., F.C.L., J.S. and L.A.C.; methodology, G.T.P., L.S., J.S. and L.A.C.; software, L.S. and S.D.; validation, G.T.P. and L.S.; formal analysis, G.T.P., L.S., S.D., P.D., F.C.L., J.S. and L.A.C.; investigation, G.T.P. and L.S.; resources, G.T.P., L.S., S.D., P.D., F.C.L., J.S. and L.A.C.; data curation, L.S.; writing—original draft preparation, L.S.; writing—review and editing, G.T.P., L.S., S.D., P.D., F.C.L., J.S. and L.A.C.; visualization, G.T.P., L.S., S.D., P.D., F.C.L., J.S. and L.A.C.; supervision, F.C.L., J.S. and L.A.C.; project administration, L.A.C.; funding acquisition, L.S. All authors have read and agreed to the published version of the manuscript.

Funding

This research received no external funding.

Data Availability Statement

The original contributions presented in the study are included in the article; further inquiries can be directed to the corresponding authors.

Acknowledgments

The authors would like to thank the National Institute for Agricultural and Veterinary Research (INIAV) for providing the experimental field under the GEEBovMit Project—LA 3.3-PRR-C05-i03-I-000027-LA3.3—Mitigation of GHG emissions in beef cattle production—pastures, forages and natural additives. The authors would also like to thank the VALORIZA research centres (grant UID/05064/2025—https://doi.org/10.54499/UID/05064/2025, accessed on 27 February 2026), MED (https://doi.org/10.54499/UIDB/05183/2020, accessed on 27 February 2026; https://doi.org/10.54499/UIDP/05183/2020, accessed on 27 February 2026) and CHANGE (https://doi.org/10.54499/LA/P/0121/2020, accessed on 27 February 2026). Associação de Criadores de Bovinos Mertolengos (ACBM) is greatly acknowledged for its institutional support. During the preparation of this manuscript, the authors used Google Gemini 3 for the purposes of clarifying ideas and drafting texts. The authors have reviewed and edited the output and take full responsibility for the content of this publication.

Conflicts of Interest

The authors declare no conflicts of interest. The funders had no role in the design of the study; in the collection, analyses, or interpretation of data; in the writing of the manuscript; or in the decision to publish the results.

Abbreviations

The following abbreviations are used in this manuscript:
ANOVAAnalysis of Variance
BBlue band
CIConfidence Interval
CVCoefficient of Variation
CvegCanopy Cover
diffMeans differences
ECaapparent Electrical Conductivity
ExGExcess Green Index
GGreen band
GDDGrowing Degree-Day
haHectare
INIAVNational Institute for Agricultural and Veterinary Research
NDVINormalised Difference Vegetation Index
NIRNear–Infrared band
NPNumber of plants
PDMPlant Dry Matter
PFMPlant Fresh Matter
PHPlant height
RRed band
RERed–Edge band
SDStandard Deviation
TbBase temperature
UAVUnmanned Aerial Vehicle
VRSVariable-Rate Seeding
VWCVolumetric Water Content

References

  1. Du, Z.; Yang, L.; Zhang, D.; Cui, T.; He, X.; Xiao, T.; Xie, C.; Li, H. Corn Variable-Rate Seeding Decision Based on Gradient Boosting Decision Tree Model. Comput. Electron. Agric. 2022, 198, 107025. [Google Scholar] [CrossRef]
  2. Rieder, L.; Amann, T.; Hartmann, J. Soil Electrical Conductivity as a Proxy for Enhanced Weathering in Soils. Front. Clim. 2024, 5, 1283107. [Google Scholar] [CrossRef]
  3. Anselmi, A.A.; Molin, J.P.; Bazame, H.C.; Corrêdo, L.d.P. Definition of Optimal Maize Seeding Rates Based on the Potential Yield of Management Zones. Agriculture 2021, 11, 911. [Google Scholar] [CrossRef]
  4. Fracasso, A.; Perego, A.; Amaducci, S. Characterisation of Ten Commercial Sorghum Genotypes Grown under Water-Limited Conditions for Bioenergy Production in Mediterranean Environment. Ital. J. Agron. 2017, 12, 898. [Google Scholar] [CrossRef]
  5. Videgain, M.; Martínez-Casasnovas, J.A.; Vigo-Morancho, A.; Vidal, M.; García-Ramos, F.J. On-Farm Experimentation of Precision Agriculture for Differential Seed and Fertilizer Management in Semi-Arid Rainfed Zones. Precis. Agric. 2024, 25, 3048–3069. [Google Scholar] [CrossRef]
  6. Du, Z.; Yang, L.; Zhang, D.; Cui, T.; He, X.; Xie, C.; Jiang, Y.; Zhang, X.; Mu, J.; Wang, H.; et al. Design and Experiment of a Soil Organic Matter Sensor-Based Variable-Rate Seeding Control System for Maize. Comput. Electron. Agric. 2025, 229, 109752. [Google Scholar] [CrossRef]
  7. Cardoso, J. A Classificação de Solos de Portugal. In Boletim de Solos do SROA; SROA: Lisboa, Portugal, 1974; Volume 17, pp. 14–46. [Google Scholar]
  8. Direcção-Geral de Agricultura e Desenvolvimento Rural. Produção Integrada das Culturas das Culturas de Milho e Sorgo; DGADR: Lisboa, Portugal, 2010. [Google Scholar]
  9. Terrapro Technologies USENS Software 2015. Available online: https://vx.usens.cloud:8443/uSensV50_CustomerServer/mainStart?s=-888 (accessed on 1 December 2025).
  10. Pix4D SA. Pix4Dmapper. Available online: https://www.pix4d.com/ (accessed on 28 December 2025).
  11. QGIS Association. QGIS.org QGIS Geographic Information System 2022. Available online: https://qgis.org/ (accessed on 5 December 2025).
  12. Ghimire, A.; Chung, Y.S.; Jeong, S.; Kim, Y. Python Algorithm Package for Automated Estimation of Major Legume Root Traits Using Two Dimensional Images. Sci. Rep. 2025, 15, 7341. [Google Scholar] [CrossRef] [PubMed]
  13. Torres-Sánchez, J.; López-Granados, F.; Peña, J.M. An Automatic Object-Based Method for Optimal Thresholding in UAV Images: Application for Vegetation Detection in Herbaceous Crops. Comput. Electron. Agric. 2015, 114, 43–52. [Google Scholar] [CrossRef]
  14. R Core Team. R: A Language and Environment for Statistical Computing; R Foundation for Statistical Computing: Vienna, Austria, 2013; Available online: http://www.R-project.org/ (accessed on 1 December 2025).
  15. William, R. Package Psych, v2.4.12; CRAN: Boston, MA, USA, 2024.
  16. Alexis, D. Package Dunn.Test, v1.3.5; CRAN: Boston, MA, USA, 2024.
  17. Šarauskis, E.; Kazlauskas, M.; Naujokienė, V.; Bručienė, I.; Steponavičius, D.; Romaneckas, K.; Jasinskas, A. Variable Rate Seeding in Precision Agriculture: Recent Advances and Future Perspectives. Agriculture 2022, 12, 305. [Google Scholar] [CrossRef]
  18. Zhao, Y.; Hennessy, D.A.; Lindsey, L.E.; Singh, M.P.; Lindsey, A.J. Information Conveyed by Management Zones and Optimal Soybean Seeding Rate. Agron. J. 2024, 116, 289–301. [Google Scholar] [CrossRef]
  19. Martins, A.; Passos, E.; Silva, M.; Rificki, P.; Batista, J.; Fonseca, E. Utilização Da Agricultura de Precisão Na Produção de Sorgo No Estado de Rondônia, Brasil. Rev. Geográfica Venez. 2025, 66, 94–105. [Google Scholar] [CrossRef]
  20. Mabasa, H.Z.; Nciizah, A.D.; Muchaonyerwa, P. Short-Term Tillage Management Effects on Grain Sorghum Growth, Yield and Selected Properties of Sandy Soil in a Sub-Tropical Climate, South Africa. Sci. Afr. 2025, 27, e02556. [Google Scholar] [CrossRef]
  21. Anija Hari Kumar, S.; Chacko Thomas, U.; Al-Salman, Y.; Cano, F.J.; Stephen, R.; Pillai, P.S.; Ghannoum, O. Evaluation of Yield-Related Morphological, Physiological, Agronomic, and Nutrient Uptake Traits of Grain Sorghum Varieties in the Kerala Region (India). Agronomy 2025, 15, 2320. [Google Scholar] [CrossRef]
  22. Yang, H.; Liu, X.; Chen, Y.; Liu, Y.; Guo, Z.; Cao, P.; Yao, H.; Huang, J.; Wu, J.; Zhao, Z.; et al. Moderate Early Sowing Improves Sorghum Seed Germination by Optimizing Field Temperature Conditions during Seed Production. Ital. J. Agron. 2025, 20, 100049. [Google Scholar] [CrossRef]
  23. Lan, J.; Ban, Q. The Farm-Level Economic and Environmental Benefits of Precision Agriculture Technology Adoption: A Meta-Analysis of Global Evidence. Sustainability 2025, 17, 11223. [Google Scholar] [CrossRef]
Figure 1. Experiment design and location.
Grasses 05 00012 g001
Figure 2. (a) Altimetry within the experiment field; (b) ECa within the experiment field.
Grasses 05 00012 g002
Figure 3. (a) Daily average temperature (Tm) compared to the 1991–2020 climatologic normal; and (b) Accumulated GDD during the test period, compared to the accumulated GDD expected in a normal year (1991–2020).
Grasses 05 00012 g003
Figure 4. Soil VWC monitoring at multiple depths during the early vegetative development of the sorghum crop.
Grasses 05 00012 g004
Figure 5. Overlapping physical sampling points on the Cveg map (Moment III) that justify them.
Grasses 05 00012 g005
Figure 6. Frequency distribution histograms for the studied agronomic and spectral variables: NP, PH, PFM, PDM, Cveg, and NDVI.
Grasses 05 00012 g006
Figure 7. Boxplots of variables that showed significance.
Grasses 05 00012 g007
Figure 8. Correlation Matrix between dependent variables.
Grasses 05 00012 g008
Figure 9. Multi-temporal monitoring of hybrid sorghum development via UAV imagery: (a) RGB composite at Moment I (14 July); (b) RGB composite at Moment II (23 July); (c) RGB composite at Moment III (29 July); (d) NDVI orthomosaic at Moment I (max. 0.66); (e) NDVI orthomosaic at Moment II (max. 0.89); and (f) NDVI orthomosaic at Moment III (max. 0.93).
Grasses 05 00012 g009
Figure 10. (a) Spatial distribution of the NDVI at the time of forage harvest, classified by vigour levels across the experimental plots; (b) Map of the crop Cveg (%) at the time of forage harvest, showing the percentage of soil covered by vegetation within the sampling grid.
Grasses 05 00012 g010
Figure 11. (a) Boxplots of PFM (t ha−1) and (b) PDM (t ha−1) according to the different seeding strategies (“Maximise”, “Optimise”, and “Uniformise”) at the time of harvest.
Grasses 05 00012 g011
Table 1. Characterisation of the experimental soil plots.
Soil TypeTextureSand
(%)
Silt
(%)
Clay
(%)
K2O
(mg kg−1)
P2O5
(mg kg−1)
pHOM
(%)
Bulk Density
PagSandy loam71.513.415.0168.299.36.81.51.3
SrLoam61.218.721.5162.079.06.91.141.4
Table 2. Characterisation of the experimental plots, including area, prescribed seeding rates, management strategies, and soil apparent electrical conductivity (ECa) levels.
PlotArea (ha)Seeding Dose
(kg ha−1)
StrategyECa
A0.1540.0OptimiseLow
B0.2325.0OptimiseHigh
C0.5240.0OptimiseLow
D0.1925.0MaximiseLow
E0.3540.0MaximiseHigh
F0.3225.0MaximiseLow
G0.8932.5Uniformise-
Table 3. Cultural itinerary tasks carried out throughout the trial period.
TaskNo. of TimesDate
Pre–emergence herbicide123 June 2025
Seeding126 June 2025
Irrigation 63 July 2025
8 July 2025
10 July 2025
16 July 2025
17 July 2025
22 July 2025
Harvest129 July 2025
Table 4. Results of descriptive and inferential statistics after removal of outliers.
NPPH (m)PFM (t ha−1)PDM (t ha−1)Cveg (%)NDVI
No. of points323333333333
Min20.302.801.160.060.45
Max130.8013.203.000.740.75
Mean70.557.312.020.350.61
Median70.557.001.880.330.60
SD3.070.122.870.520.180.07
CV42.9020.9539.2625.7450.3811.32
NP—Number of plants; PH—Plant height (m); PFM—Plant Fresh Matter (t ha−1); PDM—Plant Dry Matter (t ha−1); Cveg—Canopy Cover (%); NDVI—Normalised Difference Vegetation Index; Min—Minimum; Max—Maximum; SD—Standard Deviation; CV—Coefficient of Variation.
Table 5. Kruskal–Wallis test results for variables without normal distribution.
VariableFactorChi–Squaredp-ValueSignificance
NPStrategy4.4840.106
Plot11.8610.065
ECa5.8770.015*
Seeding dose5.0610.079
NP—Número de plantas; ECa—Apparent Electrical Conductivity; Significance codes: * p < 0.1.
Table 6. ANOVA test results for variables with normal distribution.
VariableFactorF Valuep-ValueSignificance
PHStrategy8.7450.001**
Plot3.3230.015*
ECa0.030.863
Seeding dose0.2760.603
PFMStrategy1.5530.228
Plot1.490.221
ECa0.0420.839
Seeding dose1.5210.227
PDMStrategy1.0440.364
Plot1.7380.152
ECa0.440.512
Seeding dose0.2470.623
CvegStrategy6.6970.004**
Plot1.9040.118
ECa1.1340.295
Seeding dose0.0420.838
NDVIStrategy8.7570.001**
Plot3.6130.0097**
ECa0.810.375
Seeding dose0.1910.665
PH—Plant height (m); PFM—Plant Fresh Matter (t ha−1); PDM—Plant Dry Matter (t ha−1); Cveg—Canopy Cover (%); NDVI—Normalised Difference Vegetation Index; Significance codes: ** p < 0.05; * p < 0.1.
Table 7. Results of the Tukey HSD test for variables with normal distribution that showed significance.
VariableFactorComparativeDiffCI
(<95%)
CI
(>95%)
p-Value Adj.Significance
PHStrategyOptimise-Maximise−0.1167−0.2119−0.02150.0138**
Uniformise-Optimise0.16530.06240.26810.0012**
PlotC–G0.19030.00590.37470.0399**
CvegStrategyUniformise-Maximise0.17690.01280.34110.0325**
Uniformise-Optimise0.23860.07450.40280.0033**
NDVIStrategyUniformise-Optimise0.10470.04300.16640.0007**
PlotG-A0.12060.01200.22920.0225**
G-B0.12810.01950.23670.0133**
PH—Plant height (m); Cveg—Canopy cover (%); diff—Means differences; CI—Confidence Interval; Significance codes: ** p < 0.05.
Disclaimer/Publisher’s Note: The statements, opinions and data contained in all publications are solely those of the individual author(s) and contributor(s) and not of MDPI and/or the editor(s). MDPI and/or the editor(s) disclaim responsibility for any injury to people or property resulting from any ideas, methods, instructions or products referred to in the content.