Article

Impacts of Nitrogen Fertilization on Hybrid Bermudagrass During Deficit Irrigation

U.S. Arid-Land Research Center, U.S. Department of Agriculture, Agricultural Research Service, Maricopa, AZ 85138, USA
*
Author to whom correspondence should be addressed.
Grasses 2025, 4(2), 25; https://doi.org/10.3390/grasses4020025
Submission received: 4 April 2025 / Revised: 16 May 2025 / Accepted: 30 May 2025 / Published: 13 June 2025
(This article belongs to the Special Issue Advances in Sustainable Turfgrass Management)

Abstract

Fertilizer application is a critical component of turfgrass management as it influences growth, color, stress tolerance, and overall quality. However, limited information exists on how fertilizer application, particularly nitrogen (N), affects hybrid bermudagrass performance and actual plant evapotranspiration (ETa) in both well-watered and deficit irrigation scenarios. A 7-week greenhouse experiment was conducted over two replicated runs to evaluate responses of ‘TifTuf’ hybrid bermudagrass (Cynodon dactylon × C. traansvalensis Burtt Davy) to three nitrogen rates (0, 2.4, and 4.8 g N m−2 month−1) and three irrigation levels (1.0, 0.65, and 0.30 × ETa). Fertilized turfgrass exhibited 11–12% greater ETa compared to unfertilized turfgrass, with no significant differences between the two fertilizer rates. Under well-watered conditions (1.0 × ETa), the high nitrogen rate significantly improved visual quality (7.8) relative to the unfertilized control (7.1) and the low-rate treatment (7.4). High-rate fertilizer application significantly enhanced visual quality at both deficit levels (7.2 and 6.6, at 0.65 and 0.30 × ETa, respectively) compared to the unfertilized control (6.2 and 5.9, at 0.65 and 0.30 × ETa, respectively). At 0.30 × ETa, low-rate fertilizer application also significantly improved visual quality (7.0) compared to the unfertilized control. Soil nitrate-N levels increased with higher nitrogen application (1.30 ppm, 0.48 ppm, and 0.37 ppm, respectively, for high-rate, low-rate, and unfertilized), and shoot tissue analysis revealed greater N concentration in fertilized turfgrass (1.51%, 1.24%, and 0.85%, respectively, for high-rate, low-rate, and unfertilized). Clipping production and water use efficiency (WUE) were also improved with fertilization, although root development was hindered at the 0.30 × ETa irrigation level. These findings demonstrate that nitrogen fertilization improves visual quality, shoot growth, WUE, and drought response; however, tradeoffs such as elevated water use and nitrate-N leaching risk necessitate careful management to balance turfgrass performance with water conservation and ecosystem service preservation.

1. Introduction

Natural turfgrass areas provide numerous benefits to society and can improve ecosystem function in urban environments [1,2,3,4]. However, water inputs through irrigation are often necessary to sustain desired levels of quality while the risk of water shortages has increased due to population growth and drought [5,6,7]. As such, turfgrass managers are commonly under pressure to reduce water consumption and can encounter decreased water allocations or restrictions during times of peak demand [8]. Therefore, the judicious use of water for turfgrass irrigation through improved management practices must be prioritized.
A crop coefficient (Kc) value, or the optimal water application rate for turfgrass growth, is established by comparing actual turfgrass ET (ETa) to a reference ET (ETo) [9,10]. Irrigating below this value constitutes deficit irrigation [11] and can be an effective approach to conserving water while still providing visually acceptable and functional turfgrass surfaces [12]. Bermudagrass (Cynodon ssp.), and hybrid bermudagrass specifically (Cynodon dactylon × C. traansvalensis Burtt Davy), is a commonly used turfgrass species in hot and water-stressed areas and has a proven capacity to sustain acceptable quality while being subjected to deficit irrigation practices [13,14]. Overall, the Kc value to sustain the performance of hybrid bermudagrass is between 0.30 to 1.27 × ETo, for which the range is influenced by a variety of factors (e.g., climate, variety, abiotic stress, fertilization, growth regulators) [15]. In a field study conducted in College Station, Texas, USA, ‘Tifway’ hybrid bermudagrass could maintain adequate visual quality while being irrigated at 30% × ETo, if the turfgrass was not subjected to traffic stress [13]. In the arid environment of Tucson, Arizona, USA, 0.66 to 0.77 × ETo was required to sustain the acceptable quality of four different hybrid bermudagrass varieties [16]. While previous research has largely focused on determining the tolerable levels of specific varieties relative to a predetermined Kc or reference evapotranspiration (ETo) [17], few studies have considered the key management factors that are likely to influence these tolerance levels.
In Riverside, California, USA, Xiang et al., 2021 reported the tolerable irrigation level for ‘Tifway II’ hybrid bermudagrass was 55% × ETo if wetting agents were applied [18]. Mowing height has also been shown to influence warm-season turfgrass water use rates, irrigation requirements, and tolerance to drought and deficit irrigation [15,19,20,21,22]. As the demand for the supplied amenities of healthy turfgrass and strain regarding water supplies are likely to persist, more research is needed to guide other management considerations, such as proper fertilizer applications, to promote the improved efficiency of irrigation water use in turfgrass systems.
Apart from water, the application of nutrients through fertilization is among the primary inputs turfgrasses receive to promote a functional and aesthetically pleasing turfgrass system. The optimal rate or amount supplied is mostly governed by the turfgrass species used, the maintenance capabilities, and end-user preferences [23]. In studies evaluating the effect of fertility on water use, most have primarily focused on nitrogen (N) application, as it is the nutrient needed in the greatest quantity, and it significantly impacts turfgrass performance [24,25]. In multiple studies, increased N application rates or N fertilization have generally been shown to increase turfgrass ET. In a field lysimeter study of three sites containing common bermudagrass [Cynodon dactylon (L.) Pers.] overseeded with perennial ryegrass (Lolium perenne L.), there was a reported average 29% increase in plant ET for two of the three sites, which the authors attributed largely to increased fertility [26]. Barton et al., 2009 also found increased N fertility elevated ET in Kikuyugrass [Pennisetum clandestinum (Hochst. Ex Chiov)], primarily within the younger turfgrass plots within the study [27]. For ‘Merion’ Kentucky Bluegrass (Poa pratensis L.), Feldhake et al., 1983 reported a 13% increase in plant ET with monthly N applications during the growing season as compared to a yearly application [28]. In the same study, the authors reported that even though plots exhibited full cover, the decreased water use of lower fertility plots also resulted in decreased growth and less green color. Further, there are also reported cases of increased N application rates improving water use efficiency [29,30]. However, even with the known influence of fertility on plant water use, limited literature research is available regarding fertility management when water conservation measures such as deficit irrigation are implemented.
A greenhouse experiment was designed to determine how fertilizer application rates impact hybrid bermudagrass ET and drought tolerance during deficit irrigation. In this study, a greenhouse experiment was conducted over a 7-week period in which ETa and performance metrics were characterized for ‘TifTuf’ bermudagrass receiving irrigation at well-watered (1.0 × ETa) and deficit levels (0.65 and 0.30 × ETa), and three fertility treatments (0.0, 2.4, and 4.8 g N m−2 month−1). Furthermore, nitrogen amounts were assessed through soil and tissue sampling conducted at trial end.

2. Materials and Methods

2.1. Research Location and Design

This study was conducted in two greenhouses at the U.S Arid Land Agricultural Research Center in Maricopa, Arizona, over a 7-week period in Fall 2024. The study was replicated concurrently across two separate runs (both initiated 3 October 2024) in the separate greenhouses. Air temperature and relative humidity were monitored using an HC2S3 probe (Rotronic Instrument Corp, Hauppauge, NY, USA) housed within a radiation shield (R.M. Young Comp., Traverse City, MI, USA). The average daytime temperature was 30.5 °C and 33.2 °C for Greenhouse 1 and 2, respectively. The greenhouse temperatures for this experiment adequately represent the typical growing conditions for hybrid bermudagrass in Arizona, relevant to turfgrass management practices under heat-stressed environments. Solar radiation was monitored using an SP-110 pyranometer (Apogee Instruments, Logan, UT, USA), and photosynthetic active radiation (PAR) was monitored using an SQ-500 full-spectrum quantum sensor (Apogee Instruments, Logan, UT, USA). Average daily values for relative humidity, solar radiation, and PAR are reported in Table 1.
Fifty-four ‘TifTuf’ hybrid bermudagrass (Cynodon dactylon x C. traansvalensis Burtt Davy) sod plugs 14 cm diameter in size were extracted from nearby field plots and washed free from soil, leaving only the verdure and stem tissue for planting. This particular turfgrass is a modern turfgrass cultivar that exhibits excellent drought resistance and low irrigation requirements to sustain high quality [31]. The field plots from which the sod plugs were extracted were planted from sod the year prior (2023) and were fertilized at a rate of 2.4 g N m−2 four weeks before extraction using a granular 21-7-14 fertilizer. The sod plugs were then established in 54 individual lysimeters constructed from polyvinyl chloride pipe (15.2 cm diameter × 30.5 cm depth). Lysimeters were filled with a United States Golf Association (USGA) specification sand [90:10 (vol:vol) sand:peat moss]. A 10 mm hole was drilled at the bottom of each lysimeter to allow drainage for the plant, and a seed guard cloth (DeWitt, Sikeston, MO, USA) was laid at each base to avoid sand spillage. All lysimeters were allowed to establish for an 11-week period prior to trial initiation. During this period, all lysimeters were maintained in a well-watered state, in which they were watered daily during the first week of establishment and three times weekly thereafter to ensure successful establishment. Half of the 54 lysimeters were moved to an adjacent greenhouse one week prior to trial initiation while the other half were kept in the original greenhouse.

2.2. Fertilizer Treatments

Both runs were arranged in a completely randomized design to support a 3 N rate × 3 irrigation level factorial. The 3 fertilizer rate treatments consisted of 0.0 g N m−2 month−1, 2.4 g N m−2 month−1, and 4.8 g N m−2 month−1, hereafter referred to as unfertilized, low-rate, and high-rate, respectively. The two N rate amounts were chosen to represent the typically recommended monthly application of an N-carrying fertilizer, which falls between 0.5–1.0 lb. N 1000 ft2 (2.4–4.8 g N m2) [32,33], and correlates directly to the low and high rates chosen in this study. For the two fertilized treatments, applications occurred at week 1 (3 Oct. 2024) and week 5 (5 Nov. 2024). Fertilizer component fractions were 21-7-14 (N-P-K), and in granular form (Turf Royale, YaraMila, Tampa, FL, USA), with N supplied by ammoniacal-N (11.1%) and nitrate-N (9.9%).

2.3. Irrigation Treatments

Irrigation treatments consisted of a well-watered treatment (100% × ETa) and two deficit treatments (0.65 × ETa and 0.30 × ETa); hereafter, the deficit treatments are referred to as mild and moderate deficit, respectively. This irrigation treatment range has been used in previous experiments to assess turfgrass performance under optimum growing conditions and drought tolerance under limited irrigation [20]. Two days prior to experiment initiation, all lysimeters were brought to field capacity by fully submerging them in water until air bubbles had ceased, indicating saturation had been reached (≈4-min submersion). After saturation, lysimeters were drained freely for 30 h, and field capacity weights were recorded to be used as reference for the well-watered treatments (100% × ETa) during future weighing and irrigation events. In the well-watered treatment, actual evapotranspiration (ETa) was determined by weighing twice weekly and calculating mean mass change from previously recorded field capacity measurements. Exact mass change amounts were supplied to each well-watered lysimeter, and average replacement levels (0.65 or 0.30 × ETa) within each run were supplied to the deficit treatments. Average replacement levels were separated by experimental run and by each fertilizer treatment.

2.4. Turfgrass Performance Evaluations

Turf quality was determined through weekly turf quality rankings using a modified National Turfgrass Evaluation Program (NTEP) rating scale (scale 1–9, minimum acceptable quality = 5) [34]. The quality ratings accounted for a combination of color, density, and uniformity of the turfgrass canopy. For reference, a rating of 1 indicated complete leaf firing due to water stress, while a rating of 5 denoted minimum acceptable quality, and a rating of 9 represented perfectly green turf that is fully dense and dark green.
Growth was assessed through regular clipping collections. On each lysimeter, the turfgrass was trimmed to a 2.0 cm height every 7–14 days using scissors and a ruler. After each collection, the clippings were oven-dried for 72 h at 65 °C and weighed to calculate the daily growth rate of the turfgrass for each lysimeter. At the end of the study period, roots were harvested from each lysimeter and oven-dried in the same manner as the clippings to determine root dry weight. Roots were harvested by using water to wash them free of soil and careful separation from stem tissue. For each lysimeter, total clipping production was divided by total water use to determine water use efficiency (WUE) throughout the study period (mg clipping weight per mL of water used).

2.5. Shoot and Soil Nutrient Assessments

Nutrient status in both shoot and soil was evaluated at trial end by collecting soil samples from each lysimeter and a complete leaf tissue harvesting. At the time soil and tissue samples were collected, two fertilizer applications had already taken place on the two fertilized treatments, with the first being 7 weeks prior and the second 2 weeks prior. Soil was mixed for each lysimeter and a 100 g sample was collected for analysis. For soil analysis, inorganic N and exchangeable acidity were extracted using KCl, and N levels were expressed as nitrate-N (ppm). Leaf tissue samples were freeze-dried and analyzed on a LECO CN-2000 (LECO corp., St. Joseph, MI, USA) dry combustion analyzer. The analyzer operated on a dry combustion principle with thermal-conductivity detection for N. Aliquots (0.5 g) of samples, including reference samples, subjected to acid digestion (nitric acid). The samples were then analyzed for their total concentrations of N (%) with a quadrupole ICP-MS instrument equipped with a collision/reaction cell.

2.6. Analysis of Data

The data for all parameters were subjected to analysis of variance (ANOVA) in JMP 18.1.2 (SAS Institute, Cary, NC, USA). Mean separation procedures were performed using Tukey’s honestly significant difference test at p ≤ 0.05.

3. Results and Discussion

3.1. Effects of Fertilizer Application on ET Rate

For the effect of fertilizer application on ETa, data from both experimental runs were combined as there was no significant run effect observed (Table 2). When averaged across runs, fertilizer application had a significant effect on daily ETa, and values (5.8 to 6.7 ± 0.1 mm d−1) were within the previously reported values for bermudagrass in well-watered conditions [16]. Both the low-rate and high-rate fertilizer treatments ETa (6.7 and 6.6 mm day−1, respectively) were significantly higher than the unfertilized treatment (5.8 mm day−1). In the 7-week study period, this equated to an 11–12% increase in ETa from fertilization, which is consistent with prior research for bermudagrass where Devit et al., 1992 attributed a 29% increase in ETa to fertilization over a 24-month measurement period [26]. Further, Feldhake et al., 1983 reported a 13% increase in water use on ‘Merion’ Kentucky bluegrass (Poa pratensis L.) when fertilizer was applied monthly during the growing season of May to August, compared to a single application during the growing season [28]. While no differences in average ETa were detected between the two fertilizer rates in our study, Barton et al., 2009 reported greater ET on Kikuyugrass [Pennisetum clandestinum (Hochst. Ex Chiov)], as N application was increased from 50 kg N ha−1 yr−1 to 100 kg N ha−1 yr−1 (5 g/m2 year−1 to 10 g/m2 year−1, respectively) [27].

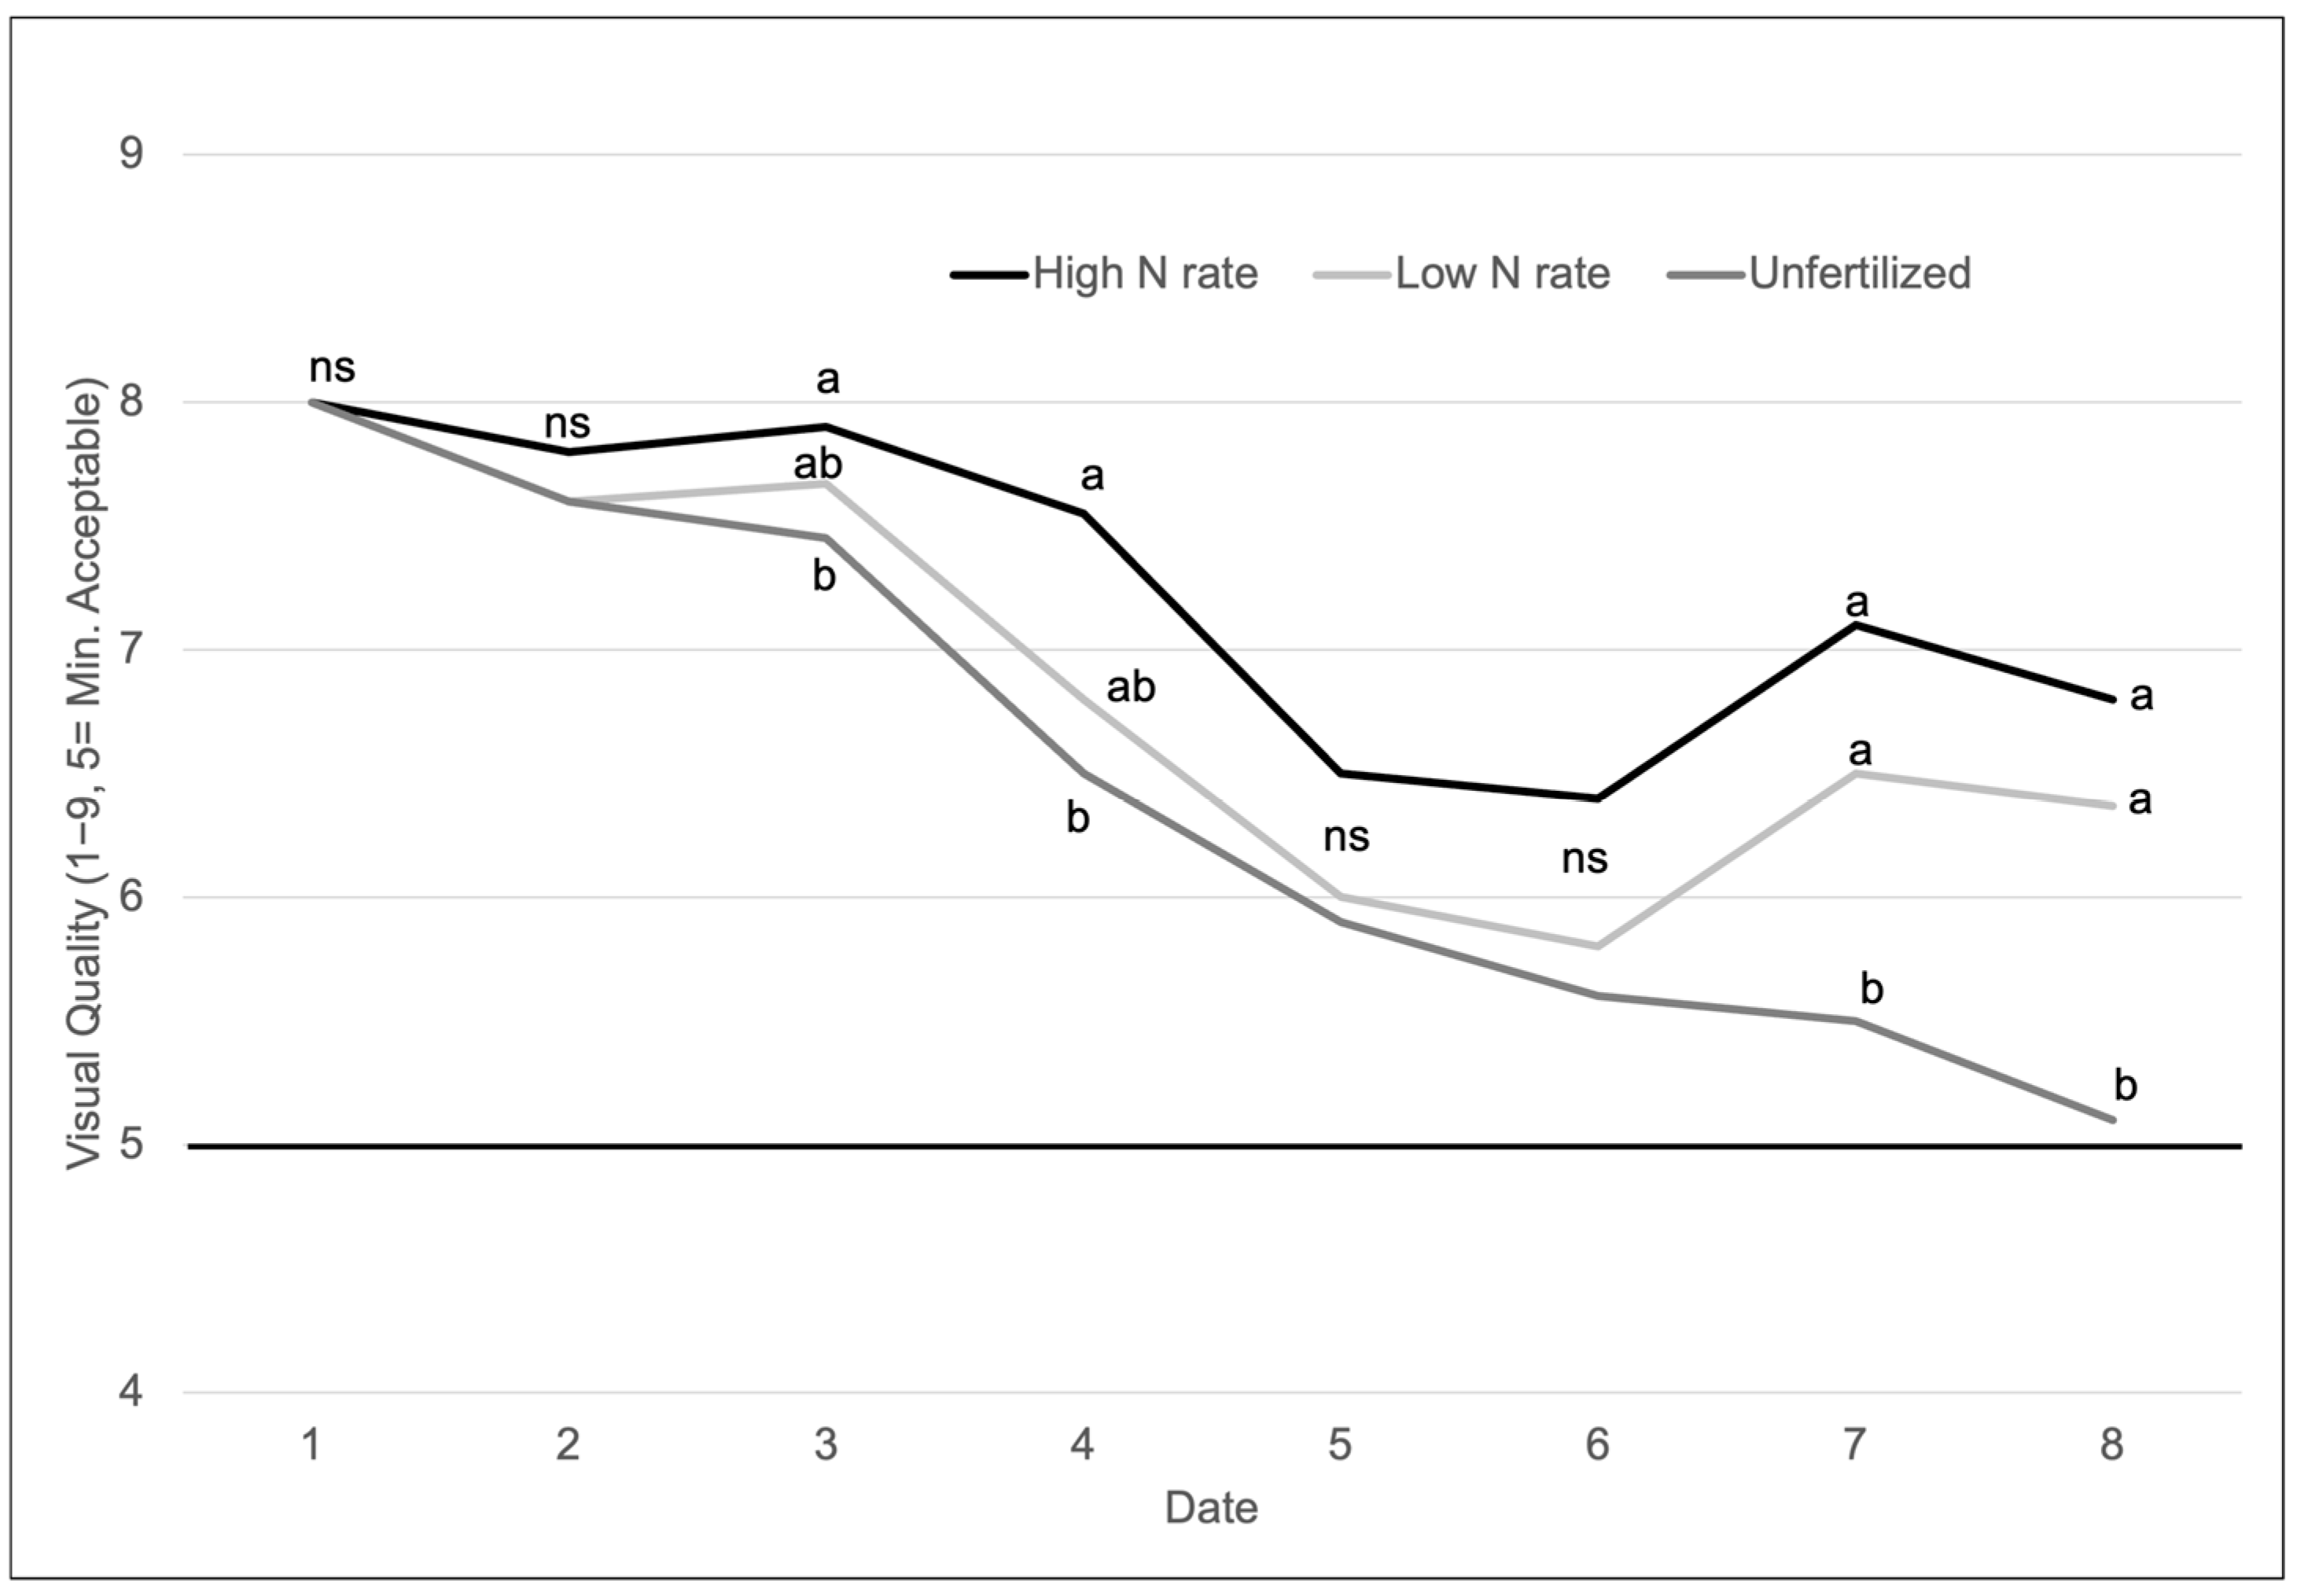
3.2. Fertilizer and Deficit Irrigation Effects on Visual Quality

For visual quality, data from both runs were combined as no significant run effect was detected. Analysis of variance (ANOVA) revealed a significant fertilizer × irrigation level interaction for which a general trend of increased fertilizer and irrigation levels resulted in improved visual quality (Table 2). At the well-watered irrigation level, visual quality was highest for the high-rate fertilizer × well-watered treatment compared all other treatment combinations (Table 2). Further, visual quality of thelow rate fertilizer × well-watered treatment combination was significantly higher than all other combinations, with exception for the high-rate fertilizer × mild deficit and unfertilized × well-watered. treatments. Overall, added fertility improved visual quality at irrigation deficit as both fertilized treatments produced a significantly higher values than unfertilized, with expecption for the moderate deficit comparisons at the low-rate fertilizer and unfertilized (Table 3). These results are generally consistent with that of Feldhake et al., 1983 in which N deficient turfgrass required less water use but caused a general decline in turfgrass vigor and color [28]. Further, results of Barton et al., 2009 suggested that in young turfgrass systems, lowered water use could be achieved with foregoing fertilizer applications but at the sacrifice of reducing turfgrass quality [27].
For visual quality, ANOVA also revealed significant fertilizer × date and irrigation level × date interactions (Table 2). In the fertilizer × date interaction, there was a general decline in visual quality for all fertilizer levels after week 3, with the high-rate fertilizer treatment outperforming the unfertilized treatment on four rating dates (weeks 3, 4, 7, and 8) (Figure 1). While there were no significant differences between the high-rate and low-rate fertilizer treatments at any specific rating date, the low-rate treatment outperformed the unfertilized treatment on the last two rating dates (weeks 7 and 8). While minimum visual quality for the unfertilized treatment was maintained, there was an apparent decline by week 7. This further reveals the importance of fertilization for maintaining visually appealing turfgrass and healthy stands long-term as hybrid bermudagrass requires added fertility for adequate performance [32,33].
For the irrigation level × date interaction, the well-watered treatment generally outperformed the deficit treatments starting at week 3, with the only similar ratings occurring between the well-watered and mild deficit treatments occurring at weeks 3 and 7 (Figure 2). The mild deficit treatment maintained an average visual quality that was well above the minimum threshold throughout the study period, and the moderate deficit treatment only fell below minimum quality at weeks 6 and 8. These results are consistent with previously reported greenhouse lysimeter studies in which hybrid bermudagrass was able to maintain acceptable visual quality at low ET replacement until the later stages of the study periods [20,35]. This finding suggests that even within a soil moisture-limiting root zone (limited soil profile), hybrid bermudagrass can withstand short-term irrigation deficit as low as 0.3 × ETa replacement without sacrificing severe losses of visual turfgrass quality.

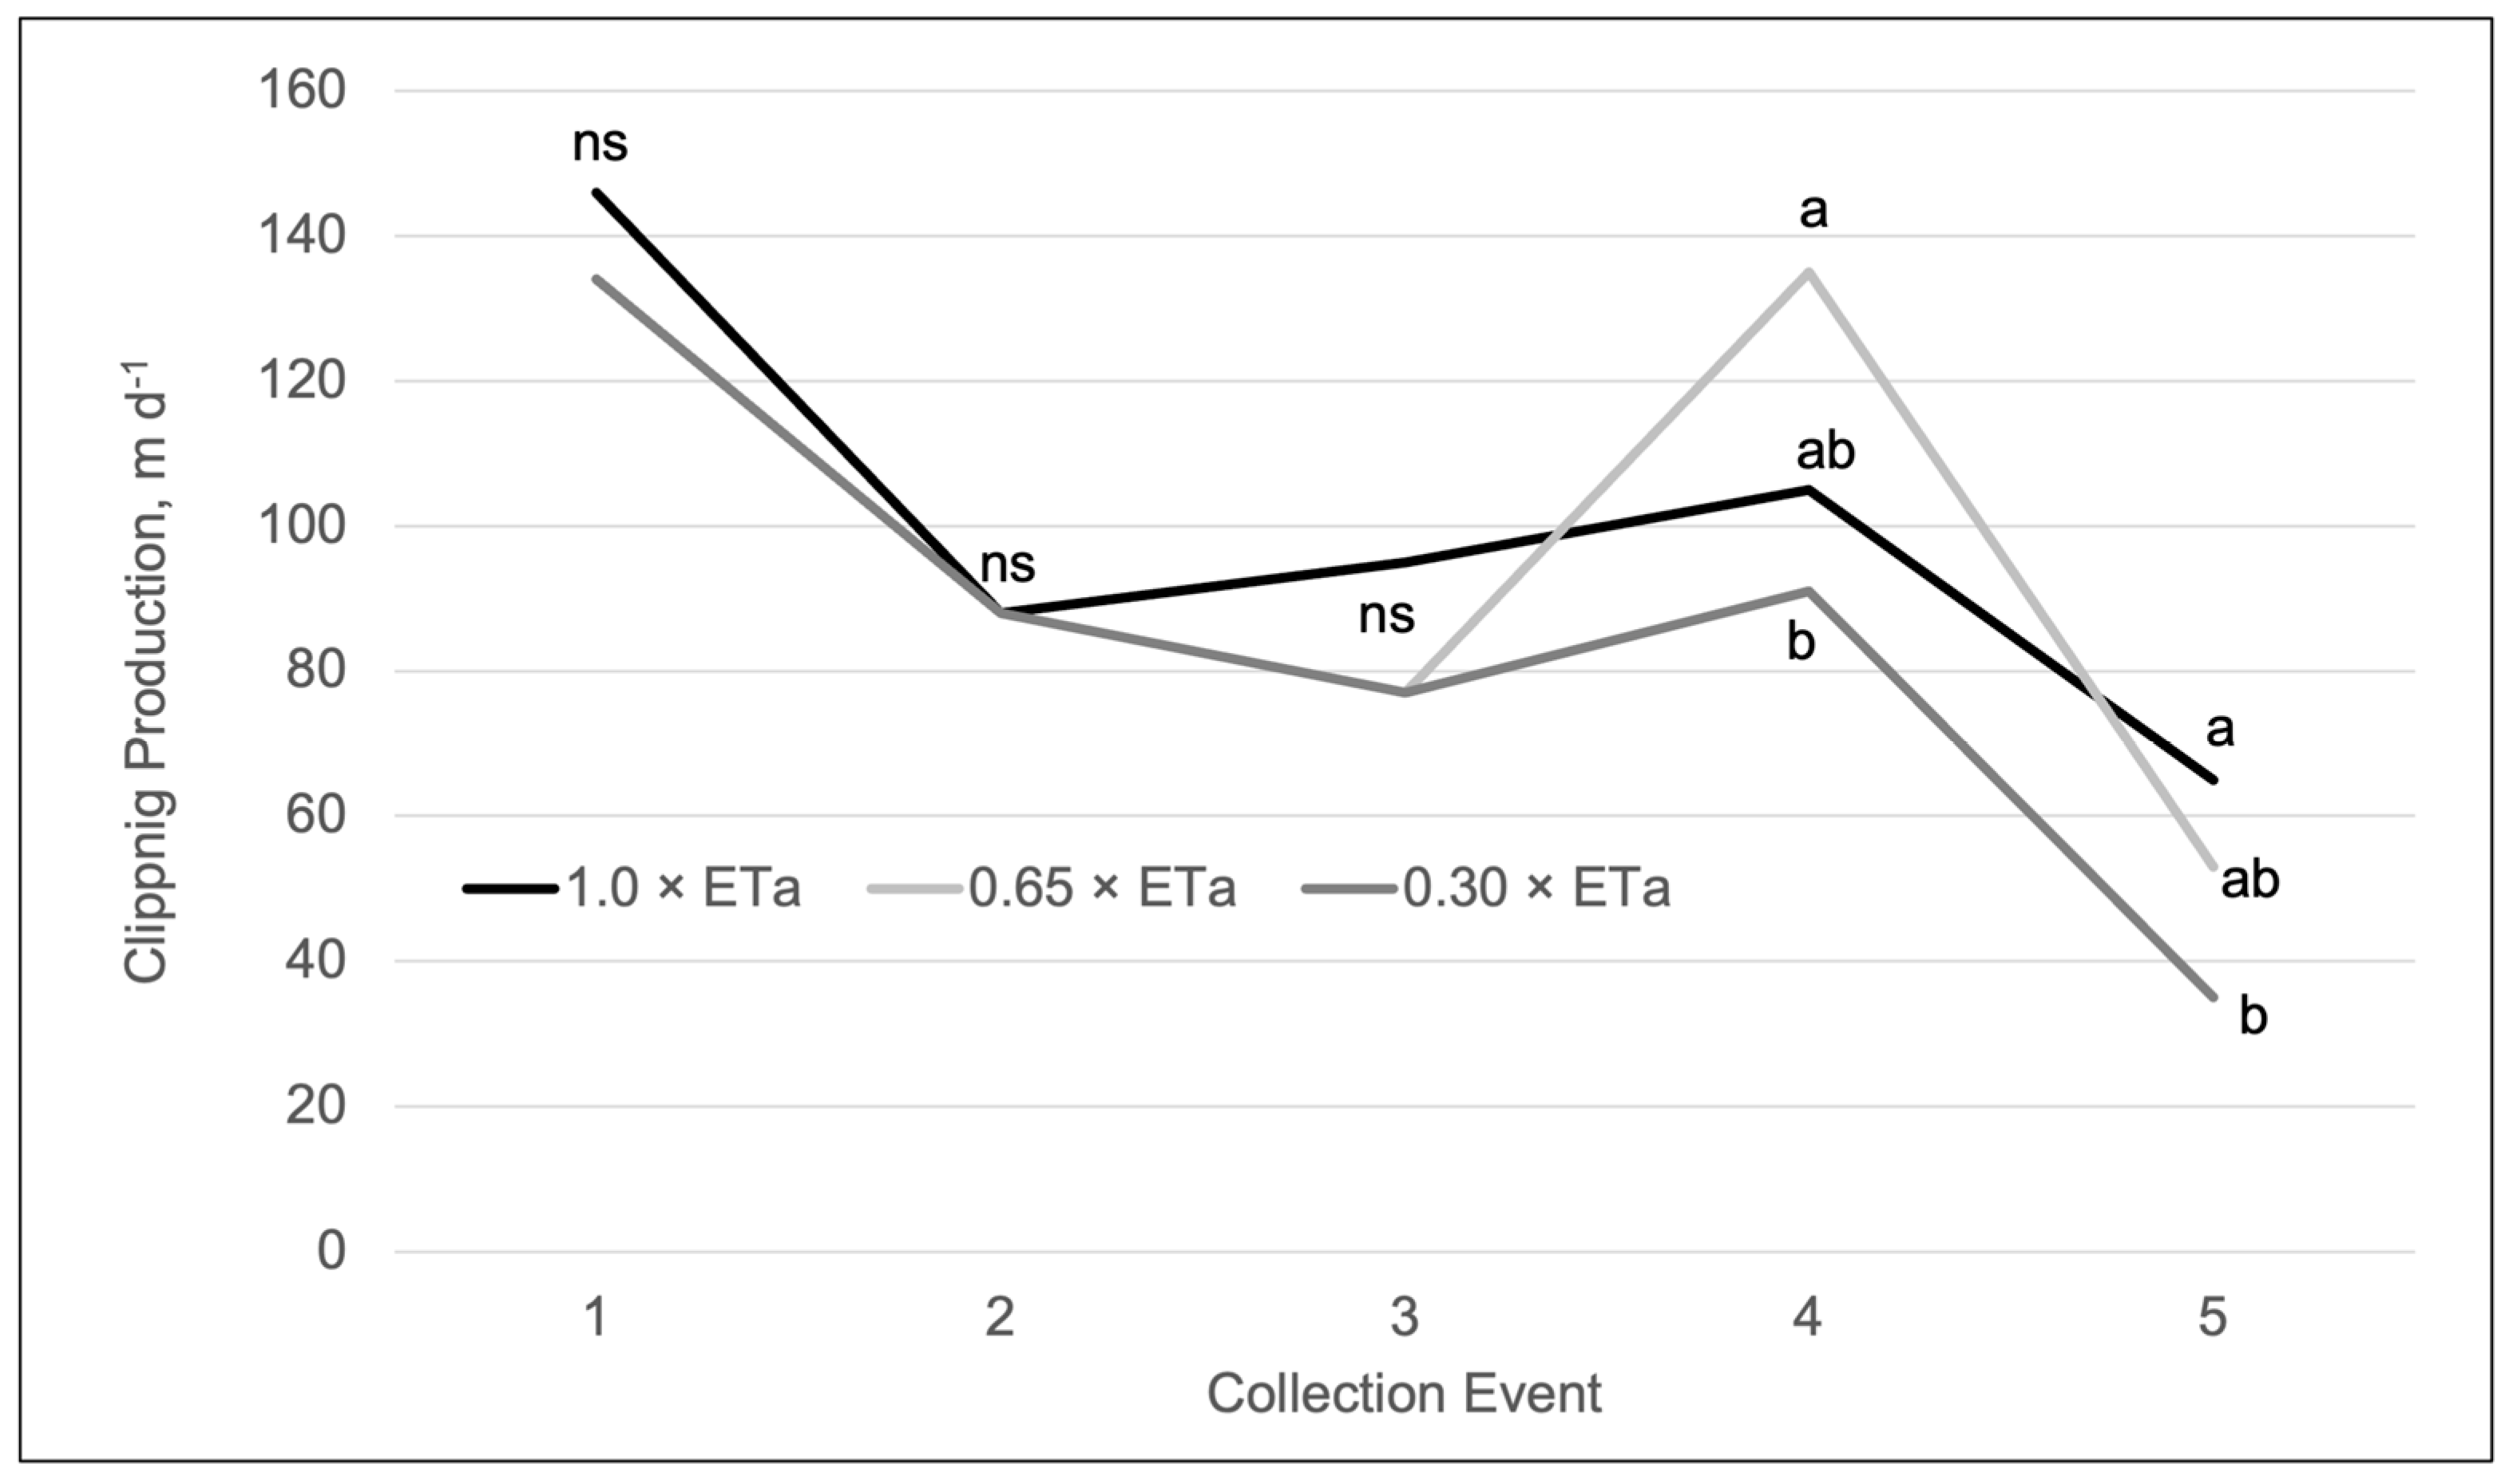
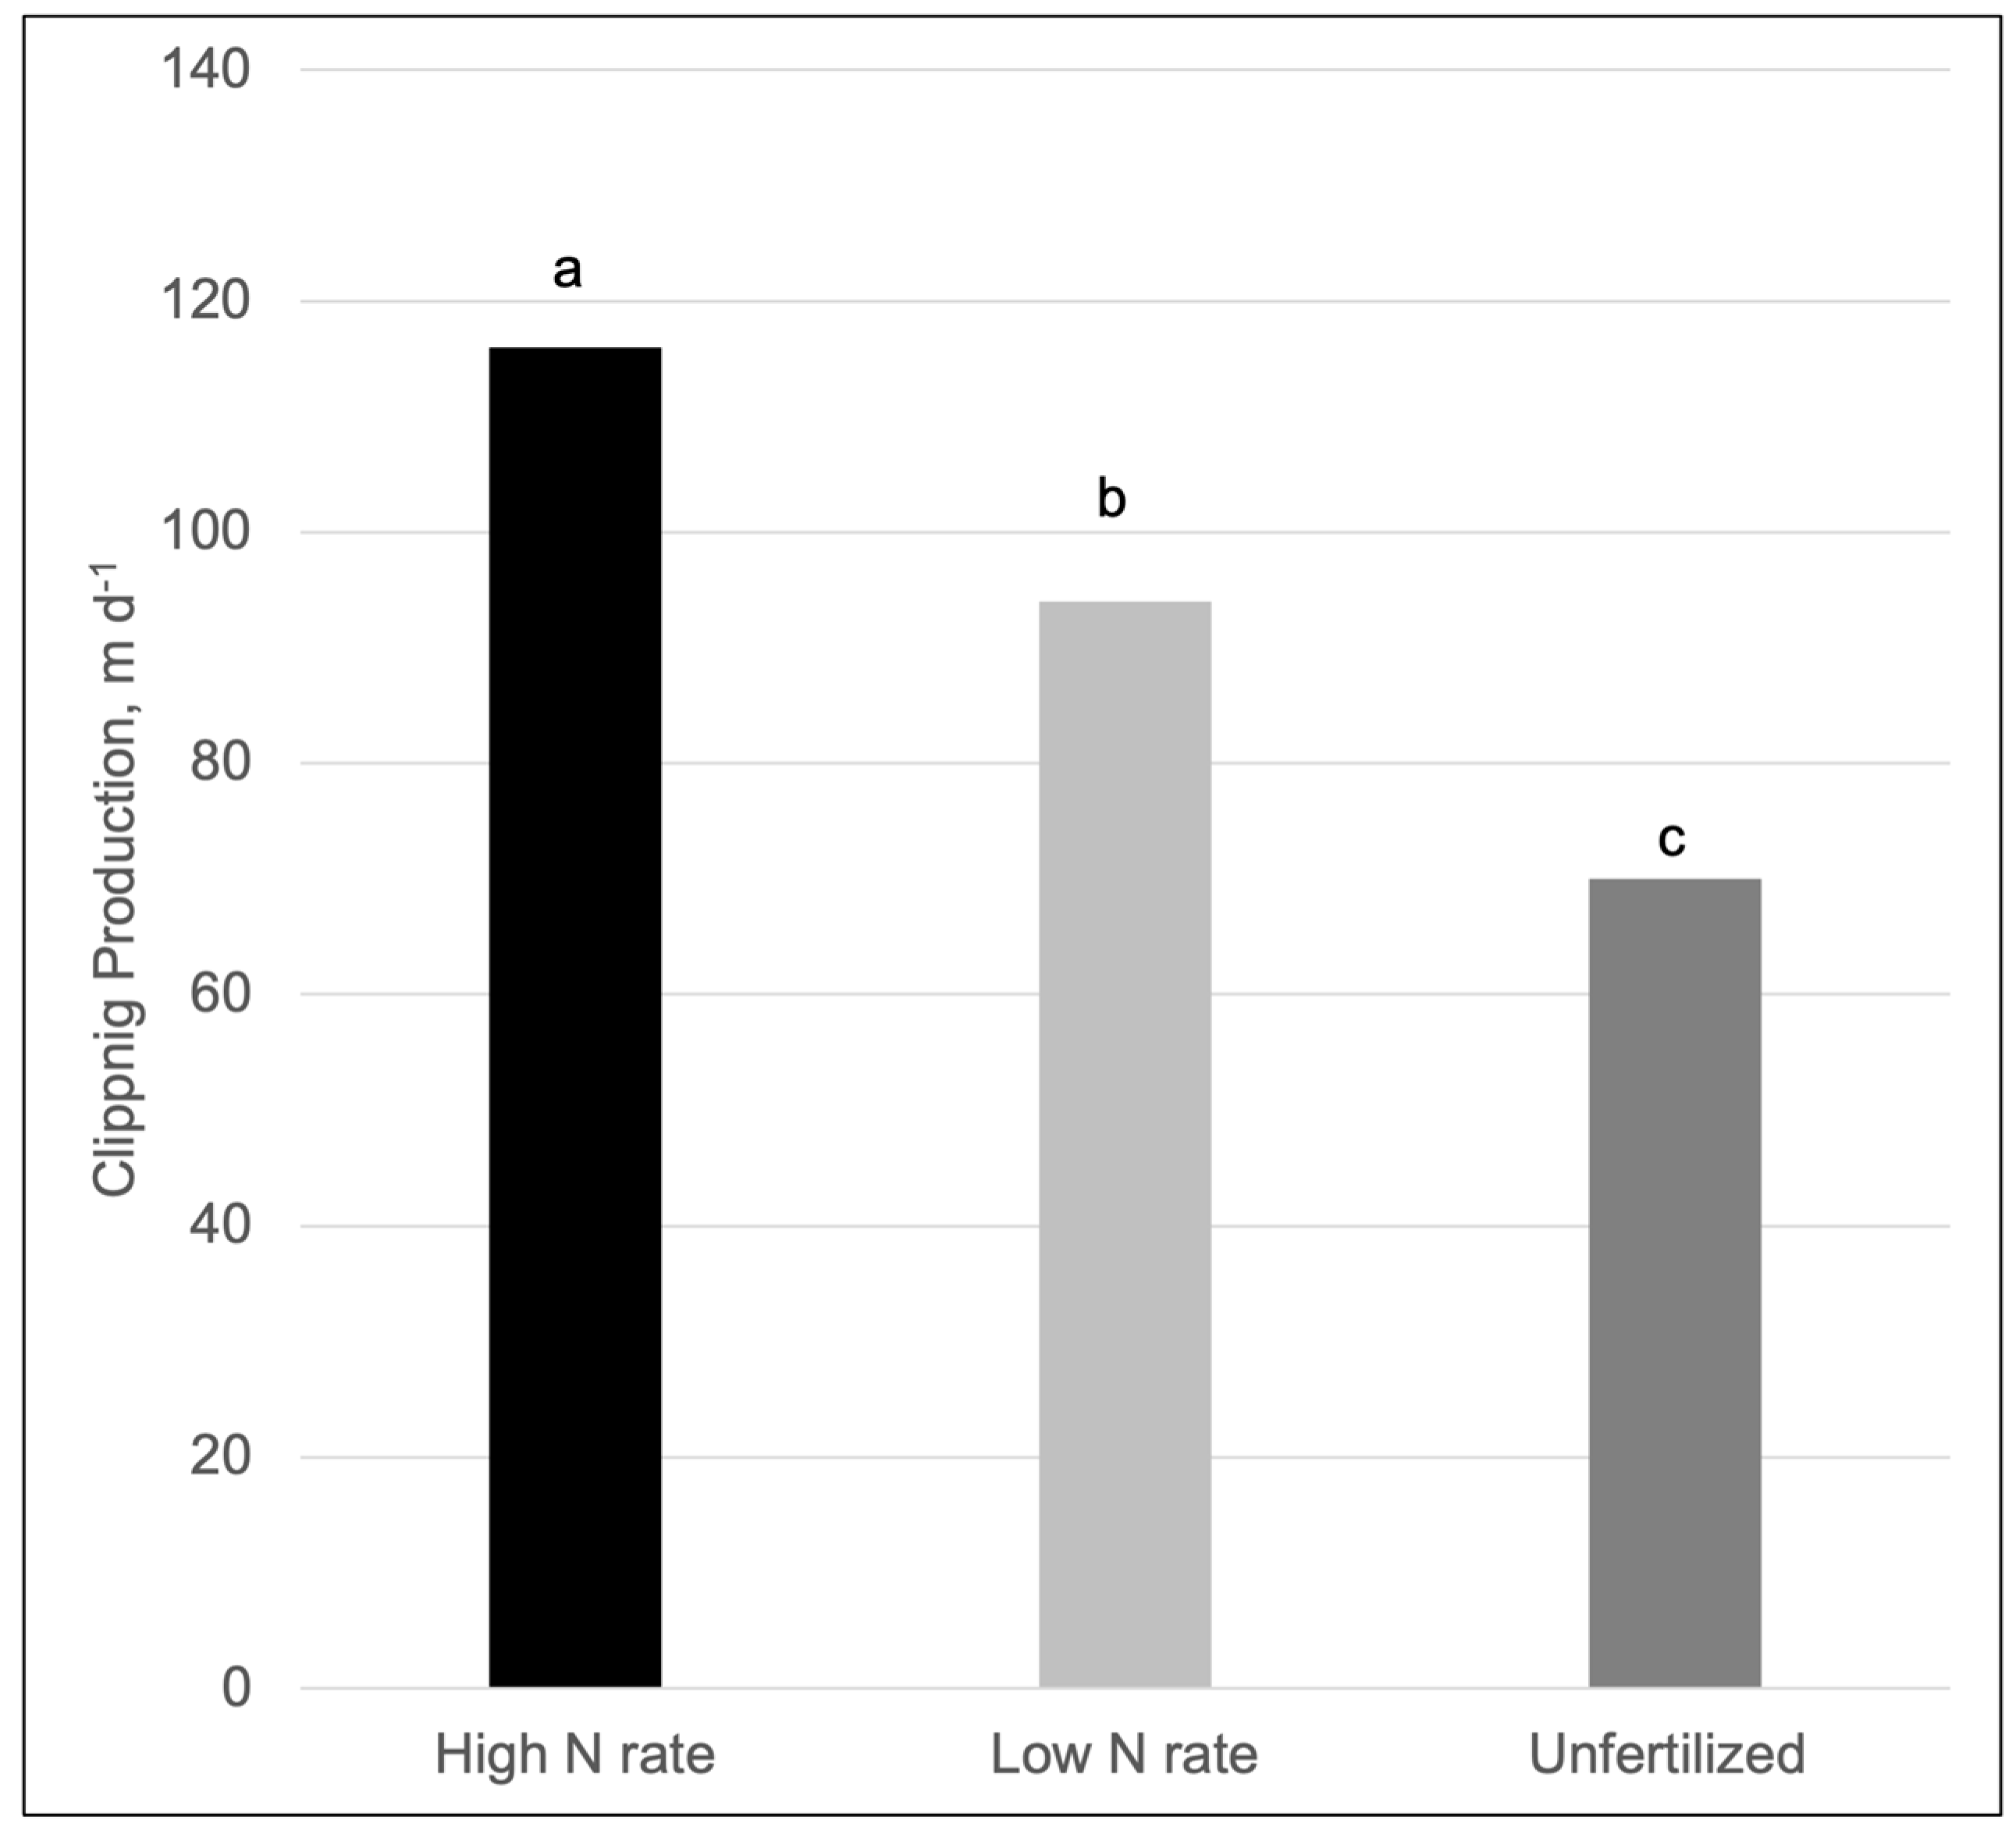
3.3. Impacts on Clipping Production and WUE

For clipping production, there was a significant irrigation level × date (collection event) interaction, which showed diminished biomass production for the moderate deficit treatment compared to the mild deficit treatment at collection event 4, and for the well-watered treatment at date 5 (Table 2; Figure 3). These results are likely linked to a lowered photosynthetic capacity, and therefore diminished carbohydrate production, as irrigation deficit stress persists over time [36].
ANOVA also revealed a significant main effect due to fertilizer application, for which clipping production was greatly reduced in the unfertilized lysimeters and was highest for lysimeters receiving fertilizer at a high rate (Table 2; Figure 4). This growth response is likely due to increased chlorophyll production, and therefore improved photosynthetic capacity, as fertility is increased. These results are consistent with the ET differences between the fertilized and unfertilized treatments, as increased transpiration leads to increased biomass production [37,38]. More efficient use of applied water as fertility increased was also revealed, as WUE was higher for fertilized versus unfertilized lysimeters, with WUE for the high-rate treatment also being higher than that of the low-rate treatment (Table 2 and Table 4). Previous studies have also reported N fertilization increasing WUE on both perennial ryegrass (Lolium perenne L. ‘Pennfine’) and zoysiagrass (Zoysia japonica Steud.) [29,30]. Erickson and Kenworthy 2011 also reported that N fertilization had a greater effect on increasing the carbon exchange rate than it did on increasing average daily ET [29]. These findings combined with the current study support the presumption that water savings can result from lowering N fertilization; however, this will be at the expense of lowered carbon assimilation for growth per unit of water uptake.

3.4. Fertilizer Application and Irrigation Level Effects on Soil and Shoot Nitrogen Content

Soil tests revealed the high-rate fertilizer treatment contained the highest nitrate-N compared to both the low-rate and the unfertilized treatment, with no significant differences for soil nitrate-n between the low-rate and unfertilized treatments (Table 2 and Table 5). Fertilizing at the high rate resulted in a 1.7–2.6 factorial increase in soil nitrate-n at week 7 compared to the low-rate and unfertilized treatments, respectively. While this is a significant increase in nitrate-N available for plant growth, nutrient leaching due to unforeseen rain or heavy irrigation events on coarse-textured soils could lead to nitrogen being lost from the system with negative financial or environmental impacts [39,40].
Shoot testing revealed significant main effects of fertilizer application, in which the highest N percent assimilations occurred at the high-rate fertilizer treatment along with higher N percentage comparing the low-rate vs. unfertilized treatment (Table 2 and Table 5). These results are consistent with the observed growth responses where increased fertility may have corresponded to greater chlorophyll production and therefore improved photosynthetic capacity [41].
Irrigation level also had a significant effect on N in shoots. No significant differences were apparent for N percentage between both deficit irrigation levels (mild and moderate), and both were significantly lower than that of the well-watered treatment (Table 2 and Table 5). This finding suggests that lowering plant water availability through deficit irrigation inhibits N assimilation in shoots from applied inorganic N sources [42].

3.5. Impacts on Root Development

No effect of fertilizer application was detected on root dry weights; however, there was a significant irrigation level effect (Table 2). The irrigation effect revealed higher root dry weights at the mild deficit irrigation level compared to the moderate deficit level (Table 6). This finding suggests a possible breaking point of reduced root growth when irrigation is significantly reduced since non-significantly different root dry weights were found between the mild deficit and well-watered treatments, at least for this hybrid bermudagrass. In the second season of a field experiment, Hejl et al., 2016 also found reduced root dry weight of ‘Tifway’ hybrid bermudagrass at the two lowest irrigation treatment levels (unirrigated and 0.30 × ETo), compared to both 0.6 × ETo and 0.45 × ETo [14]. The findings for both studies suggest the limited root growth is a result of withholding irrigation to a certain extent, where prolonged exposure can hinder the success of these grasses.

4. Conclusions

Growing pressures on water availability are driving the need for increased water conservation in turfgrass landscapes. Therefore, it is essential to understand how key management practices such as N fertilization influence turfgrass ET, quality, growth, and water use efficiency, particularly when deficit irrigation strategies are implemented. In this experiment, fertility resulted in improved visual quality, higher WUE, and greater N assimilation in shoots in both well-watered and deficit irrigation conditions compared to unfertilized turfgrass. Our findings indicate that although water savings can be achieved by withholding N application, this may come at the cost of diminished turfgrass performance. However, turfgrass managers should carefully weigh the tradeoffs of N fertilization, including the risks of increased N loss and higher water use. Future research should explore these dynamics across different turfgrass species and cultivars and incorporate longer-term field studies with unrestricted root zones to further inform improved management practices.

Author Contributions

Conceptualization, R.W.H.; methodology, R.W.H., M.M.C. and J.G.F.; software, R.W.H. and M.M.C.; validation, R.W.H. and M.M.C.; formal analysis, R.W.H. and M.M.C.; investigation, R.W.H., M.M.C. and J.G.F.; resources, R.W.H., J.G.F., C.F.W., D.D.S. and M.M.C.; data curation, R.W.H., M.M.C. and J.G.F.; writing-original draft preparation, R.W.H.; writing-review and editing, R.W.H., M.M.C., J.G.F., C.F.W. and D.D.S.; visualization, R.W.H., J.G.F., D.D.S. and M.M.C.; supervision, R.W.H. and M.M.C.; project administration, C.F.W., D.D.S. and R.W.H.; funding acquisition, C.F.W., D.D.S. and R.W.H. All authors have read and agreed to the published version of the manuscript.

Funding

This research was part of USDA-ARS National Program 215: Pastures, Forage, and Rangeland Systems.

Data Availability Statement

All the data have been included in the main text.

Acknowledgments

The authors wish to express appreciation to Sharette Rockholt for their valuable technical support.

Conflicts of Interest

The authors declare no conflicts of interest.

References

  1. Braun, R.C.; Mandal, P.; Nwachukwu, E.; Stanton, A. The role of turfgrasses in environmental protection and their benefits to humans: Thirty years later. Crop Sci. 2024, 64, 2909–2944. [Google Scholar] [CrossRef]
  2. Brosnan, J.T.; Chandra, A.; Gaussion, R.E.; Kowalewski, A.; Leinauer, B.; Rossi, F.S.; Soldat, D.J.; Steir, J.C.; Unruh, J.B. A justification for continued management of turfgrass during economic contraction. Agric. Environ. Lett. 2020, 5, e20033. [Google Scholar] [CrossRef]
  3. Erickson, J.E.; Cisar, J.L.; Volin, J.C.; Snyder, G.H. Comparing Nitrogen Runoff and Leaching between Newly Established St. Augustinegrass Turf and an Alternative Residential Landscape. Crop Sci. 2001, 41, 1889–1895. [Google Scholar] [CrossRef]
  4. Maas, J.; van Dillen, S.M.E.; Verheij, R.A.; Groenewegen, P.P. Social contacts as a possible mechanism behind the relation between green space and health. Health Place 2009, 15, 586–595. [Google Scholar] [CrossRef] [PubMed]
  5. Arfanuzzaman, M.; Rahman, A.A. Sustainable water demand management in the face of rapid urbanization and ground water depletion for social-ecological resilience building. Glob. Ecol. Conserv. 2017, 10, 9–22. [Google Scholar] [CrossRef]
  6. Hatfield, J.L.; Thomas, J.S.; Cruse, R.M. Soil: The forgotten piece of the water, food, energy nexus. Adv. Agron. 2017, 143, 1–46. [Google Scholar]
  7. Sisser, J.M.; Nelson, K.C.; Larson, K.L.; Ogden, L.A.; Polsky, C.; Chowdhury, R.R. Lawn enforcement: How municipal policies and neighborhood norms influence homeowner residential landscape management. Landsc. Urban. Plan. 2016, 150, 16–25. [Google Scholar] [CrossRef]
  8. Shaddox, T.W.; Unruh, J.B.; Johnson, M.E.; Brown, C.D.; Stacey, G. Water use and management practices on US golf courses. Crop Forage Turf. S Man. 2022, 8, e20182. [Google Scholar] [CrossRef]
  9. Allen, R.G.; Pereira, L.S.; Raes, D.; Smith, M. Crop evapotranspiration: Guidelines for computing crop water requirements. In FAO Irrigation and Drainage Paper 56; FAO: Rome, Italy, 1998. [Google Scholar]
  10. Wherley, B.; Dukes, M.D.; Cathey, S.; Miller, G.; Sinclair, T. Consumptive water use and crop coefficients for warm-season turfgrass species in the southeastern United States. Agric. Water Manag. 2015, 156, 10–18. [Google Scholar] [CrossRef]
  11. Feldhake, C.M.; Danielson, R.E.; Butler, J.D. Turfgrass evapotranspiration. II. Responses to deficit irrigation. Agron. J. 1984, 76, 85–89. [Google Scholar] [CrossRef]
  12. Fu, J.; Fry, J.; Huang, B. Minimum water requirements of four turfgrasses in the transition zone. HortScience 2004, 39, 1740–1744. [Google Scholar] [CrossRef]
  13. Wherley, B.; Heitholt, J.; Chandra, A.; Skulkaew, P. Supplemental irrigation requirements of zoysiagrass and bermudagrass cultivars. Crop Sci. 2014, 54, 1823–1831. [Google Scholar] [CrossRef]
  14. Hejl, R.W.; Wherley, B.G.; White, R.H.; Thomas, J.C.; Fontanier, C.H. Deficit irrigation and simulated traffic on ‘Tifway’ bermudagrass summer performance and autumn recovery. Crop Sci. 2016, 56, 809–817. [Google Scholar] [CrossRef]
  15. Colmer, T.D.; Barton, L. A review of warm-season turfgrass evapotranspiration, responses to deficit irrigation, and drought resistance. Crop Sci. 2017, 57, S-98–S-110. [Google Scholar] [CrossRef]
  16. Braun, R.C.; Bremer, D.J.; Ebdon, J.S.; Fry, J.D.; Patton, A.J. Review of cool-season turfgrass water use and requirements: I. Evapotranspiration and responses to deficit irrigation. Crop Sci. 2022, 62, 1661–1684. [Google Scholar] [CrossRef]
  17. Banuelos, J.B.; Walworth, J.L.; Brown, P.W.; Kopec, D.M. Deficit irrigation of Seashore Paspalum and Bermudagrass. Agron. J. 2011, 103, 1567–1577. [Google Scholar] [CrossRef]
  18. Xiang, M.; Schiavon, M.; Orlinski, P.; Forconi, A.; Baird, J.H. Identification of wetting agents for water conservation on deficit-irrigated hybrid bermudagrass fairways. Agron. J. 2021, 113, 3846–3856. [Google Scholar] [CrossRef]
  19. Biran, I.; Bravdo, B.; Bushkin-Harav, I.; Rawitz, E. Water consumption and growth rate of 11 turfgrasses as affected by mowing height, irrigation frequency, and soil moisture. Agron. J. 1981, 73, 85–90. [Google Scholar] [CrossRef]
  20. Hejl, R.W.; Conley, M.M.; Serba, D.D.; Williams, C.F. Mowing Height Effects on ‘TifTuf’ Bermudagrass during Deficit Irrigation. Agronomy 2024, 14, 628. [Google Scholar] [CrossRef]
  21. Shahba, M.A.; Abbas, M.S.; Alshammary, S.F. Drought resistance strategies of seashore paspalum at different mowing heights. HortScience 2014, 49, 221–229. [Google Scholar] [CrossRef]
  22. Zhou, Y.; Lambrides, C.J.; Kearns, R.; Ye, C.; Fukai, S. Water use, water use efficiency and drought resistance among warm-season turfgrasses in shallow soil profiles. Funct. Plant Biol. 2012, 39, 116–125. [Google Scholar] [CrossRef] [PubMed]
  23. Landschoot, P. Turfgrass Fertilization: A Basic Guide for Professional Turfgrass Managers. Available online: https://extension.psu.edu/turfgrass-fertilization-a-basic-guide-for-professional-turfgrass-managers (accessed on 17 September 2024).
  24. Hull, R.J. Nitrogen usage by turfgrasses. Turfgrass Trends 1996, 5, 6–14. [Google Scholar]
  25. Munson, R.D. Principles of plant analysis. In Handbook of Reference Methods for Plant Analysis; CRC Press Taylor & Francis Group: Boca Raton, FL, USA, 1998; pp. 1–24. [Google Scholar]
  26. Devitt, D.A.; Morris, R.L.; Bowman, D.C. Evapotransportation, crop coefficients, and leaching fractions of irrigated desert turfgrass systems. Agron. J. 1992, 84, 717–723. [Google Scholar] [CrossRef]
  27. Barton, L.; Wan, G.G.Y.; Buck, R.P.; Colmer, T.D. Does N fertiliser regime influence N leaching and quality of different-aged turfgrass (Pennisetum clandestinum) stands? Plant Soil 2009, 316, 81–96. [Google Scholar] [CrossRef]
  28. Feldhake, C.M.; Danielson, R.E.; Butler, J.D. Turfgrass evapotranspiration. I. Factors influencing rate in urban environments. Agron. J. 1983, 75, 824–830. [Google Scholar] [CrossRef]
  29. Erickson, J.E.; Kenworthy, K.E. Nitrogen and light affect water use and water use efficiency of zoysiagrass genotypes differing in canopy structure. HortScience 2011, 46, 643–647. [Google Scholar] [CrossRef]
  30. Sills, M.J.; Carrow, R.N. Turfgrass Growth, N Use, and Water Use under Soil Compaction and N Fertilization 1. Agron. J. 1983, 75, 488–492. [Google Scholar] [CrossRef]
  31. Arkilla, S.; Cevallos, F.; Moss, J.Q.; Yu, S.; Fontanier, C.H.; Martin, D.L.; Wu, Y.; Xiang, M. Responses of turf-type hybrid bermudagrass to drought stress. Inter. Turf. Soc. Res. J. 2025, 1–12. [Google Scholar] [CrossRef]
  32. Reynolds, C.; Elmore, M. Bermudagrass Lawn Management Calendar. Available online: https://agrilifeextension.tamu.edu/wp-content/uploads/2023/08/ESC-042-bermudagrass-lawn-management-calendar.pdf (accessed on 15 July 2024).
  33. Martin, D.L.; Hillock, D. Lawn Management in Oklahoma. Available online: https://extension.okstate.edu/fact-sheets/lawn-management-in-oklahoma.html#:~:text=The%20fertilization%20program%20diagrammed%20in,likely%20to%20enhance%20turf%20quality (accessed on 16 July 2024).
  34. Morris, K.N.; Shearman, R.C. NTEP turfgrass evaluation guidelines. In Proceedings of the NTEP Turfgrass Evaluation Workshop, Beltsville, MD, USA, 17 October 1998; pp. 1–5. Available online: https://www.ntep.org/pdf/ratings.pdf (accessed on 9 October 2023).
  35. Hejl, R.W.; Wherley, B.G.; Thomas, J.C.; White, R.H. Irrigation water quality and trinexapac-ethyl effects on bermudagrass response to deficit irrigation. HortScience 2015, 50, 1081–1087. [Google Scholar] [CrossRef]
  36. Arslan, B.; Buyukangaz, H.; Kumraltekin, E.D.; Yonter, F.; Candogan, B.N.; Kuscu, H.; Bilgili, U. Effects of full and deficit irrigation on the growth and quality of cool-season turfgrasses under subsurface drip irrigation. Sci. Hortic. 2024, 325, 112685. [Google Scholar] [CrossRef]
  37. Bowman, D.C.; Macaulay, L. Comparative evapotranspiration rates of tall fescue cultivars. HortScience 1991, 26, 122–123. [Google Scholar] [CrossRef]
  38. Sinclair, T.R.; Tanner, C.B.; Bennett, J.M. Water-use efficiency in crop production. Bioscience 1984, 34, 36–40. [Google Scholar] [CrossRef]
  39. Snyder, G.H.; Augustin, B.J.; Davidson, J.M. Moisture sensor-controlled irrigation for reducing N leaching in bermudagrass turf. Agron. J. 1984, 76, 964–969. [Google Scholar] [CrossRef]
  40. Bibi, S.; Saifullah; Naeem, A.; Dahlawi, S. Environmental impacts of nitrogen use in agriculture, nitrate leaching and mitigation strategies. In Soil Science: Agricultural and Environmental Prospectives; Springer Nature: Berlin/Heidelberg, Germany, 2016; pp. 131–157. [Google Scholar]
  41. Fertilizing—Lawn Problem Solver—Kansas State University. Available online: https://www.k-state.edu/turf/resources/lawn-problem-solver/maintenance/fertilizing/ (accessed on 15 May 2025).
  42. Gloser, V.; Dvorackova, M.; Mota, D.H.; Petrovic, B.; Gonzalez, P.; Geilfus, C.M. Early changes in nitrate uptake and assimilation under drought in relation to transpiration. Front. Plant Sci. 2020, 11, 602065. [Google Scholar] [CrossRef] [PubMed]
Figure 1. Turfgrass visual quality averaged across both experimental runs as affected by fertilizer treatment. Means with the same letter at each rating date are not significantly different based on Tukey’s HSD at p ≤ 0.05. Visual quality data were collected at trial initiation and weekly thereafter. Solid horizontal line denotes minimum acceptable quality.
Grasses 04 00025 g001
Figure 2. Turfgrass visual quality averaged across both experimental runs, as affected by irrigation level (1.0 × ETa, 0.65 × ETa, and 0.30 × ETa). Visual quality data were collected at trial initiation and weekly thereafter. Means with the same letter at each rating date are not significantly different based on Tukey’s HSD at p ≤ 0.05. Solid horizontal line denotes minimum acceptable quality.
Grasses 04 00025 g002
Figure 3. Turfgrass clipping production averaged across experimental runs as affected by irrigation level (1.0 × ETa, 0.65 × ETa, and 0.30 × ETa). Collection events took place every 7–14 days after trial initiation. Means with the same letter at each collection event are not significantly different based on Tukey’s HSD at p ≤ 0.05.
Grasses 04 00025 g003
Figure 4. Turfgrass clipping production as affected by fertilizer treatment averaged across both runs and all rating dates. Means with the same letter are not significantly different based on Tukey’s HSD at p ≤ 0.05.
Grasses 04 00025 g004
Table 1. Average daily values for relative humidity (%), solar radiation (watts m−2), and photosynthetic active radiation (PAR, µmols m−2 s−1) in both greenhouses during the study period.
Relative Humidity
%
Solar Radiation
watts m−2
PAR
µmols m−2 s−1
Greenhouse 145.880.8160.8
Greenhouse 236.679.7155.1
Table 2. ANOVA table for fertilizer treatment, irrigation level, and measuring date effects on evapotranspiration, visual quality, soil N (ppm), shoot N (%), clipping production, water use efficiency (WUE), and root dry weight.
p Values
EvapotranspirationVisual QualitySoil
N (ppm)
Shoot
N (%)
Clipping
Production
WUERoot
Dry wt.
Fertilizer (F)******NS
Irrigation (I)-*NS*NS-*
Date (D)**--*--
F × I-*NSNSNS-*
F × DNS*--NS--
I × D-*--*--
F × I × D-NS--NS--
Data from all parameters were combined across experimental runs as no main run effect was found. NS or * indicates nonsignificant or significant at p ≤ 0.05, respectively.
Table 3. Turfgrass visual quality as affected by fertilizer treatment and irrigation level averaged across both experimental runs and all rating dates. Means with the same letter are not significantly different based on Tukey’s HSD at p ≤ 0.05.
Fertilizer
Treatment
Irrigation
Level
Visual
Quality
High N rate1.0 × ETa7.8 a
0.65 × ETa7.2 bc
0.30 × ETa 6.6 d
Low N rate1.0 × ETa7.4 b
0.65 × ETa7.0 bc
0.30 × ETa 6.0 de
Unfertilized1.0 × ETa7.1 bc
0.65 × ETa6.2 e
0.30 × ETa 5.9 e
Table 4. Water use efficiency (WUE) as affected by fertilizer treatment and averaged across both experimental runs and all rating dates. Means with the same letter are not significantly different based on Tukey’s HSD at p ≤ 0.05.
Fertilizer TreatmentWUE (mg mL−1)
High N rate0.80 a
Low N rate0.65 b
Unfertilized0.49 c
Table 5. Soil nitrate-N (ppm) and shoot total-n (%) averaged across both experimental runs as affected by fertilizer treatment and irrigation level. Means with the same letter within each parameter are not significantly different based on Tukey’s HSD at p ≤ 0.05.
Fertilizer TreatmentSoil Nitrate-N (ppm)Shoot Total-N (%)
High N rate1.30 a1.51 a
Low N rate0.48 b1.24 b
Unfertilized0.37 b0.85 c
Irrigation LevelSoil Nitrate-N (ppm)Shoot Total-N (%)
1.0 × ETa0.65 a1.31 a
0.65 × ETa0.82 a1.17 b
0.30 × ETa 0.72 a1.13 b
Table 6. Root dry weight averaged across both experimental runs as affected by irrigation level. Means with the same letter are not significantly different based on Tukey’s HSD at p ≤ 0.05.
Irrigation LevelRoot Dry Weight (g)
1.0 × ETa2.31 ab
0.65 × ETa2.45 a
0.30 × ETa 2.16 b
Disclaimer/Publisher’s Note: The statements, opinions and data contained in all publications are solely those of the individual author(s) and contributor(s) and not of MDPI and/or the editor(s). MDPI and/or the editor(s) disclaim responsibility for any injury to people or property resulting from any ideas, methods, instructions or products referred to in the content.

